

老渔夫
2.6k Posts

老渔夫
Report
Block User
大宗商品与宏观老兵闲聊
0 Following
280 Followers
858 Liked
Posts
·
--
Partly True
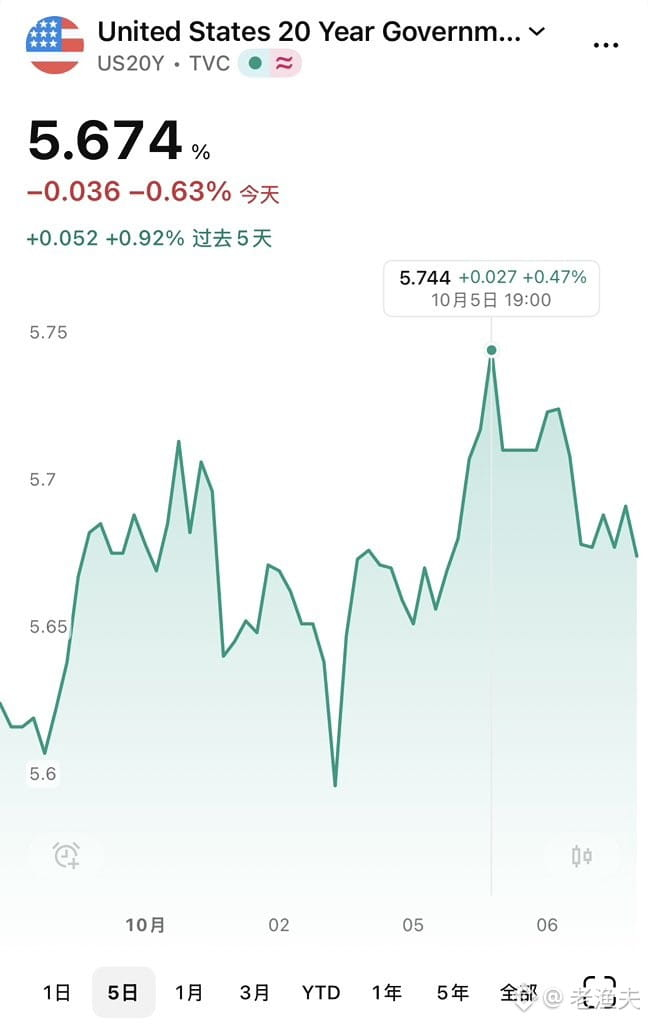
The 10-year U.S. Treasury yield has broken above 5.7%. At this pace, 6% is only a matter of time.
Honestly, this rise has been pretty sharp, but looking back, it’s not exactly surprising. The Fed’s hawkish remarks haven’t been fully priced in yet, the fiscal deficit is still there, and supply pressure has been persistent. Expectations for rate cuts have been pushed back again and again. With real yields this high, of course money is flowing into bonds.
Historically, the move from 5.7% to 6% has often happened faster than people expect. We saw similar accelerations before the dot-com bubble burst in 2000 and during the run-up to the subprime crisis in 2007. Things aren’t exactly the same now, of course, but with the yield curve this steep and the term premium rising, it’s clear the market still has concerns about long-term inflation and fiscal sustainability.
For commodities, a high-rate environment is generally unfavorable: carrying costs rise, and assets with a financial component come under pressure. But if inflation expectations really start to pick up, energy and metals could rebound on supply-side issues. As I always say, it’s about the structure and the timing.
6% isn’t a ceiling, but once yields reach that level, the seesaw effect between stocks and bonds will become more pronounced, and asset allocation strategies will need to be recalculated.
The 10-year U.S. Treasury yield has broken above 5.7%. At this pace, 6% is only a matter of time.
Honestly, this rise has been pretty sharp, but looking back, it’s not exactly surprising. The Fed’s hawkish remarks haven’t been fully priced in yet, the fiscal deficit is still there, and supply pressure has been persistent. Expectations for rate cuts have been pushed back again and again. With real yields this high, of course money is flowing into bonds.
Historically, the move from 5.7% to 6% has often happened faster than people expect. We saw similar accelerations before the dot-com bubble burst in 2000 and during the run-up to the subprime crisis in 2007. Things aren’t exactly the same now, of course, but with the yield curve this steep and the term premium rising, it’s clear the market still has concerns about long-term inflation and fiscal sustainability.
For commodities, a high-rate environment is generally unfavorable: carrying costs rise, and assets with a financial component come under pressure. But if inflation expectations really start to pick up, energy and metals could rebound on supply-side issues. As I always say, it’s about the structure and the timing.
6% isn’t a ceiling, but once yields reach that level, the seesaw effect between stocks and bonds will become more pronounced, and asset allocation strategies will need to be recalculated.
Honestly, this rise has been pretty sharp, but looking back, it’s not exactly surprising. The Fed’s hawkish remarks haven’t been fully priced in yet, the fiscal deficit is still there, and supply pressure has been persistent. Expectations for rate cuts have been pushed back again and again. With real yields this high, of course money is flowing into bonds.
Historically, the move from 5.7% to 6% has often happened faster than people expect. We saw similar accelerations before the dot-com bubble burst in 2000 and during the run-up to the subprime crisis in 2007. Things aren’t exactly the same now, of course, but with the yield curve this steep and the term premium rising, it’s clear the market still has concerns about long-term inflation and fiscal sustainability.
For commodities, a high-rate environment is generally unfavorable: carrying costs rise, and assets with a financial component come under pressure. But if inflation expectations really start to pick up, energy and metals could rebound on supply-side issues. As I always say, it’s about the structure and the timing.
6% isn’t a ceiling, but once yields reach that level, the seesaw effect between stocks and bonds will become more pronounced, and asset allocation strategies will need to be recalculated.
IEFETF+0.04%
289
·
--
Verified
During the eurozone debt crisis more than a decade ago, markets dubbed the southern European countries the “PIIGS”—Portugal, Italy, Ireland, Greece and Spain. Greece was hit hardest at the time, with 10-year government bond yields briefly surging above 30%—basically, the market sentencing it to death.
And now? France’s 10-year government bond yield has surpassed Greece’s. Yes, you read that right—the once-notorious “PIIGS” member Greece can now borrow more cheaply than France.
What does this tell us? Cycles turn, but more importantly, fiscal discipline, structural reform and political stability matter more in the long run than short-term crisis management. Back then, Greece was forced by the Troika (the ECB, IMF and EU) to cut its deficit, reform pensions and sell state-owned assets. It was painful, but it worked. France, meanwhile, has seen fiscal expansion, bigger welfare spending and stalled reforms since a left-wing government took office. Its deficit has been persistently over the limit, while its debt-to-GDP ratio has risen from 90% to over 110%.
Markets aren’t stupid. If you borrow and don’t repay, let your public finances spiral out of control and get bogged down in political infighting, bond yields will naturally rise. France’s problem now isn’t a lack of money—it’s a lack of credibility. Investors are starting to doubt its willingness and ability to repay its debts.
The lesson of history: crises themselves aren’t what’s frightening; what’s frightening is failing to reform after a crisis and continuing to live beyond your means. During the eurozone debt crisis, many thought Greece would leave the euro, default and collapse completely. Instead, Greece gritted its teeth and made reforms, while France is living off past successes.
Cycles really do come back to haunt you.
During the eurozone debt crisis more than a decade ago, markets dubbed the southern European countries the “PIIGS”—Portugal, Italy, Ireland, Greece and Spain. Greece was hit hardest at the time, with 10-year government bond yields briefly surging above 30%—basically, the market sentencing it to death.
And now? France’s 10-year government bond yield has surpassed Greece’s. Yes, you read that right—the once-notorious “PIIGS” member Greece can now borrow more cheaply than France.
What does this tell us? Cycles turn, but more importantly, fiscal discipline, structural reform and political stability matter more in the long run than short-term crisis management. Back then, Greece was forced by the Troika (the ECB, IMF and EU) to cut its deficit, reform pensions and sell state-owned assets. It was painful, but it worked. France, meanwhile, has seen fiscal expansion, bigger welfare spending and stalled reforms since a left-wing government took office. Its deficit has been persistently over the limit, while its debt-to-GDP ratio has risen from 90% to over 110%.
Markets aren’t stupid. If you borrow and don’t repay, let your public finances spiral out of control and get bogged down in political infighting, bond yields will naturally rise. France’s problem now isn’t a lack of money—it’s a lack of credibility. Investors are starting to doubt its willingness and ability to repay its debts.
The lesson of history: crises themselves aren’t what’s frightening; what’s frightening is failing to reform after a crisis and continuing to live beyond your means. During the eurozone debt crisis, many thought Greece would leave the euro, default and collapse completely. Instead, Greece gritted its teeth and made reforms, while France is living off past successes.
Cycles really do come back to haunt you.
And now? France’s 10-year government bond yield has surpassed Greece’s. Yes, you read that right—the once-notorious “PIIGS” member Greece can now borrow more cheaply than France.
What does this tell us? Cycles turn, but more importantly, fiscal discipline, structural reform and political stability matter more in the long run than short-term crisis management. Back then, Greece was forced by the Troika (the ECB, IMF and EU) to cut its deficit, reform pensions and sell state-owned assets. It was painful, but it worked. France, meanwhile, has seen fiscal expansion, bigger welfare spending and stalled reforms since a left-wing government took office. Its deficit has been persistently over the limit, while its debt-to-GDP ratio has risen from 90% to over 110%.
Markets aren’t stupid. If you borrow and don’t repay, let your public finances spiral out of control and get bogged down in political infighting, bond yields will naturally rise. France’s problem now isn’t a lack of money—it’s a lack of credibility. Investors are starting to doubt its willingness and ability to repay its debts.
The lesson of history: crises themselves aren’t what’s frightening; what’s frightening is failing to reform after a crisis and continuing to live beyond your means. During the eurozone debt crisis, many thought Greece would leave the euro, default and collapse completely. Instead, Greece gritted its teeth and made reforms, while France is living off past successes.
Cycles really do come back to haunt you.
3.3k
·
--
Verified
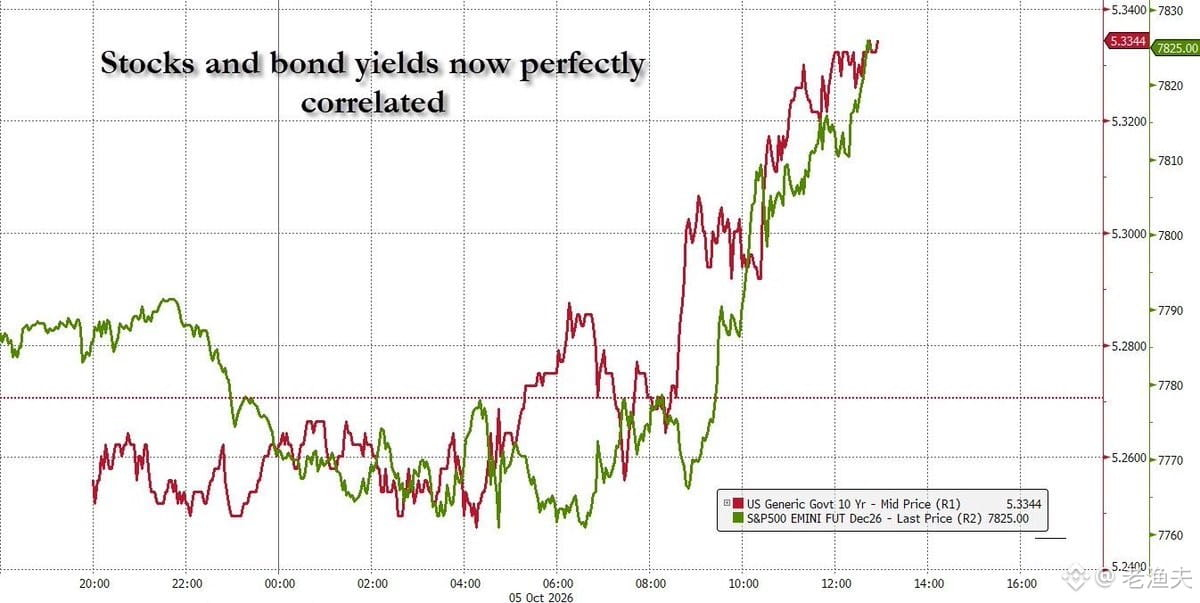
Recently, U.S. stocks and Treasury yields have actually been moving in sync, which is quite unusual. Normally, stocks and bonds should be negatively correlated: when stocks fall, investors seek safety in bonds, pushing bond prices up and yields down. But if stocks fall and bond yields fall too, what is the market pricing in? It could be recession fears or a liquidity crunch, with investors selling both stocks and bonds for cash.
Your proposed 7% ceiling for bond yields makes sense. Historically, when the 10-year Treasury yield has exceeded 7%, borrowing costs for governments and businesses have indeed become prohibitively high. We saw levels like that in the early 1980s, when Volcker was fighting inflation, but that was an extreme situation. Given the size of U.S. government debt today, if yields really hit 7%, interest payments alone could consume most government revenue—essentially the start of a debt spiral.
But that doesn’t mean there’s a corresponding “ceiling” for U.S. stocks. The valuation anchor for equities is the risk-free rate plus a risk premium. If bond yields soar to 7%, the discount rate for stocks will rise too, putting severe pressure on valuations. But stocks are fundamentally discounted cash flows from corporate earnings, so as long as companies can still make money, there is no absolute ceiling in theory; valuations will simply be repriced to reflect the interest-rate environment.
The issue now is that if stock and bond yields continue to move together, it suggests the market is worried about something deeper—perhaps fiscal sustainability, a liquidity drain, or waning confidence in Federal Reserve policy. In such circumstances, traditional asset-allocation logic breaks down, and cash is king becomes the safest choice. This hasn’t happened often historically, but whenever it has, it has been accompanied by major systemic adjustments.
Recently, U.S. stocks and Treasury yields have actually been moving in sync, which is quite unusual. Normally, stocks and bonds should be negatively correlated: when stocks fall, investors seek safety in bonds, pushing bond prices up and yields down. But if stocks fall and bond yields fall too, what is the market pricing in? It could be recession fears or a liquidity crunch, with investors selling both stocks and bonds for cash.
Your proposed 7% ceiling for bond yields makes sense. Historically, when the 10-year Treasury yield has exceeded 7%, borrowing costs for governments and businesses have indeed become prohibitively high. We saw levels like that in the early 1980s, when Volcker was fighting inflation, but that was an extreme situation. Given the size of U.S. government debt today, if yields really hit 7%, interest payments alone could consume most government revenue—essentially the start of a debt spiral.
But that doesn’t mean there’s a corresponding “ceiling” for U.S. stocks. The valuation anchor for equities is the risk-free rate plus a risk premium. If bond yields soar to 7%, the discount rate for stocks will rise too, putting severe pressure on valuations. But stocks are fundamentally discounted cash flows from corporate earnings, so as long as companies can still make money, there is no absolute ceiling in theory; valuations will simply be repriced to reflect the interest-rate environment.
The issue now is that if stock and bond yields continue to move together, it suggests the market is worried about something deeper—perhaps fiscal sustainability, a liquidity drain, or waning confidence in Federal Reserve policy. In such circumstances, traditional asset-allocation logic breaks down, and cash is king becomes the safest choice. This hasn’t happened often historically, but whenever it has, it has been accompanied by major systemic adjustments.
Your proposed 7% ceiling for bond yields makes sense. Historically, when the 10-year Treasury yield has exceeded 7%, borrowing costs for governments and businesses have indeed become prohibitively high. We saw levels like that in the early 1980s, when Volcker was fighting inflation, but that was an extreme situation. Given the size of U.S. government debt today, if yields really hit 7%, interest payments alone could consume most government revenue—essentially the start of a debt spiral.
But that doesn’t mean there’s a corresponding “ceiling” for U.S. stocks. The valuation anchor for equities is the risk-free rate plus a risk premium. If bond yields soar to 7%, the discount rate for stocks will rise too, putting severe pressure on valuations. But stocks are fundamentally discounted cash flows from corporate earnings, so as long as companies can still make money, there is no absolute ceiling in theory; valuations will simply be repriced to reflect the interest-rate environment.
The issue now is that if stock and bond yields continue to move together, it suggests the market is worried about something deeper—perhaps fiscal sustainability, a liquidity drain, or waning confidence in Federal Reserve policy. In such circumstances, traditional asset-allocation logic breaks down, and cash is king becomes the safest choice. This hasn’t happened often historically, but whenever it has, it has been accompanied by major systemic adjustments.
IEFETF+0.04%
SPYB+0.58%
2
2.4k
·
--
Partly True
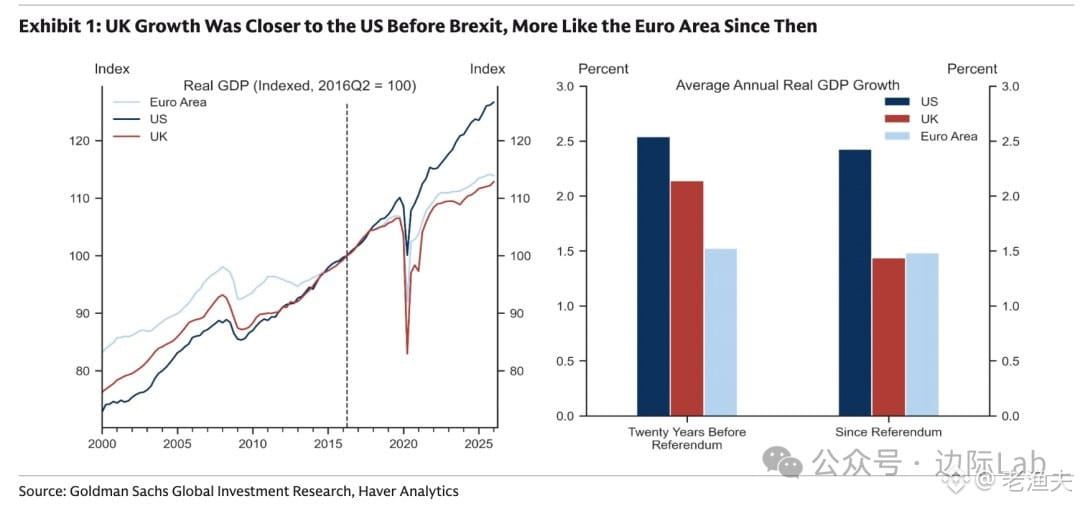
Goldman Sachs’ latest data is pretty interesting — in the eight years since Brexit, the UK’s economic growth rate has gone from roughly matching the US over the previous two decades (an average of 2.1% a year) to the eurozone level (1.4%).
The UK’s growth advantage over mainland Europe has basically disappeared. This is a pretty classic example of a policy shock: trade friction, disrupted capital flows, supply chain restructuring… all of which ultimately show up in the economy’s long-term growth potential.
I remember that around the 2016 referendum, a lot of people thought “the UK would be more nimble after Brexit.” Looking at it now, institutional costs and trade barriers have proved more tangible than people expected. The pound took quite a beating back then, too. The exchange rate is relatively stable now, but the damage to the economic structure has already been done.
For those working in currency converters or cross-border payments, the UK market has been pretty nuanced in recent years — fluctuations in the euro exchange rate, companies moving abroad, changes in capital flows… all of these have a real impact on demand for money transfers.
In the long run, the UK will probably need to focus on areas like fintech and green energy to find new sources of growth. But in the short term, 1.4% growth may be the new normal.
Goldman Sachs’ latest data is pretty interesting — in the eight years since Brexit, the UK’s economic growth rate has gone from roughly matching the US over the previous two decades (an average of 2.1% a year) to the eurozone level (1.4%).
The UK’s growth advantage over mainland Europe has basically disappeared. This is a pretty classic example of a policy shock: trade friction, disrupted capital flows, supply chain restructuring… all of which ultimately show up in the economy’s long-term growth potential.
I remember that around the 2016 referendum, a lot of people thought “the UK would be more nimble after Brexit.” Looking at it now, institutional costs and trade barriers have proved more tangible than people expected. The pound took quite a beating back then, too. The exchange rate is relatively stable now, but the damage to the economic structure has already been done.
For those working in currency converters or cross-border payments, the UK market has been pretty nuanced in recent years — fluctuations in the euro exchange rate, companies moving abroad, changes in capital flows… all of these have a real impact on demand for money transfers.
In the long run, the UK will probably need to focus on areas like fintech and green energy to find new sources of growth. But in the short term, 1.4% growth may be the new normal.
The UK’s growth advantage over mainland Europe has basically disappeared. This is a pretty classic example of a policy shock: trade friction, disrupted capital flows, supply chain restructuring… all of which ultimately show up in the economy’s long-term growth potential.
I remember that around the 2016 referendum, a lot of people thought “the UK would be more nimble after Brexit.” Looking at it now, institutional costs and trade barriers have proved more tangible than people expected. The pound took quite a beating back then, too. The exchange rate is relatively stable now, but the damage to the economic structure has already been done.
For those working in currency converters or cross-border payments, the UK market has been pretty nuanced in recent years — fluctuations in the euro exchange rate, companies moving abroad, changes in capital flows… all of these have a real impact on demand for money transfers.
In the long run, the UK will probably need to focus on areas like fintech and green energy to find new sources of growth. But in the short term, 1.4% growth may be the new normal.
1
1.5k
·
--
Seeing the data organized by JPMorgan, the four cloud giants—Microsoft, Oracle, Google, and Amazon—now have accumulated outstanding orders worth $2.1 trillion. Even more interestingly, the compute capacity procurement commitments from the two AI labs, OpenAI and Anthropic, account for almost $1 trillion—close to half.
This structure tells the story well: the rate and scale at which cutting-edge AI labs are burning money have reached a level that can support roughly half of cloud providers’ business. From a capital allocation perspective, this is a classic cyclical bet—betting on whether the AGI narrative can deliver commercial value in the coming years.
Historically, there have been many similar cases: fiber network buildouts in the late 1990s, telecom equipment procurement in the early 2000s, and shale-oil capital expenditures in the 2010s. Each time involves massive upfront investment, with the bet that future demand will be able to absorb the capacity. Some turned out well; others left behind excess capacity and bad debts.
In essence, this $1 trillion in compute orders is about locking in cash flows from the next few years in advance. For cloud providers, it means stable revenue expectations. For AI labs, it creates the pressure to get their business model to work. Whoever is first to roll out large-scale, real-world applications can absorb these costs; those who can’t, face a classic case of capital misallocation.
From the macro cycle perspective, this concentration of capex is high (the two labs account for half), and the risk isn’t small. If the speed of AI monetization falls short of expectations, or if financing issues arise for one of the labs, the entire chain’s cash flow and valuation logic will be reassessed. This isn’t a technical problem—it’s a matter of the capital cycle and liquidity management.
As the old saying goes: order backlogs are a good thing—provided customers can keep paying. In this game, the one who can first turn AI applications into real cash wins.
Seeing the data organized by JPMorgan, the four cloud giants—Microsoft, Oracle, Google, and Amazon—now have accumulated outstanding orders worth $2.1 trillion. Even more interestingly, the compute capacity procurement commitments from the two AI labs, OpenAI and Anthropic, account for almost $1 trillion—close to half.
This structure tells the story well: the rate and scale at which cutting-edge AI labs are burning money have reached a level that can support roughly half of cloud providers’ business. From a capital allocation perspective, this is a classic cyclical bet—betting on whether the AGI narrative can deliver commercial value in the coming years.
Historically, there have been many similar cases: fiber network buildouts in the late 1990s, telecom equipment procurement in the early 2000s, and shale-oil capital expenditures in the 2010s. Each time involves massive upfront investment, with the bet that future demand will be able to absorb the capacity. Some turned out well; others left behind excess capacity and bad debts.
In essence, this $1 trillion in compute orders is about locking in cash flows from the next few years in advance. For cloud providers, it means stable revenue expectations. For AI labs, it creates the pressure to get their business model to work. Whoever is first to roll out large-scale, real-world applications can absorb these costs; those who can’t, face a classic case of capital misallocation.
From the macro cycle perspective, this concentration of capex is high (the two labs account for half), and the risk isn’t small. If the speed of AI monetization falls short of expectations, or if financing issues arise for one of the labs, the entire chain’s cash flow and valuation logic will be reassessed. This isn’t a technical problem—it’s a matter of the capital cycle and liquidity management.
As the old saying goes: order backlogs are a good thing—provided customers can keep paying. In this game, the one who can first turn AI applications into real cash wins.
This structure tells the story well: the rate and scale at which cutting-edge AI labs are burning money have reached a level that can support roughly half of cloud providers’ business. From a capital allocation perspective, this is a classic cyclical bet—betting on whether the AGI narrative can deliver commercial value in the coming years.
Historically, there have been many similar cases: fiber network buildouts in the late 1990s, telecom equipment procurement in the early 2000s, and shale-oil capital expenditures in the 2010s. Each time involves massive upfront investment, with the bet that future demand will be able to absorb the capacity. Some turned out well; others left behind excess capacity and bad debts.
In essence, this $1 trillion in compute orders is about locking in cash flows from the next few years in advance. For cloud providers, it means stable revenue expectations. For AI labs, it creates the pressure to get their business model to work. Whoever is first to roll out large-scale, real-world applications can absorb these costs; those who can’t, face a classic case of capital misallocation.
From the macro cycle perspective, this concentration of capex is high (the two labs account for half), and the risk isn’t small. If the speed of AI monetization falls short of expectations, or if financing issues arise for one of the labs, the entire chain’s cash flow and valuation logic will be reassessed. This isn’t a technical problem—it’s a matter of the capital cycle and liquidity management.
As the old saying goes: order backlogs are a good thing—provided customers can keep paying. In this game, the one who can first turn AI applications into real cash wins.
214
·
--
Partly True
The crude oil export volume from the Strait of Hormuz has actually returned to pre-war levels, but the oil price is still stuck above $100. Many people don’t understand why.
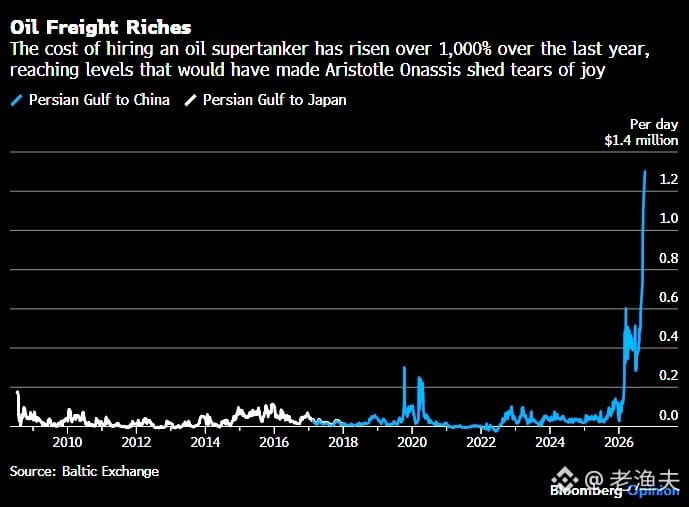
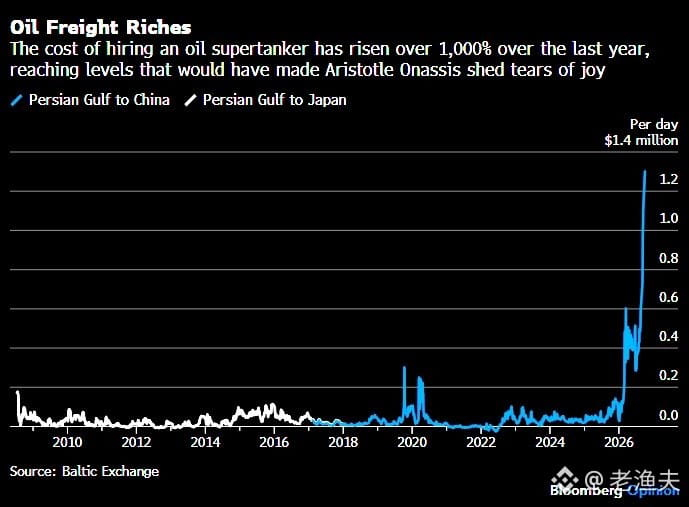
The answer is simple: shipping costs have exploded. Before the war, a single oil tanker making a run from the Persian Gulf would cost about $50,000 in charter rates. Now? $1.1 million. 22 times.
This is a typical example of “supply-chain cost pass-through”—crude production is fine, but the cost of transporting it to refineries has skyrocketed, and that ultimately shows up in the oil price. Premiums for insurance and war risk, costs from detours, and shipowners’ tight chartering decisions all stack up.
Something similar happened after the 2022 Russia–Ukraine conflict: the Black Sea Grain Corridor closed. Grain export volumes recovered afterward, but freight rates and insurance costs kept the landed price high. The market doesn’t just look at “production”; it also looks at “the landed cost.”
So today’s oil price isn’t really an OPEC production-cut problem—it’s a logistics bottleneck problem. With this kind of structural cost increase, it’s hard to reverse in the short term.
The crude oil export volume from the Strait of Hormuz has actually returned to pre-war levels, but the oil price is still stuck above $100. Many people don’t understand why.
The answer is simple: shipping costs have exploded. Before the war, a single oil tanker making a run from the Persian Gulf would cost about $50,000 in charter rates. Now? $1.1 million. 22 times.
This is a typical example of “supply-chain cost pass-through”—crude production is fine, but the cost of transporting it to refineries has skyrocketed, and that ultimately shows up in the oil price. Premiums for insurance and war risk, costs from detours, and shipowners’ tight chartering decisions all stack up.
Something similar happened after the 2022 Russia–Ukraine conflict: the Black Sea Grain Corridor closed. Grain export volumes recovered afterward, but freight rates and insurance costs kept the landed price high. The market doesn’t just look at “production”; it also looks at “the landed cost.”
So today’s oil price isn’t really an OPEC production-cut problem—it’s a logistics bottleneck problem. With this kind of structural cost increase, it’s hard to reverse in the short term.
The answer is simple: shipping costs have exploded. Before the war, a single oil tanker making a run from the Persian Gulf would cost about $50,000 in charter rates. Now? $1.1 million. 22 times.
This is a typical example of “supply-chain cost pass-through”—crude production is fine, but the cost of transporting it to refineries has skyrocketed, and that ultimately shows up in the oil price. Premiums for insurance and war risk, costs from detours, and shipowners’ tight chartering decisions all stack up.
Something similar happened after the 2022 Russia–Ukraine conflict: the Black Sea Grain Corridor closed. Grain export volumes recovered afterward, but freight rates and insurance costs kept the landed price high. The market doesn’t just look at “production”; it also looks at “the landed cost.”
So today’s oil price isn’t really an OPEC production-cut problem—it’s a logistics bottleneck problem. With this kind of structural cost increase, it’s hard to reverse in the short term.
4
6.1k
·
--
Partly True
The crude oil export volume through the Strait of Hormuz has indeed returned to pre-war levels, but oil prices are still hovering above a hundred. Many people don’t understand why, even though supply has recovered, prices won’t come down.
The answer isn’t on the supply side—it’s in transportation costs. Now, tanker freight rates have surged to more than ten times their previous level, and they’re still climbing. This means that even if crude oil leaves the production regions, the cost of moving it to end markets increases substantially, and that higher cost ultimately shows up in oil prices.
This is a typical case of “supply-chain bottleneck pricing”—it’s not about whether it can be produced, but whether it can be moved, or whether it’s too expensive to move. Insurance premiums, rerouting costs, vessel shortages, and geopolitical risk premiums all stack into the freight charges.
Historically, this has happened often. After the Asian financial crisis in the late 1990s, oil prices also stayed high for a time due to tight capacity and skyrocketing insurance costs, even though OPEC production was sufficient. When oil prices surged to $147 in 2008, transportation costs and financial speculation also played a major role.
So when looking at oil prices, you can’t focus only on output and inventories—you also need to examine the cost structure of the entire logistics chain. As long as transportation costs don’t come down, it will be difficult for oil prices to truly fall.
The crude oil export volume through the Strait of Hormuz has indeed returned to pre-war levels, but oil prices are still hovering above a hundred. Many people don’t understand why, even though supply has recovered, prices won’t come down.
The answer isn’t on the supply side—it’s in transportation costs. Now, tanker freight rates have surged to more than ten times their previous level, and they’re still climbing. This means that even if crude oil leaves the production regions, the cost of moving it to end markets increases substantially, and that higher cost ultimately shows up in oil prices.
This is a typical case of “supply-chain bottleneck pricing”—it’s not about whether it can be produced, but whether it can be moved, or whether it’s too expensive to move. Insurance premiums, rerouting costs, vessel shortages, and geopolitical risk premiums all stack into the freight charges.
Historically, this has happened often. After the Asian financial crisis in the late 1990s, oil prices also stayed high for a time due to tight capacity and skyrocketing insurance costs, even though OPEC production was sufficient. When oil prices surged to $147 in 2008, transportation costs and financial speculation also played a major role.
So when looking at oil prices, you can’t focus only on output and inventories—you also need to examine the cost structure of the entire logistics chain. As long as transportation costs don’t come down, it will be difficult for oil prices to truly fall.
The answer isn’t on the supply side—it’s in transportation costs. Now, tanker freight rates have surged to more than ten times their previous level, and they’re still climbing. This means that even if crude oil leaves the production regions, the cost of moving it to end markets increases substantially, and that higher cost ultimately shows up in oil prices.
This is a typical case of “supply-chain bottleneck pricing”—it’s not about whether it can be produced, but whether it can be moved, or whether it’s too expensive to move. Insurance premiums, rerouting costs, vessel shortages, and geopolitical risk premiums all stack into the freight charges.
Historically, this has happened often. After the Asian financial crisis in the late 1990s, oil prices also stayed high for a time due to tight capacity and skyrocketing insurance costs, even though OPEC production was sufficient. When oil prices surged to $147 in 2008, transportation costs and financial speculation also played a major role.
So when looking at oil prices, you can’t focus only on output and inventories—you also need to examine the cost structure of the entire logistics chain. As long as transportation costs don’t come down, it will be difficult for oil prices to truly fall.
1
2
2.7k
·
--
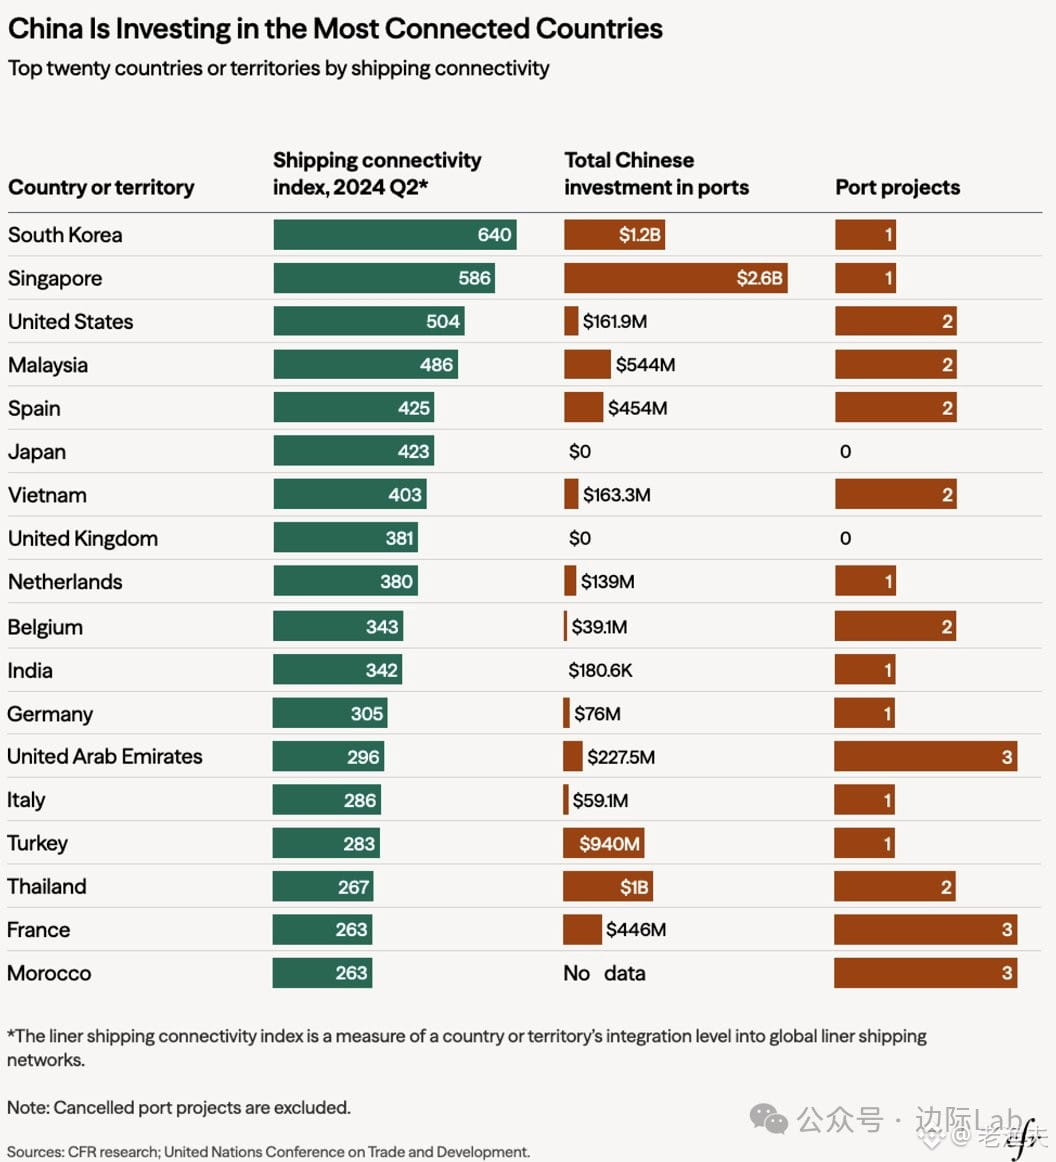
China’s port investment strategy is actually quite clear—target countries among the top 20 in the Global Shipping Connectivity Index, and according to CFR data, by Q2 2024, 15 of those 20 have already received investments.
This isn’t anything new; over the past decade or more, we’ve seen countless similar layouts: from Piraeus in Greece to Gwadar in Pakistan, from Hambantota in Sri Lanka to Trieste in Italy. On the surface it looks like business investment, but in reality it’s a flag planted on the global trade arteries.
Seasoned traders all understand one key truth: controlling liquidity nodes is more valuable than owning the cargo itself. Ports are liquidity nodes for global trade—whoever controls these choke points holds the leverage in geopolitical contests and supply-chain restructuring.
Now the US and Europe are starting to take notice, but the game is already on the board. In the coming years, competition for this kind of infrastructure will only intensify, not ease. commodity flows, currency flows, capital flows—none of them can bypass these ports.
This is the real-world map of great-power competition—no conspiracy theories here, just geopolitics that’s openly on the table, i.e., transparent economic geography.
China’s port investment strategy is actually quite clear—target countries among the top 20 in the Global Shipping Connectivity Index, and according to CFR data, by Q2 2024, 15 of those 20 have already received investments.
This isn’t anything new; over the past decade or more, we’ve seen countless similar layouts: from Piraeus in Greece to Gwadar in Pakistan, from Hambantota in Sri Lanka to Trieste in Italy. On the surface it looks like business investment, but in reality it’s a flag planted on the global trade arteries.
Seasoned traders all understand one key truth: controlling liquidity nodes is more valuable than owning the cargo itself. Ports are liquidity nodes for global trade—whoever controls these choke points holds the leverage in geopolitical contests and supply-chain restructuring.
Now the US and Europe are starting to take notice, but the game is already on the board. In the coming years, competition for this kind of infrastructure will only intensify, not ease. commodity flows, currency flows, capital flows—none of them can bypass these ports.
This is the real-world map of great-power competition—no conspiracy theories here, just geopolitics that’s openly on the table, i.e., transparent economic geography.
This isn’t anything new; over the past decade or more, we’ve seen countless similar layouts: from Piraeus in Greece to Gwadar in Pakistan, from Hambantota in Sri Lanka to Trieste in Italy. On the surface it looks like business investment, but in reality it’s a flag planted on the global trade arteries.
Seasoned traders all understand one key truth: controlling liquidity nodes is more valuable than owning the cargo itself. Ports are liquidity nodes for global trade—whoever controls these choke points holds the leverage in geopolitical contests and supply-chain restructuring.
Now the US and Europe are starting to take notice, but the game is already on the board. In the coming years, competition for this kind of infrastructure will only intensify, not ease. commodity flows, currency flows, capital flows—none of them can bypass these ports.
This is the real-world map of great-power competition—no conspiracy theories here, just geopolitics that’s openly on the table, i.e., transparent economic geography.
50
·
--
Verified
In an article published in Qiushi, Minister of Finance Lan Fuan laid out a rather key direction for a tax-system adjustment:
The collection point for the consumption tax should be moved further downstream and gradually delegated to local governments. The article also mentioned reforms to local surcharges on taxes.
This is, in fact, an old topic, but raised at this particular point in time, the signal is quite clear.
What does moving the consumption tax mean? Simply put, it means shifting collection from the production stage to the retail or wholesale stage. Whoever sells to consumers collects and remits the tax in the jurisdiction where the seller is located. In this way, the tax revenue stays where consumption occurs.
For local governments, this is a concrete adjustment to a source of fiscal revenue. The old model relying on land-based financing can’t go on. Now they need to find new pillars of income. Delegating the consumption tax gives localities a relatively stable tax base.
But the issue is also here: cities with stronger consumption will benefit more, while areas with weaker consumer spending may find it harder. Regional divergence could intensify.
From a macro perspective, this is about reshaping the fiscal relationship between the central government and local governments. After the decline of land-financing, how do localities sustain themselves? Consumption taxes, property taxes, and revenue from the digital economy—these are all directions under discussion.
If this round of reform is implemented, for industries covered by consumption taxes such as retail, alcoholic beverages, luxury goods, and automobiles, the approach to tax administration and local policies will change. It’s worth keeping an eye on the subsequent detailed rules.
In an article published in Qiushi, Minister of Finance Lan Fuan laid out a rather key direction for a tax-system adjustment:
The collection point for the consumption tax should be moved further downstream and gradually delegated to local governments. The article also mentioned reforms to local surcharges on taxes.
This is, in fact, an old topic, but raised at this particular point in time, the signal is quite clear.
What does moving the consumption tax mean? Simply put, it means shifting collection from the production stage to the retail or wholesale stage. Whoever sells to consumers collects and remits the tax in the jurisdiction where the seller is located. In this way, the tax revenue stays where consumption occurs.
For local governments, this is a concrete adjustment to a source of fiscal revenue. The old model relying on land-based financing can’t go on. Now they need to find new pillars of income. Delegating the consumption tax gives localities a relatively stable tax base.
But the issue is also here: cities with stronger consumption will benefit more, while areas with weaker consumer spending may find it harder. Regional divergence could intensify.
From a macro perspective, this is about reshaping the fiscal relationship between the central government and local governments. After the decline of land-financing, how do localities sustain themselves? Consumption taxes, property taxes, and revenue from the digital economy—these are all directions under discussion.
If this round of reform is implemented, for industries covered by consumption taxes such as retail, alcoholic beverages, luxury goods, and automobiles, the approach to tax administration and local policies will change. It’s worth keeping an eye on the subsequent detailed rules.
The collection point for the consumption tax should be moved further downstream and gradually delegated to local governments. The article also mentioned reforms to local surcharges on taxes.
This is, in fact, an old topic, but raised at this particular point in time, the signal is quite clear.
What does moving the consumption tax mean? Simply put, it means shifting collection from the production stage to the retail or wholesale stage. Whoever sells to consumers collects and remits the tax in the jurisdiction where the seller is located. In this way, the tax revenue stays where consumption occurs.
For local governments, this is a concrete adjustment to a source of fiscal revenue. The old model relying on land-based financing can’t go on. Now they need to find new pillars of income. Delegating the consumption tax gives localities a relatively stable tax base.
But the issue is also here: cities with stronger consumption will benefit more, while areas with weaker consumer spending may find it harder. Regional divergence could intensify.
From a macro perspective, this is about reshaping the fiscal relationship between the central government and local governments. After the decline of land-financing, how do localities sustain themselves? Consumption taxes, property taxes, and revenue from the digital economy—these are all directions under discussion.
If this round of reform is implemented, for industries covered by consumption taxes such as retail, alcoholic beverages, luxury goods, and automobiles, the approach to tax administration and local policies will change. It’s worth keeping an eye on the subsequent detailed rules.

1
3
2
6.3k
·
--
Verified
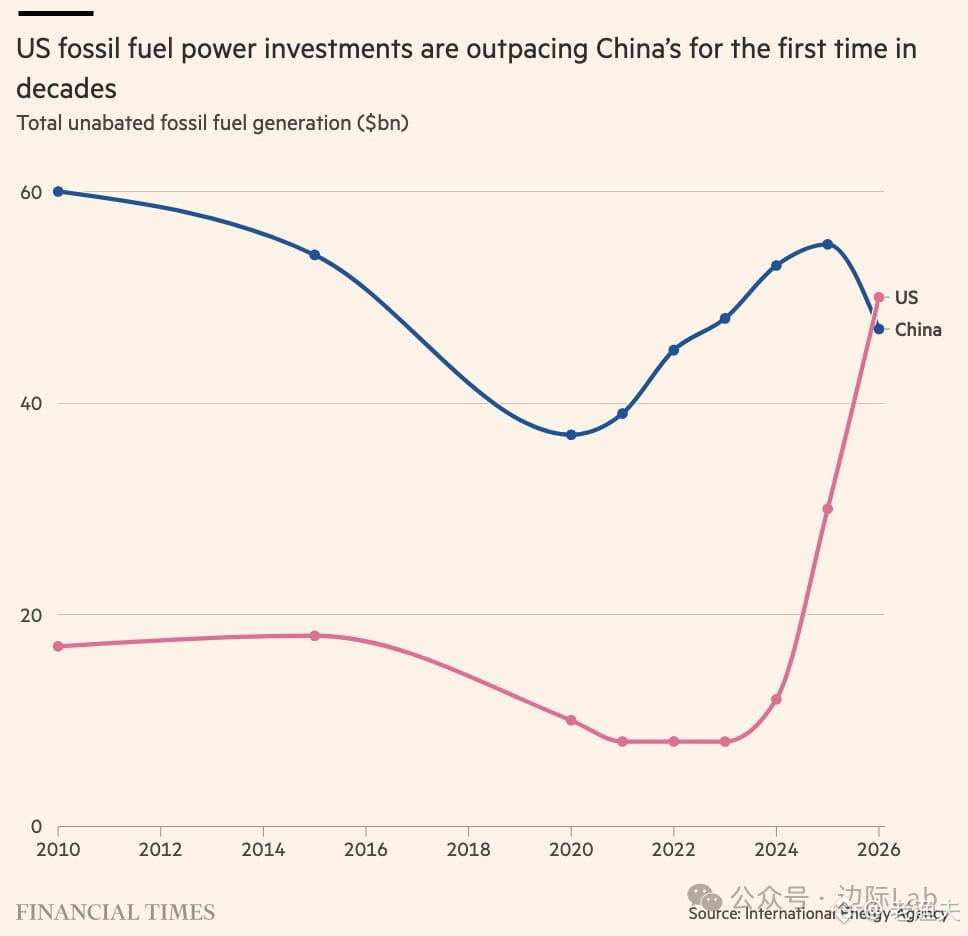
According to IEA data, U.S. fossil-fuel power generation investment will reach $50 billion in 2026, for the first time in decades exceeding China ($47 billion). Behind this reversal is AI-driven data center power demand—gas turbine orders surged to 20 GW in Q1 alone, with Siemens and GE Vernova orders piling up.
This turning point is quite interesting. Over the past decade, China has been sprinting on energy infrastructure buildout, but the U.S. suddenly finds itself short on electricity due to the compute race. Training a large AI model consumes power comparable to that of a small city, and data center expansion is far faster than grid planning. The result? In the short term, it can only rely on natural gas generation to fill the gap, while renewable energy construction cycles can’t keep up.
From a cycle perspective, this investment peak could last 3–5 years. Natural gas equipment manufacturers benefit clearly in the short term, but in the long run this is a transitional solution. The real structural issue is that the U.S. power grid is badly aging, with a huge shortfall in investment in transmission and distribution infrastructure. The AI boom has simply brought this contradiction to light earlier.
Another noteworthy point—China’s investment slowdown is not a decline, but a shift from an expansion phase to an optimization phase. After a decade of infrastructure ramp-up, there is now excess capacity; the focus is moving toward efficiency improvements and increasing the share of renewables. As energy investment in the two countries rises and falls in opposite directions, it reflects different development stages and strategic priorities.
For commodity traders, expectations for natural gas demand may support prices, but policy risk should be watched closely. In the U.S. election year, energy policy can swing unpredictably—subsidies and regulation could change at any time. Historically, investment booms driven by policy often come with later excess capacity and price pullbacks.
According to IEA data, U.S. fossil-fuel power generation investment will reach $50 billion in 2026, for the first time in decades exceeding China ($47 billion). Behind this reversal is AI-driven data center power demand—gas turbine orders surged to 20 GW in Q1 alone, with Siemens and GE Vernova orders piling up.
This turning point is quite interesting. Over the past decade, China has been sprinting on energy infrastructure buildout, but the U.S. suddenly finds itself short on electricity due to the compute race. Training a large AI model consumes power comparable to that of a small city, and data center expansion is far faster than grid planning. The result? In the short term, it can only rely on natural gas generation to fill the gap, while renewable energy construction cycles can’t keep up.
From a cycle perspective, this investment peak could last 3–5 years. Natural gas equipment manufacturers benefit clearly in the short term, but in the long run this is a transitional solution. The real structural issue is that the U.S. power grid is badly aging, with a huge shortfall in investment in transmission and distribution infrastructure. The AI boom has simply brought this contradiction to light earlier.
Another noteworthy point—China’s investment slowdown is not a decline, but a shift from an expansion phase to an optimization phase. After a decade of infrastructure ramp-up, there is now excess capacity; the focus is moving toward efficiency improvements and increasing the share of renewables. As energy investment in the two countries rises and falls in opposite directions, it reflects different development stages and strategic priorities.
For commodity traders, expectations for natural gas demand may support prices, but policy risk should be watched closely. In the U.S. election year, energy policy can swing unpredictably—subsidies and regulation could change at any time. Historically, investment booms driven by policy often come with later excess capacity and price pullbacks.
This turning point is quite interesting. Over the past decade, China has been sprinting on energy infrastructure buildout, but the U.S. suddenly finds itself short on electricity due to the compute race. Training a large AI model consumes power comparable to that of a small city, and data center expansion is far faster than grid planning. The result? In the short term, it can only rely on natural gas generation to fill the gap, while renewable energy construction cycles can’t keep up.
From a cycle perspective, this investment peak could last 3–5 years. Natural gas equipment manufacturers benefit clearly in the short term, but in the long run this is a transitional solution. The real structural issue is that the U.S. power grid is badly aging, with a huge shortfall in investment in transmission and distribution infrastructure. The AI boom has simply brought this contradiction to light earlier.
Another noteworthy point—China’s investment slowdown is not a decline, but a shift from an expansion phase to an optimization phase. After a decade of infrastructure ramp-up, there is now excess capacity; the focus is moving toward efficiency improvements and increasing the share of renewables. As energy investment in the two countries rises and falls in opposite directions, it reflects different development stages and strategic priorities.
For commodity traders, expectations for natural gas demand may support prices, but policy risk should be watched closely. In the U.S. election year, energy policy can swing unpredictably—subsidies and regulation could change at any time. Historically, investment booms driven by policy often come with later excess capacity and price pullbacks.
207
·
--
Taiwan Strait’s strategic dependency on Japan, South Korea, and the Philippines is actually higher than many people think.
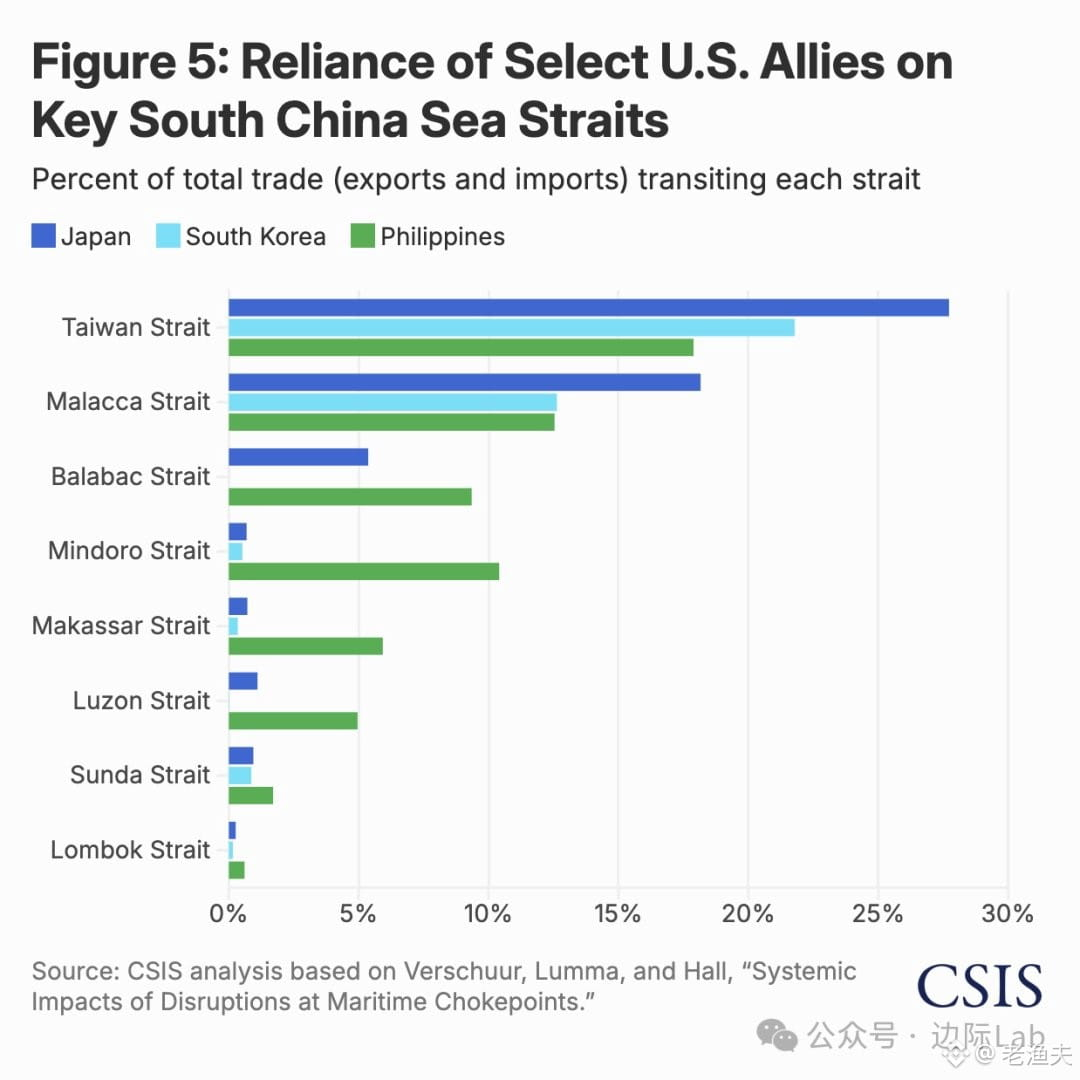
2024 data: Japan 28% of its foreign trade goes through the Taiwan Strait, South Korea 22%, and the Philippines 18%—all far exceeding their reliance on the Strait of Malacca (Japan 18%, South Korea 13%, Philippines 17%).
This is not just a matter of energy routes. For Japan and South Korea, what makes the Taiwan Strait more critical is the flow of high-value manufactured goods—semiconductors, precision machinery, and electronic components—deeply integrated with supply chains linking them to mainland China and Southeast Asia.
In other words, once something goes wrong in the Taiwan Strait, the hardest hit won’t be the U.S. and Europe, but rather these key American allies in East Asia. Geo-political risk is being priced in, but the market hasn’t fully digested it yet. That’s the real “chokepoint.”
As the old saying goes: maps are more honest than ideology.
Taiwan Strait’s strategic dependency on Japan, South Korea, and the Philippines is actually higher than many people think.
2024 data: Japan 28% of its foreign trade goes through the Taiwan Strait, South Korea 22%, and the Philippines 18%—all far exceeding their reliance on the Strait of Malacca (Japan 18%, South Korea 13%, Philippines 17%).
This is not just a matter of energy routes. For Japan and South Korea, what makes the Taiwan Strait more critical is the flow of high-value manufactured goods—semiconductors, precision machinery, and electronic components—deeply integrated with supply chains linking them to mainland China and Southeast Asia.
In other words, once something goes wrong in the Taiwan Strait, the hardest hit won’t be the U.S. and Europe, but rather these key American allies in East Asia. Geo-political risk is being priced in, but the market hasn’t fully digested it yet. That’s the real “chokepoint.”
As the old saying goes: maps are more honest than ideology.
2024 data: Japan 28% of its foreign trade goes through the Taiwan Strait, South Korea 22%, and the Philippines 18%—all far exceeding their reliance on the Strait of Malacca (Japan 18%, South Korea 13%, Philippines 17%).
This is not just a matter of energy routes. For Japan and South Korea, what makes the Taiwan Strait more critical is the flow of high-value manufactured goods—semiconductors, precision machinery, and electronic components—deeply integrated with supply chains linking them to mainland China and Southeast Asia.
In other words, once something goes wrong in the Taiwan Strait, the hardest hit won’t be the U.S. and Europe, but rather these key American allies in East Asia. Geo-political risk is being priced in, but the market hasn’t fully digested it yet. That’s the real “chokepoint.”
As the old saying goes: maps are more honest than ideology.
1
1.5k
·
--
The Taiwan Strait has already surpassed the Strait of Malacca to become China’s most critical trade choke point—a shift many people still haven’t fully realized.
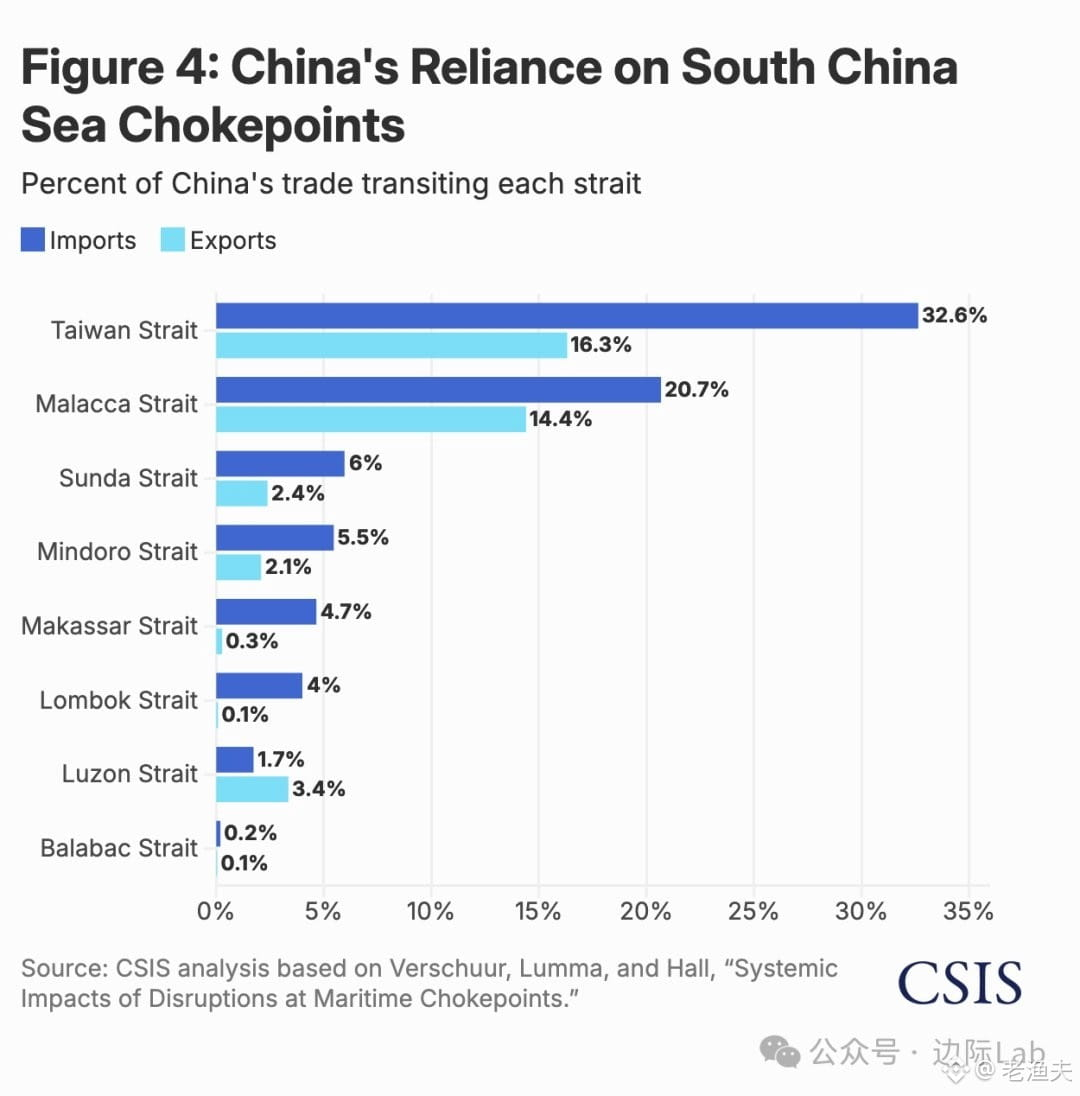
According to the latest CSIS data: in 2024, 32.6% of China’s imports (about US$1.3 trillion) and 16.3% of its exports need to pass through the Taiwan Strait, far exceeding Malacca’s 20.7% for imports and 14.4% for exports. It’s not only energy and raw materials—there is also a large amount of freight moving between domestic north-south ports.
This isn’t a geopolitical narrative; it’s a hard reality of trade logistics. Consider this: if this route is disrupted, the impact won’t stop at external trade—domestic supply chains would get stuck too.
Older generations used to talk about the “Malacca dilemma.” Now it’s time to re-examine the map. The Taiwan Strait is not only a military hotspot, but also a major artery of China’s economy. With this level of dependence, any disturbance will directly feed into commodity prices, shipping costs, and even the global supply chain.
Historically, whenever a key shipping lane has been threatened, markets have priced in a risk premium in advance. Will this time be an exception? We’ll see.
The Taiwan Strait has already surpassed the Strait of Malacca to become China’s most critical trade choke point—a shift many people still haven’t fully realized.
According to the latest CSIS data: in 2024, 32.6% of China’s imports (about US$1.3 trillion) and 16.3% of its exports need to pass through the Taiwan Strait, far exceeding Malacca’s 20.7% for imports and 14.4% for exports. It’s not only energy and raw materials—there is also a large amount of freight moving between domestic north-south ports.
This isn’t a geopolitical narrative; it’s a hard reality of trade logistics. Consider this: if this route is disrupted, the impact won’t stop at external trade—domestic supply chains would get stuck too.
Older generations used to talk about the “Malacca dilemma.” Now it’s time to re-examine the map. The Taiwan Strait is not only a military hotspot, but also a major artery of China’s economy. With this level of dependence, any disturbance will directly feed into commodity prices, shipping costs, and even the global supply chain.
Historically, whenever a key shipping lane has been threatened, markets have priced in a risk premium in advance. Will this time be an exception? We’ll see.
According to the latest CSIS data: in 2024, 32.6% of China’s imports (about US$1.3 trillion) and 16.3% of its exports need to pass through the Taiwan Strait, far exceeding Malacca’s 20.7% for imports and 14.4% for exports. It’s not only energy and raw materials—there is also a large amount of freight moving between domestic north-south ports.
This isn’t a geopolitical narrative; it’s a hard reality of trade logistics. Consider this: if this route is disrupted, the impact won’t stop at external trade—domestic supply chains would get stuck too.
Older generations used to talk about the “Malacca dilemma.” Now it’s time to re-examine the map. The Taiwan Strait is not only a military hotspot, but also a major artery of China’s economy. With this level of dependence, any disturbance will directly feed into commodity prices, shipping costs, and even the global supply chain.
Historically, whenever a key shipping lane has been threatened, markets have priced in a risk premium in advance. Will this time be an exception? We’ll see.
2
1
5k
·
--
Verified
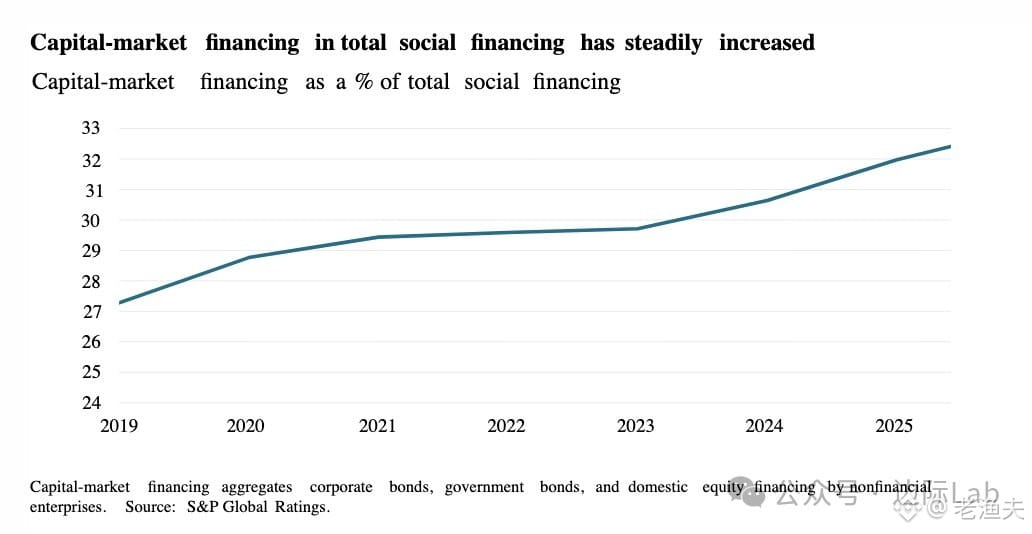
Recently, the PBoC has proposed setting up a liquidity support tool for non-bank financial institutions (such as securities firms). In essence, this is an admission of a reality: China’s financing structure has already changed. The share of financing from the capital markets in social financing (社融) has risen from 27% in 2019 to now over 32%. This means the systemic importance of non-bank institutions such as securities firms and funds is becoming increasingly critical, and they can no longer be treated as peripheral players.
The logic behind this tool is straightforward. In extreme circumstances, non-bank institutions can exchange bonds for cash to prevent liquidity stress from spreading throughout the entire financial system. This is not a new idea. The SFISF at the end of last year and the expansion of first-tier dealers in April this year are both continuations of the same playbook. Regulators are building a safety net for non-bank institutions because the era of bank-led indirect financing is already transitioning.
From a cyclical perspective, this kind of policy typically appears in two stages: either ahead of time to prepare for future risks, or after certain early signals have already been detected. Given the global tightening of liquidity and increased volatility in domestic assets, this tool looks more like a precautionary measure. However, it’s also important to be clear: having a tool does not mean things won’t go wrong. It only means there is a buffer if something happens. The fundamental issues still lie in non-bank institutions’ leverage and asset quality.
Looking back historically, whenever financial structures shift, new risk points and new regulatory tools tend to emerge. The U.S. S&L crisis in the 1980s and Japan’s securities firm failures in the 1990s are similar lessons. China is now moving down the path of expanding direct financing. The growth of non-bank institutions is inevitable—but whether risk management can keep pace is the key. This tool helps fill a shortcoming, but don’t expect it to solve all problems.
Recently, the PBoC has proposed setting up a liquidity support tool for non-bank financial institutions (such as securities firms). In essence, this is an admission of a reality: China’s financing structure has already changed. The share of financing from the capital markets in social financing (社融) has risen from 27% in 2019 to now over 32%. This means the systemic importance of non-bank institutions such as securities firms and funds is becoming increasingly critical, and they can no longer be treated as peripheral players.
The logic behind this tool is straightforward. In extreme circumstances, non-bank institutions can exchange bonds for cash to prevent liquidity stress from spreading throughout the entire financial system. This is not a new idea. The SFISF at the end of last year and the expansion of first-tier dealers in April this year are both continuations of the same playbook. Regulators are building a safety net for non-bank institutions because the era of bank-led indirect financing is already transitioning.
From a cyclical perspective, this kind of policy typically appears in two stages: either ahead of time to prepare for future risks, or after certain early signals have already been detected. Given the global tightening of liquidity and increased volatility in domestic assets, this tool looks more like a precautionary measure. However, it’s also important to be clear: having a tool does not mean things won’t go wrong. It only means there is a buffer if something happens. The fundamental issues still lie in non-bank institutions’ leverage and asset quality.
Looking back historically, whenever financial structures shift, new risk points and new regulatory tools tend to emerge. The U.S. S&L crisis in the 1980s and Japan’s securities firm failures in the 1990s are similar lessons. China is now moving down the path of expanding direct financing. The growth of non-bank institutions is inevitable—but whether risk management can keep pace is the key. This tool helps fill a shortcoming, but don’t expect it to solve all problems.
The logic behind this tool is straightforward. In extreme circumstances, non-bank institutions can exchange bonds for cash to prevent liquidity stress from spreading throughout the entire financial system. This is not a new idea. The SFISF at the end of last year and the expansion of first-tier dealers in April this year are both continuations of the same playbook. Regulators are building a safety net for non-bank institutions because the era of bank-led indirect financing is already transitioning.
From a cyclical perspective, this kind of policy typically appears in two stages: either ahead of time to prepare for future risks, or after certain early signals have already been detected. Given the global tightening of liquidity and increased volatility in domestic assets, this tool looks more like a precautionary measure. However, it’s also important to be clear: having a tool does not mean things won’t go wrong. It only means there is a buffer if something happens. The fundamental issues still lie in non-bank institutions’ leverage and asset quality.
Looking back historically, whenever financial structures shift, new risk points and new regulatory tools tend to emerge. The U.S. S&L crisis in the 1980s and Japan’s securities firm failures in the 1990s are similar lessons. China is now moving down the path of expanding direct financing. The growth of non-bank institutions is inevitable—but whether risk management can keep pace is the key. This tool helps fill a shortcoming, but don’t expect it to solve all problems.
667
·
--
Verified
The story of U.S.-dollar bonds issued by local government financing platforms is basically over. In 2024, net issuance was still nearly $20 billion; by 2025, it flipped to net repayments. In the first five months of this year alone, net repayments reached $6.8 billion. This isn’t some “strategy adjustment”—it’s the reality forced by a combination of interest-rate spreads and approval procedures.
With U.S. dollar interest rates staying at high levels for the long term, and compared with domestic rates, the spread is there for all to see. The refinancing cost for LGFVs has surged directly. The game that used to rely on “borrowing new to repay old” can no longer be played. Even worse is that the approval cycle by the NDRC has been extended to more than half a year. For issuers, this kind of uncertainty is an implicit cost— the longer the timeline drags on, the more variables arise.
This is actually not complicated: tighter external conditions (dollars are expensive) + tighter internal regulation (slow approvals) = shrinking financing channels. Now LGFVs either return to domestic markets, or they truly deleverage. Based on historical experience, local government debt problems have never been solvable by a one-size-fits-all approach. But this round of dollar-bond retreat at least shows one thing: the old path of “using overseas low costs to add leverage” is not workable in the short term.
The data from S&P is worth paying attention to—not because it’s particularly shocking, but because it confirms a trend: when external liquidity is no longer cheap and internal regulation is no longer relaxed, many “routine operations” fail quickly. Next, we’ll see how LGFVs respond to domestic refinancing pressure, and how much room local finances still have to maneuver.
The story of U.S.-dollar bonds issued by local government financing platforms is basically over. In 2024, net issuance was still nearly $20 billion; by 2025, it flipped to net repayments. In the first five months of this year alone, net repayments reached $6.8 billion. This isn’t some “strategy adjustment”—it’s the reality forced by a combination of interest-rate spreads and approval procedures.
With U.S. dollar interest rates staying at high levels for the long term, and compared with domestic rates, the spread is there for all to see. The refinancing cost for LGFVs has surged directly. The game that used to rely on “borrowing new to repay old” can no longer be played. Even worse is that the approval cycle by the NDRC has been extended to more than half a year. For issuers, this kind of uncertainty is an implicit cost— the longer the timeline drags on, the more variables arise.
This is actually not complicated: tighter external conditions (dollars are expensive) + tighter internal regulation (slow approvals) = shrinking financing channels. Now LGFVs either return to domestic markets, or they truly deleverage. Based on historical experience, local government debt problems have never been solvable by a one-size-fits-all approach. But this round of dollar-bond retreat at least shows one thing: the old path of “using overseas low costs to add leverage” is not workable in the short term.
The data from S&P is worth paying attention to—not because it’s particularly shocking, but because it confirms a trend: when external liquidity is no longer cheap and internal regulation is no longer relaxed, many “routine operations” fail quickly. Next, we’ll see how LGFVs respond to domestic refinancing pressure, and how much room local finances still have to maneuver.
With U.S. dollar interest rates staying at high levels for the long term, and compared with domestic rates, the spread is there for all to see. The refinancing cost for LGFVs has surged directly. The game that used to rely on “borrowing new to repay old” can no longer be played. Even worse is that the approval cycle by the NDRC has been extended to more than half a year. For issuers, this kind of uncertainty is an implicit cost— the longer the timeline drags on, the more variables arise.
This is actually not complicated: tighter external conditions (dollars are expensive) + tighter internal regulation (slow approvals) = shrinking financing channels. Now LGFVs either return to domestic markets, or they truly deleverage. Based on historical experience, local government debt problems have never been solvable by a one-size-fits-all approach. But this round of dollar-bond retreat at least shows one thing: the old path of “using overseas low costs to add leverage” is not workable in the short term.
The data from S&P is worth paying attention to—not because it’s particularly shocking, but because it confirms a trend: when external liquidity is no longer cheap and internal regulation is no longer relaxed, many “routine operations” fail quickly. Next, we’ll see how LGFVs respond to domestic refinancing pressure, and how much room local finances still have to maneuver.
379
·
--
Partly True
The expansion rate of municipal investment bond issuance has plummeted in a cliff-like drop; the average annual growth rate fell sharply from 13% in 2021–2023 to just 4% in 2024–2025. The traditional investment-driven growth model is basically over.
Behind this is the strong regulatory control over local government debt risk. The direct results of debt-reduction measures—local governments cutting infrastructure spending and raising the investment return threshold for projects—have brought about this slowdown.
What’s interesting is that financing costs are actually steadily declining, dropping from over 6% in 2021 to about 5% in 2025. This reflects a combination of a loose monetary environment and financial institutions, under the debt-reduction framework, carrying out interest-rate cut and refinancing actions on the rollover of existing debt.
This is a typical “bundle of punches” combining stock debt-to-debt conversion with incremental control. The issuance expansion hits the brakes, but the cost of servicing existing debt is reduced to avoid a hard landing. In the short term, it looks like a rational contraction; in the long term, it represents a structural shift in local governments’ investment model.
The days when GDP was boosted by borrowing for infrastructure really are over.
The expansion rate of municipal investment bond issuance has plummeted in a cliff-like drop; the average annual growth rate fell sharply from 13% in 2021–2023 to just 4% in 2024–2025. The traditional investment-driven growth model is basically over.
Behind this is the strong regulatory control over local government debt risk. The direct results of debt-reduction measures—local governments cutting infrastructure spending and raising the investment return threshold for projects—have brought about this slowdown.
What’s interesting is that financing costs are actually steadily declining, dropping from over 6% in 2021 to about 5% in 2025. This reflects a combination of a loose monetary environment and financial institutions, under the debt-reduction framework, carrying out interest-rate cut and refinancing actions on the rollover of existing debt.
This is a typical “bundle of punches” combining stock debt-to-debt conversion with incremental control. The issuance expansion hits the brakes, but the cost of servicing existing debt is reduced to avoid a hard landing. In the short term, it looks like a rational contraction; in the long term, it represents a structural shift in local governments’ investment model.
The days when GDP was boosted by borrowing for infrastructure really are over.
Behind this is the strong regulatory control over local government debt risk. The direct results of debt-reduction measures—local governments cutting infrastructure spending and raising the investment return threshold for projects—have brought about this slowdown.
What’s interesting is that financing costs are actually steadily declining, dropping from over 6% in 2021 to about 5% in 2025. This reflects a combination of a loose monetary environment and financial institutions, under the debt-reduction framework, carrying out interest-rate cut and refinancing actions on the rollover of existing debt.
This is a typical “bundle of punches” combining stock debt-to-debt conversion with incremental control. The issuance expansion hits the brakes, but the cost of servicing existing debt is reduced to avoid a hard landing. In the short term, it looks like a rational contraction; in the long term, it represents a structural shift in local governments’ investment model.
The days when GDP was boosted by borrowing for infrastructure really are over.
1k
·
--
About climate-driven inflation: the issue had already been discussed in the 1990s among commodity circles, though back then nobody paid much attention. Now it looks like the impact of extreme weather on food prices has shifted from theory to a practical trading logic.
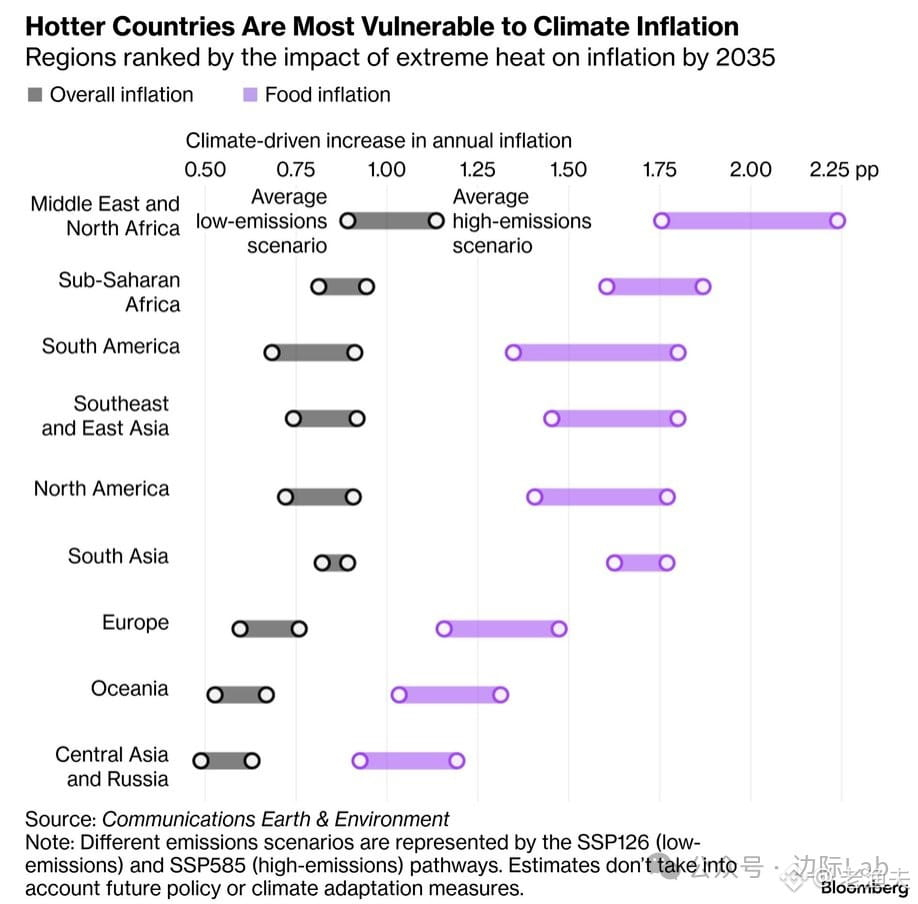
This Bloomberg study mentions projections for 2035, but what I care about more are the cases happening right now: a heatwave in India directly lifts the FY2027 inflation forecast; in Mexico, tomato prices double due to off-season rainfall and disease-related problems; and South Korea expects inflation to move up by 0.3–0.5 percentage points because of hot, heavy rainfall. These aren’t model scenarios—they’re real supply-chain shocks.
In climate-vulnerable regions such as the Middle East, North Africa, and sub-Saharan Africa, an annual rise of 1.75–2.25 percentage points in food prices may sound modest. But for these regions’ real purchasing power and social stability, the impact is structural. Remember the Arab Spring of 2010–2011? One of the driving forces behind it was a surge in wheat prices.
From a trading perspective, climate inflation is not linear. It can flare up suddenly in certain years (for example, during an El Niño year), then be forgotten by the market in calmer periods. But the long-term trend is clear: the frequency of extreme weather is increasing, and the volatility of agricultural supply chains will keep being amplified. That means the asset-allocation logic for hedging inflation may need to be reconsidered over the next decade.
About climate-driven inflation: the issue had already been discussed in the 1990s among commodity circles, though back then nobody paid much attention. Now it looks like the impact of extreme weather on food prices has shifted from theory to a practical trading logic.
This Bloomberg study mentions projections for 2035, but what I care about more are the cases happening right now: a heatwave in India directly lifts the FY2027 inflation forecast; in Mexico, tomato prices double due to off-season rainfall and disease-related problems; and South Korea expects inflation to move up by 0.3–0.5 percentage points because of hot, heavy rainfall. These aren’t model scenarios—they’re real supply-chain shocks.
In climate-vulnerable regions such as the Middle East, North Africa, and sub-Saharan Africa, an annual rise of 1.75–2.25 percentage points in food prices may sound modest. But for these regions’ real purchasing power and social stability, the impact is structural. Remember the Arab Spring of 2010–2011? One of the driving forces behind it was a surge in wheat prices.
From a trading perspective, climate inflation is not linear. It can flare up suddenly in certain years (for example, during an El Niño year), then be forgotten by the market in calmer periods. But the long-term trend is clear: the frequency of extreme weather is increasing, and the volatility of agricultural supply chains will keep being amplified. That means the asset-allocation logic for hedging inflation may need to be reconsidered over the next decade.
This Bloomberg study mentions projections for 2035, but what I care about more are the cases happening right now: a heatwave in India directly lifts the FY2027 inflation forecast; in Mexico, tomato prices double due to off-season rainfall and disease-related problems; and South Korea expects inflation to move up by 0.3–0.5 percentage points because of hot, heavy rainfall. These aren’t model scenarios—they’re real supply-chain shocks.
In climate-vulnerable regions such as the Middle East, North Africa, and sub-Saharan Africa, an annual rise of 1.75–2.25 percentage points in food prices may sound modest. But for these regions’ real purchasing power and social stability, the impact is structural. Remember the Arab Spring of 2010–2011? One of the driving forces behind it was a surge in wheat prices.
From a trading perspective, climate inflation is not linear. It can flare up suddenly in certain years (for example, during an El Niño year), then be forgotten by the market in calmer periods. But the long-term trend is clear: the frequency of extreme weather is increasing, and the volatility of agricultural supply chains will keep being amplified. That means the asset-allocation logic for hedging inflation may need to be reconsidered over the next decade.
547
·
--
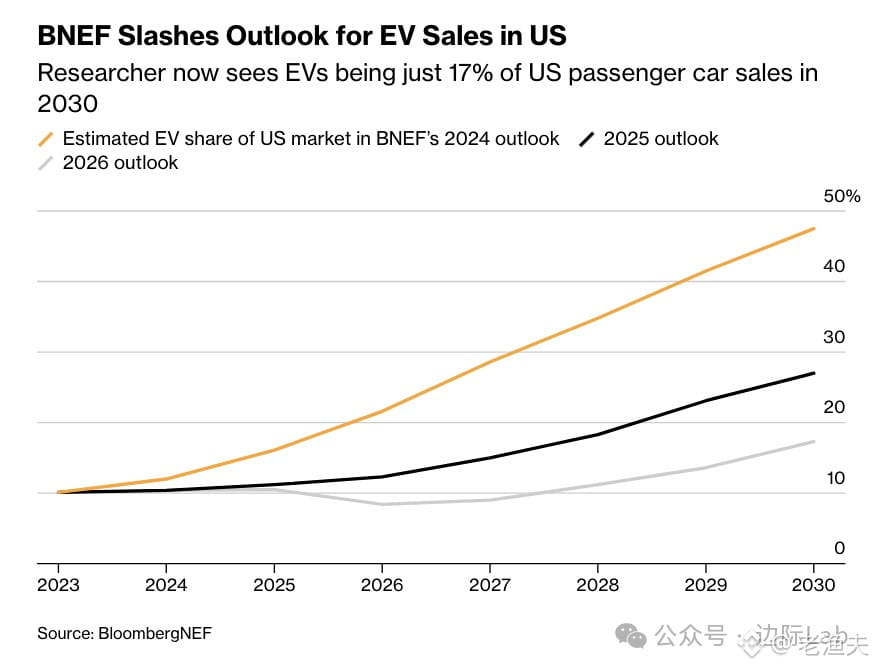
BloombergNEF has just cut its 2030 U.S. EV sales forecast from last year’s 48% to this year’s 17%. Behind this cliff-like downgrade is a textbook case of a policy-cycle shift— the Trump administration weakened fuel-efficiency standards, rolled back California’s sales order, and canceled the $7,500 federal subsidy.
This reminds me of the story of Japan’s solar industry in the 1990s. Once government subsidies were removed, the entire sector shrank immediately. For clean energy technologies like this, before the technology and costs truly reach real price parity, policy is the lifeline.
From a macro perspective, this is also a reshuffling of capital allocation. Without subsidies, automakers will recalculate ROI, the supply chain will adjust capacity, and demand expectations for lithium and copper ore will need to be reassessed. The market always adapts to policy reality— but the adjustment process is inevitably painful.
History shows us: growth driven by policy is fragile. Only when the cost curve genuinely comes down can the industry stand on its own. It appears that, for now, the U.S. EV market still needs more time to absorb this reality.
BloombergNEF has just cut its 2030 U.S. EV sales forecast from last year’s 48% to this year’s 17%. Behind this cliff-like downgrade is a textbook case of a policy-cycle shift— the Trump administration weakened fuel-efficiency standards, rolled back California’s sales order, and canceled the $7,500 federal subsidy.
This reminds me of the story of Japan’s solar industry in the 1990s. Once government subsidies were removed, the entire sector shrank immediately. For clean energy technologies like this, before the technology and costs truly reach real price parity, policy is the lifeline.
From a macro perspective, this is also a reshuffling of capital allocation. Without subsidies, automakers will recalculate ROI, the supply chain will adjust capacity, and demand expectations for lithium and copper ore will need to be reassessed. The market always adapts to policy reality— but the adjustment process is inevitably painful.
History shows us: growth driven by policy is fragile. Only when the cost curve genuinely comes down can the industry stand on its own. It appears that, for now, the U.S. EV market still needs more time to absorb this reality.
This reminds me of the story of Japan’s solar industry in the 1990s. Once government subsidies were removed, the entire sector shrank immediately. For clean energy technologies like this, before the technology and costs truly reach real price parity, policy is the lifeline.
From a macro perspective, this is also a reshuffling of capital allocation. Without subsidies, automakers will recalculate ROI, the supply chain will adjust capacity, and demand expectations for lithium and copper ore will need to be reassessed. The market always adapts to policy reality— but the adjustment process is inevitably painful.
History shows us: growth driven by policy is fragile. Only when the cost curve genuinely comes down can the industry stand on its own. It appears that, for now, the U.S. EV market still needs more time to absorb this reality.
1
1.8k
·
--
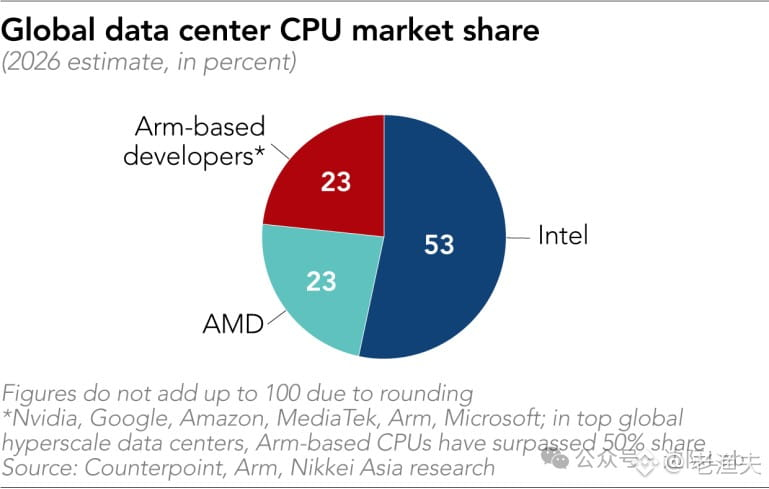
2026 data center CPU landscape is quite interesting—Intel as a whole can still hold 53%, with AMD and the Arm camp each at 23%. But the real story lies in the hyperscale segment: Arm adoption has already surpassed half.
This isn’t a debate over technical roadmaps; it’s about power reality. For big players like Meta, Google, and Amazon, choosing Arm isn’t about chasing trends—it’s because power efficiency directly determines how many more racks they can fit and whether they can keep the electricity bill under control. For AI data centers today, the biggest bottleneck isn’t chip supply—it’s grid capacity and cooling capability.
Intel can certainly hold its ground in the traditional enterprise market, but the fastest-growing slice of the pie is being re-cut. Once this kind of structural shift takes hold and builds momentum, the following ecosystem, software adaptation, and developer habits will all move with it. Old players will have to adapt to the new rules.
2026 data center CPU landscape is quite interesting—Intel as a whole can still hold 53%, with AMD and the Arm camp each at 23%. But the real story lies in the hyperscale segment: Arm adoption has already surpassed half.
This isn’t a debate over technical roadmaps; it’s about power reality. For big players like Meta, Google, and Amazon, choosing Arm isn’t about chasing trends—it’s because power efficiency directly determines how many more racks they can fit and whether they can keep the electricity bill under control. For AI data centers today, the biggest bottleneck isn’t chip supply—it’s grid capacity and cooling capability.
Intel can certainly hold its ground in the traditional enterprise market, but the fastest-growing slice of the pie is being re-cut. Once this kind of structural shift takes hold and builds momentum, the following ecosystem, software adaptation, and developer habits will all move with it. Old players will have to adapt to the new rules.
This isn’t a debate over technical roadmaps; it’s about power reality. For big players like Meta, Google, and Amazon, choosing Arm isn’t about chasing trends—it’s because power efficiency directly determines how many more racks they can fit and whether they can keep the electricity bill under control. For AI data centers today, the biggest bottleneck isn’t chip supply—it’s grid capacity and cooling capability.
Intel can certainly hold its ground in the traditional enterprise market, but the fastest-growing slice of the pie is being re-cut. Once this kind of structural shift takes hold and builds momentum, the following ecosystem, software adaptation, and developer habits will all move with it. Old players will have to adapt to the new rules.
417
·
--
Verified
Since the 1980s, corporate tax rates in advanced economies have been on a steady downward slide. The effective tax rate on S&P 500 component stocks in the United States fell from roughly 40% to 20% in 2020, and Germany, the UK, and France have seen similar patterns.
This round of tax cuts began in the Reagan and Thatcher eras, as supply-side reforms were introduced alongside deregulation and privatization. At the time, they did help drive economic recovery.
But looking back now, the multi-decade cycle of tax cuts has likely reached its end. Governments across the world face mounting fiscal pressure, infrastructure is aging, and welfare spending is expanding rapidly. Relying on further tax cuts to stimulate growth is no longer realistic. Over the next decade, tax rates will most likely move upward—whether corporate taxes, capital gains taxes, or taxes on the wealthy.
The cycle turns back again; the policy pendulum always swings to return. The past forty years were an era of tax cuts and deregulation. The next era may well be one of higher taxes and renewed regulation. Capital allocation logic will need to adjust accordingly as well.
Since the 1980s, corporate tax rates in advanced economies have been on a steady downward slide. The effective tax rate on S&P 500 component stocks in the United States fell from roughly 40% to 20% in 2020, and Germany, the UK, and France have seen similar patterns.
This round of tax cuts began in the Reagan and Thatcher eras, as supply-side reforms were introduced alongside deregulation and privatization. At the time, they did help drive economic recovery.
But looking back now, the multi-decade cycle of tax cuts has likely reached its end. Governments across the world face mounting fiscal pressure, infrastructure is aging, and welfare spending is expanding rapidly. Relying on further tax cuts to stimulate growth is no longer realistic. Over the next decade, tax rates will most likely move upward—whether corporate taxes, capital gains taxes, or taxes on the wealthy.
The cycle turns back again; the policy pendulum always swings to return. The past forty years were an era of tax cuts and deregulation. The next era may well be one of higher taxes and renewed regulation. Capital allocation logic will need to adjust accordingly as well.
This round of tax cuts began in the Reagan and Thatcher eras, as supply-side reforms were introduced alongside deregulation and privatization. At the time, they did help drive economic recovery.
But looking back now, the multi-decade cycle of tax cuts has likely reached its end. Governments across the world face mounting fiscal pressure, infrastructure is aging, and welfare spending is expanding rapidly. Relying on further tax cuts to stimulate growth is no longer realistic. Over the next decade, tax rates will most likely move upward—whether corporate taxes, capital gains taxes, or taxes on the wealthy.
The cycle turns back again; the policy pendulum always swings to return. The past forty years were an era of tax cuts and deregulation. The next era may well be one of higher taxes and renewed regulation. Capital allocation logic will need to adjust accordingly as well.
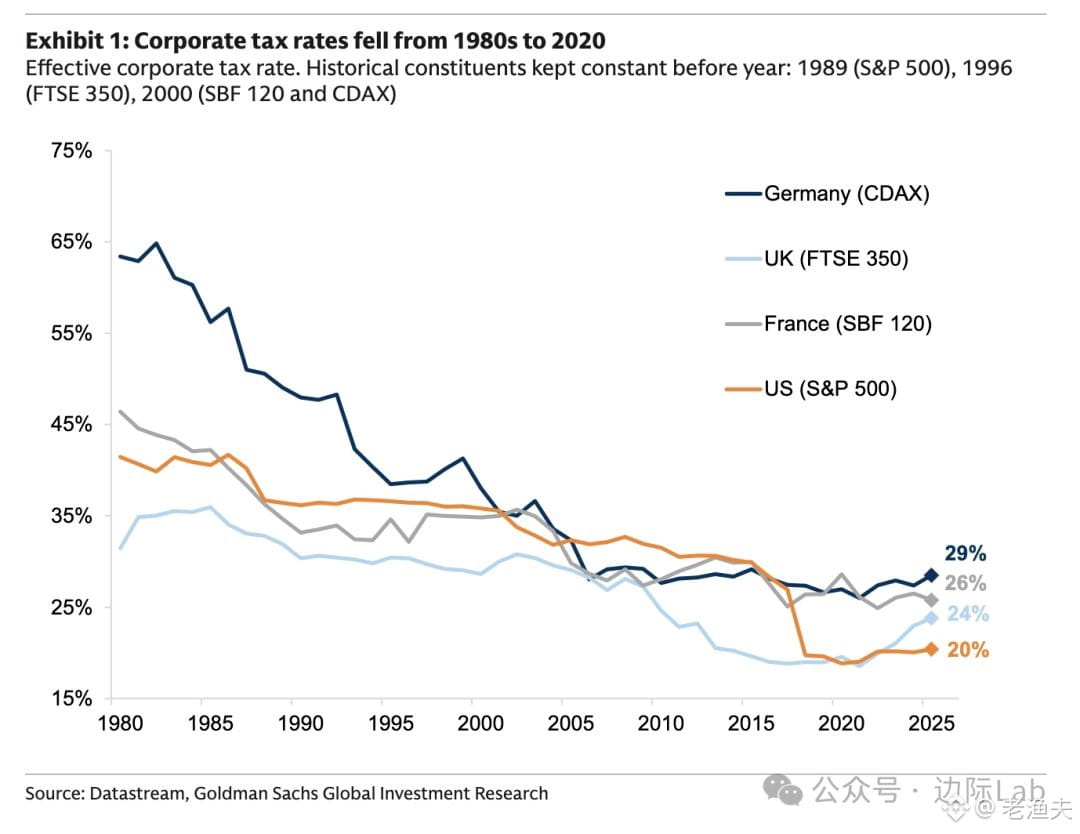
1.6k
·
--
BIS data is out, and the Gulf states’ dollar reliance remains astonishing—69% of cross-border assets are denominated in USD, versus a global average of just 46%. The euro accounts for only 8% there, compared with 34% globally.
This isn’t surprising. Between exchange-rate arrangements tied to the dollar, the inertia of “petrodollar” settlements, and insufficient depth in local capital markets, Gulf money either flows back into US Treasuries and US stocks or leaves via the dollar channels through London and Singapore. The euro? There’s no corresponding ecosystem.
What’s interesting is that while the world is de-dollarizing, the GCC is actually becoming even more concentrated. What does that imply? Either their confidence in the dollar is still intact, or the alternative options are simply not mature enough. Saudi Arabia and the UAE have also been discussing reserve diversification and RMB settlement in recent years, but the pace of implementation has been far slower than the level of public enthusiasm.
The dollar’s network effects are too strong to just switch out overnight. Especially for these oil exporters, the dollar is both the pricing currency and the anchor for asset allocation. In the short term, this pattern will be difficult to change. Long term? It depends on whether China can offer a truly viable alternative in energy, infrastructure, and financial-market infrastructure—not just bilateral agreements and political statements.
Data source: ING. You might want to watch for their follow-up tracking of capital flows to and from the Middle East.
BIS data is out, and the Gulf states’ dollar reliance remains astonishing—69% of cross-border assets are denominated in USD, versus a global average of just 46%. The euro accounts for only 8% there, compared with 34% globally.
This isn’t surprising. Between exchange-rate arrangements tied to the dollar, the inertia of “petrodollar” settlements, and insufficient depth in local capital markets, Gulf money either flows back into US Treasuries and US stocks or leaves via the dollar channels through London and Singapore. The euro? There’s no corresponding ecosystem.
What’s interesting is that while the world is de-dollarizing, the GCC is actually becoming even more concentrated. What does that imply? Either their confidence in the dollar is still intact, or the alternative options are simply not mature enough. Saudi Arabia and the UAE have also been discussing reserve diversification and RMB settlement in recent years, but the pace of implementation has been far slower than the level of public enthusiasm.
The dollar’s network effects are too strong to just switch out overnight. Especially for these oil exporters, the dollar is both the pricing currency and the anchor for asset allocation. In the short term, this pattern will be difficult to change. Long term? It depends on whether China can offer a truly viable alternative in energy, infrastructure, and financial-market infrastructure—not just bilateral agreements and political statements.
Data source: ING. You might want to watch for their follow-up tracking of capital flows to and from the Middle East.
This isn’t surprising. Between exchange-rate arrangements tied to the dollar, the inertia of “petrodollar” settlements, and insufficient depth in local capital markets, Gulf money either flows back into US Treasuries and US stocks or leaves via the dollar channels through London and Singapore. The euro? There’s no corresponding ecosystem.
What’s interesting is that while the world is de-dollarizing, the GCC is actually becoming even more concentrated. What does that imply? Either their confidence in the dollar is still intact, or the alternative options are simply not mature enough. Saudi Arabia and the UAE have also been discussing reserve diversification and RMB settlement in recent years, but the pace of implementation has been far slower than the level of public enthusiasm.
The dollar’s network effects are too strong to just switch out overnight. Especially for these oil exporters, the dollar is both the pricing currency and the anchor for asset allocation. In the short term, this pattern will be difficult to change. Long term? It depends on whether China can offer a truly viable alternative in energy, infrastructure, and financial-market infrastructure—not just bilateral agreements and political statements.
Data source: ING. You might want to watch for their follow-up tracking of capital flows to and from the Middle East.
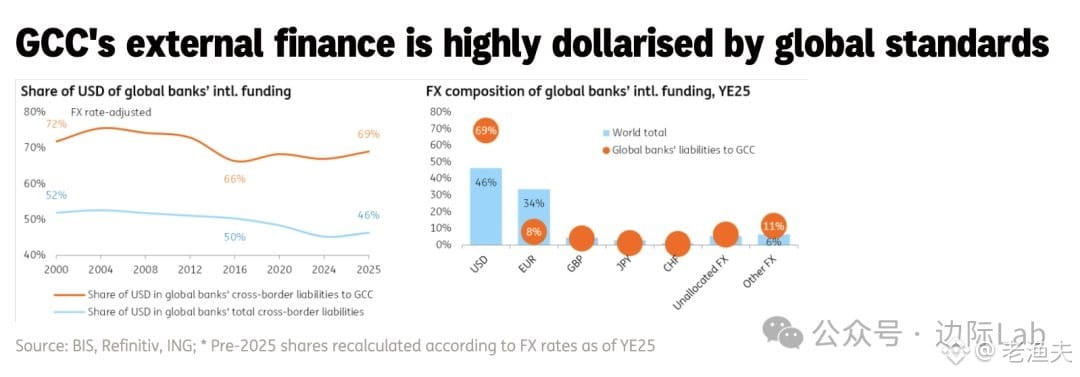
287
Log in to explore more content
Join global crypto users on Binance Square
⚡️ Get latest and useful information about crypto.
💬 Trusted by the world’s largest crypto exchange.
👍 Discover real insights from verified creators.
Email / Phone number
Trending Topics
BinanceLaunchesBinanceIntelligence
609,228 views
3,755 Discussing
#binancelaunchesbinanceintelligence
🚨 BINANCE JUST PUSHED AI DEEPER INTO CRYPTO.
Binance has launched Binance Intelligence — a new AI-powered layer built around market research, trading workflows, and crypto data.
The interesting part?
It’s not just one tool.
🧠 Binance AI → personalized market briefs, alerts and portfolio insights
⚡ Binance AI Pro → turns natural-language ideas into trading workflows
🤖 Agent OS → connects AI agents with market, wallet and on-chain capabilities
That’s a big shift.
Crypto platforms are no longer only giving traders charts and data.
They’re starting to give them AI systems that can interpret that data.
The real question is:
Will AI become as normal for traders as indicators and charts are today? 👀
$BTC $ETH
#Binance #Aİ #crypto #BTC
Doomsday-Trader
·0 Likes
·416 views
BTCFallsBelow$84K
708 views
24 Discussing
WinklevossFilesSpotZcashETFApplication
3,248 views
82 Discussing