Research View: March Madness in All Markets
On March 11th, following weeks of growing public recognition of COVID-19’s magnitude, the World Health Organization (WHO) officially declared their assessment of the Coronavirus to be a pandemic. This declaration effectively confirmed investors’ worst fears about the economic impact of COVID-19 on global supply chains and the overall economy.
On March 12th, as traders moved to de-risk by exiting their positions in favor of liquid assets, global equity markets began selling off in earnest. With investors exiting the market en masse, the S&P 500’s Level 1 circuit breaker limits were repeatedly surpassed, resulting in multiple trading halts that week. Interestingly, this series of events also led to various debates about circuit breakers in cryptocurrencies, following the massive drop in the price of Bitcoin on March 12 (). In addition to the broader sell-off, investors holding leveraged positions were at risk of being closed, which increased the aggregate need for cash, expediting a major liquidity crisis. To meet this need for cash, many investors were likely forced to sell assets across all liquid markets, including Bitcoin and other cryptocurrencies in their asset portfolio.
In response to this market fallout, the world’s central banks and governments have taken aggressive countermeasures to protect against an economic downturn that now looks to be inevitable. Last week, the G20 announced that it would inject more than $5 trillion into the global economy to limit job and income losses to tackle the COVID-19 pandemic.
To highlight, here are a few of the major ongoing policy actions amongst countries:
Coordinated action to enhance liquidity provision via swap lines between 6 major central banks to provide US dollar funding.
Domestic interest rates being cut worldwide by up to 150 basis points.
Unlimited and open-ended QE by the Federal Reserve.
The largest aid package in history ($2.2 trillion).
A reduction in reserve requirement ratios to zero percent.
Suspension of limits on EU government borrowing.
South Korean government’s emergency cash payments to nearly all families.
India’s 1.7 trillion rupee stimulus plan including cash transfers & food security measures.
In this uncertain macroeconomic environment, investors may be looking for alternatives that can better protect their wealth from the inflation brought about by recent monetary stimulus and policy changes.
Will Bitcoin and other cryptocurrencies rebound amidst the macro-uncertainty and flight to alternative assets?
Views from Binance Trading: Have we hit the bottom yet?

This section has been prepared by Binance Trading, one of the world’s most liquid OTC desks for cryptocurrencies and digital assets1. The content reflects the views of Binance Trading solely.
This month was characterized by “Black Thursday” on March 12th when BTC crashed by $2,000, and fell all the way down to $3,800 the day after in derivatives markets. Derivatives markets at times were trading at $1,000+ below spot markets during this time period, showing what a frenzy the markets were in, and funding rates subsequently flipped negative by significant amounts. Perhaps the only small positive for the crypto community was that crypto was not the only market that fell, as traditional markets across the world also crashed while coming into grips with the impacts of a worldwide pandemic.
Before Black Thursday, the OTC desk did not see a significantly high amount of sell flows, indicating that most traders were not anticipating the crash that was to come. There was a higher amount of sell flows in the following days even though the markets slowly started to recover, and it seemed as though the market was scared of another crash. It was not until BTC hit $6,000 again where we saw a more even buy-sell ratio. As BTC stabilized mostly above $6,000, the altcoin markets also stabilized and the desk saw relatively strong buy flows for mid-cap alts.
As mentioned earlier, BTC moved with the traditional markets fairly closely this month, giving doubt to the narrative of BTC as a safe haven asset. In a poll from our Trading Telegram channel, 21% of respondents said that the first quarter of this year changed their opinions about BTC as a safe haven asset. If BTC continues to be correlated with the traditional markets, there seems to be a dichotomy in the crypto community, where BTC holders would have to hope that government stimulus packages end up helping the markets. At the same time, some of these stimulus packages involve printing money, which goes against one of the main ideologies of BTC.
A few key questions going forward regarding BTC price direction will be:
Will BTC decouple?
Will stimulus packages continue to have an effect?
How much more of an impact will COVID-19 have?
Finally, the Binance OTC Trading Portal was released this month! Traders can now request for quotes (RFQ), 24/7, to limit slippage on large trades and receive quick settlement directly into their Binance accounts.
Crypto spot markets
Table 1 - Overview of the largest assets by market cap (EOM - March 2020)
Ticker | Name | Monthly price change (%) | Average daily Binance volume (USDT) | Monthly avg. volume change (%) | Marketcap (EOM - USD) |
|---|---|---|---|---|---|
Bitcoin | -25.6% | 857.7 M | 47.6% | 117.81 B | |
Ethereum | -40.2% | 256.9 M | 3.2% | 14.97 B | |
XRP | -25.2% | 66.7 M | -35.6% | 7.67 B | |
Bitcoin Cash | -29.6% | 78.0 M | -13.8% | 4.03 B | |
Litecoin | -33.6% | 50.7 M | -34.2% | 2.53 B | |
BNB | -35.9% | 87.4 M | -6.9% | 1.96 B | |
EOS | -37.7% | 54.9 M | -26.0% | 2.05 B | |
Stellar | -29.1% | 7.3 M | -61.1% | 0.83 B | |
Cardano | -36.4% | 17.0 M | -43.8% | 0.79 B | |
Monero | -28.5% | 10.2 M | -26.7% | 0.84 B |
Table 2 - Monthly top 3 gainers on Binance.com in March 2020
Table 3 - Monthly top 3 losers on Binance.com in March 2020
In previous reports, we defined Bitcoin trading dominance, such as:
Sources: Binance Research.
Chart 1 - Bitcoin monthly trading dominance on Binance.com

Sources: Binance.com, Binance Research.
Despite our early questioning regarding whether a potential alt-season was about to start, recent market conditions brought Bitcoin’s trading dominance back to its long-term average, at levels not seen since August 2019.
Table 4 - New asset listings on Binance.com March 2020
Ticker | Name | Pair asset(s) | Listing date |
|---|---|---|---|
BKRW | Binance KRW | BTC, ETH, BNB | April 6th |
STP Network | BTC, BNB, USDT | March 25th |
On-chain markets on Binance DEX

In March, Binance DEX displayed major activity with 12 new listings, including 8 leveraged tokens from FTX. It had 135 pairs as of April 2nd.
Table 5 - New DEX listings in March 2020
Ticker | Name | Pair asset(s) | Listing date |
|---|---|---|---|
TRX | Tron BEP-2 | BNB | March 23rd |
BTT | BitTorrent BEP-2 | BNB | March 23rd |
WIN | WINk BEP-2 | BNB | March 23rd |
AVA | AVA | BUSD | March 30th |
Excluding FTX token listings.
Chart 2 - Daily volume on the Binance DEX since January 2020 (USD million)

Sources: Binance DEX, Binance Research.
As illustrated in chart 2, the daily volume in March on the Binance DEX decreased in the second half of the month, owing to the prices plummeting.
Chart 3 - Top pairs’ contribution to the total volume on Binance DEX in March 2020

Sources: Binance DEX, Binance Research.
Similar to last month, NEXO, VRAB, and AVA were the only three assets with a respective trading contribution to the total volume superior to 10%.
Derivatives markets
This section has been prepared by the team from Binance Futures and reflects solely their views.

In March, Binance Futures marked a new milestone as the product took the lead in BTC perpetual futures markets. Binance Futures’ BTC perpetual contracts rose to the number 1 spot based on daily volumes.
Chart 4 - Exchange 24-hour BTC Futures volumes ($bn)

Source: Skew.com, data recorded on March 31st 2020.
The turmoil across global equity markets triggered a contagion effect on cryptocurrencies. As a result, crypto markets saw volatility rose, which set off waves of panic selling.
The surge in volatility presented ample opportunities for traders, investors, and miners. Owing to the rise in trading activity, Binance Futures recorded an all-time high in daily volume of over USD 7.6 billion.
Binance Futures concluded the month with $96 billion traded across its perpetual contract markets, an increase of +25%from the previous month.
Chart 5 - Daily volume (left) vs. open interest (right) across all perpetual contracts (in USD million)
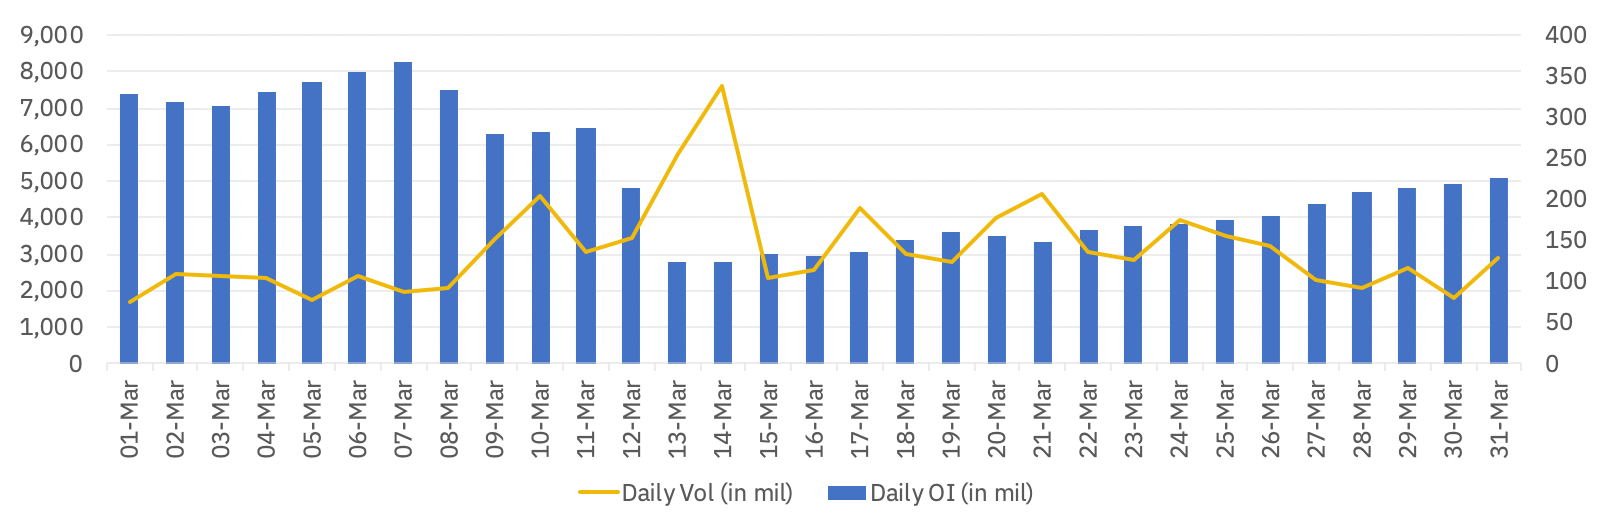
Source: Binance Futures.
As the market went into a selling frenzy, it triggered a series of liquidations across major exchanges. Crypto derivatives exchanges witnessed one of their largest liquidation events ever, as Bitcoin recorded one of its worst trading days in history. As a result, open interest across Binance Futures contracts sharply declined.
Chart 6 - Open interest on Bitcoin and Altcoin perpetual markets in March 2020 (in USD million)

Source: Binance Futures.
Total open interest on Binance Futures fell from USDT 367 million to USDT 123 million, a decline of more than 60% in a matter of days. Open interest in BTC/USDT sharply declined from its peak of USDT 212 million to a low of USDT 79 million, while open interest across altcoin contracts fell more than 70% to a low of USDT 39 million.
Chart 7 - Bitcoin’s open interest dominance in March (daily)

Source: Binance Futures.
As BTC prices plunge below $5000, many investors saw the opportunity to buy Bitcoin at depressed prices . As such, Bitcoin’s open interest dominance rose from under 60% to 70% following the sell-off. This suggests that value-investors have accumulated long positions in anticipation of a price recovery.
Chart 8 - BTC/USDT daily long/short ratio in March

Source: Binance Futures.
Following the sell-off, trader sentiments on Binance Futures turned bearish as the number of short positions dramatically increased. Prior to the sell-off, more than 60% of positions are long positions. After a series of liquidations on these long positions, traders began to pile on short positions to jump on board the downtrend. As a result, the percentage of long positions fell to a low of 38.6%.
Staking and lending markets
Binance Staking offers passive rewards for many cryptoassets supported by Binance. To learn more about Binance’s staking offerings, please visit the Binance Staking’s page.

Binance added three projects to its staking offering in March, with TROY (Launchpad), ARPA (Binance Dex, Community Vote Winner), and EOS supported. This brings the total amount of live staking projects up to 20. Notably, Troy’s staking interest yield takes the top stop of the interest yield on Binance, offering 15% APY to users.
Additionally, ARPA completed a round of fixed term lending with 15% APR for 30 days.
Binance also reached a new milestone, distributing $11 million in staking rewards to users during the first quarter of 2020.
Chart 9 - Expected yields (%) for assets supported for staking on Binance.com

Sources: Binance Staking, Binance Research.
If you wish to trade large amounts with a quick settlement procedure and competitive quotes, please try our Binance OTC Trading Portal. If you have any questions, reach out to one of our authorized traders on the Binance Trading Telegram channel or send an email to tradedesk1@binance.com.↩