

币圈掘金人
7.2k Posts

币圈掘金人
Report
Block User
币圈掘金人,加密世界的财富勘探者。以冷静目光审视波动,以专业工具捕捉机遇。在区块链的矿脉中,执着的前行者,于代码浪潮间筛选真金。不追逐狂热,只深耕价值——在比特与字节的新大陆,做时间的朋友。行业先锋,永远在冷静与狂热之间,寻找下一个确定性。
Open Trade
Frequent Trader
8 Years
2.4K+ Following
13.0K+ Followers
6.6K+ Liked
Posts
Portfolio
All
Quotes
Videos
·
--
Article
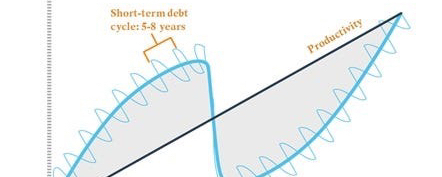
Bitcoin Under Debt-Machine Roar: When Dalio Meets the 2026 Q4 Crypto MarketRay Dalio’s “economic machine,” explained in 42 minutes, is now sending a harsh screech through the crypto market in October 2026. Bitcoin is hovering around $83,000, down 34% from the record high of $126,000 on October 12, 2025, yet it has still surged 44% within 90 days. This isn’t just simple price movement; it’s the inevitable result of the triple overlap of the short-term debt cycle (the Fed hiking rates to 3.75%–4%), the long-term debt cycle (the global debt-to-GDP ratio approaching historical extremes), and the productivity revolution (AI and tokenization). When the Fed faces a 64% probability of a rate decision on October 27–28, when Brent crude breaks above $100, and when daily inflows into Bitcoin ETFs plunge from $1 billion to $134 million—then we’re standing right at the critical point of what Dalio calls the “policy leverage failure.” This article will use the underlying logic of the economic machine to break down the crypto market’s true position right now, and provide actionable asset allocation principles.
Bitcoin Under Debt-Machine Roar: When Dalio Meets the 2026 Q4 Crypto Market
Ray Dalio’s “economic machine,” explained in 42 minutes, is now sending a harsh screech through the crypto market in October 2026. Bitcoin is hovering around $83,000, down 34% from the record high of $126,000 on October 12, 2025, yet it has still surged 44% within 90 days. This isn’t just simple price movement; it’s the inevitable result of the triple overlap of the short-term debt cycle (the Fed hiking rates to 3.75%–4%), the long-term debt cycle (the global debt-to-GDP ratio approaching historical extremes), and the productivity revolution (AI and tokenization). When the Fed faces a 64% probability of a rate decision on October 27–28, when Brent crude breaks above $100, and when daily inflows into Bitcoin ETFs plunge from $1 billion to $134 million—then we’re standing right at the critical point of what Dalio calls the “policy leverage failure.” This article will use the underlying logic of the economic machine to break down the crypto market’s true position right now, and provide actionable asset allocation principles.
51
6
282
·
--
Article
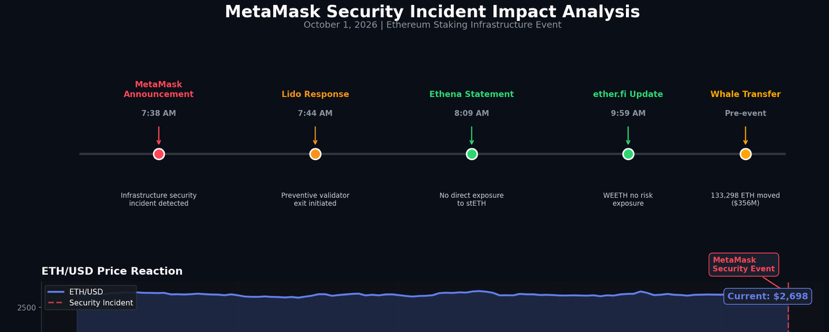
In-Depth Analysis of the MetaMask Staking Infrastructure Security Incident: Ethereum’s “Stress Test” and Market TakeawaysOn the morning of October 1, MetaMask Staking (formerly Consensys Staking) announced that some of its core infrastructure had suffered a security incident. As a precautionary measure, its Ethereum validators operating on Lido have begun主动退出 (voluntarily exiting) . The incident briefly drew market attention, but as of the time of writing, the ETH price has only fluctuated slightly, suggesting that the market’s “immunity” to such security events has been significantly strengthened. This article offers an in-depth analysis of the full picture of the incident, lays out a timeline of responses from various parties, assesses the actual impact on the Ethereum ecosystem, and discusses the long-term lessons this event holds for the security of decentralized staking infrastructure.
In-Depth Analysis of the MetaMask Staking Infrastructure Security Incident: Ethereum’s “Stress Test” and Market Takeaways
On the morning of October 1, MetaMask Staking (formerly Consensys Staking) announced that some of its core infrastructure had suffered a security incident. As a precautionary measure, its Ethereum validators operating on Lido have begun主动退出 (voluntarily exiting) . The incident briefly drew market attention, but as of the time of writing, the ETH price has only fluctuated slightly, suggesting that the market’s “immunity” to such security events has been significantly strengthened. This article offers an in-depth analysis of the full picture of the incident, lays out a timeline of responses from various parties, assesses the actual impact on the Ethereum ecosystem, and discusses the long-term lessons this event holds for the security of decentralized staking infrastructure.
20
2
390
·
--
Article
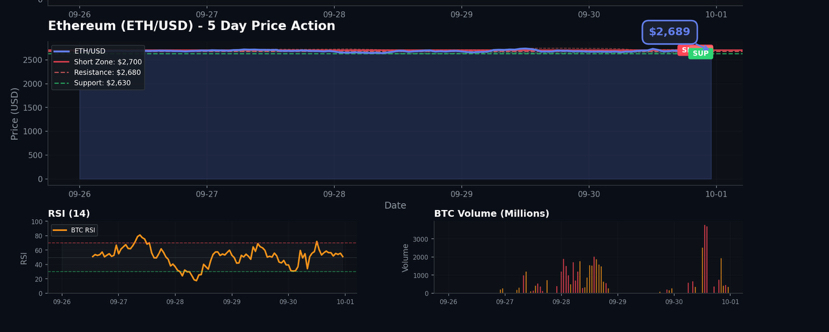
Oct 1 BTC/ETH Morning Strategy: After PCE-positive news, the rally fades and reverses—selling on rallies remains the main themeOn the first day of National Day, the cryptocurrency market continues to trade in a choppy range with ongoing consolidation and adjustment. Bitcoin is currently at $83,699, down slightly by 0.25% over the past 24 hours; Ethereum is at $2,689, essentially flat. After yesterday’s PCE data was released, bulls pushed higher to the $85,600 area on the news, but were quickly suppressed by strong bears and promptly fell back, completing a typical “short squeeze/short washout” type of move. On the 4-hour timeframe, the KDJ forms a bearish cross and turns downward; price has pulled back to the middle Bollinger Band, and the weak technical setup remains unchanged. With the Federal Reserve’s October 27–28 interest-rate decision meeting approaching and rate-hike expectations heating up, market risk appetite remains under sustained pressure, and ETF fund inflows have noticeably slowed. Combining the latest intraday market data with the macro backdrop, this article provides an in-depth analysis of the current market structure and offers specific, actionable trading strategies.
Oct 1 BTC/ETH Morning Strategy: After PCE-positive news, the rally fades and reverses—selling on rallies remains the main theme
On the first day of National Day, the cryptocurrency market continues to trade in a choppy range with ongoing consolidation and adjustment. Bitcoin is currently at $83,699, down slightly by 0.25% over the past 24 hours; Ethereum is at $2,689, essentially flat. After yesterday’s PCE data was released, bulls pushed higher to the $85,600 area on the news, but were quickly suppressed by strong bears and promptly fell back, completing a typical “short squeeze/short washout” type of move. On the 4-hour timeframe, the KDJ forms a bearish cross and turns downward; price has pulled back to the middle Bollinger Band, and the weak technical setup remains unchanged. With the Federal Reserve’s October 27–28 interest-rate decision meeting approaching and rate-hike expectations heating up, market risk appetite remains under sustained pressure, and ETF fund inflows have noticeably slowed. Combining the latest intraday market data with the macro backdrop, this article provides an in-depth analysis of the current market structure and offers specific, actionable trading strategies.
71
8
462
·
--
Article
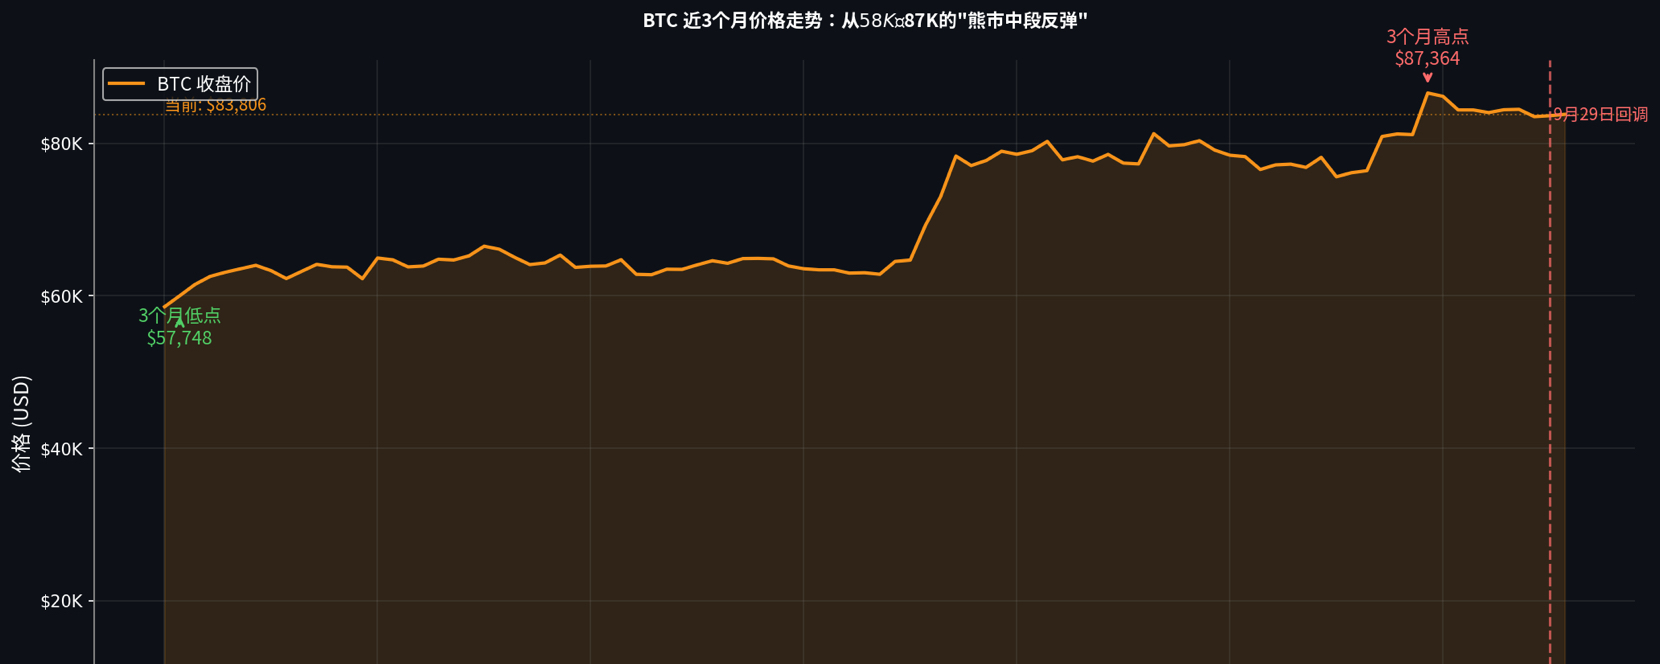
A "silent rebound" in the middle of a bear market: when institutions build a moat with put options, how should retail investors position themselves?September 29, Greeks.live analyst Adam characterized this round of Bitcoin pullback as a "mid-bear-market rebound." His core rationale is the triple contradiction shown in the options market: while prices rebound, implied volatility (IV) does not rise but instead falls to around 35%; the share of trading volume in large-size put options is as high as one-third; and the market’s expectations for subsequent volatility are extremely low. Combined with the latest market data—BTC rebounded from about $58K in early July all the way to $87K in mid-September, then pulled back and is currently consolidating around $83K—this article delves into the institutional behavioral logic behind this "low-volatility rebound," reveals the potential crisis of accumulating negative gamma risk, and provides actionable response strategies for investors with different risk appetites.
A "silent rebound" in the middle of a bear market: when institutions build a moat with put options, how should retail investors position themselves?
September 29, Greeks.live analyst Adam characterized this round of Bitcoin pullback as a "mid-bear-market rebound." His core rationale is the triple contradiction shown in the options market: while prices rebound, implied volatility (IV) does not rise but instead falls to around 35%; the share of trading volume in large-size put options is as high as one-third; and the market’s expectations for subsequent volatility are extremely low. Combined with the latest market data—BTC rebounded from about $58K in early July all the way to $87K in mid-September, then pulled back and is currently consolidating around $83K—this article delves into the institutional behavioral logic behind this "low-volatility rebound," reveals the potential crisis of accumulating negative gamma risk, and provides actionable response strategies for investors with different risk appetites.
52
4
560
·
--
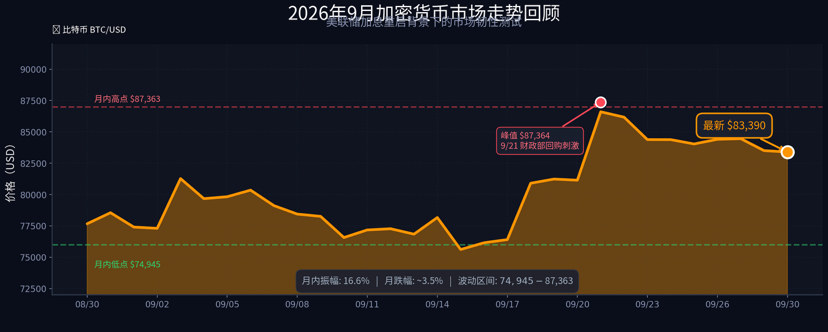
Article
The Crypto Market Under the Restart of the Rate-Hike Cycle: Bitcoin Seeking a New Balance Between the "Currency Devaluation Trade" and "Liquidity Draining"September 2026 saw a profound shift in the global macro environment: after a three-year pause, the Federal Reserve restarted rate hikes, raising the federal funds rate to a 3.75%-4.00% range; the yield on the 10-year U.S. Treasury climbed to 5.20%, the highest level since 2007; and the yield on the 30-year U.S. Treasury broke above 5.5%, setting a new 22-year high. However, contrary to conventional expectations, Bitcoin did not collapse during the rate-hike cycle. Instead, it demonstrated rare resilience within a range of $75,000 to $87,000. This article provides an in-depth analysis of the dual-force game currently facing the crypto market: on one side, renewed liquidity tightening pressure brought about by the Federal Reserve restarting rate hikes; on the other, structural buy-side support re-ignited by the "currency devaluation trade." It also offers forward-looking judgment on market trends in Q4 and practical strategy recommendations.
The Crypto Market Under the Restart of the Rate-Hike Cycle: Bitcoin Seeking a New Balance Between the "Currency Devaluation Trade" and "Liquidity Draining"
September 2026 saw a profound shift in the global macro environment: after a three-year pause, the Federal Reserve restarted rate hikes, raising the federal funds rate to a 3.75%-4.00% range; the yield on the 10-year U.S. Treasury climbed to 5.20%, the highest level since 2007; and the yield on the 30-year U.S. Treasury broke above 5.5%, setting a new 22-year high. However, contrary to conventional expectations, Bitcoin did not collapse during the rate-hike cycle. Instead, it demonstrated rare resilience within a range of $75,000 to $87,000. This article provides an in-depth analysis of the dual-force game currently facing the crypto market: on one side, renewed liquidity tightening pressure brought about by the Federal Reserve restarting rate hikes; on the other, structural buy-side support re-ignited by the "currency devaluation trade." It also offers forward-looking judgment on market trends in Q4 and practical strategy recommendations.
66
1
7
388
·
--
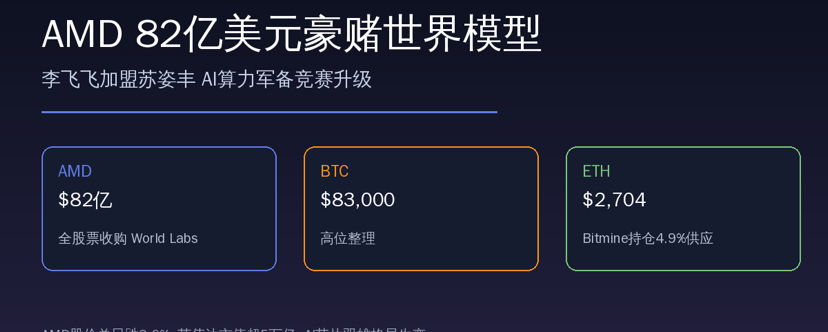
Article
AMD’s $8.2 Billion Acquisition of World Labs: How Fei-Fei Li Joining Xu Zifeng and the AI Compute Arms Race Reshape the Logic Behind Crypto Assets?September 29, AMD announced an $8.2 billion all-stock acquisition of World Labs, founded by “the AI godmother” Fei-Fei Li. Not only does this deal signal that the rivalry between the two AI-chip giants has entered a new battleground—the “world model” arena—but at the macro level it also creates a subtle resonance with the crypto market. As AMD and Nvidia launch an arms race to capture the entry point for next-generation AI compute, Ethereum is emerging—thanks to institutional treasury allocations and staking rewards—as a core asset of the “on-chain settlement layer.” This article breaks down the strategic logic behind the deal and explores the deep connections between the expansion of AI compute and the capture of value by crypto assets.
AMD’s $8.2 Billion Acquisition of World Labs: How Fei-Fei Li Joining Xu Zifeng and the AI Compute Arms Race Reshape the Logic Behind Crypto Assets?
September 29, AMD announced an $8.2 billion all-stock acquisition of World Labs, founded by “the AI godmother” Fei-Fei Li. Not only does this deal signal that the rivalry between the two AI-chip giants has entered a new battleground—the “world model” arena—but at the macro level it also creates a subtle resonance with the crypto market. As AMD and Nvidia launch an arms race to capture the entry point for next-generation AI compute, Ethereum is emerging—thanks to institutional treasury allocations and staking rewards—as a core asset of the “on-chain settlement layer.” This article breaks down the strategic logic behind the deal and explores the deep connections between the expansion of AI compute and the capture of value by crypto assets.
62
1
6
364
·
--
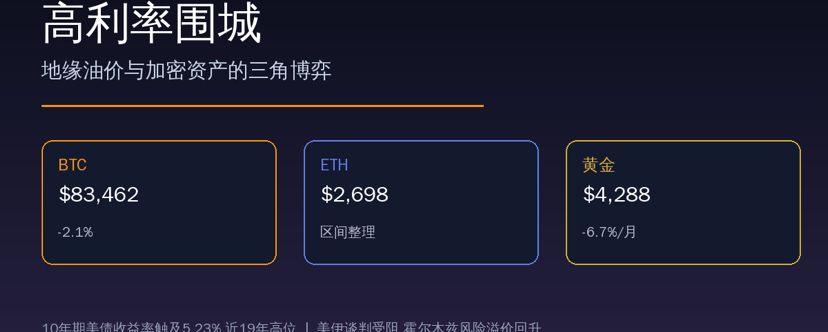
Article
High-Interest-Rate Siege: The Triangular Game Between Geopolitical Oil Prices, US Treasury Yields, and Crypto AssetsThe global market is currently being dominated by a clear transmission chain—stalled US-Iran negotiations are pushing up oil prices and inflation expectations, while the yield on 10-year US Treasuries has hit a near-19-year high of 5.23%. Under the double blow of high interest rates and a strong US dollar, US stocks and gold are under pressure, while the crypto market is showing structural divergence amid macro headwinds and an ongoing tug-of-war involving institutional accumulation. Ethereum has demonstrated rare resilience thanks to sustained weekly institutional buying such as Bitmine (holdings have surpassed 6 million ETH, accounting for 4.9% of supply). $2,700 is a key dividing line between bulls and bears. This article breaks down the logic behind this complex landscape and explores potential breakout scenarios for Q4.
High-Interest-Rate Siege: The Triangular Game Between Geopolitical Oil Prices, US Treasury Yields, and Crypto Assets
The global market is currently being dominated by a clear transmission chain—stalled US-Iran negotiations are pushing up oil prices and inflation expectations, while the yield on 10-year US Treasuries has hit a near-19-year high of 5.23%. Under the double blow of high interest rates and a strong US dollar, US stocks and gold are under pressure, while the crypto market is showing structural divergence amid macro headwinds and an ongoing tug-of-war involving institutional accumulation. Ethereum has demonstrated rare resilience thanks to sustained weekly institutional buying such as Bitmine (holdings have surpassed 6 million ETH, accounting for 4.9% of supply). $2,700 is a key dividing line between bulls and bears. This article breaks down the logic behind this complex landscape and explores potential breakout scenarios for Q4.
66
1
4
509
·
--

Article
A single tweet ignites QNT: From the BIS unified ledger to the TCH partnership—was this breakout fueled by a new narrative or just an old bottle with a new label?Quant (QNT) surged as analysts publicly issued trading calls, with its single-day high rise reaching 145%, jumping 430% over four days, and then falling nearly 30% from the highs within a short period. The rise in QNT was not merely a matter of sentiment-driven speculation; it was driven by a combination of factors, including cooperation with the U.S. clearing organization TCH, the BIS unified ledger narrative, expectations around the Agora project, and the “historic halo” of a 2013 Bitcoin trading call. This article will break down the logic behind the rally, identify key risk points, and provide a practical tracking framework.
The crypto market is never short of stories about how a single sentence can change one’s fate, but cases like Quant (QNT)—which was pulled into a nearly twofold rally directly by a social media post—are still hard to overlook.
A single tweet ignites QNT: From the BIS unified ledger to the TCH partnership—was this breakout fueled by a new narrative or just an old bottle with a new label?
Quant (QNT) surged as analysts publicly issued trading calls, with its single-day high rise reaching 145%, jumping 430% over four days, and then falling nearly 30% from the highs within a short period. The rise in QNT was not merely a matter of sentiment-driven speculation; it was driven by a combination of factors, including cooperation with the U.S. clearing organization TCH, the BIS unified ledger narrative, expectations around the Agora project, and the “historic halo” of a 2013 Bitcoin trading call. This article will break down the logic behind the rally, identify key risk points, and provide a practical tracking framework.
The crypto market is never short of stories about how a single sentence can change one’s fate, but cases like Quant (QNT)—which was pulled into a nearly twofold rally directly by a social media post—are still hard to overlook.
The crypto market is never short of stories about how a single sentence can change one’s fate, but cases like Quant (QNT)—which was pulled into a nearly twofold rally directly by a social media post—are still hard to overlook.
20
3
420
·
--

Article
A Super-Macro Week Is Coming! Core PCE + Heavy Fed Commentary + Nonfarm Payrols—Crypto May Face a Major Reality CheckAfter a round of fake-and-follow mass rallying, the most uncertain variable in the crypto market is no longer just on-chain liquidity and in-market sentiment, but rather a repricing coming from the U.S. macro side. Over the coming week, key releases such as core PCE, ADP, and Nonfarm Payrolls, along with a flurry of remarks from multiple Federal Reserve officials, combined with major earnings reports from U.S. equities, will directly reshape rate expectations for the October FOMC meeting. We will fully break down event priority, the different market-play scenarios tied to each data release, and practical monitoring and risk-control approaches that ordinary people can actually implement.
In recent times, many people’s attention has been focused on the on-chain side: Total2 continues to rise, many low-quality tokens have moved above the 200-day moving average, and whale transfers along with ETF fund flows have become key topics of discussion.
A Super-Macro Week Is Coming! Core PCE + Heavy Fed Commentary + Nonfarm Payrols—Crypto May Face a Major Reality Check
After a round of fake-and-follow mass rallying, the most uncertain variable in the crypto market is no longer just on-chain liquidity and in-market sentiment, but rather a repricing coming from the U.S. macro side. Over the coming week, key releases such as core PCE, ADP, and Nonfarm Payrolls, along with a flurry of remarks from multiple Federal Reserve officials, combined with major earnings reports from U.S. equities, will directly reshape rate expectations for the October FOMC meeting. We will fully break down event priority, the different market-play scenarios tied to each data release, and practical monitoring and risk-control approaches that ordinary people can actually implement.
In recent times, many people’s attention has been focused on the on-chain side: Total2 continues to rise, many low-quality tokens have moved above the 200-day moving average, and whale transfers along with ETF fund flows have become key topics of discussion.
In recent times, many people’s attention has been focused on the on-chain side: Total2 continues to rise, many low-quality tokens have moved above the 200-day moving average, and whale transfers along with ETF fund flows have become key topics of discussion.
83
1
8
449
·
--
Article
87% of altcoins are above the 200-day moving average! Behind the $371 billion surge, a set of dangerous signals has already lit upFrom June to now, Total2 (including ETH, excluding BTC) has absorbed over $371 billion in net inflows, up 45%. The vast majority of altcoins have escaped the long-term bear-market structure, and the market has entered a broad-based rally frenzy. But CryptoQuant’s latest on-chain data shows something at the same time: a sharp rebound in exchange deposits, and Total2 displaying a bearish RSI divergence. Is this truly the start of an altcoin season, or is it a phase of distribution that requires high vigilance? We won’t hype bullish or call for bearishness—let’s fully break down the data, historical patterns, and actionable observation criteria for you.
What gives most people the feeling that “the bull market is back” lately is not that BTC is making fresh highs, but that almost everywhere there are altcoins going up.
87% of altcoins are above the 200-day moving average! Behind the $371 billion surge, a set of dangerous signals has already lit up
From June to now, Total2 (including ETH, excluding BTC) has absorbed over $371 billion in net inflows, up 45%. The vast majority of altcoins have escaped the long-term bear-market structure, and the market has entered a broad-based rally frenzy. But CryptoQuant’s latest on-chain data shows something at the same time: a sharp rebound in exchange deposits, and Total2 displaying a bearish RSI divergence. Is this truly the start of an altcoin season, or is it a phase of distribution that requires high vigilance? We won’t hype bullish or call for bearishness—let’s fully break down the data, historical patterns, and actionable observation criteria for you.
What gives most people the feeling that “the bull market is back” lately is not that BTC is making fresh highs, but that almost everywhere there are altcoins going up.
What gives most people the feeling that “the bull market is back” lately is not that BTC is making fresh highs, but that almost everywhere there are altcoins going up.
139
8
561
·
--

Article
UNI Rises on the Tokenized Stock Wave: But the Real Value Reassessment Isn’t Just About Trading VolumeBase chain tokenized stock trading has recently surged. In the past 30 days, spot DEX trading volume was about $1.3 billion, up about 153.8% versus the previous 30 days. Uniswap v4, as the second-largest trading venue for this sector on the Base chain, handled roughly $139 million in trading volume during the same period. Uniswap’s opportunity comes from two angles: first, “permissioned pools” enable regulated assets to run on AMMs; second, after “UNI unification,” the loop is completed—protocol fees, buybacks and token burns, and value capture from the tokens. However, UNI’s pricing should not be judged solely by short-term trading volume. It also depends on whether fee income can remain sustainable, whether tokenized stocks can expand institutional penetration, and the risks behind whale positions.
UNI Rises on the Tokenized Stock Wave: But the Real Value Reassessment Isn’t Just About Trading Volume
Base chain tokenized stock trading has recently surged. In the past 30 days, spot DEX trading volume was about $1.3 billion, up about 153.8% versus the previous 30 days. Uniswap v4, as the second-largest trading venue for this sector on the Base chain, handled roughly $139 million in trading volume during the same period. Uniswap’s opportunity comes from two angles: first, “permissioned pools” enable regulated assets to run on AMMs; second, after “UNI unification,” the loop is completed—protocol fees, buybacks and token burns, and value capture from the tokens. However, UNI’s pricing should not be judged solely by short-term trading volume. It also depends on whether fee income can remain sustainable, whether tokenized stocks can expand institutional penetration, and the risks behind whale positions.
872
2
46
872
·
--
Article
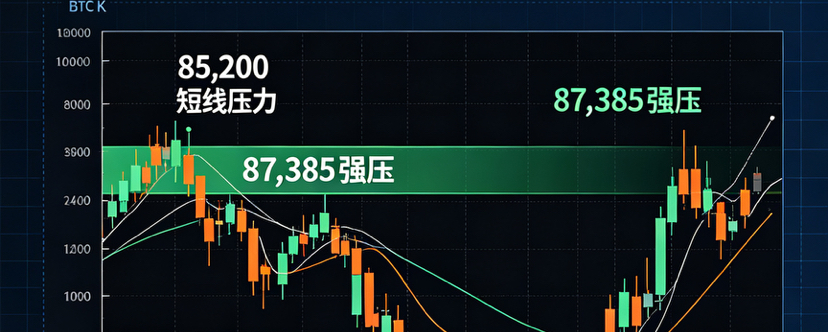
BTC stuck in choppy trading around 84,000: the trend hasn’t turned bad, but short-term action needs to wait for key levelsBTC surged to 87,385 once after the rate hike was implemented, then pulled back to around 82,800. It is currently mainly fluctuating around 84,000, which belongs to the repair phase after the rally. ETF flows are showing slight in-and-out movement; US stock market volatility can easily drive BTC to spike briefly, and the order book is clearly being pulled back and forth repeatedly. As long as the daily chart has not effectively broken below 83,000, the larger bullish trend should not be easily dismissed. On the 4-hour timeframe, after a second dip near 82,800, the lows have risen, suggesting a small double-bottom structure. On the 1-hour timeframe, 83,000—82,800 forms a short-term support zone. BTC can be watched for a range-long entry within 83,500—82,800, with the first target at 84,500 and then 85,200. For ETH, you can look to go long around 2,675, with the first target at 2,742 and then 2,780.
BTC stuck in choppy trading around 84,000: the trend hasn’t turned bad, but short-term action needs to wait for key levels
BTC surged to 87,385 once after the rate hike was implemented, then pulled back to around 82,800. It is currently mainly fluctuating around 84,000, which belongs to the repair phase after the rally. ETF flows are showing slight in-and-out movement; US stock market volatility can easily drive BTC to spike briefly, and the order book is clearly being pulled back and forth repeatedly. As long as the daily chart has not effectively broken below 83,000, the larger bullish trend should not be easily dismissed. On the 4-hour timeframe, after a second dip near 82,800, the lows have risen, suggesting a small double-bottom structure. On the 1-hour timeframe, 83,000—82,800 forms a short-term support zone. BTC can be watched for a range-long entry within 83,500—82,800, with the first target at 84,500 and then 85,200. For ETH, you can look to go long around 2,675, with the first target at 2,742 and then 2,780.
7
2
360
·
--
Article
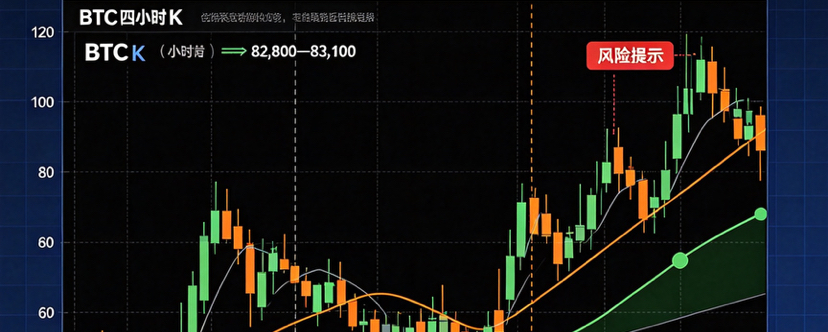
BTC stabilizes after two tests of 82,800—83,100: before the double bottom is confirmed, watch whether 83,130 can holdBTC late Friday early hours dipped to 82,832, then quickly repaired; later in the evening it again met resistance and slipped to 83,301. It did not break below the prior low. On the four-hour timeframe, a double-bottom testing structure has formed in the 82,800—83,100 area. This pullback was mainly driven by the concentrated profit-taking by longs, a weakening macro sentiment, and liquidation cascades of leveraged long positions. However, since no major new negative catalyst has materialized, the selling pressure was unable to sustain. Currently, BTC is finding support above the lower band of the Bollinger Bands. The MACD is still crossing down (a bearish cross), but the histogram for downside momentum is shrinking, suggesting a potential short-term exhaustion rebound. For BTC, look for long opportunities if 83,130 holds and does not break. The first target is 84,100; after breaking the previous high, then look for higher levels. For ETH, look for long opportunities if 2,626 holds and does not break. The first target is 2,716; after a breakout, then look for 2,742.
BTC stabilizes after two tests of 82,800—83,100: before the double bottom is confirmed, watch whether 83,130 can hold
BTC late Friday early hours dipped to 82,832, then quickly repaired; later in the evening it again met resistance and slipped to 83,301. It did not break below the prior low. On the four-hour timeframe, a double-bottom testing structure has formed in the 82,800—83,100 area. This pullback was mainly driven by the concentrated profit-taking by longs, a weakening macro sentiment, and liquidation cascades of leveraged long positions. However, since no major new negative catalyst has materialized, the selling pressure was unable to sustain. Currently, BTC is finding support above the lower band of the Bollinger Bands. The MACD is still crossing down (a bearish cross), but the histogram for downside momentum is shrinking, suggesting a potential short-term exhaustion rebound. For BTC, look for long opportunities if 83,130 holds and does not break. The first target is 84,100; after breaking the previous high, then look for higher levels. For ETH, look for long opportunities if 2,626 holds and does not break. The first target is 2,716; after a breakout, then look for 2,742.
62
5
715
·
--
Article
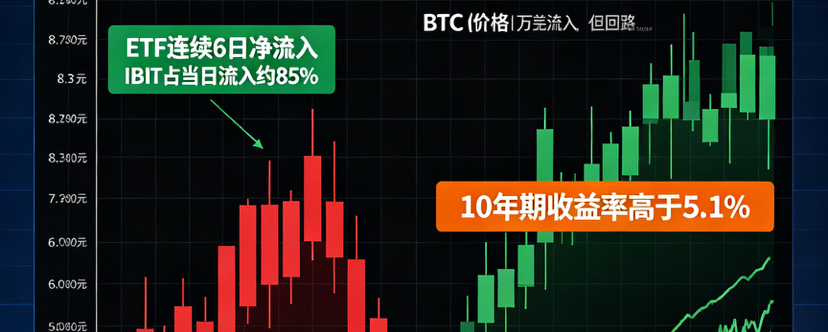
BTC Price Pulls Back, but ETFs See 6 Straight Days of Net Inflows: This Time, Institutions Didn’t RunBTC fell from above $87,000 to around $83,000; meanwhile, spot BTC ETFs have still maintained continuous net inflows for 6 straight days. On September 24, the single-day net inflow was about $191 million, of which BlackRock’s IBIT accounted for about $163 million—roughly 85% of the day’s total inflows. In the same period, the crypto market saw about $617 million in liquidations, including approximately $546 million from long liquidations. This suggests that this pullback looks more like leveraged long positions being flushed out, rather than a collective retreat by spot institutional investors. The real tipping point right now isn’t whether BTC rises or falls on a given day; it’s whether ETF net inflows can keep up, and whether BTC can reclaim and hold above the $84,000–$85,000 range.
BTC Price Pulls Back, but ETFs See 6 Straight Days of Net Inflows: This Time, Institutions Didn’t Run
BTC fell from above $87,000 to around $83,000; meanwhile, spot BTC ETFs have still maintained continuous net inflows for 6 straight days. On September 24, the single-day net inflow was about $191 million, of which BlackRock’s IBIT accounted for about $163 million—roughly 85% of the day’s total inflows. In the same period, the crypto market saw about $617 million in liquidations, including approximately $546 million from long liquidations. This suggests that this pullback looks more like leveraged long positions being flushed out, rather than a collective retreat by spot institutional investors. The real tipping point right now isn’t whether BTC rises or falls on a given day; it’s whether ETF net inflows can keep up, and whether BTC can reclaim and hold above the $84,000–$85,000 range.
15
2
67
·
--
Verified
Article
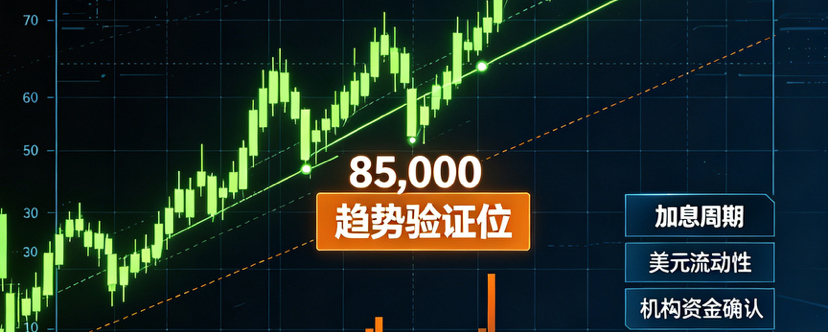
After sentiment cools, what BTC really needs to verify isn’t direction—it’s whether the trend has changedBTC recently saw a strong rally driven by news-cycle catalysts. On September 18 and 21, two long bullish candles propelled the price quickly upward, but it was not followed by sustained momentum; the market has since entered a period of sentiment cooling. The themes of tariffs, AI, and new energy have mostly brought a step-by-step risk-on sentiment rebound, which may not necessarily change the overall liquidity constraints under the current rate-hike cycle. Therefore, the more reasonable approach now is not to alter one’s judgment based on a single day’s bullish candle, but to watch whether BTC near 85,000 can regain and hold above that level, and whether after the news is digested, the inflows continue to provide support. If, after sentiment fades, the price cannot defend key levels, the risk of a subsequent pullback will rise significantly. However, before the trend is confirmed, one should not blindly short or aggressively bottom-fish with heavy positioning.
After sentiment cools, what BTC really needs to verify isn’t direction—it’s whether the trend has changed
BTC recently saw a strong rally driven by news-cycle catalysts. On September 18 and 21, two long bullish candles propelled the price quickly upward, but it was not followed by sustained momentum; the market has since entered a period of sentiment cooling. The themes of tariffs, AI, and new energy have mostly brought a step-by-step risk-on sentiment rebound, which may not necessarily change the overall liquidity constraints under the current rate-hike cycle. Therefore, the more reasonable approach now is not to alter one’s judgment based on a single day’s bullish candle, but to watch whether BTC near 85,000 can regain and hold above that level, and whether after the news is digested, the inflows continue to provide support. If, after sentiment fades, the price cannot defend key levels, the risk of a subsequent pullback will rise significantly. However, before the trend is confirmed, one should not blindly short or aggressively bottom-fish with heavy positioning.
171
2
15
606
·
--
Article
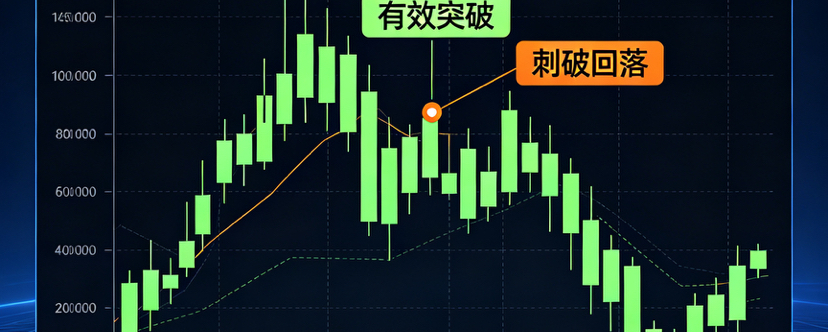
Overnight watch for BTC, ETH, SOL, and BNB: the key is not chasing, but waiting for four-hour close confirmationOverall night market volatility is limited. BTC, ETH, and SOL are all going through a process of re-selection after minor pullbacks at a smaller level. BNB, by contrast, is relatively independent, testing the 750 support. BTC’s key resistance is at 85,000. If the four-hour close can effectively break through and hold, it would suggest the small-level pullback is complete. The initial target would be 86,000–87,000, and after a breakout, then look toward 90,000. If it cannot stabilize above 85,000, wait for a deeper buy opportunity near 81,500. ETH is watching 2,700, SOL is watching 116, and BNB is watching 750. The logic is consistent: first see whether resistance can be reclaimed, then check whether support is valid—don’t chase the pump early.
Overnight watch for BTC, ETH, SOL, and BNB: the key is not chasing, but waiting for four-hour close confirmation
Overall night market volatility is limited. BTC, ETH, and SOL are all going through a process of re-selection after minor pullbacks at a smaller level. BNB, by contrast, is relatively independent, testing the 750 support. BTC’s key resistance is at 85,000. If the four-hour close can effectively break through and hold, it would suggest the small-level pullback is complete. The initial target would be 86,000–87,000, and after a breakout, then look toward 90,000. If it cannot stabilize above 85,000, wait for a deeper buy opportunity near 81,500. ETH is watching 2,700, SOL is watching 116, and BNB is watching 750. The logic is consistent: first see whether resistance can be reclaimed, then check whether support is valid—don’t chase the pump early.
38
1
5
95
·
--
Article
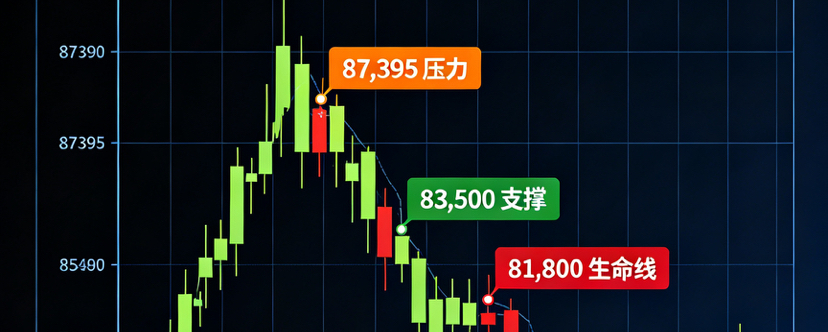
After the whale’s large-scale sell-off: don’t rush to bottom-pick BTC—only act after 83,500 stabilizesBTC started its move at 76,000, and its maximum 7-day rally exceeded 11%. After encountering resistance around 87,395, a period of consecutive bearish declines followed, alongside large whale-scale cash-outs. The current price is about 84,241, down 2.75% over the past 24 hours. The biggest current contradiction is this: the momentum from a higher timeframe uptrend is still present, but short-term profit-taking pressure plus whale sell pressure has already appeared—so it is no longer suitable to blindly chase longs. This article provides a tracking framework for “confirm first before acting”: prioritize watching for opportunities where 83,500–84,200 can stabilize; if 87,395 cannot regain and hold above that level, be alert to high-level distribution. If 81,800 is validly broken to the downside, then give up on catching longs and patiently wait for the next support zone of 79,800–80,500.
After the whale’s large-scale sell-off: don’t rush to bottom-pick BTC—only act after 83,500 stabilizes
BTC started its move at 76,000, and its maximum 7-day rally exceeded 11%. After encountering resistance around 87,395, a period of consecutive bearish declines followed, alongside large whale-scale cash-outs. The current price is about 84,241, down 2.75% over the past 24 hours. The biggest current contradiction is this: the momentum from a higher timeframe uptrend is still present, but short-term profit-taking pressure plus whale sell pressure has already appeared—so it is no longer suitable to blindly chase longs. This article provides a tracking framework for “confirm first before acting”: prioritize watching for opportunities where 83,500–84,200 can stabilize; if 87,395 cannot regain and hold above that level, be alert to high-level distribution. If 81,800 is validly broken to the downside, then give up on catching longs and patiently wait for the next support zone of 79,800–80,500.
111
6
477
·
--
Article
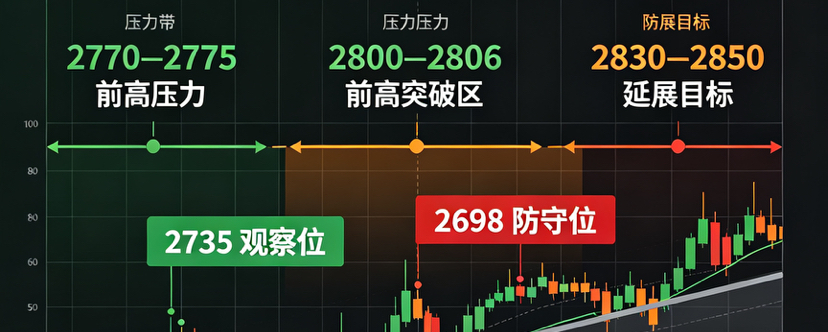
After ETH holds above the Bollinger middle band: why is 2735 still a bullish observation level?ETH is currently trading above the Bollinger middle band. The narrowing of the bands suggests that the short-term bulls and bears are moving into a balance phase, but the price has continued to hold above the middle band. The lower boundary of the range has provided support multiple times, and pullbacks have been limited, so the bullish structure remains intact. Therefore, around 2735 can be used as a bullish observation level, with a stop-loss at 2698. The first target is 2770—2775, the second target is 2800—2806, and the third target is 2830—2850. When price first touches the prior high resistance zone, it is more appropriate to reduce positions by 50% first to lock in part of the profits, then reassess whether the trend continues.
1. Bollinger Bands narrow—why isn't it a weakening signal?
After ETH holds above the Bollinger middle band: why is 2735 still a bullish observation level?
ETH is currently trading above the Bollinger middle band. The narrowing of the bands suggests that the short-term bulls and bears are moving into a balance phase, but the price has continued to hold above the middle band. The lower boundary of the range has provided support multiple times, and pullbacks have been limited, so the bullish structure remains intact. Therefore, around 2735 can be used as a bullish observation level, with a stop-loss at 2698. The first target is 2770—2775, the second target is 2800—2806, and the third target is 2830—2850. When price first touches the prior high resistance zone, it is more appropriate to reduce positions by 50% first to lock in part of the profits, then reassess whether the trend continues.
1. Bollinger Bands narrow—why isn't it a weakening signal?
1. Bollinger Bands narrow—why isn't it a weakening signal?
18
2
313
·
--
Article
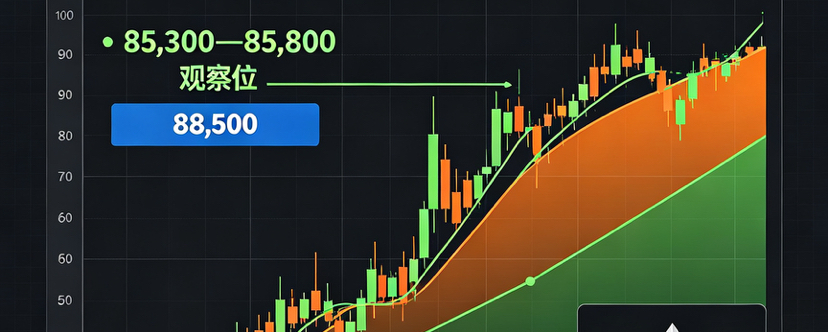
High-Range Consolidation Isn’t a Reversal: The BTC 85300—85800 and ETH 2720—2740 Trend-Following FrameworkAfter BTC recently broke through 85,000, it has entered a high-range consolidation and corrective phase. At the same time, ETH has been stabilizing above 2,700. Judging from the structure, this looks more like a normal pause after a higher-volume move on the weekly chart rather than a trend reversal. As long as the recent highs have not been effectively broken and the lows keep getting higher, the bullish structure remains intact. For BTC, watch for continuation opportunities after a pullback to 85,300—85,800, with a target of 88,500. For ETH, watch the 2,720—2,740 support zone, with a target of 2,820. Right now, it’s more suitable to follow conservatively rather than chase or flip short too early.
1. There wasn’t much movement early in the morning—so why isn’t this the end of the trend?
High-Range Consolidation Isn’t a Reversal: The BTC 85300—85800 and ETH 2720—2740 Trend-Following Framework
After BTC recently broke through 85,000, it has entered a high-range consolidation and corrective phase. At the same time, ETH has been stabilizing above 2,700. Judging from the structure, this looks more like a normal pause after a higher-volume move on the weekly chart rather than a trend reversal. As long as the recent highs have not been effectively broken and the lows keep getting higher, the bullish structure remains intact. For BTC, watch for continuation opportunities after a pullback to 85,300—85,800, with a target of 88,500. For ETH, watch the 2,720—2,740 support zone, with a target of 2,820. Right now, it’s more suitable to follow conservatively rather than chase or flip short too early.
1. There wasn’t much movement early in the morning—so why isn’t this the end of the trend?
1. There wasn’t much movement early in the morning—so why isn’t this the end of the trend?
724
1
24
724
·
--
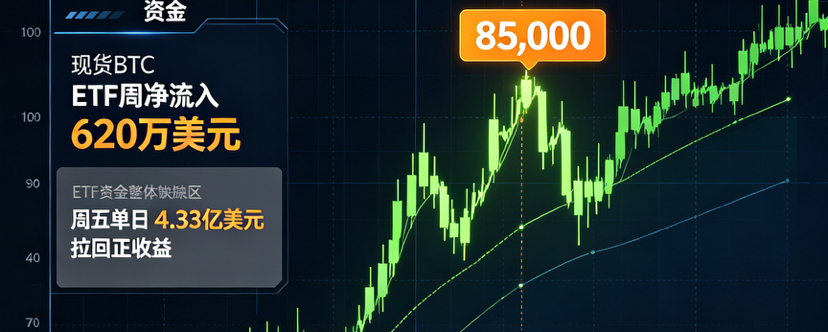
Article
BTC Surges Above 85,000 to an Eight-Month High: ETFs Are Absent—Who’s Supporting This Leg of the RallyBTC touches 85,000 and sets an eight-month high, but this rally shows clear divergence: spot BTC ETF net inflows for the entire week total only $6.2 million. This is the quietest week since ETFs were launched. The week’s price action barely managed to turn positive because a single day on Friday accounted for inflows of $433 million. Judging by the fund structure, the main force pushing prices higher isn’t traditional ETF institutions buying; instead, it’s leverage capital like that from firms such as Strategy, which continuously accumulates coins and releases leverage via on-chain native collateralized lending, combined with policy expectations tied to U.S. legislation related to Bitcoin reserves. The key watershed for the next phase of the market is concentrated in the ETF fund flows over the next two trading days: if capital remains sluggish and prices hold steady above 85,000, it indicates that spot demand has sufficient “quality” and is solid. If funds dry up while prices quickly fall back below 83,000, then the large inflow on Friday was very likely just a month-end rebalancing spike, and the sustainability of the rally will be questionable.
BTC Surges Above 85,000 to an Eight-Month High: ETFs Are Absent—Who’s Supporting This Leg of the Rally
BTC touches 85,000 and sets an eight-month high, but this rally shows clear divergence: spot BTC ETF net inflows for the entire week total only $6.2 million. This is the quietest week since ETFs were launched. The week’s price action barely managed to turn positive because a single day on Friday accounted for inflows of $433 million. Judging by the fund structure, the main force pushing prices higher isn’t traditional ETF institutions buying; instead, it’s leverage capital like that from firms such as Strategy, which continuously accumulates coins and releases leverage via on-chain native collateralized lending, combined with policy expectations tied to U.S. legislation related to Bitcoin reserves. The key watershed for the next phase of the market is concentrated in the ETF fund flows over the next two trading days: if capital remains sluggish and prices hold steady above 85,000, it indicates that spot demand has sufficient “quality” and is solid. If funds dry up while prices quickly fall back below 83,000, then the large inflow on Friday was very likely just a month-end rebalancing spike, and the sustainability of the rally will be questionable.
11
2
67
Log in to explore more content
Join global crypto users on Binance Square
⚡️ Get latest and useful information about crypto.
💬 Trusted by the world’s largest crypto exchange.
👍 Discover real insights from verified creators.
Email / Phone number
Trending Topics
NEARFallsToAround$4.70Down14%
10,866 views
20 Discussing
🚨 $NEAR — FROM ETF HYPE TO A 14% SLAP IN THE FACE.
NEAR has dropped toward $4.70, giving back a big chunk of its recent run after briefly trading above $5.50. The selloff also came as NEAR Intents disclosed a security incident tied to its cross-chain infrastructure, with reported losses around $3.8M. The underlying NEAR blockchain itself was not reported as compromised.
Here’s the part traders should care about:
$4.69–$4.74 is now the key support zone.
Hold it, and this could simply be a violent retest after the September breakout.
Lose it?
The next downside references sit closer to $4.58, then ~$4.30.
And the irony?
The new Bitwise NEAR ETF was still seeing positive inflows around launch week.
So this isn’t a simple “nobody wants NEAR” story.
It’s a battle between:
fresh institutional access
vs.
post-rally profit-taking + security fear.
$NEAR doesn’t need hype right now. It needs $4.70 to hold. 👀
#NEARFallsToAround$4.70Down14% #EvernorthPlansNasdaqListingOct8 #SECProposesCryptoCustodyFramework #IMFApproves$139MDisbursementToElSalvador #AnthropicTargetsIPOAsSoonAsMidNovember
KimHotbae
·0 Likes
·256 views
EthereumFoundationLaunchesZkAPIOnMainnet
3,510 views
118 Discussing
EvernorthPlansNasdaqListingOct8
12,698 views
136 Discussing