


On the first day of National Day, the cryptocurrency market continues to trade in a choppy range with ongoing consolidation and adjustment. Bitcoin is currently at $83,699, down slightly by 0.25% over the past 24 hours; Ethereum is at $2,689, essentially flat. After yesterday’s PCE data was released, bulls pushed higher to the $85,600 area on the news, but were quickly suppressed by strong bears and promptly fell back, completing a typical “short squeeze/short washout” type of move. On the 4-hour timeframe, the KDJ forms a bearish cross and turns downward; price has pulled back to the middle Bollinger Band, and the weak technical setup remains unchanged. With the Federal Reserve’s October 27–28 interest-rate decision meeting approaching and rate-hike expectations heating up, market risk appetite remains under sustained pressure, and ETF fund inflows have noticeably slowed. Combining the latest intraday market data with the macro backdrop, this article provides an in-depth analysis of the current market structure and offers specific, actionable trading strategies.
I. Recap of yesterday’s market: both sides got hit—timing is everything
Wednesday (September 30) provided a textbook example of trading in a ranging market. In the morning, price faced clear pressure around the $83,800 area. After shorting, the market moved lower as expected, reaching a low near $83,000 and capturing an 800-point profit. In the afternoon, price fell back to the lower end of the range around $83,200; setting up a long at that time was perfectly timed. Later, when the PCE data was released in the evening, funds jumped up quickly on the news. The longs were closed at the $84,800 peak, taking a 1,600-point swing profit in one move.
More importantly, when price surged into the $85,400 area, the chart showed clear bull-trap characteristics—trading volume expanded, but price advancement lacked strength, and on the hourly timeframe a long upper wick appeared. At that point, shorting decisively in the opposite direction, targeting $84,000, worked; the market then plunged and finally closed 1,400 points lower.
The core logic behind these three actions is not complicated: **In a ranging market, the boundaries of the range matter more than the trend.** When the market lacks a clear direction, liquidity-dense zones naturally become support and resistance. The sharp rally followed by a pullback after the PCE data release precisely validates the viewpoint we have repeatedly emphasized—that the larger trend remains bearish; short-term upward moves are tools for liquidity harvesting, not signals of a trend reversal.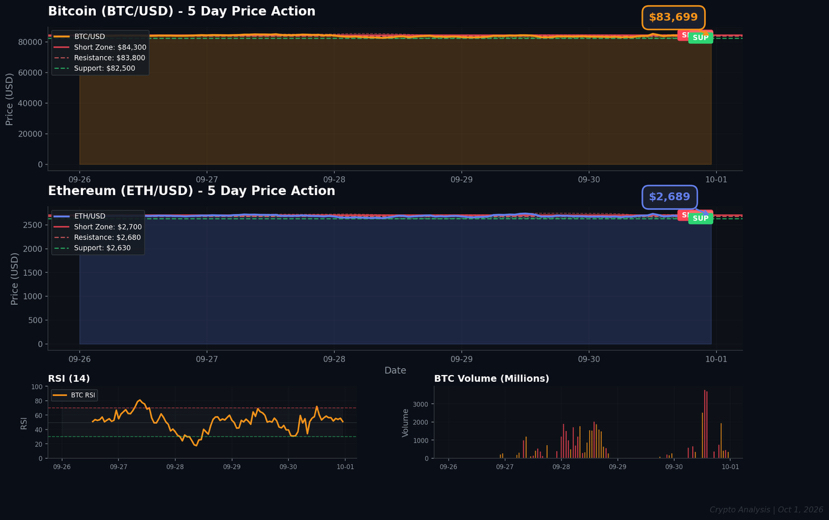
II. Macro environment: hawkish Fed expectations suppress risk assets
The biggest uncertainty facing the current market comes from the Federal Reserve. According to the latest market pricing, the probability of a rate hike at the Oct 27–28 FOMC meeting has risen to 64%, and the 10-year U.S. Treasury yield has climbed to a high of 5.17%. With risk-free yields so attractive, the allocation value of risk assets such as Bitcoin is being reassessed.
Another signal worth watching is changes in ETF fund flows. Bitcoin ETF average daily net inflows have sharply dropped from nearly $1 billion previously to $134 million, showing that the momentum of institutional capital entering is clearly weakening. At the same time, oil prices have broken above $100 per barrel, reviving concerns about sticky inflation and further compressing the Fed’s room to turn more dovish.
From a longer-term perspective, after Bitcoin hit a historical high of $128,000 in October 2025, it has already experienced a deep retracement of more than 50%. Although it rebounded 43.8% over the past 90 days, it is still down 25% year-to-date, and is 34% away from its historical high. This means the current price is still in the stage of a "corrective rebound" rather than a "trend reversal."
III. In-depth technical analysis: the weak pattern remains unchanged
Bitcoin (BTC/USD):
As of the time of this writing, BTC is at $83,699, right near the Bollinger midline ($83,764). On the 4-hour chart, the candlesticks have been closing in red consecutively. The KDJ indicator has formed a dead cross and is diverging downward, suggesting that downside momentum has not been fully released. Structurally, the $85,400–$85,600 area has formed a clear double-top pattern. The rally and subsequent pullback after yesterday’s PCE further confirms the effectiveness of this resistance.
Regarding key price levels, the primary short-selling zone today is $83,800–$84,300. This area consolidates prior breakout points, the 38.2% Fibonacci retracement level, and a triple layer of pressure at the hourly Bollinger upper band. On the downside, the first target is $82,500; if it breaks, it further opens room down to $81,000.
Ethereum (ETH/USD):
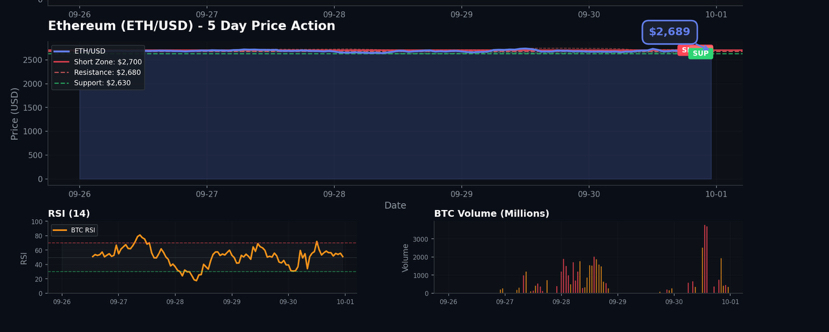
ETH is currently at $2,689. RSI(14) is 50.5, placing it in the middle zone between bulls and bears. Notably, the ETH/BTC exchange rate has been strengthening recently, and institutions such as Bitmine have continued to increase holdings. In Q3, ETH outperformed the S&P 500 by more than 6700 basis points, indicating that the medium-term fundamentals still have support. But in the short term, the $2,700 psychological level faces clear resistance. After two unsuccessful attempts to push higher and subsequent pullback, the hourly chart also shows a KDJ dead-cross configuration.
In terms of execution, short in the $2,680–$2,700 range, target $2,630, and set the stop-loss above $2,720. 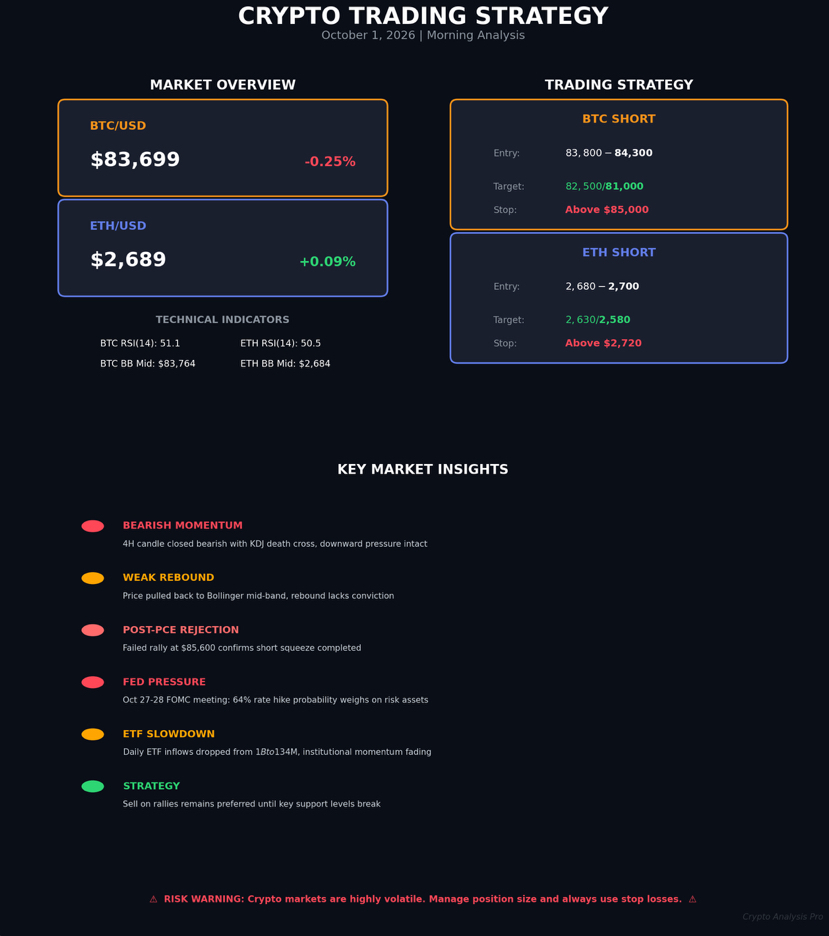
IV. Today’s trading strategy
Bitcoin (BTC):
- Short-selling range: $83,800 - $84,300
- Target price levels: $82,500 (first target), $81,000 (second target)
- Stop-loss reference: above $85,000
- Positioning suggestion: no more than 3% of total capital
Ethereum (ETH):
- Short-selling range: $2,680 - $2,700
- Target price levels: $2,630 (first target), $2,580 (second target)
- Stop-loss reference: above $2,720
- Positioning suggestion: no more than 3% of total capital
Key execution points: The current market is in a data vacuum period, and volatility may narrow. It is recommended to build positions in batches—enter 2–3 times within the range instead of going all-in at once. If the price unexpectedly breaks above $85,000 (BTC) or $2,720 (ETH), exit immediately with a stop-loss and wait for a new trading opportunity.
V. Risk warnings and outlook
It is crucial to stay clear-headed: the current short-selling strategy is a **short-term swing trade that goes against the intermediate-term rebound trend**. Bullish representatives such as Tom Lee, chairman of Bitmine, still insist that the crypto bull market started at the end of June, and that institutions will significantly increase their positions in Q4. If this logic plays out, then today’s short is merely capturing retracement profits, not a long-term bearish bet.
Therefore, you must strictly follow stop-loss discipline. Trading is never about betting on the direction—it's about acting decisively when the probability edge appears, and exiting decisively when the situation turns unfavorable. Before the Fed meeting in October, the market may remain in a range-bound but bearish-leaning pattern; every rebound could be an opportunity for shorts, but oversold conditions may also trigger a technical rebound. Stay flexible, and respect the market.


