

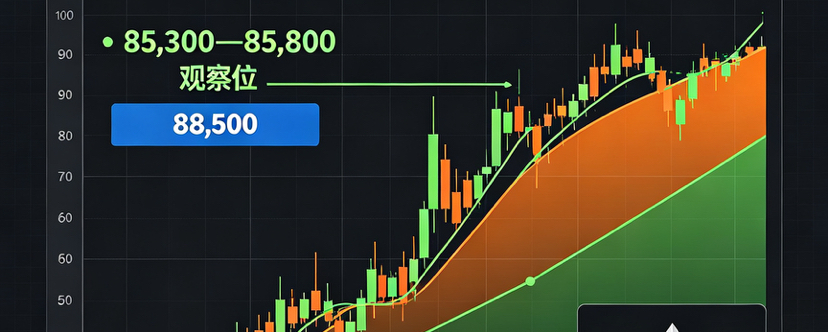

After BTC recently broke through 85,000, it has entered a high-range consolidation and corrective phase. At the same time, ETH has been stabilizing above 2,700. Judging from the structure, this looks more like a normal pause after a higher-volume move on the weekly chart rather than a trend reversal. As long as the recent highs have not been effectively broken and the lows keep getting higher, the bullish structure remains intact. For BTC, watch for continuation opportunities after a pullback to 85,300—85,800, with a target of 88,500. For ETH, watch the 2,720—2,740 support zone, with a target of 2,820. Right now, it’s more suitable to follow conservatively rather than chase or flip short too early.
1. There wasn’t much movement early in the morning—so why isn’t this the end of the trend?
BTC’s movement overnight is limited, and the market enters a consolidation transition. Many people worry: it has risen so much—does it mean it’s about to reverse?
This judgment is too hasty.
A true trend reversal usually doesn’t start from “sideways trading,” but from “breaking the structure.” In other words, you need to check whether the price is still trading above the highs and whether it can maintain the rhythm of gradually lifting the lows. As long as these two conditions aren’t broken, sideways movement is more likely to be consolidation after an upmove, not the beginning of a decline.
After a volume-expanding breakout at the weekly level, the price often won’t keep rallying in a straight line. Once room opens up, the bulls need to digest profit-taking, indicators need to repair, and new buyers also need to reassess the risk-reward ratio. Seeing a few days of oscillation at this stage is a normal correction within a strong market.
So, the more accurate interpretation right now is: the trend is still slightly bullish, but the rhythm has switched from “rapid bullish rally” to “range-bound consolidation and building strength.”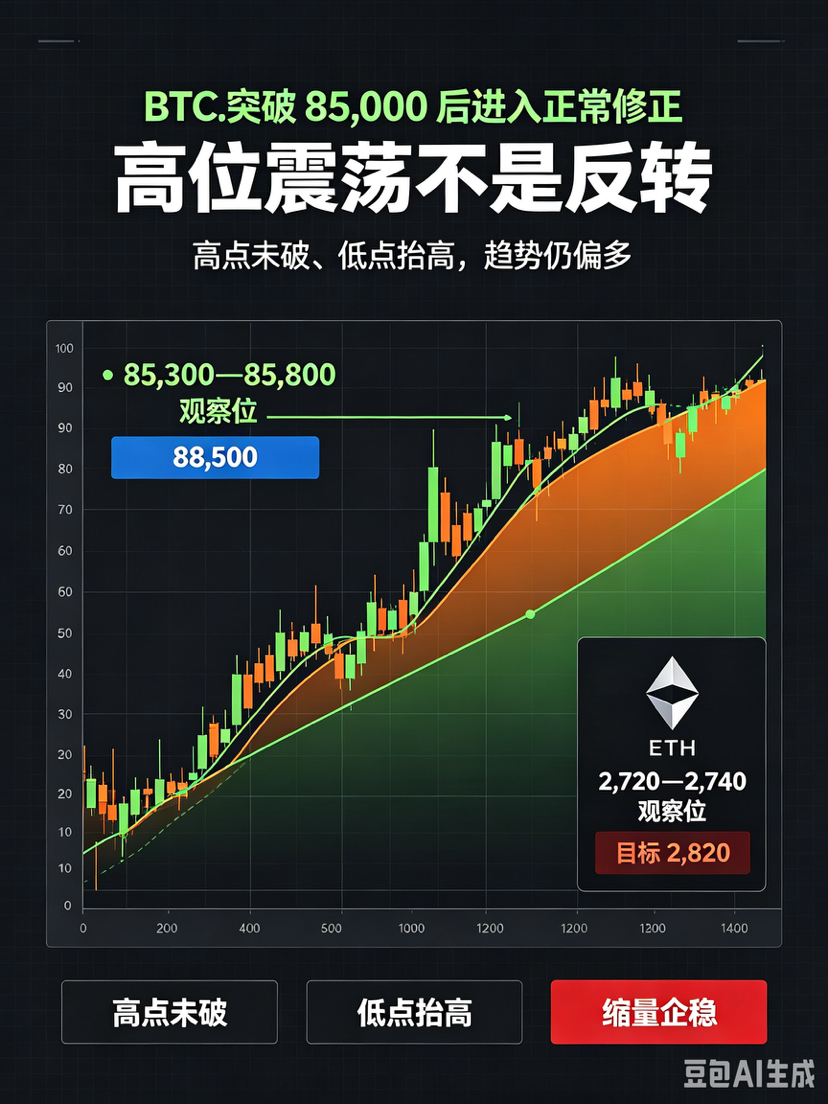
Second, daily-level consolidation at high levels—why treat it as bullish?
The simplest way to judge whether a strong market is still ongoing is to look at two things: whether the highs are being refreshed and whether the lows are being lifted.
Looking at BTC’s recent action: after the price holds above 85,000, although it didn’t continue to push higher strongly, it also didn’t fall back to the prior launch platform. The lows are still gradually rising, which indicates the bulls have not given up control.
ETH’s structure is similar. After the price returns above 2,700, even though disagreements appear at high levels, overall it’s still moving near the key moving averages and the former highs-to-conversion zone, and there hasn’t been a destructive sell-off with a surge in volume.
In this situation, every pullback should first be treated as a normal correction. That is, when the price drops, it’s not a switch to short immediately; instead, you should observe whether support is effective and whether the downward momentum is slowing.
Only when the previous high is broken, the low is refreshed, and the rebound can no longer make new highs should you reassess the trend.
Third, 4-hour candles alternate between bullish and bearish—why isn’t this a weakening signal?
With continuous alternation of bearish and bullish candles at the 4-hour level and the price pausing near the upper band, this doesn’t necessarily mean the bulls are exhausted.
In a strong market, the 4-hour chart often shows a structure of “rising one day, consolidating one day.” During the rise, volume expands; during the consolidation, volume contracts. This indicates that the selling pressure at high levels hasn’t been fully released—only short-term capital is exchanging positions.
If, during consolidation, volume clearly contracts, and the price no longer makes new lows, that indicates the bulls are still controlling the rhythm. What really needs caution is a volume-expanding long bearish candle, breaking below moving averages, and rebounds that lack strength—not just pure sideways trading.
Therefore, the current 4-hour action is more like building strength for the next upswing, rather than the trend already being over.
Fourth, BTC: why is 85,300—85,800 a bullish observation zone?
After BTC’s rapid rally, the risk of chasing directly has increased. A more reasonable approach is to wait for a pullback to key support zones and then observe.
The 85,300—85,800 area is the cost-conversion zone after the earlier breakout, and it’s also around the average cost of short-term longs. If the price pulls back here, and you see a stabilization that closes bullish after the drop and the selling pressure slows, it suggests that dip buyers are re-entering at lower levels.
Therefore, BTC can observe bullish continuation opportunities within the 85,300—85,800 range, with the target at 88,500.
But this move has prerequisites.
First, you must not break the key defense level. If the price rapidly falls back below 85,000 and continues to drop, it means support has failed—then continuing to look for longs would be meaningless.
Second, you must see volume contraction and stabilization. If a pullback happens with selling volume, it means the bulls have already given up, and the trend may weaken.
Fifth, ETH: why is 2,720—2,740 more suitable for conservative long entries?
ETH has greater elasticity than BTC, so the opportunity after a pullback is more worth waiting for.
2,720—2,740 is an important ETH support zone for the short term. After price pulls back to this area, if it doesn’t make new lows, it means the bullish structure still remains. If a subsequent rebound leads to a close bullish with selling pressure easing, the target can be 2,820.
ETH’s key is not direction, but rhythm. It can quickly surge in a short time, and it can also violently oscillate at high levels. Therefore, it’s better to set up conservatively near the support zone rather than chasing after a rally at the top.
Meanwhile, ETH is still influenced by BTC’s rhythm. If BTC holds near 85,000, ETH’s bullish continuation will be smoother; if BTC breaks below key support, ETH will be difficult to run strong independently.
Sixth, why should trading be more conservative in the current stage?
Even though the broader direction is still slightly bullish, after entering a high-level correction, trading should be more conservative than in the earlier phase.
There are three reasons.
First, the risk-reward ratio deteriorates. The price has moved far away from the breakout zone. While there is still upside potential, the stop-loss distance will also increase accordingly.
Second, emotions can easily run too hot. In a strong market, many people change their judgment because of a single bullish candle, and chasing the price at a higher cost often feels uncomfortable.
Third, the consolidation cycle may extend. Not all sideways patterns will immediately continue higher. Some will consolidate for a few days, even repeatedly test support.
Therefore, at the moment, it’s more appropriate to “wait for confirmation after a pullback” rather than chase just because you see a bullish candle.
After BTC breaks above 85,000, it enters a high-level range-bound corrective phase, while ETH also consolidates above 2,700 in parallel. From the daily and 4-hour structure, this looks more like a normal pause after an upmove rather than a trend reversal. As long as the previous high hasn’t been broken down effectively and the lows keep lifting, the bullish framework still holds.
For BTC, you may watch the 85,300—85,800 area for continuation opportunities after a pullback, with a target of 88,500. For ETH, you may watch the 2,720—2,740 support zone, with a target of 2,820. In the current stage, it’s more suitable to follow conservatively, keep your defenses up, and control position sizing.
⚠️ Risk warning: This article is for technical analysis and market observation only and does not constitute any investment advice. The risks of cryptocurrency trading are extremely high. Leveraged trades may cause rapid loss of principal—please make decisions carefully.#AI股持续上涨还有哪些投资机会 #比特币突破5月高点逼近8.6万美元 #140亿美元比特币期权周五到期 #BNB市值超越纽约梅隆银行 #加密市场总市值重回3万亿美元 $BTC


