
#cryptowithali
cryptowithali
489 views
37 Discussing
Hot
Latest

📊 November Crypto Outlook: Market Structure, Liquidity & Key Narratives to Watch
A new month brings new opportunities to learn—but understanding market conditions matters more than predicting every move.
🔹 1. Market Structure
Is the market forming higher highs and higher lows, making lower lows, or moving sideways? Understanding the broader structure helps put short-term price movements into context.
🔹 2. Liquidity
Liquidity affects how easily assets can be bought or sold. Watch how price reacts around previous highs, lows, and important trading zones. A liquidity sweep alone does not confirm a reversal.
🔹 3. Bitcoin & Ethereum
BTC and ETH can provide useful context for the wider crypto market. Observe their price action, trading volume, and key technical levels instead of relying on a single candle.
🔹 4. Altcoin Narratives
AI, Web3, tokenization, and blockchain infrastructure remain important educational themes to follow. However, a popular narrative does not automatically mean a project has strong fundamentals or that its token price will rise.
🔹 5. Risk Awareness
Volatility can change quickly. Avoid treating predictions as facts, and remember that technical indicators are tools for interpretation—not guarantees.
🎯 November's Learning Focus:
Market structure + liquidity + fundamentals + market psychology.
💬 Your view: What best describes the crypto market as November begins?
Follow Crypto With Ali for regular crypto education, market context, and Web3 insights.
Educational content only. Not financial advice.
#CryptoWithAli #bitcoin #Ethereum #cryptoeducation #Marketstructure
📊 November Crypto Outlook: Market Structure, Liquidity & Key Narratives to Watch
A new month brings new opportunities to learn—but understanding market conditions matters more than predicting every move.
🔹 1. Market Structure
Is the market forming higher highs and higher lows, making lower lows, or moving sideways? Understanding the broader structure helps put short-term price movements into context.
🔹 2. Liquidity
Liquidity affects how easily assets can be bought or sold. Watch how price reacts around previous highs, lows, and important trading zones. A liquidity sweep alone does not confirm a reversal.
🔹 3. Bitcoin & Ethereum
BTC and ETH can provide useful context for the wider crypto market. Observe their price action, trading volume, and key technical levels instead of relying on a single candle.
🔹 4. Altcoin Narratives
AI, Web3, tokenization, and blockchain infrastructure remain important educational themes to follow. However, a popular narrative does not automatically mean a project has strong fundamentals or that its token price will rise.
🔹 5. Risk Awareness
Volatility can change quickly. Avoid treating predictions as facts, and remember that technical indicators are tools for interpretation—not guarantees.
🎯 November's Learning Focus:
Market structure + liquidity + fundamentals + market psychology.
💬 Your view: What best describes the crypto market as November begins?
Follow Crypto With Ali for regular crypto education, market context, and Web3 insights.
Educational content only. Not financial advice.
#CryptoWithAli #bitcoin #Ethereum #cryptoeducation #Marketstructure
A new month brings new opportunities to learn—but understanding market conditions matters more than predicting every move.
🔹 1. Market Structure
Is the market forming higher highs and higher lows, making lower lows, or moving sideways? Understanding the broader structure helps put short-term price movements into context.
🔹 2. Liquidity
Liquidity affects how easily assets can be bought or sold. Watch how price reacts around previous highs, lows, and important trading zones. A liquidity sweep alone does not confirm a reversal.
🔹 3. Bitcoin & Ethereum
BTC and ETH can provide useful context for the wider crypto market. Observe their price action, trading volume, and key technical levels instead of relying on a single candle.
🔹 4. Altcoin Narratives
AI, Web3, tokenization, and blockchain infrastructure remain important educational themes to follow. However, a popular narrative does not automatically mean a project has strong fundamentals or that its token price will rise.
🔹 5. Risk Awareness
Volatility can change quickly. Avoid treating predictions as facts, and remember that technical indicators are tools for interpretation—not guarantees.
🎯 November's Learning Focus:
Market structure + liquidity + fundamentals + market psychology.
💬 Your view: What best describes the crypto market as November begins?
Follow Crypto With Ali for regular crypto education, market context, and Web3 insights.
Educational content only. Not financial advice.
#CryptoWithAli #bitcoin #Ethereum #cryptoeducation #Marketstructure

73
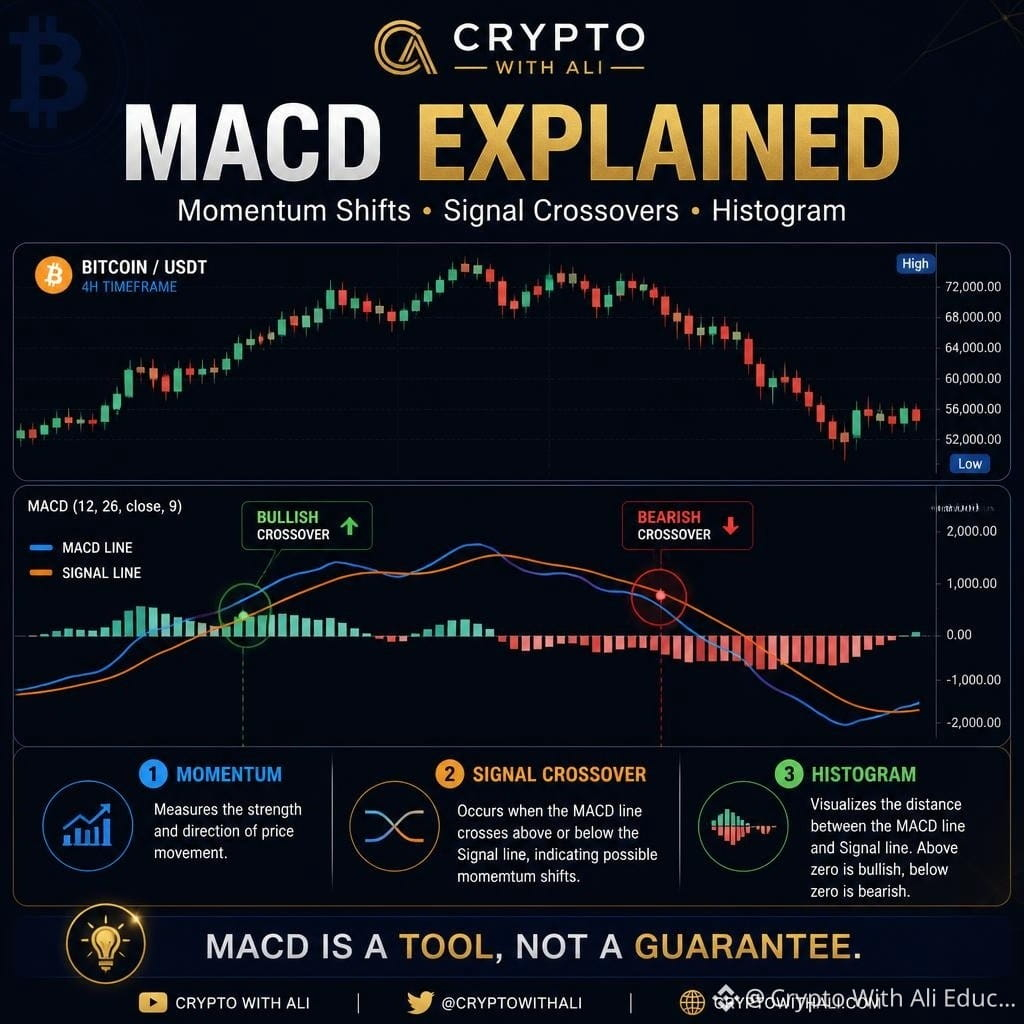
📊 MACD Explained: Momentum Shifts, Signal Crossovers & Their Limitations
Have you ever noticed MACD lines crossing on a Bitcoin chart and wondered what that signal actually means?
The Moving Average Convergence Divergence (MACD) is a momentum indicator that helps traders study changes in momentum and potential trend shifts.
Let's understand its basics.
🔹 1. What Is MACD?
MACD is commonly calculated using three settings:
Fast EMA: 12 periods
Slow EMA: 26 periods
Signal line: 9 periods
These settings are commonly written as MACD (12, 26, 9).
🔹 2. MACD Line
The MACD line measures the difference between the 12-period and 26-period exponential moving averages (EMAs).
It helps visualize changes in momentum as these averages move closer together or farther apart.
🔹 3. Signal Line Crossover
A bullish crossover occurs when the MACD line crosses above the signal line.
A bearish crossover occurs when the MACD line crosses below the signal line.
These crossovers can indicate momentum changes, but they are not guaranteed buy or sell signals.
🔹 4. Understanding the Histogram
The MACD histogram displays the difference between the MACD line and signal line.
Expanding bars indicate increasing separation.
Contracting bars indicate decreasing separation.
It can help visualize changes in momentum.
🔹 5. MACD Limitations
MACD is based on moving averages, so it can lag behind price movements.
In sideways markets, frequent crossovers can produce misleading signals.
📌 Key Lesson:
MACD helps evaluate momentum, but it should not be used in isolation.
Combine it with price action, volume, support and resistance, and broader market structure for better context.
💬 Question: Do you prefer MACD crossovers or histogram analysis when studying crypto charts?
Follow Crypto With Ali for regular technical-analysis education and crypto insights.
Educational content only. Not financial advice.
#CryptoWithAli #MACD #TechnicalAnalysis #bitcoin #cryptoeducation
📊 MACD Explained: Momentum Shifts, Signal Crossovers & Their Limitations
Have you ever noticed MACD lines crossing on a Bitcoin chart and wondered what that signal actually means?
The Moving Average Convergence Divergence (MACD) is a momentum indicator that helps traders study changes in momentum and potential trend shifts.
Let's understand its basics.
🔹 1. What Is MACD?
MACD is commonly calculated using three settings:
Fast EMA: 12 periods
Slow EMA: 26 periods
Signal line: 9 periods
These settings are commonly written as MACD (12, 26, 9).
🔹 2. MACD Line
The MACD line measures the difference between the 12-period and 26-period exponential moving averages (EMAs).
It helps visualize changes in momentum as these averages move closer together or farther apart.
🔹 3. Signal Line Crossover
A bullish crossover occurs when the MACD line crosses above the signal line.
A bearish crossover occurs when the MACD line crosses below the signal line.
These crossovers can indicate momentum changes, but they are not guaranteed buy or sell signals.
🔹 4. Understanding the Histogram
The MACD histogram displays the difference between the MACD line and signal line.
Expanding bars indicate increasing separation.
Contracting bars indicate decreasing separation.
It can help visualize changes in momentum.
🔹 5. MACD Limitations
MACD is based on moving averages, so it can lag behind price movements.
In sideways markets, frequent crossovers can produce misleading signals.
📌 Key Lesson:
MACD helps evaluate momentum, but it should not be used in isolation.
Combine it with price action, volume, support and resistance, and broader market structure for better context.
💬 Question: Do you prefer MACD crossovers or histogram analysis when studying crypto charts?
Follow Crypto With Ali for regular technical-analysis education and crypto insights.
Educational content only. Not financial advice.
#CryptoWithAli #MACD #TechnicalAnalysis #bitcoin #cryptoeducation
Have you ever noticed MACD lines crossing on a Bitcoin chart and wondered what that signal actually means?
The Moving Average Convergence Divergence (MACD) is a momentum indicator that helps traders study changes in momentum and potential trend shifts.
Let's understand its basics.
🔹 1. What Is MACD?
MACD is commonly calculated using three settings:
Fast EMA: 12 periods
Slow EMA: 26 periods
Signal line: 9 periods
These settings are commonly written as MACD (12, 26, 9).
🔹 2. MACD Line
The MACD line measures the difference between the 12-period and 26-period exponential moving averages (EMAs).
It helps visualize changes in momentum as these averages move closer together or farther apart.
🔹 3. Signal Line Crossover
A bullish crossover occurs when the MACD line crosses above the signal line.
A bearish crossover occurs when the MACD line crosses below the signal line.
These crossovers can indicate momentum changes, but they are not guaranteed buy or sell signals.
🔹 4. Understanding the Histogram
The MACD histogram displays the difference between the MACD line and signal line.
Expanding bars indicate increasing separation.
Contracting bars indicate decreasing separation.
It can help visualize changes in momentum.
🔹 5. MACD Limitations
MACD is based on moving averages, so it can lag behind price movements.
In sideways markets, frequent crossovers can produce misleading signals.
📌 Key Lesson:
MACD helps evaluate momentum, but it should not be used in isolation.
Combine it with price action, volume, support and resistance, and broader market structure for better context.
💬 Question: Do you prefer MACD crossovers or histogram analysis when studying crypto charts?
Follow Crypto With Ali for regular technical-analysis education and crypto insights.
Educational content only. Not financial advice.
#CryptoWithAli #MACD #TechnicalAnalysis #bitcoin #cryptoeducation
112
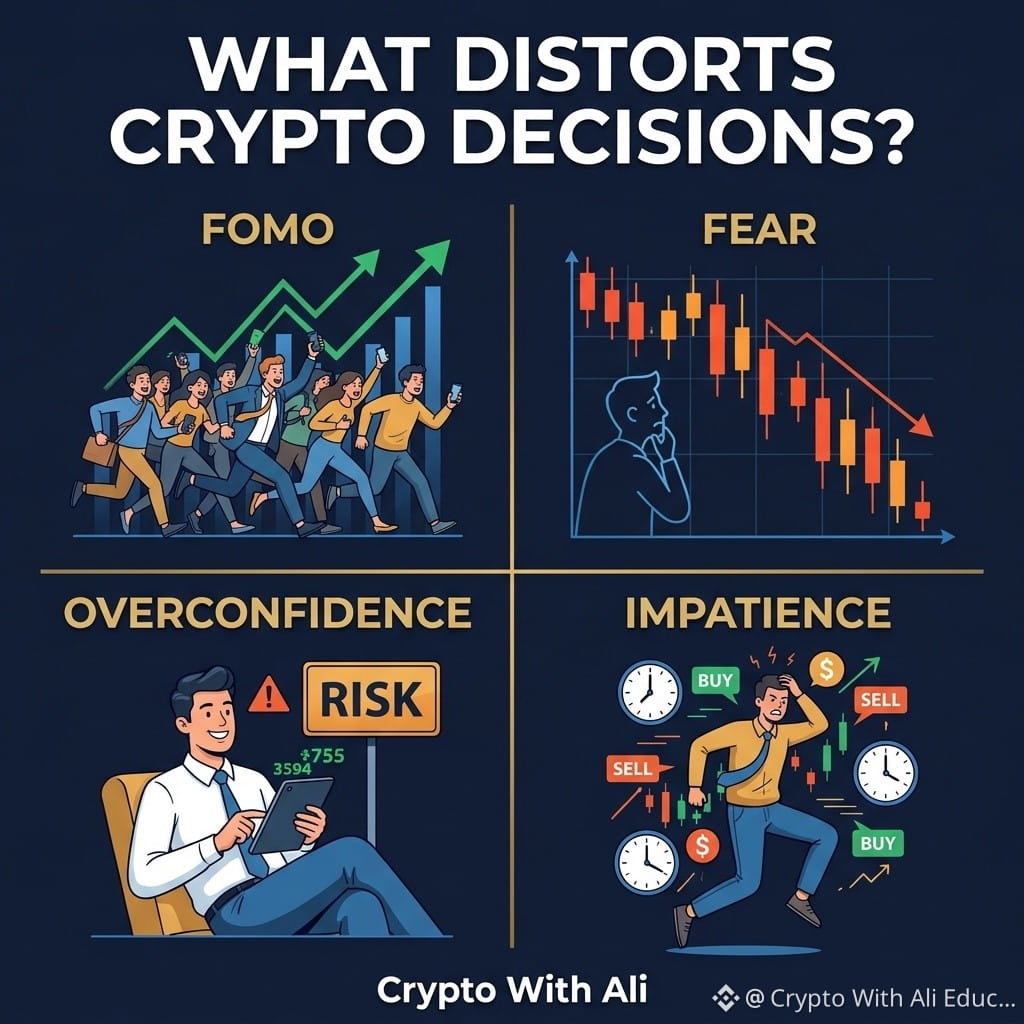
🧠 Crypto Market Psychology: What's Your Biggest Challenge?
Crypto decisions are not always based on research and analysis. Sometimes emotions influence our judgment.
Which psychological factor most often distorts crypto decisions?
🟢 FOMO
🔵 Fear
🟠 Overconfidence
⚪ Impatience
💬 Cast your vote and share your experience.
Understanding our own decision-making is an important part of becoming more informed crypto participants.
Follow Crypto With Ali for more educational insights.
#CryptoWithAli #Marketpsychology #FOMO #cryptoeducation #CryptoPoll
🧠 Crypto Market Psychology: What's Your Biggest Challenge?
Crypto decisions are not always based on research and analysis. Sometimes emotions influence our judgment.
Which psychological factor most often distorts crypto decisions?
🟢 FOMO
🔵 Fear
🟠 Overconfidence
⚪ Impatience
💬 Cast your vote and share your experience.
Understanding our own decision-making is an important part of becoming more informed crypto participants.
Follow Crypto With Ali for more educational insights.
#CryptoWithAli #Marketpsychology #FOMO #cryptoeducation #CryptoPoll
Crypto decisions are not always based on research and analysis. Sometimes emotions influence our judgment.
Which psychological factor most often distorts crypto decisions?
🟢 FOMO
🔵 Fear
🟠 Overconfidence
⚪ Impatience
💬 Cast your vote and share your experience.
Understanding our own decision-making is an important part of becoming more informed crypto participants.
Follow Crypto With Ali for more educational insights.
#CryptoWithAli #Marketpsychology #FOMO #cryptoeducation #CryptoPoll
43
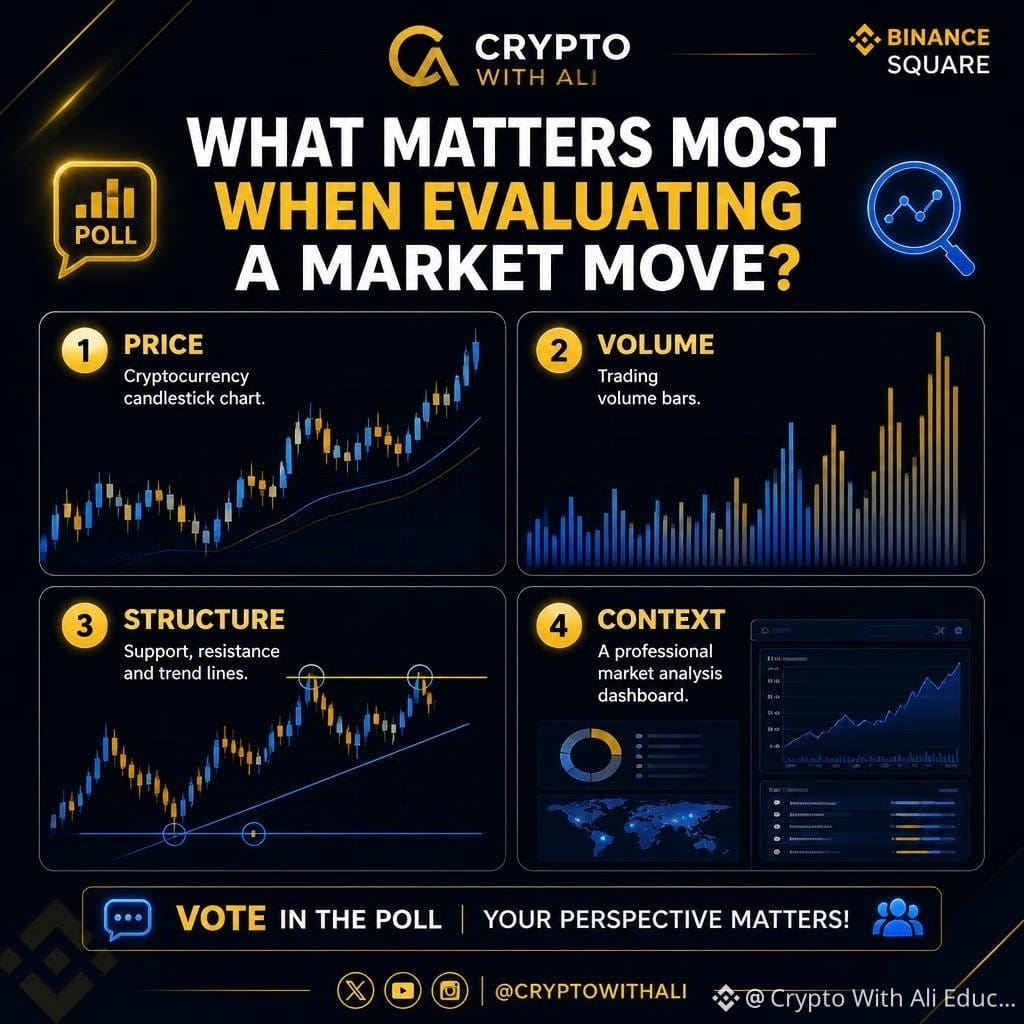
📊 What Matters Most When Evaluating a Crypto Market Move?
A price movement alone doesn't always explain the complete market picture.
Different factors provide different insights.
What do you check first?
🟢 Price
🔵 Volume
🟠 Structure
⚪ Context
💬 Cast your vote and explain why you prefer that factor.
Let's learn from different market perspectives!
Follow Crypto With Ali for more crypto education.
#CryptoWithAli #Bitcoin #Ethereum #CryptoMarket #CryptoPoll
📊 What Matters Most When Evaluating a Crypto Market Move?
A price movement alone doesn't always explain the complete market picture.
Different factors provide different insights.
What do you check first?
🟢 Price
🔵 Volume
🟠 Structure
⚪ Context
💬 Cast your vote and explain why you prefer that factor.
Let's learn from different market perspectives!
Follow Crypto With Ali for more crypto education.
#CryptoWithAli #Bitcoin #Ethereum #CryptoMarket #CryptoPoll
A price movement alone doesn't always explain the complete market picture.
Different factors provide different insights.
What do you check first?
🟢 Price
🔵 Volume
🟠 Structure
⚪ Context
💬 Cast your vote and explain why you prefer that factor.
Let's learn from different market perspectives!
Follow Crypto With Ali for more crypto education.
#CryptoWithAli #Bitcoin #Ethereum #CryptoMarket #CryptoPoll
153
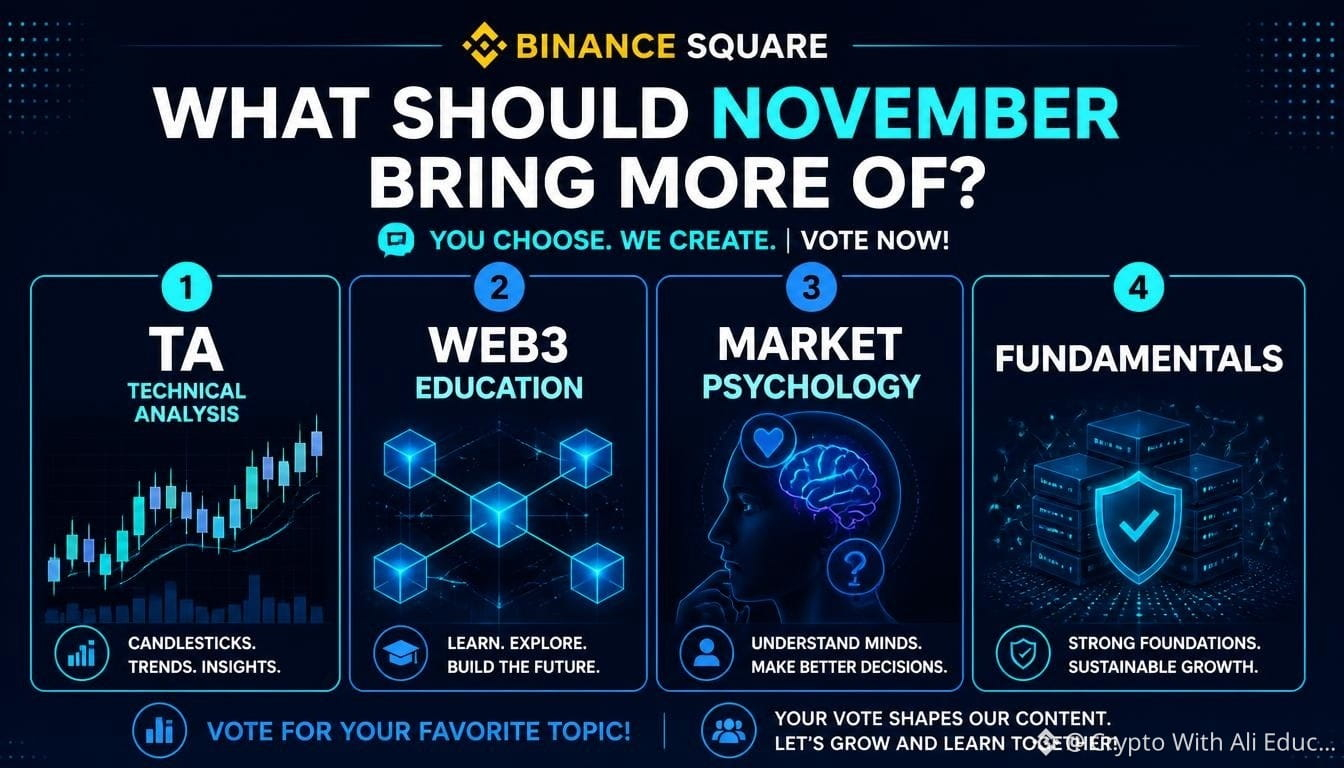
📊 What Should November Bring More Of?
October's educational series explored market structure, liquidity, crypto narratives, blockchain infrastructure, and Web3 fundamentals.
Now it's your turn to help shape November's content! 👇
🔹 A. TA — Technical analysis and chart structure
🔹 B. Web3 Education — Blockchain, DeFi, AI, and tokenization
🔹 C. Market Psychology — Sentiment, emotions, and decision-making
🔹 D. Fundamentals — Adoption, infrastructure, and real-world utility
💬 Vote and tell us which topics you want explained next.
Your feedback will help guide the upcoming Crypto With Ali November Education Series.
Follow for practical, easy-to-understand crypto and Web3 learning.
Educational content only. Not financial advice.
#cryptoeducation #Web3 #Marketpsychology #CryptoFundamentals #CryptoWithAli
📊 What Should November Bring More Of?
October's educational series explored market structure, liquidity, crypto narratives, blockchain infrastructure, and Web3 fundamentals.
Now it's your turn to help shape November's content! 👇
🔹 A. TA — Technical analysis and chart structure
🔹 B. Web3 Education — Blockchain, DeFi, AI, and tokenization
🔹 C. Market Psychology — Sentiment, emotions, and decision-making
🔹 D. Fundamentals — Adoption, infrastructure, and real-world utility
💬 Vote and tell us which topics you want explained next.
Your feedback will help guide the upcoming Crypto With Ali November Education Series.
Follow for practical, easy-to-understand crypto and Web3 learning.
Educational content only. Not financial advice.
#cryptoeducation #Web3 #Marketpsychology #CryptoFundamentals #CryptoWithAli
October's educational series explored market structure, liquidity, crypto narratives, blockchain infrastructure, and Web3 fundamentals.
Now it's your turn to help shape November's content! 👇
🔹 A. TA — Technical analysis and chart structure
🔹 B. Web3 Education — Blockchain, DeFi, AI, and tokenization
🔹 C. Market Psychology — Sentiment, emotions, and decision-making
🔹 D. Fundamentals — Adoption, infrastructure, and real-world utility
💬 Vote and tell us which topics you want explained next.
Your feedback will help guide the upcoming Crypto With Ali November Education Series.
Follow for practical, easy-to-understand crypto and Web3 learning.
Educational content only. Not financial advice.
#cryptoeducation #Web3 #Marketpsychology #CryptoFundamentals #CryptoWithAli
44
October Final Report: Market Structure, Narratives & Lessons for the Next Month
As October ends, let's review the key lessons from this month's crypto education series and prepare for November. The goal is not to predict every move, but to understand the market more clearly. 📊
🔹 1. Market Structure Matters
Trends, support, resistance, and price reactions help explain market behavior. They provide context—not certainty.
🔹 2. Liquidity Influences Price Action
Market depth and trading activity can affect volatility and execution. Price movements should be viewed alongside liquidity conditions.
🔹 3. Narratives Need Evidence
AI, DeFi, tokenization, and other Web3 themes can attract attention. Real development, adoption, and utility matter more than hype.
🔹 4. Fundamentals Go Beyond Charts
Network activity, security, infrastructure, and real-world use can add context that short-term price movements alone cannot provide.
🔹 5. Risk Awareness Is Essential
Psychology, volatility, and uncertainty influence decisions. No single indicator or narrative explains the entire market.
💡 Looking Ahead to November:
We'll continue exploring Bitcoin and Ethereum, altcoins, market psychology, blockchain infrastructure, and practical Web3 fundamentals.
💬 Help Shape the Next Series: What should we cover more—technical analysis, Web3 education, market psychology, or fundamentals?
Follow Crypto With Ali for practical crypto education throughout November.
Educational content only. Not financial advice.
#CryptoReview #Marketstructure #Web3Education
#CryptoFundamentals #CryptoWithAli
October Final Report: Market Structure, Narratives & Lessons for the Next Month
As October ends, let's review the key lessons from this month's crypto education series and prepare for November. The goal is not to predict every move, but to understand the market more clearly. 📊
🔹 1. Market Structure Matters
Trends, support, resistance, and price reactions help explain market behavior. They provide context—not certainty.
🔹 2. Liquidity Influences Price Action
Market depth and trading activity can affect volatility and execution. Price movements should be viewed alongside liquidity conditions.
🔹 3. Narratives Need Evidence
AI, DeFi, tokenization, and other Web3 themes can attract attention. Real development, adoption, and utility matter more than hype.
🔹 4. Fundamentals Go Beyond Charts
Network activity, security, infrastructure, and real-world use can add context that short-term price movements alone cannot provide.
🔹 5. Risk Awareness Is Essential
Psychology, volatility, and uncertainty influence decisions. No single indicator or narrative explains the entire market.
💡 Looking Ahead to November:
We'll continue exploring Bitcoin and Ethereum, altcoins, market psychology, blockchain infrastructure, and practical Web3 fundamentals.
💬 Help Shape the Next Series: What should we cover more—technical analysis, Web3 education, market psychology, or fundamentals?
Follow Crypto With Ali for practical crypto education throughout November.
Educational content only. Not financial advice.
#CryptoReview #Marketstructure #Web3Education
#CryptoFundamentals #CryptoWithAli
As October ends, let's review the key lessons from this month's crypto education series and prepare for November. The goal is not to predict every move, but to understand the market more clearly. 📊
🔹 1. Market Structure Matters
Trends, support, resistance, and price reactions help explain market behavior. They provide context—not certainty.
🔹 2. Liquidity Influences Price Action
Market depth and trading activity can affect volatility and execution. Price movements should be viewed alongside liquidity conditions.
🔹 3. Narratives Need Evidence
AI, DeFi, tokenization, and other Web3 themes can attract attention. Real development, adoption, and utility matter more than hype.
🔹 4. Fundamentals Go Beyond Charts
Network activity, security, infrastructure, and real-world use can add context that short-term price movements alone cannot provide.
🔹 5. Risk Awareness Is Essential
Psychology, volatility, and uncertainty influence decisions. No single indicator or narrative explains the entire market.
💡 Looking Ahead to November:
We'll continue exploring Bitcoin and Ethereum, altcoins, market psychology, blockchain infrastructure, and practical Web3 fundamentals.
💬 Help Shape the Next Series: What should we cover more—technical analysis, Web3 education, market psychology, or fundamentals?
Follow Crypto With Ali for practical crypto education throughout November.
Educational content only. Not financial advice.
#CryptoReview #Marketstructure #Web3Education
#CryptoFundamentals #CryptoWithAli

62
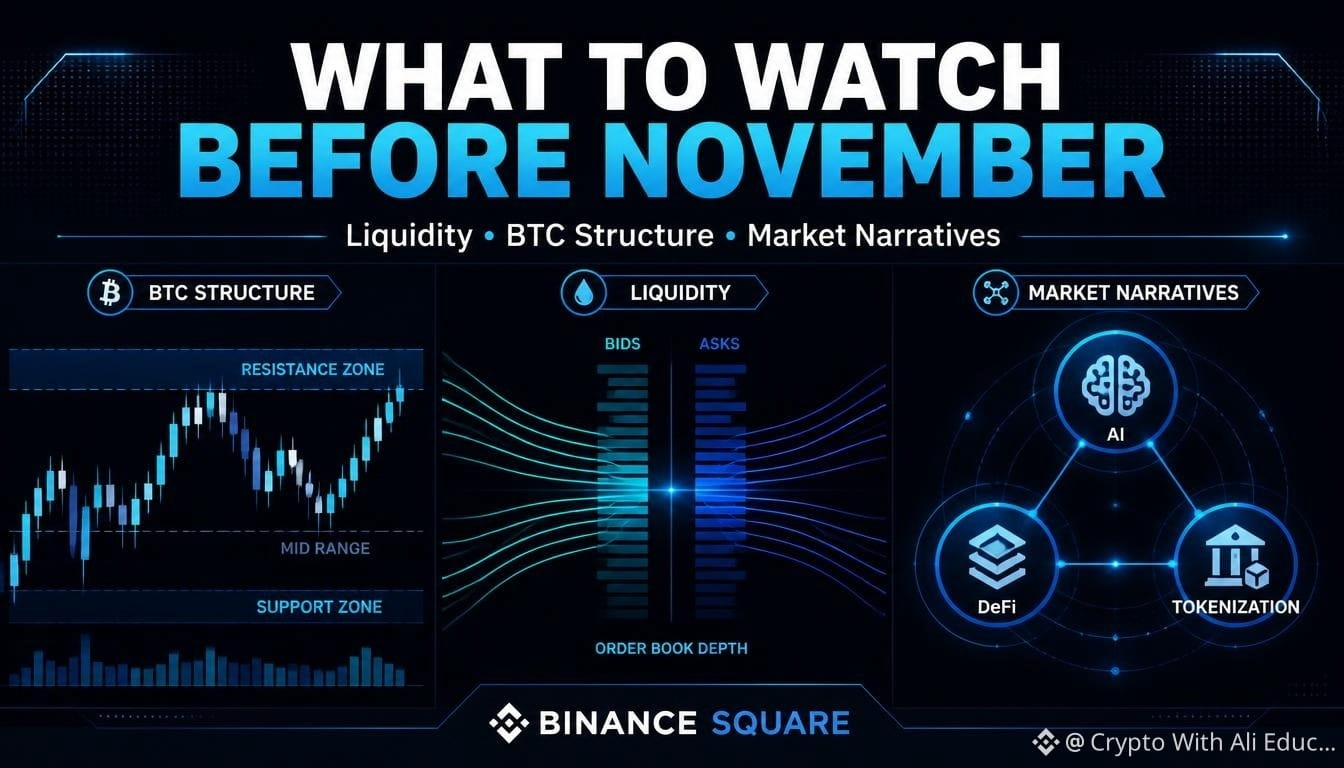
What to Watch Before November: Liquidity, BTC Structure & Market Narratives
As October comes to an end, it's a good time to review the factors that can help us understand crypto markets heading into November.
Rather than predicting prices, focus on context and evidence. 📊
🔹 1. Liquidity
Trading activity and market depth can influence volatility and execution. Thin liquidity may amplify price movements, so volume alone does not tell the whole story.
🔹 2. Bitcoin Market Structure
Observe trends, support and resistance zones, and how price reacts around important levels. These areas provide context, not guaranteed outcomes.
🔹 3. Ethereum and the Wider Market
Compare BTC and ETH behavior with broader altcoin activity. Different assets can respond differently to liquidity, sentiment, and market conditions.
🔹 4. Market Narratives
Themes such as AI, tokenization, DeFi, and infrastructure can attract attention. Check real development, adoption, and utility rather than relying on hype.
🔹 5. Risk and Psychology
Volatility, uncertainty, and emotional decisions remain part of crypto markets. A clear process and awareness of risk matter in every market environment.
💡 Key Takeaway:
For November, focus on liquidity, market structure, fundamentals, and changing narratives. No single indicator can explain the entire market.
💬 Your Focus for November: BTC, ETH, altcoins, or macro conditions?
Follow Crypto With Ali for practical crypto and Web3 education throughout November.
Educational content only. Not financial advice.
#CryptoMarket #Bitcoin #liquidity #Web3 #CryptoWithAli
What to Watch Before November: Liquidity, BTC Structure & Market Narratives
As October comes to an end, it's a good time to review the factors that can help us understand crypto markets heading into November.
Rather than predicting prices, focus on context and evidence. 📊
🔹 1. Liquidity
Trading activity and market depth can influence volatility and execution. Thin liquidity may amplify price movements, so volume alone does not tell the whole story.
🔹 2. Bitcoin Market Structure
Observe trends, support and resistance zones, and how price reacts around important levels. These areas provide context, not guaranteed outcomes.
🔹 3. Ethereum and the Wider Market
Compare BTC and ETH behavior with broader altcoin activity. Different assets can respond differently to liquidity, sentiment, and market conditions.
🔹 4. Market Narratives
Themes such as AI, tokenization, DeFi, and infrastructure can attract attention. Check real development, adoption, and utility rather than relying on hype.
🔹 5. Risk and Psychology
Volatility, uncertainty, and emotional decisions remain part of crypto markets. A clear process and awareness of risk matter in every market environment.
💡 Key Takeaway:
For November, focus on liquidity, market structure, fundamentals, and changing narratives. No single indicator can explain the entire market.
💬 Your Focus for November: BTC, ETH, altcoins, or macro conditions?
Follow Crypto With Ali for practical crypto and Web3 education throughout November.
Educational content only. Not financial advice.
#CryptoMarket #Bitcoin #liquidity #Web3 #CryptoWithAli
As October comes to an end, it's a good time to review the factors that can help us understand crypto markets heading into November.
Rather than predicting prices, focus on context and evidence. 📊
🔹 1. Liquidity
Trading activity and market depth can influence volatility and execution. Thin liquidity may amplify price movements, so volume alone does not tell the whole story.
🔹 2. Bitcoin Market Structure
Observe trends, support and resistance zones, and how price reacts around important levels. These areas provide context, not guaranteed outcomes.
🔹 3. Ethereum and the Wider Market
Compare BTC and ETH behavior with broader altcoin activity. Different assets can respond differently to liquidity, sentiment, and market conditions.
🔹 4. Market Narratives
Themes such as AI, tokenization, DeFi, and infrastructure can attract attention. Check real development, adoption, and utility rather than relying on hype.
🔹 5. Risk and Psychology
Volatility, uncertainty, and emotional decisions remain part of crypto markets. A clear process and awareness of risk matter in every market environment.
💡 Key Takeaway:
For November, focus on liquidity, market structure, fundamentals, and changing narratives. No single indicator can explain the entire market.
💬 Your Focus for November: BTC, ETH, altcoins, or macro conditions?
Follow Crypto With Ali for practical crypto and Web3 education throughout November.
Educational content only. Not financial advice.
#CryptoMarket #Bitcoin #liquidity #Web3 #CryptoWithAli
88
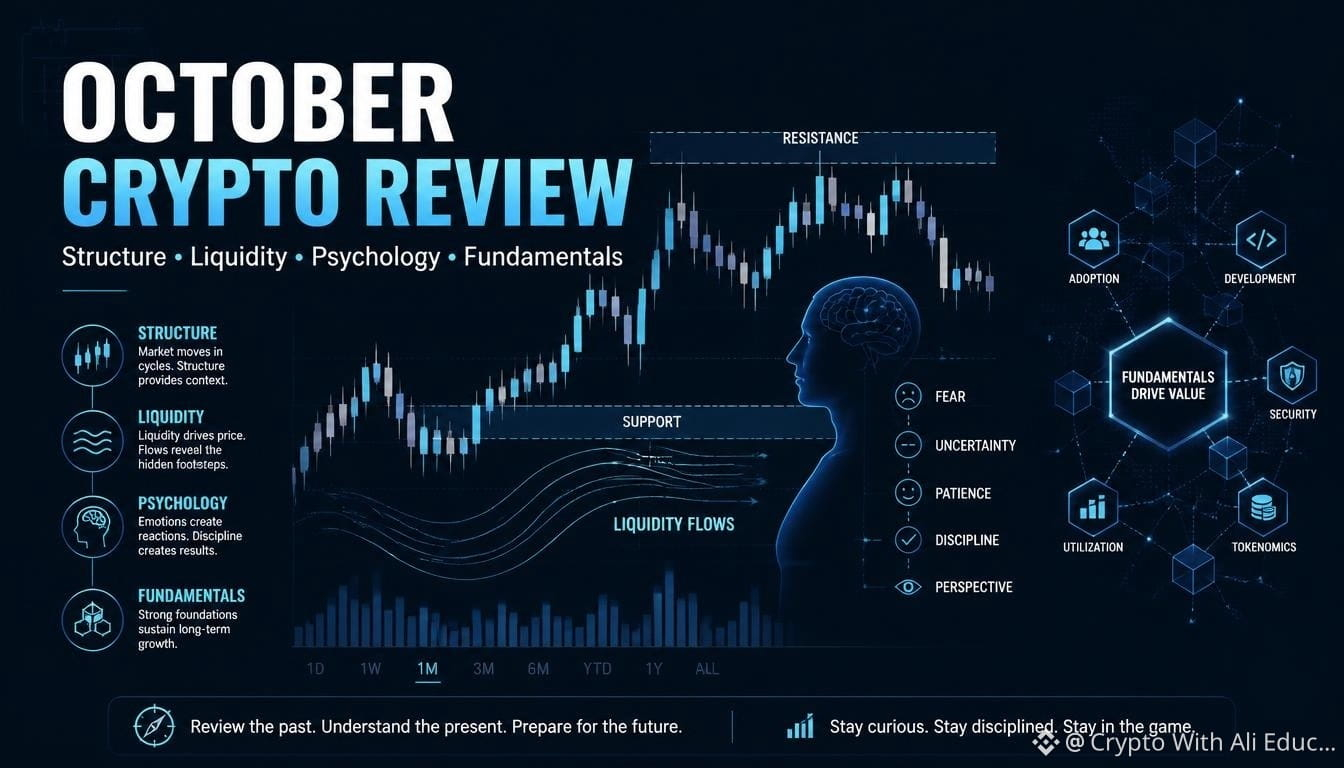
October Crypto Review: What Market Structure Taught Us This Month
October offered an opportunity to look beyond daily price movements and understand the broader factors that shape crypto markets. Here are five important lessons. 📊
🔹 1. Structure Provides Context
Support, resistance, trends, and market ranges help organize price action. No single level guarantees what happens next.
🔹 2. Liquidity Matters
Trading activity and available liquidity can influence volatility and how easily orders are executed. Thin liquidity may amplify price movements.
🔹 3. Psychology Influences Decisions
Fear, excitement, and herd behavior can affect market participation. Emotional decisions often make it harder to assess risk objectively.
🔹 4. Fundamentals Go Beyond Price
Network activity, adoption, security, development, and real-world utility can provide context beyond short-term charts.
🔹 5. No Single Indicator Tells the Whole Story
Price structure, volume, liquidity, sentiment, and fundamentals each provide different information. Combining perspectives can help build a more balanced understanding, but uncertainty always remains.
💡 Key Takeaway:
A useful crypto review is not about predicting every move. It is about identifying what the market shows, understanding the context, and recognizing the risks.
As we approach November, focus on evidence rather than hype, and learning rather than impulsive reactions.
💬 Your Biggest Lesson from October: Structure, liquidity, psychology, or fundamentals?
Follow Crypto With Ali for practical crypto and Web3 education.
Educational content only. Not financial advice.
#CryptoReview #Marketstructure #cryptoeducation #blockchain #CryptoWithAli
October Crypto Review: What Market Structure Taught Us This Month
October offered an opportunity to look beyond daily price movements and understand the broader factors that shape crypto markets. Here are five important lessons. 📊
🔹 1. Structure Provides Context
Support, resistance, trends, and market ranges help organize price action. No single level guarantees what happens next.
🔹 2. Liquidity Matters
Trading activity and available liquidity can influence volatility and how easily orders are executed. Thin liquidity may amplify price movements.
🔹 3. Psychology Influences Decisions
Fear, excitement, and herd behavior can affect market participation. Emotional decisions often make it harder to assess risk objectively.
🔹 4. Fundamentals Go Beyond Price
Network activity, adoption, security, development, and real-world utility can provide context beyond short-term charts.
🔹 5. No Single Indicator Tells the Whole Story
Price structure, volume, liquidity, sentiment, and fundamentals each provide different information. Combining perspectives can help build a more balanced understanding, but uncertainty always remains.
💡 Key Takeaway:
A useful crypto review is not about predicting every move. It is about identifying what the market shows, understanding the context, and recognizing the risks.
As we approach November, focus on evidence rather than hype, and learning rather than impulsive reactions.
💬 Your Biggest Lesson from October: Structure, liquidity, psychology, or fundamentals?
Follow Crypto With Ali for practical crypto and Web3 education.
Educational content only. Not financial advice.
#CryptoReview #Marketstructure #cryptoeducation #blockchain #CryptoWithAli
October offered an opportunity to look beyond daily price movements and understand the broader factors that shape crypto markets. Here are five important lessons. 📊
🔹 1. Structure Provides Context
Support, resistance, trends, and market ranges help organize price action. No single level guarantees what happens next.
🔹 2. Liquidity Matters
Trading activity and available liquidity can influence volatility and how easily orders are executed. Thin liquidity may amplify price movements.
🔹 3. Psychology Influences Decisions
Fear, excitement, and herd behavior can affect market participation. Emotional decisions often make it harder to assess risk objectively.
🔹 4. Fundamentals Go Beyond Price
Network activity, adoption, security, development, and real-world utility can provide context beyond short-term charts.
🔹 5. No Single Indicator Tells the Whole Story
Price structure, volume, liquidity, sentiment, and fundamentals each provide different information. Combining perspectives can help build a more balanced understanding, but uncertainty always remains.
💡 Key Takeaway:
A useful crypto review is not about predicting every move. It is about identifying what the market shows, understanding the context, and recognizing the risks.
As we approach November, focus on evidence rather than hype, and learning rather than impulsive reactions.
💬 Your Biggest Lesson from October: Structure, liquidity, psychology, or fundamentals?
Follow Crypto With Ali for practical crypto and Web3 education.
Educational content only. Not financial advice.
#CryptoReview #Marketstructure #cryptoeducation #blockchain #CryptoWithAli
54
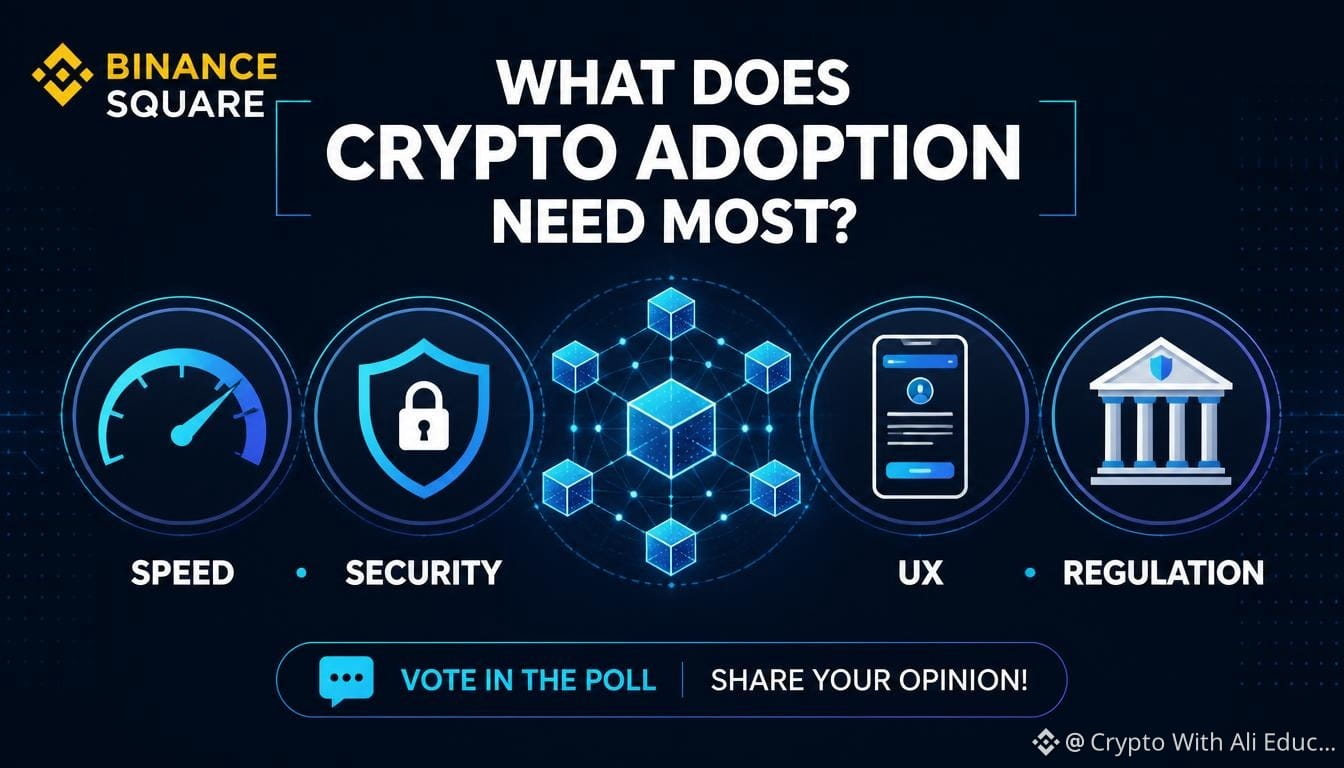
📊 Biggest Adoption Requirement →
For crypto and Web3 to reach more everyday users, the underlying infrastructure needs to work reliably.
But which factor matters most?
🔹 A. Speed — Efficient transactions and scalable networks
🔹 B. Security — Safer networks, wallets, and applications
🔹 C. UX — Simple, accessible user experiences
🔹 D. Regulation — Clear rules and stronger trust
💬 Vote and explain your choice. Is one factor enough, or does mass adoption depend on all four working together?
Educational content only. Not financial advice.
#CryptoAdoption #blockchain #Web3 #CryptoCommunity #CryptoWithAli
📊 Biggest Adoption Requirement →
For crypto and Web3 to reach more everyday users, the underlying infrastructure needs to work reliably.
But which factor matters most?
🔹 A. Speed — Efficient transactions and scalable networks
🔹 B. Security — Safer networks, wallets, and applications
🔹 C. UX — Simple, accessible user experiences
🔹 D. Regulation — Clear rules and stronger trust
💬 Vote and explain your choice. Is one factor enough, or does mass adoption depend on all four working together?
Educational content only. Not financial advice.
#CryptoAdoption #blockchain #Web3 #CryptoCommunity #CryptoWithAli
For crypto and Web3 to reach more everyday users, the underlying infrastructure needs to work reliably.
But which factor matters most?
🔹 A. Speed — Efficient transactions and scalable networks
🔹 B. Security — Safer networks, wallets, and applications
🔹 C. UX — Simple, accessible user experiences
🔹 D. Regulation — Clear rules and stronger trust
💬 Vote and explain your choice. Is one factor enough, or does mass adoption depend on all four working together?
Educational content only. Not financial advice.
#CryptoAdoption #blockchain #Web3 #CryptoCommunity #CryptoWithAli
53
Crypto Infrastructure: What Must Work Before Mass Adoption Can Scale?
Crypto adoption is about more than prices. For blockchain technology to serve millions of people, its infrastructure must be secure, efficient, and reliable. 🌐
🔹 1. Speed & Scalability
Networks must handle growing transaction volumes efficiently. Congestion and high fees can limit everyday use. Layer 2 solutions help address these challenges, but trade-offs remain.
🔹 2. Security & Reliability
Networks, wallets, smart contracts, and applications need strong security practices. Audits, testing, and monitoring help reduce risks, but no system is completely risk-free.
🔹 3. User Experience (UX)
Complex wallets, confusing fees, and difficult interfaces can discourage new users. Simple onboarding and clear transaction information can make crypto easier to use.
🔹 4. Interoperability
Different blockchains need practical ways to connect. Cross-chain tools can improve connectivity, but bridges may introduce additional security risks.
🔹 5. Regulation & Trust
Clear rules can help users and businesses understand their responsibilities. Consumer protection, privacy, and consistent standards also matter.
💡 Key Takeaway:
Mass adoption requires more than one breakthrough. It depends on scalability, security, usability, interoperability, and trustworthy standards working together.
The strongest infrastructure is technology people can use reliably—not simply technology that attracts attention.
💬 Your Opinion: What matters most for broader crypto adoption: speed, security, UX, or regulation?
Follow Crypto With Ali for practical crypto and Web3 education.
Educational content only. Not financial advice.
#CryptoInfrastructure #blockchain #Web3 #cryptoeducation #CryptoWithAli
Crypto Infrastructure: What Must Work Before Mass Adoption Can Scale?
Crypto adoption is about more than prices. For blockchain technology to serve millions of people, its infrastructure must be secure, efficient, and reliable. 🌐
🔹 1. Speed & Scalability
Networks must handle growing transaction volumes efficiently. Congestion and high fees can limit everyday use. Layer 2 solutions help address these challenges, but trade-offs remain.
🔹 2. Security & Reliability
Networks, wallets, smart contracts, and applications need strong security practices. Audits, testing, and monitoring help reduce risks, but no system is completely risk-free.
🔹 3. User Experience (UX)
Complex wallets, confusing fees, and difficult interfaces can discourage new users. Simple onboarding and clear transaction information can make crypto easier to use.
🔹 4. Interoperability
Different blockchains need practical ways to connect. Cross-chain tools can improve connectivity, but bridges may introduce additional security risks.
🔹 5. Regulation & Trust
Clear rules can help users and businesses understand their responsibilities. Consumer protection, privacy, and consistent standards also matter.
💡 Key Takeaway:
Mass adoption requires more than one breakthrough. It depends on scalability, security, usability, interoperability, and trustworthy standards working together.
The strongest infrastructure is technology people can use reliably—not simply technology that attracts attention.
💬 Your Opinion: What matters most for broader crypto adoption: speed, security, UX, or regulation?
Follow Crypto With Ali for practical crypto and Web3 education.
Educational content only. Not financial advice.
#CryptoInfrastructure #blockchain #Web3 #cryptoeducation #CryptoWithAli
Crypto adoption is about more than prices. For blockchain technology to serve millions of people, its infrastructure must be secure, efficient, and reliable. 🌐
🔹 1. Speed & Scalability
Networks must handle growing transaction volumes efficiently. Congestion and high fees can limit everyday use. Layer 2 solutions help address these challenges, but trade-offs remain.
🔹 2. Security & Reliability
Networks, wallets, smart contracts, and applications need strong security practices. Audits, testing, and monitoring help reduce risks, but no system is completely risk-free.
🔹 3. User Experience (UX)
Complex wallets, confusing fees, and difficult interfaces can discourage new users. Simple onboarding and clear transaction information can make crypto easier to use.
🔹 4. Interoperability
Different blockchains need practical ways to connect. Cross-chain tools can improve connectivity, but bridges may introduce additional security risks.
🔹 5. Regulation & Trust
Clear rules can help users and businesses understand their responsibilities. Consumer protection, privacy, and consistent standards also matter.
💡 Key Takeaway:
Mass adoption requires more than one breakthrough. It depends on scalability, security, usability, interoperability, and trustworthy standards working together.
The strongest infrastructure is technology people can use reliably—not simply technology that attracts attention.
💬 Your Opinion: What matters most for broader crypto adoption: speed, security, UX, or regulation?
Follow Crypto With Ali for practical crypto and Web3 education.
Educational content only. Not financial advice.
#CryptoInfrastructure #blockchain #Web3 #cryptoeducation #CryptoWithAli

49
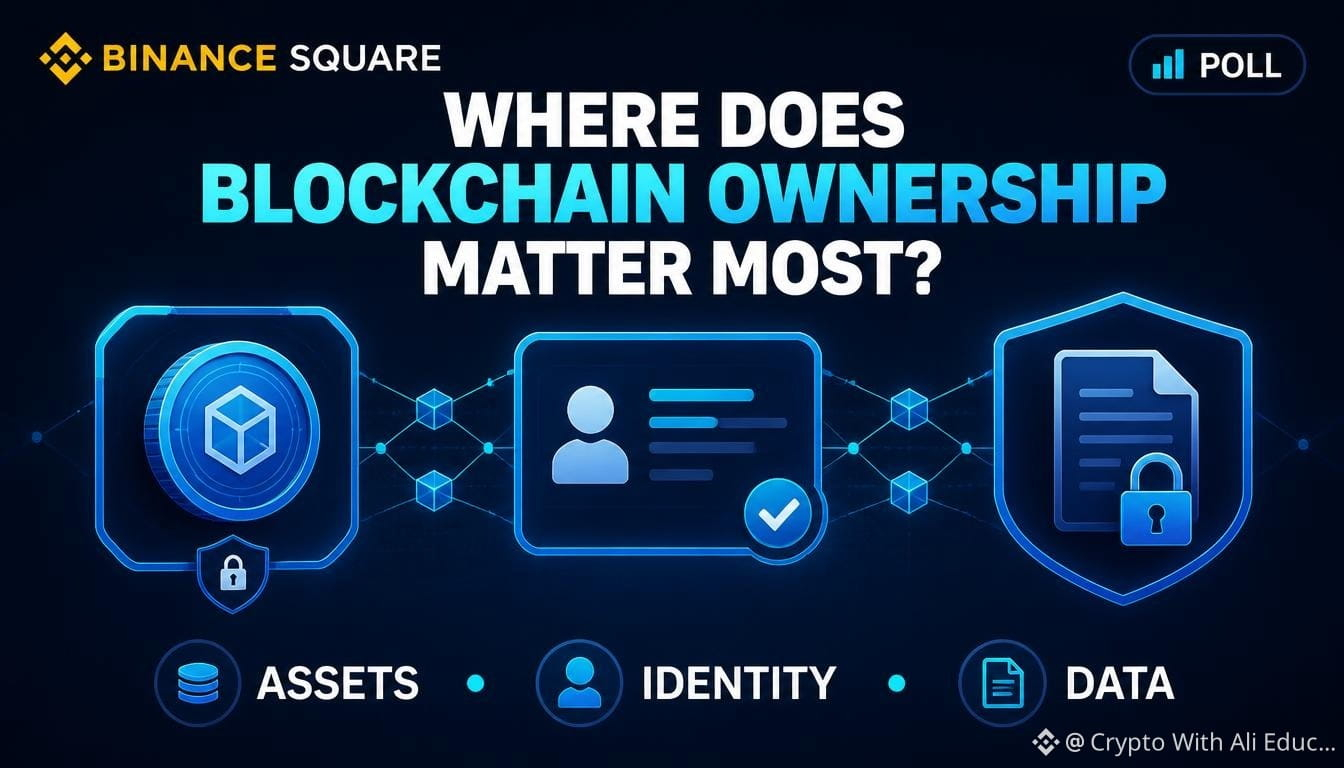
📊 Blockchain Ownership Is Most Relevant To →
Blockchain technology can help record and verify ownership-related information in different areas of the digital world.
But where do you think it could make the biggest difference?
🔹 A. Assets
🔹 B. Identity
🔹 C. Data
🔹 D. All Three
💬 Cast your vote and share your reasoning in the comments.
Remember: blockchain records can support verification, but legal rights, privacy, and security still matter.
Educational content only. Not financial advice.
#BinanceSquare #blockchain #web #CryptoCommunity #CryptoWithAli
📊 Blockchain Ownership Is Most Relevant To →
Blockchain technology can help record and verify ownership-related information in different areas of the digital world.
But where do you think it could make the biggest difference?
🔹 A. Assets
🔹 B. Identity
🔹 C. Data
🔹 D. All Three
💬 Cast your vote and share your reasoning in the comments.
Remember: blockchain records can support verification, but legal rights, privacy, and security still matter.
Educational content only. Not financial advice.
#BinanceSquare #blockchain #web #CryptoCommunity #CryptoWithAli
Blockchain technology can help record and verify ownership-related information in different areas of the digital world.
But where do you think it could make the biggest difference?
🔹 A. Assets
🔹 B. Identity
🔹 C. Data
🔹 D. All Three
💬 Cast your vote and share your reasoning in the comments.
Remember: blockchain records can support verification, but legal rights, privacy, and security still matter.
Educational content only. Not financial advice.
#BinanceSquare #blockchain #web #CryptoCommunity #CryptoWithAli
63
Digital Ownership: Why Blockchain Changes the Meaning of Ownership
In the digital world, owning something is not always as simple as having access to it. An account, a file, or an in-game item may depend on a platform's rules and permissions.
Blockchain technology introduces another way to manage and verify digital ownership. 🔗
🔹 1. Ownership of Digital Assets
Blockchain networks can record transactions involving digital assets, including cryptocurrencies and certain tokenized items. These records help participants verify transfers and balances.
🔹 2. NFTs and Digital Collectibles
Non-fungible tokens (NFTs) can represent unique digital items or links to other assets. However, owning an NFT does not automatically mean owning the copyright or every commercial right to the content.
🔹 3. More Control Through Private Keys
With compatible self-custody wallets, users can control the keys used to authorize transactions. This can reduce dependence on a custodial provider, but losing the keys may mean losing access.
🔹 4. Identity and Data
Blockchain-based systems can support digital identity and verifiable credentials. Still, putting personal information directly on a public blockchain can create privacy risks. Sensitive data needs careful protection.
🔹 5. Ownership Has Limits
A blockchain record alone cannot guarantee legal ownership, physical possession, copyright, or enforceable rights. These depend on the asset, applicable laws, and the terms governing it.
💡 Key Takeaway:
Blockchain can make digital ownership easier to record and verify, but real ownership also depends on rights, security, and how the system is designed.
💬 Question: Where do you think blockchain ownership could have the greatest impact: assets, identity, data, or all three?
Follow Crypto With Ali for practical Web3 and blockchain education.
Educational content only. Not financial advice.
#Digital #blockchain #Web3 #nft #CryptoWithAli
Digital Ownership: Why Blockchain Changes the Meaning of Ownership
In the digital world, owning something is not always as simple as having access to it. An account, a file, or an in-game item may depend on a platform's rules and permissions.
Blockchain technology introduces another way to manage and verify digital ownership. 🔗
🔹 1. Ownership of Digital Assets
Blockchain networks can record transactions involving digital assets, including cryptocurrencies and certain tokenized items. These records help participants verify transfers and balances.
🔹 2. NFTs and Digital Collectibles
Non-fungible tokens (NFTs) can represent unique digital items or links to other assets. However, owning an NFT does not automatically mean owning the copyright or every commercial right to the content.
🔹 3. More Control Through Private Keys
With compatible self-custody wallets, users can control the keys used to authorize transactions. This can reduce dependence on a custodial provider, but losing the keys may mean losing access.
🔹 4. Identity and Data
Blockchain-based systems can support digital identity and verifiable credentials. Still, putting personal information directly on a public blockchain can create privacy risks. Sensitive data needs careful protection.
🔹 5. Ownership Has Limits
A blockchain record alone cannot guarantee legal ownership, physical possession, copyright, or enforceable rights. These depend on the asset, applicable laws, and the terms governing it.
💡 Key Takeaway:
Blockchain can make digital ownership easier to record and verify, but real ownership also depends on rights, security, and how the system is designed.
💬 Question: Where do you think blockchain ownership could have the greatest impact: assets, identity, data, or all three?
Follow Crypto With Ali for practical Web3 and blockchain education.
Educational content only. Not financial advice.
#Digital #blockchain #Web3 #nft #CryptoWithAli
In the digital world, owning something is not always as simple as having access to it. An account, a file, or an in-game item may depend on a platform's rules and permissions.
Blockchain technology introduces another way to manage and verify digital ownership. 🔗
🔹 1. Ownership of Digital Assets
Blockchain networks can record transactions involving digital assets, including cryptocurrencies and certain tokenized items. These records help participants verify transfers and balances.
🔹 2. NFTs and Digital Collectibles
Non-fungible tokens (NFTs) can represent unique digital items or links to other assets. However, owning an NFT does not automatically mean owning the copyright or every commercial right to the content.
🔹 3. More Control Through Private Keys
With compatible self-custody wallets, users can control the keys used to authorize transactions. This can reduce dependence on a custodial provider, but losing the keys may mean losing access.
🔹 4. Identity and Data
Blockchain-based systems can support digital identity and verifiable credentials. Still, putting personal information directly on a public blockchain can create privacy risks. Sensitive data needs careful protection.
🔹 5. Ownership Has Limits
A blockchain record alone cannot guarantee legal ownership, physical possession, copyright, or enforceable rights. These depend on the asset, applicable laws, and the terms governing it.
💡 Key Takeaway:
Blockchain can make digital ownership easier to record and verify, but real ownership also depends on rights, security, and how the system is designed.
💬 Question: Where do you think blockchain ownership could have the greatest impact: assets, identity, data, or all three?
Follow Crypto With Ali for practical Web3 and blockchain education.
Educational content only. Not financial advice.
#Digital #blockchain #Web3 #nft #CryptoWithAli

68
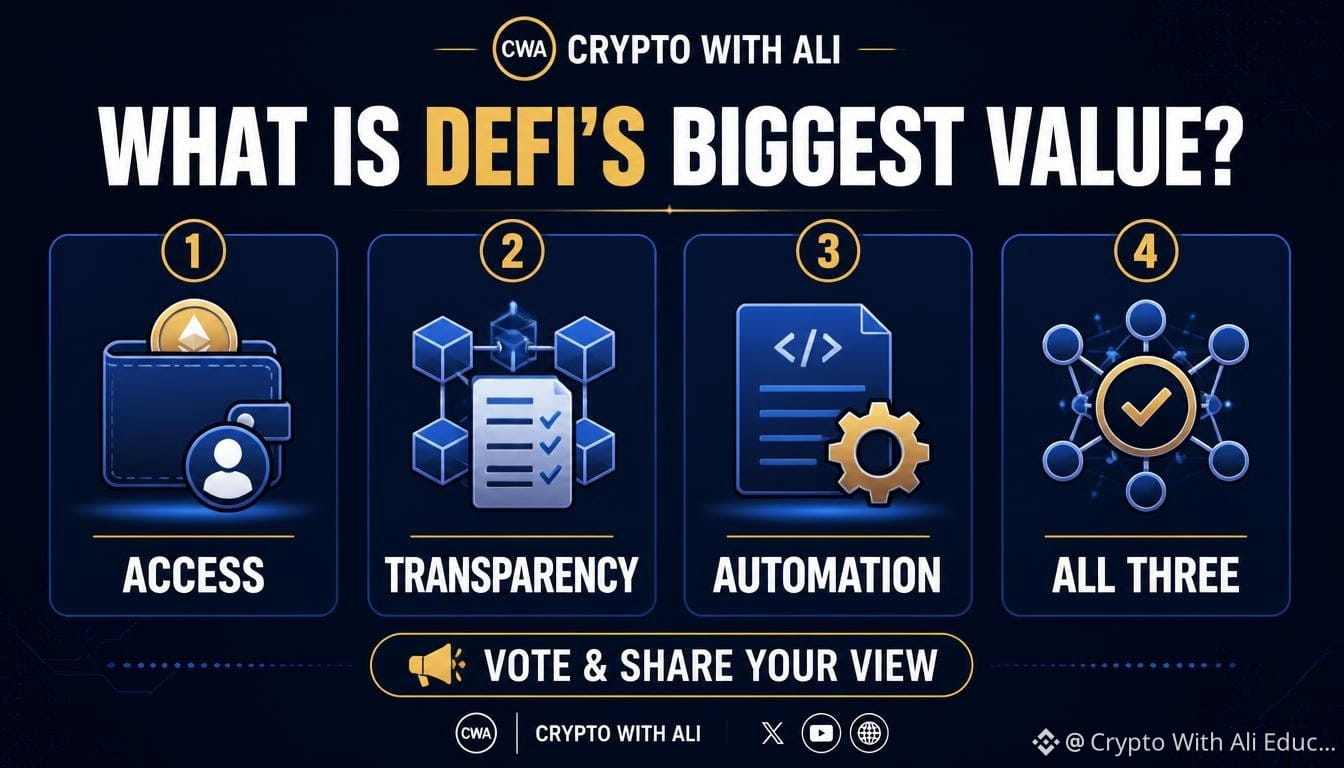
DeFi's Biggest Value: Access / Transparency / Automation / All Three?
Decentralized Finance uses blockchain networks and smart contracts to support financial services without relying on the same traditional intermediary structure.
Which benefit do you consider most important?
📊 Choose your answer:
Access — connecting to available financial applications
Transparency — inspecting on-chain activity
Automation — smart contracts executing predefined rules
All Three — a combination of these benefits
💬 Vote and explain your choice in the comments. Which benefit could make the biggest practical difference for everyday users?
Remember: DeFi also carries risks, including smart-contract
vulnerabilities, scams, liquidity problems, and transaction costs.
#defi #cryptoeducation #Web3 #Blockchain #CryptoWithAli
Follow for simple crypto education without drama
Educational content only. Not financial advice.
DeFi's Biggest Value: Access / Transparency / Automation / All Three?
Decentralized Finance uses blockchain networks and smart contracts to support financial services without relying on the same traditional intermediary structure.
Which benefit do you consider most important?
📊 Choose your answer:
Access — connecting to available financial applications
Transparency — inspecting on-chain activity
Automation — smart contracts executing predefined rules
All Three — a combination of these benefits
💬 Vote and explain your choice in the comments. Which benefit could make the biggest practical difference for everyday users?
Remember: DeFi also carries risks, including smart-contract
vulnerabilities, scams, liquidity problems, and transaction costs.
#defi #cryptoeducation #Web3 #Blockchain #CryptoWithAli
Follow for simple crypto education without drama
Educational content only. Not financial advice.
Decentralized Finance uses blockchain networks and smart contracts to support financial services without relying on the same traditional intermediary structure.
Which benefit do you consider most important?
📊 Choose your answer:
Access — connecting to available financial applications
Transparency — inspecting on-chain activity
Automation — smart contracts executing predefined rules
All Three — a combination of these benefits
💬 Vote and explain your choice in the comments. Which benefit could make the biggest practical difference for everyday users?
Remember: DeFi also carries risks, including smart-contract
vulnerabilities, scams, liquidity problems, and transaction costs.
#defi #cryptoeducation #Web3 #Blockchain #CryptoWithAli
Follow for simple crypto education without drama
Educational content only. Not financial advice.
59
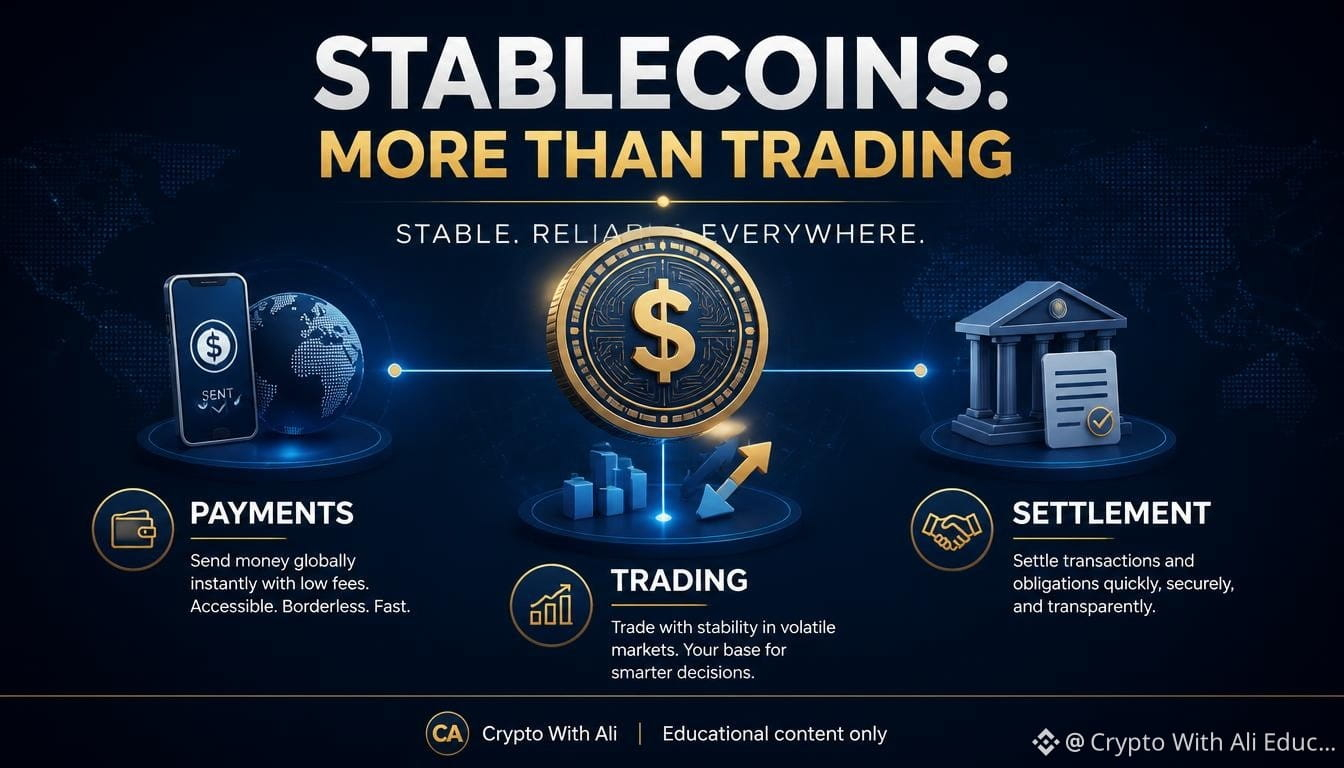
Stablecoins: Why They Matter Beyond Crypto Trading
Stablecoins are often discussed as tools for moving in and out of cryptocurrency positions. But their potential role extends far beyond trading.
What is a stablecoin?
A stablecoin is a type of crypto asset designed to maintain a relatively stable value, often by tracking a currency such as the US dollar. However, stability is not guaranteed, and different stablecoins carry different risks.
Why do they matter?
🔹 1. Payments
Stablecoins may enable digital transfers between people or businesses, including across borders, depending on the network, fees, and local regulations.
🔹 2. Trading
They can provide a quote-asset option on crypto platforms, allowing users to measure digital-asset prices against a more stable reference than many volatile cryptocurrencies.
🔹 3. Settlement
Blockchain-based transfers may allow value to move between participants without relying on the same traditional settlement process. Actual speed, cost, and availability depend on the network and service providers.
🔹 4. Access to digital dollars
In some regions, dollar-linked stablecoins are used to access a digital representation of dollar value. Availability, redemption, and legal protections vary by issuer and jurisdiction.
What risks should users understand?
Stablecoins are not risk-free. Users should consider reserve quality, issuer transparency, redemption terms, depegging risk, blockchain security, and regulatory requirements.
The key takeaway: Stablecoins are more than a trading tool. Their broader significance lies in how digital value may be transferred, stored, and settled.
💬 Question: Which use case matters most for the future of stablecoins — payments, trading, or settlement?
Follow Crypto With Ali for clear, practical crypto education.
Educational content only. Not financial advice.
#Stablecoins #CryptoEducatio #blockchain #digitalpayments #CryptoWithAli
Stablecoins: Why They Matter Beyond Crypto Trading
Stablecoins are often discussed as tools for moving in and out of cryptocurrency positions. But their potential role extends far beyond trading.
What is a stablecoin?
A stablecoin is a type of crypto asset designed to maintain a relatively stable value, often by tracking a currency such as the US dollar. However, stability is not guaranteed, and different stablecoins carry different risks.
Why do they matter?
🔹 1. Payments
Stablecoins may enable digital transfers between people or businesses, including across borders, depending on the network, fees, and local regulations.
🔹 2. Trading
They can provide a quote-asset option on crypto platforms, allowing users to measure digital-asset prices against a more stable reference than many volatile cryptocurrencies.
🔹 3. Settlement
Blockchain-based transfers may allow value to move between participants without relying on the same traditional settlement process. Actual speed, cost, and availability depend on the network and service providers.
🔹 4. Access to digital dollars
In some regions, dollar-linked stablecoins are used to access a digital representation of dollar value. Availability, redemption, and legal protections vary by issuer and jurisdiction.
What risks should users understand?
Stablecoins are not risk-free. Users should consider reserve quality, issuer transparency, redemption terms, depegging risk, blockchain security, and regulatory requirements.
The key takeaway: Stablecoins are more than a trading tool. Their broader significance lies in how digital value may be transferred, stored, and settled.
💬 Question: Which use case matters most for the future of stablecoins — payments, trading, or settlement?
Follow Crypto With Ali for clear, practical crypto education.
Educational content only. Not financial advice.
#Stablecoins #CryptoEducatio #blockchain #digitalpayments #CryptoWithAli
Stablecoins are often discussed as tools for moving in and out of cryptocurrency positions. But their potential role extends far beyond trading.
What is a stablecoin?
A stablecoin is a type of crypto asset designed to maintain a relatively stable value, often by tracking a currency such as the US dollar. However, stability is not guaranteed, and different stablecoins carry different risks.
Why do they matter?
🔹 1. Payments
Stablecoins may enable digital transfers between people or businesses, including across borders, depending on the network, fees, and local regulations.
🔹 2. Trading
They can provide a quote-asset option on crypto platforms, allowing users to measure digital-asset prices against a more stable reference than many volatile cryptocurrencies.
🔹 3. Settlement
Blockchain-based transfers may allow value to move between participants without relying on the same traditional settlement process. Actual speed, cost, and availability depend on the network and service providers.
🔹 4. Access to digital dollars
In some regions, dollar-linked stablecoins are used to access a digital representation of dollar value. Availability, redemption, and legal protections vary by issuer and jurisdiction.
What risks should users understand?
Stablecoins are not risk-free. Users should consider reserve quality, issuer transparency, redemption terms, depegging risk, blockchain security, and regulatory requirements.
The key takeaway: Stablecoins are more than a trading tool. Their broader significance lies in how digital value may be transferred, stored, and settled.
💬 Question: Which use case matters most for the future of stablecoins — payments, trading, or settlement?
Follow Crypto With Ali for clear, practical crypto education.
Educational content only. Not financial advice.
#Stablecoins #CryptoEducatio #blockchain #digitalpayments #CryptoWithAli
79
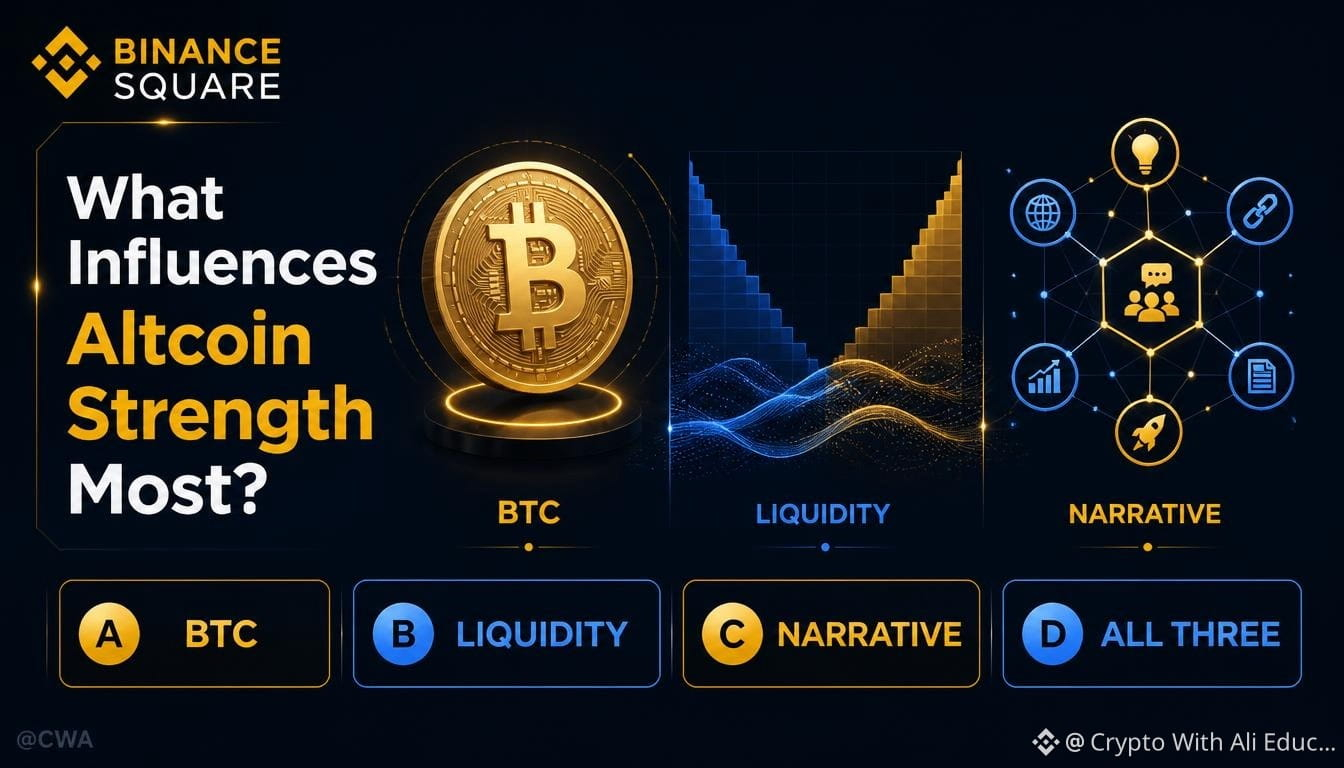
Poll: Altcoin Strength Depends Most On →
📊 What do you think matters most when evaluating altcoin strength?
🔹 BTC — Bitcoin's direction and its influence on the wider market.
🔹 Liquidity — Trading activity, market depth, and broader market conditions.
🔹 Narrative — Attention around a sector, technology, or use case.
🔹 All Three — Considering Bitcoin, liquidity, and narratives together.
Altcoin performance can be influenced by several factors at once.
None of these alone guarantees that an asset will outperform.
💬 Vote and explain your choice in the comments!
Crypto is a journey — follow to learn step by step
#CryptoPoll #altcoins #cryptoeducation #MarketAnalysis #CryptoWithAli
Poll: Altcoin Strength Depends Most On →
📊 What do you think matters most when evaluating altcoin strength?
🔹 BTC — Bitcoin's direction and its influence on the wider market.
🔹 Liquidity — Trading activity, market depth, and broader market conditions.
🔹 Narrative — Attention around a sector, technology, or use case.
🔹 All Three — Considering Bitcoin, liquidity, and narratives together.
Altcoin performance can be influenced by several factors at once.
None of these alone guarantees that an asset will outperform.
💬 Vote and explain your choice in the comments!
Crypto is a journey — follow to learn step by step
#CryptoPoll #altcoins #cryptoeducation #MarketAnalysis #CryptoWithAli
📊 What do you think matters most when evaluating altcoin strength?
🔹 BTC — Bitcoin's direction and its influence on the wider market.
🔹 Liquidity — Trading activity, market depth, and broader market conditions.
🔹 Narrative — Attention around a sector, technology, or use case.
🔹 All Three — Considering Bitcoin, liquidity, and narratives together.
Altcoin performance can be influenced by several factors at once.
None of these alone guarantees that an asset will outperform.
💬 Vote and explain your choice in the comments!
Crypto is a journey — follow to learn step by step
#CryptoPoll #altcoins #cryptoeducation #MarketAnalysis #CryptoWithAli
84
Poll: For Market Analysis You Watch → BTC / ETH / Both?
📊 When analyzing the crypto market, which asset do you follow most closely?
🟠 BTC — To study Bitcoin's price structure and broader market influence.
🔵 ETH — To follow Ethereum's market behavior and its blockchain ecosystem.
🟣 Both — To compare relative performance and understand broader market conditions.
Bitcoin and Ethereum have different roles, so looking at both can provide a broader perspective.
💬 Vote and tell us why in the comments!
#CryptoPoll #bitcoin #Ethereum #cryptoeducation #CryptoWithAli
Poll: For Market Analysis You Watch → BTC / ETH / Both?
📊 When analyzing the crypto market, which asset do you follow most closely?
🟠 BTC — To study Bitcoin's price structure and broader market influence.
🔵 ETH — To follow Ethereum's market behavior and its blockchain ecosystem.
🟣 Both — To compare relative performance and understand broader market conditions.
Bitcoin and Ethereum have different roles, so looking at both can provide a broader perspective.
💬 Vote and tell us why in the comments!
#CryptoPoll #bitcoin #Ethereum #cryptoeducation #CryptoWithAli
📊 When analyzing the crypto market, which asset do you follow most closely?
🟠 BTC — To study Bitcoin's price structure and broader market influence.
🔵 ETH — To follow Ethereum's market behavior and its blockchain ecosystem.
🟣 Both — To compare relative performance and understand broader market conditions.
Bitcoin and Ethereum have different roles, so looking at both can provide a broader perspective.
💬 Vote and tell us why in the comments!
#CryptoPoll #bitcoin #Ethereum #cryptoeducation #CryptoWithAli

101
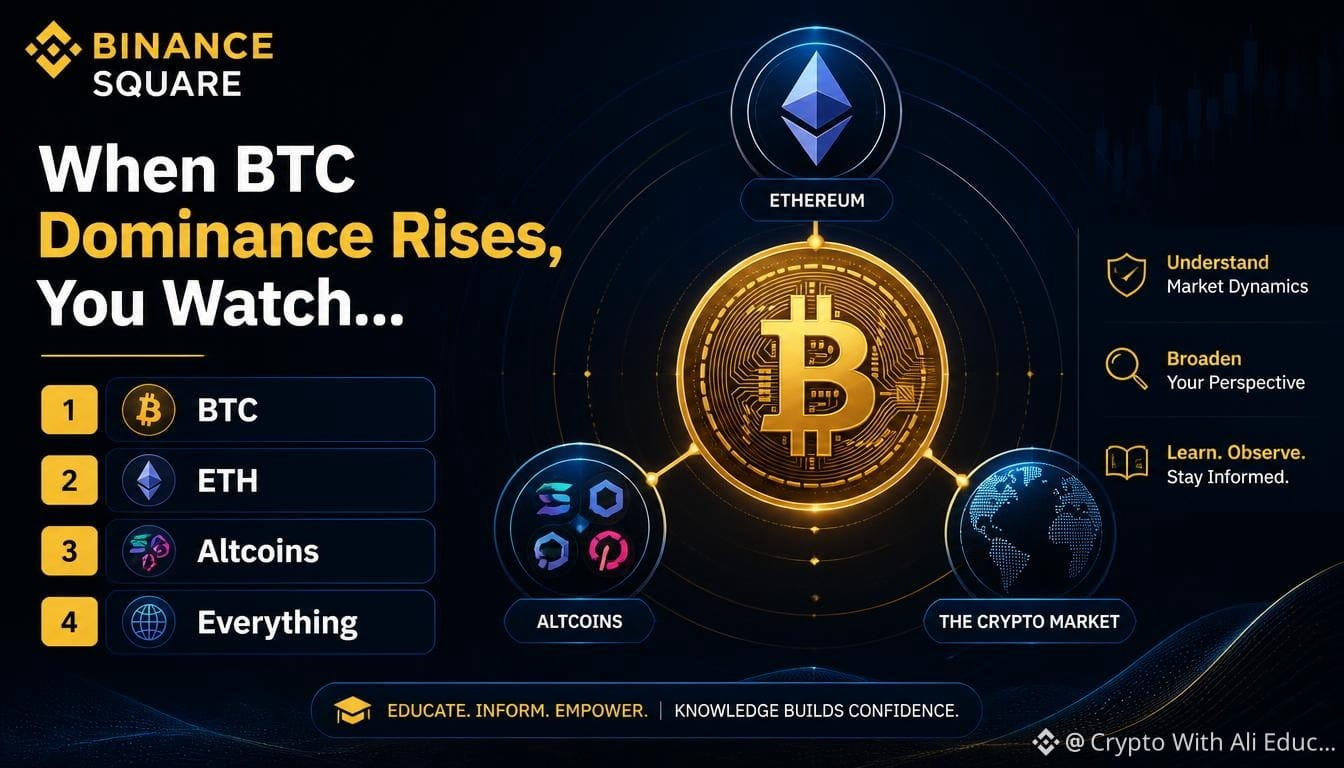
Poll: When BTC Dominance Rises, You Watch →
📊 When Bitcoin's share of the crypto market increases, what do you pay attention to first?
🔹 BTC — Bitcoin's price structure and relative strength
🔹 ETH — Ethereum's performance against Bitcoin
🔹 Altcoins — Whether broader altcoin participation is changing
🔹 Everything — BTC dominance, ETH, altcoins, liquidity, and
sentiment together
There is no single metric that explains the entire market. BTC dominance becomes more useful when viewed alongside price performance and broader market conditions.
💬 Vote and share your reasoning in the comments!
#CryptoPoll #BTCdominance #bitcoin #altcoins #CryptoWithAli
Poll: When BTC Dominance Rises, You Watch →
📊 When Bitcoin's share of the crypto market increases, what do you pay attention to first?
🔹 BTC — Bitcoin's price structure and relative strength
🔹 ETH — Ethereum's performance against Bitcoin
🔹 Altcoins — Whether broader altcoin participation is changing
🔹 Everything — BTC dominance, ETH, altcoins, liquidity, and
sentiment together
There is no single metric that explains the entire market. BTC dominance becomes more useful when viewed alongside price performance and broader market conditions.
💬 Vote and share your reasoning in the comments!
#CryptoPoll #BTCdominance #bitcoin #altcoins #CryptoWithAli
📊 When Bitcoin's share of the crypto market increases, what do you pay attention to first?
🔹 BTC — Bitcoin's price structure and relative strength
🔹 ETH — Ethereum's performance against Bitcoin
🔹 Altcoins — Whether broader altcoin participation is changing
🔹 Everything — BTC dominance, ETH, altcoins, liquidity, and
sentiment together
There is no single metric that explains the entire market. BTC dominance becomes more useful when viewed alongside price performance and broader market conditions.
💬 Vote and share your reasoning in the comments!
#CryptoPoll #BTCdominance #bitcoin #altcoins #CryptoWithAli
110
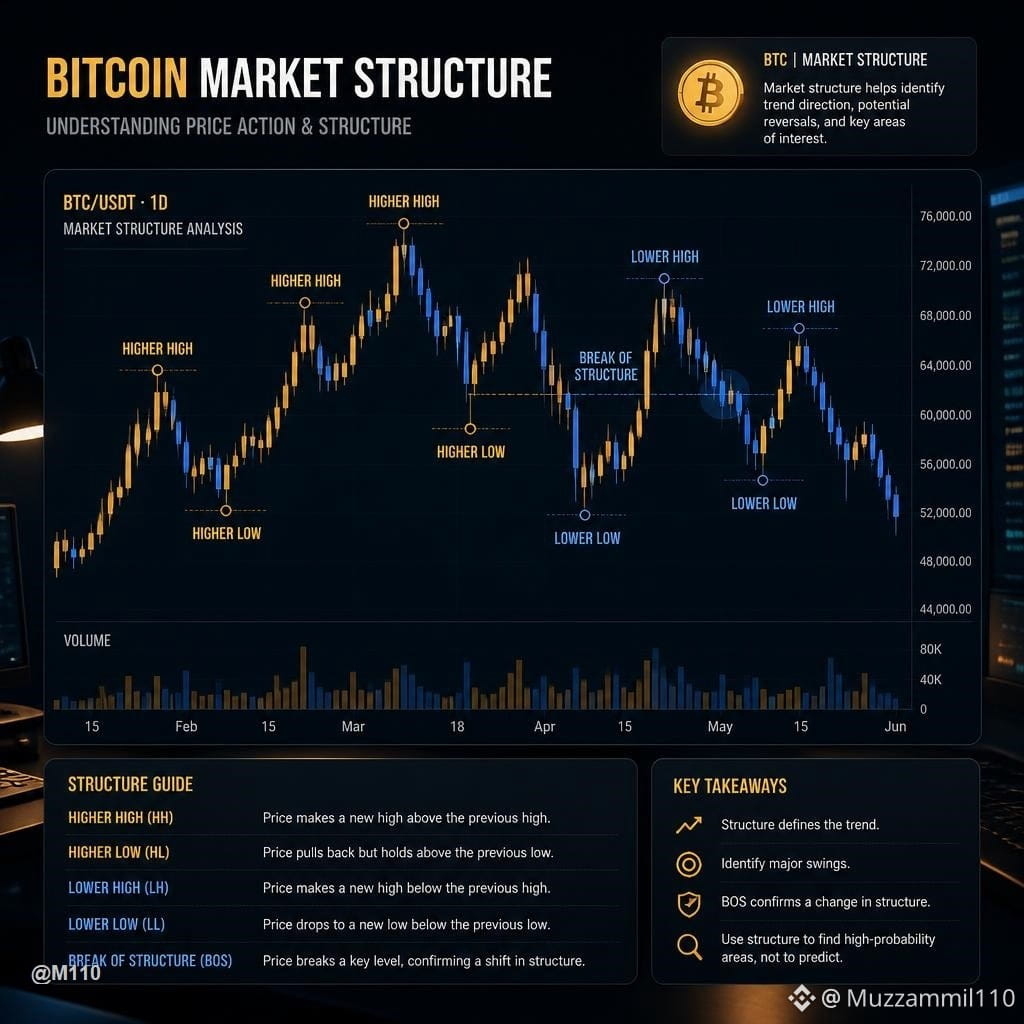
📊 BTC Market Structure: How to Tell If the Trend Is Actually Changing
A price move alone doesn't always mean the trend has changed.
Before calling a trend reversal, look at the market structure.
🔹 1. Higher Highs + Higher Lows
A series of higher highs and higher lows generally shows that buyers are maintaining the structure.
🔹 2. Lower Highs + Lower Lows
When the structure starts producing lower highs and lower lows, selling pressure may be becoming more dominant.
🔹 3. Break of Structure
A meaningful break of a previous swing point can be an important clue—but one break alone doesn't confirm a complete trend reversal.
🔹 4. Volume
Price structure becomes more useful when you also examine participation. A move with stronger volume can provide additional context.
🔹 5. Timeframe Matters
A structure change on a short timeframe doesn't automatically mean the larger trend has changed.
📌 Simple rule:
Don't ask only, "Is Bitcoin going up or down?"
Ask:
"What is the market structure showing?"
$BTC
This is educational content, not a trading signal or financial advice.
💬 What do you check first when studying BTC: structure, volume, or sentiment?
More market updates coming daily — follow along
#cryptotrading #priceaction #tradingeducation #CryptoWithAli #BinanceSquare
📊 BTC Market Structure: How to Tell If the Trend Is Actually Changing
A price move alone doesn't always mean the trend has changed.
Before calling a trend reversal, look at the market structure.
🔹 1. Higher Highs + Higher Lows
A series of higher highs and higher lows generally shows that buyers are maintaining the structure.
🔹 2. Lower Highs + Lower Lows
When the structure starts producing lower highs and lower lows, selling pressure may be becoming more dominant.
🔹 3. Break of Structure
A meaningful break of a previous swing point can be an important clue—but one break alone doesn't confirm a complete trend reversal.
🔹 4. Volume
Price structure becomes more useful when you also examine participation. A move with stronger volume can provide additional context.
🔹 5. Timeframe Matters
A structure change on a short timeframe doesn't automatically mean the larger trend has changed.
📌 Simple rule:
Don't ask only, "Is Bitcoin going up or down?"
Ask:
"What is the market structure showing?"
$BTC
This is educational content, not a trading signal or financial advice.
💬 What do you check first when studying BTC: structure, volume, or sentiment?
More market updates coming daily — follow along
#cryptotrading #priceaction #tradingeducation #CryptoWithAli #BinanceSquare
A price move alone doesn't always mean the trend has changed.
Before calling a trend reversal, look at the market structure.
🔹 1. Higher Highs + Higher Lows
A series of higher highs and higher lows generally shows that buyers are maintaining the structure.
🔹 2. Lower Highs + Lower Lows
When the structure starts producing lower highs and lower lows, selling pressure may be becoming more dominant.
🔹 3. Break of Structure
A meaningful break of a previous swing point can be an important clue—but one break alone doesn't confirm a complete trend reversal.
🔹 4. Volume
Price structure becomes more useful when you also examine participation. A move with stronger volume can provide additional context.
🔹 5. Timeframe Matters
A structure change on a short timeframe doesn't automatically mean the larger trend has changed.
📌 Simple rule:
Don't ask only, "Is Bitcoin going up or down?"
Ask:
"What is the market structure showing?"
$BTC
This is educational content, not a trading signal or financial advice.
💬 What do you check first when studying BTC: structure, volume, or sentiment?
More market updates coming daily — follow along
#cryptotrading #priceaction #tradingeducation #CryptoWithAli #BinanceSquare
70
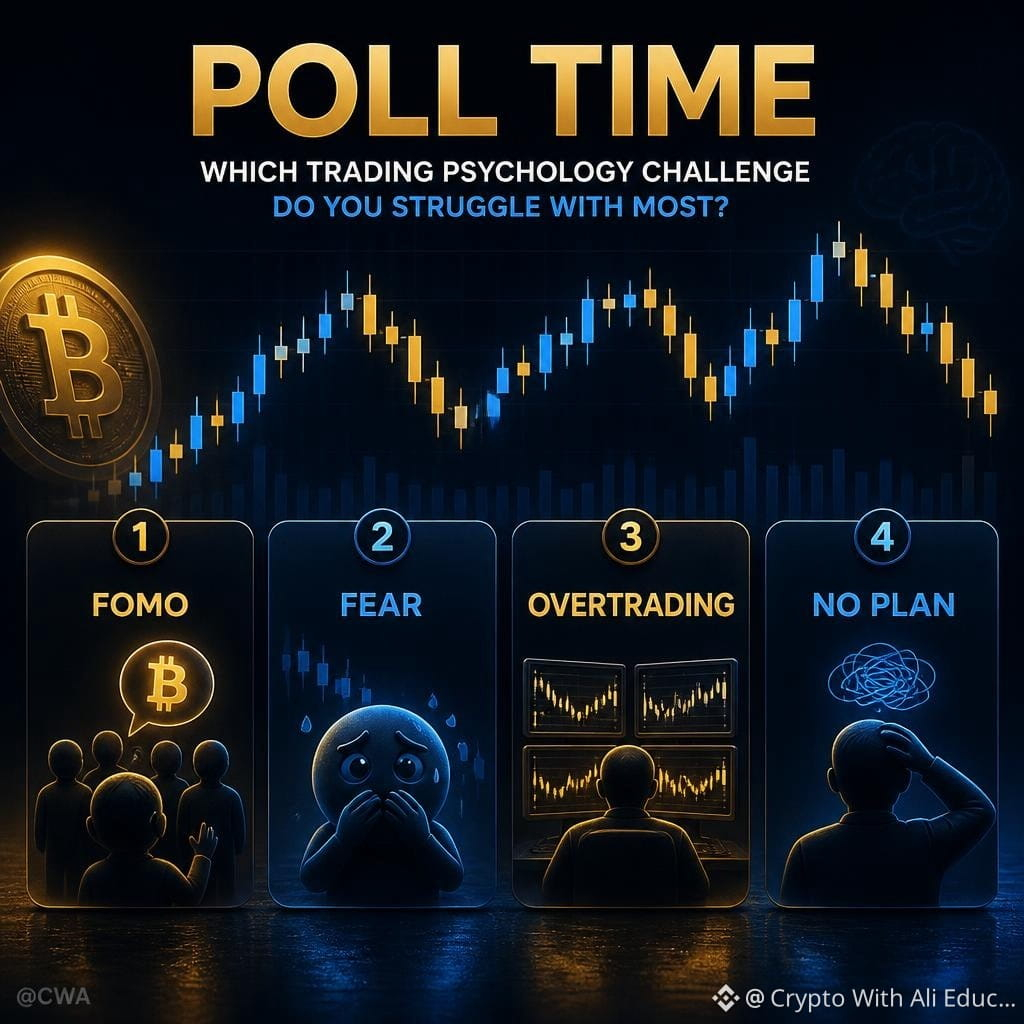
📊 Quick Trading Psychology Poll
Biggest Trading Problem?
🔘 FOMO
🔘 Fear
🔘 Overtrading
🔘 No Plan
Which one do you think causes the most problems for traders?
💬 Tell us why in the comments.
Understanding your own decision-making process is an important part of learning.
If this helped you, follow for more 👍
#BTC #TradingPsychology #FOMO #cryptoeducation #CryptoWithAli
📊 Quick Trading Psychology Poll
Biggest Trading Problem?
🔘 FOMO
🔘 Fear
🔘 Overtrading
🔘 No Plan
Which one do you think causes the most problems for traders?
💬 Tell us why in the comments.
Understanding your own decision-making process is an important part of learning.
If this helped you, follow for more 👍
#BTC #TradingPsychology #FOMO #cryptoeducation #CryptoWithAli
Biggest Trading Problem?
🔘 FOMO
🔘 Fear
🔘 Overtrading
🔘 No Plan
Which one do you think causes the most problems for traders?
💬 Tell us why in the comments.
Understanding your own decision-making process is an important part of learning.
If this helped you, follow for more 👍
#BTC #TradingPsychology #FOMO #cryptoeducation #CryptoWithAli
68
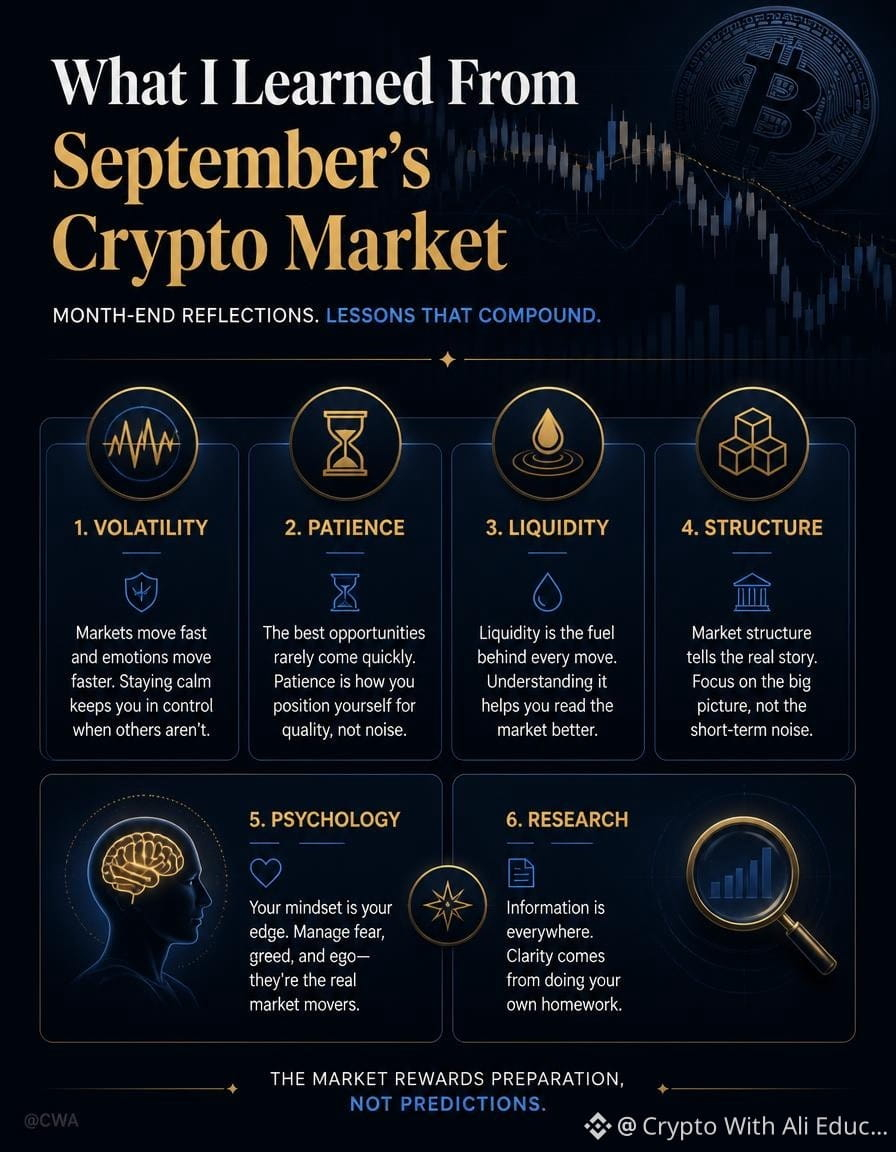
📚 What I Learned From September's Crypto Market
September wasn't just about price movements. It was a reminder that understanding the market matters more than reacting to every move.
Here are some lessons worth carrying forward:
1️⃣ Volatility is part of crypto
Fast moves can create both opportunity and noise. Understanding the move matters more than reacting to it.
2️⃣ Patience is a skill
Not every candle requires a decision. Sometimes observing is more useful than acting.
3️⃣ Liquidity provides context
Large areas of orders and liquidity can influence how price behaves, but liquidity alone doesn't tell us what happens next.
4️⃣ Structure matters
Higher highs, lower lows, ranges, support and resistance can help put short-term price action into perspective.
5️⃣ Indicators need context
RSI, MACD and volume can provide useful information, but no single indicator explains the entire market.
6️⃣ Psychology matters
FOMO, fear and overconfidence can make market noise feel more important than it actually is.
7️⃣ Headlines aren't the whole story
A headline can attract attention, but understanding adoption, liquidity, participation and structure gives deeper context.
The biggest lesson?
👉 Don't just watch what the market is doing. Learn why it may be doing it.
💬 What was your biggest crypto lesson from September?
Share your lesson below. 👇
Educational content only — not financial advice.
More market updates coming daily — follow along
#cryptoeducation #BTC #liquidity #BinanceSquare #CryptoWithAli
📚 What I Learned From September's Crypto Market
September wasn't just about price movements. It was a reminder that understanding the market matters more than reacting to every move.
Here are some lessons worth carrying forward:
1️⃣ Volatility is part of crypto
Fast moves can create both opportunity and noise. Understanding the move matters more than reacting to it.
2️⃣ Patience is a skill
Not every candle requires a decision. Sometimes observing is more useful than acting.
3️⃣ Liquidity provides context
Large areas of orders and liquidity can influence how price behaves, but liquidity alone doesn't tell us what happens next.
4️⃣ Structure matters
Higher highs, lower lows, ranges, support and resistance can help put short-term price action into perspective.
5️⃣ Indicators need context
RSI, MACD and volume can provide useful information, but no single indicator explains the entire market.
6️⃣ Psychology matters
FOMO, fear and overconfidence can make market noise feel more important than it actually is.
7️⃣ Headlines aren't the whole story
A headline can attract attention, but understanding adoption, liquidity, participation and structure gives deeper context.
The biggest lesson?
👉 Don't just watch what the market is doing. Learn why it may be doing it.
💬 What was your biggest crypto lesson from September?
Share your lesson below. 👇
Educational content only — not financial advice.
More market updates coming daily — follow along
#cryptoeducation #BTC #liquidity #BinanceSquare #CryptoWithAli
September wasn't just about price movements. It was a reminder that understanding the market matters more than reacting to every move.
Here are some lessons worth carrying forward:
1️⃣ Volatility is part of crypto
Fast moves can create both opportunity and noise. Understanding the move matters more than reacting to it.
2️⃣ Patience is a skill
Not every candle requires a decision. Sometimes observing is more useful than acting.
3️⃣ Liquidity provides context
Large areas of orders and liquidity can influence how price behaves, but liquidity alone doesn't tell us what happens next.
4️⃣ Structure matters
Higher highs, lower lows, ranges, support and resistance can help put short-term price action into perspective.
5️⃣ Indicators need context
RSI, MACD and volume can provide useful information, but no single indicator explains the entire market.
6️⃣ Psychology matters
FOMO, fear and overconfidence can make market noise feel more important than it actually is.
7️⃣ Headlines aren't the whole story
A headline can attract attention, but understanding adoption, liquidity, participation and structure gives deeper context.
The biggest lesson?
👉 Don't just watch what the market is doing. Learn why it may be doing it.
💬 What was your biggest crypto lesson from September?
Share your lesson below. 👇
Educational content only — not financial advice.
More market updates coming daily — follow along
#cryptoeducation #BTC #liquidity #BinanceSquare #CryptoWithAli
93
Log in to explore more content
Join global crypto users on Binance Square
⚡️ Get latest and useful information about crypto.
💬 Trusted by the world’s largest crypto exchange.
👍 Discover real insights from verified creators.
Email / Phone number
Trending Topics
1
#HuangExitNvidiaStrategyInFocus
20,356 views
530 Discussing
2
#AnthropicRejectsIPODelayValuationinQuestion
589,551 views
4,885 Discussing
3
#BitMineReports$6.3BNetLossForFiscal2026
3,090 views
77 Discussing
4
#ChipStocksExtendLossesAfterNvidiaCEOChange
8,641 views
257 Discussing
5
#ThailandProposes$148KDailyStablecoinDepositWithdrawalCaps
586 views
15 Discussing
6
#CoreWeaveJumps10%On168%RevenueGrowth
132,273 views
1,503 Discussing
7
#ZcashFallsBelow$1000ForFirstTimeSinceSeptember
67,148 views
252 Discussing
8
#MSCIRemovalMayCurbStrategy’sBitcoinBuying
29,523 views
481 Discussing
9
#TradFiForBeginners
502,156 views
3,527 Discussing
10
#USJoblessClaimsRise
19.1M views
7,664 Discussing