
#priceaction
priceaction
8.2M views
43,187 Discussing
Hot
Latest

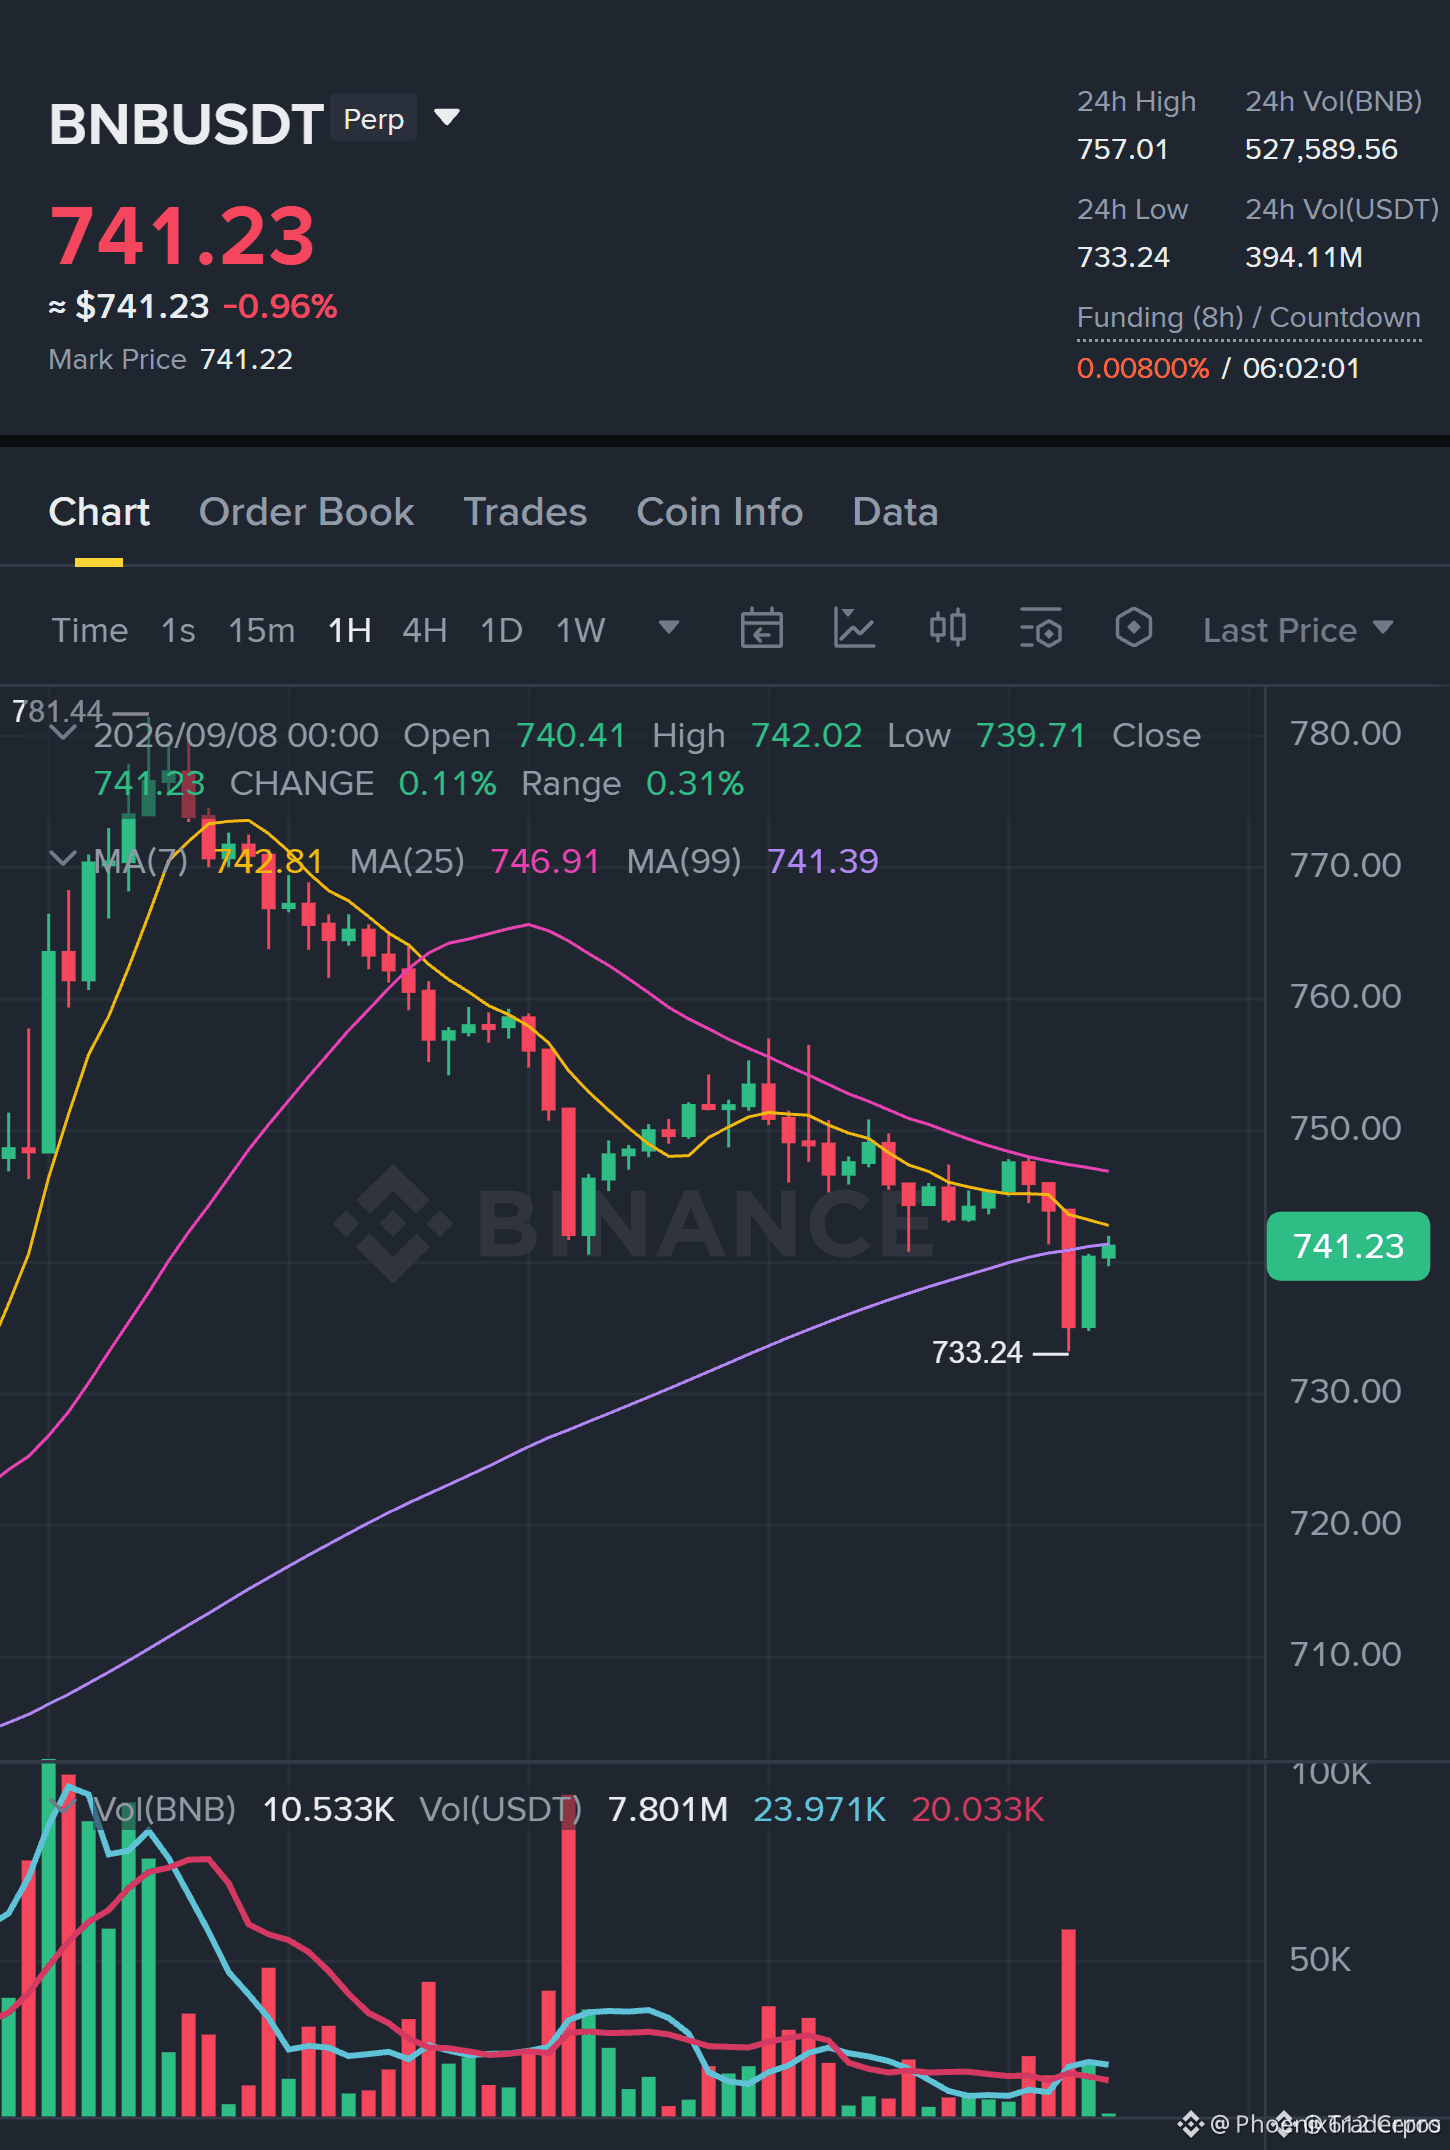
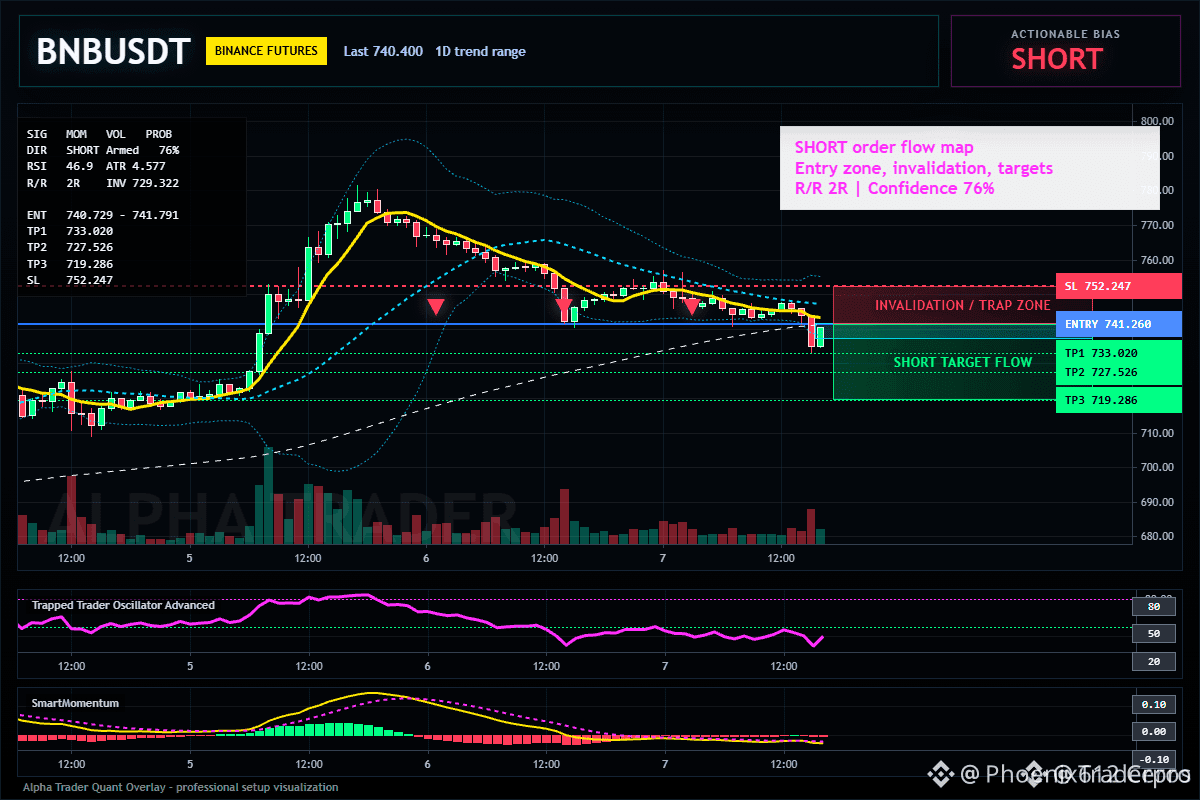
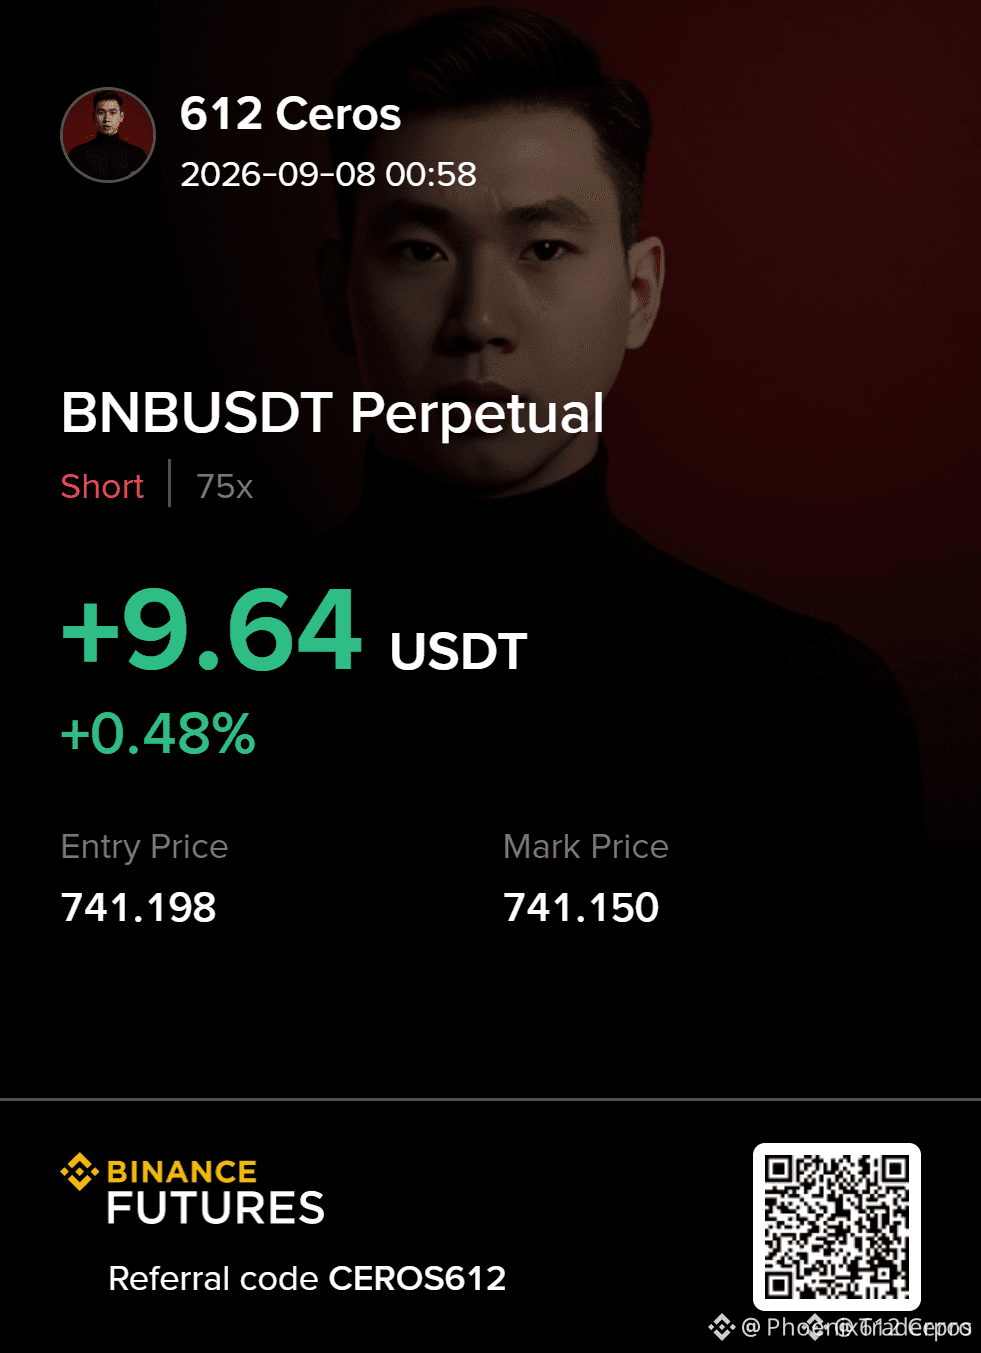
🔴 $BNB VOLATILITY SQUEEZE WEARING THIN AS BEARS PREPARE FOR A PULLBACK! 📉
Entry: 740.729 - 741.791 ⚡
Target: 727.526 🎯
Stop Loss: 752.247 ⚠️
1h ATR compression around $BNB signals seller pressure building right inside the 741 resistance zone. 📊 With 15m RSI sitting near 46.9, momentum is tilting downward without being overextended, setting up a tactical short-term rotation lower.
Since higher timeframes remain range-bound, this counter-trend play demands surgical risk management and proper position sizing. 💡 A quick shift in order flow can trigger rapid acceleration down toward secondary demand blocks.
💬 Will buyers absorb this supply near range mid-levels, or are we slicing straight into 727.526? 👇
⚠️ Not financial advice. Always manage your risk. 🛡️
🏷️ #BNB #ShortSetup #Crypto #PriceAction
📉 🐻
Entry: 740.729 - 741.791 ⚡
Target: 727.526 🎯
Stop Loss: 752.247 ⚠️
1h ATR compression around $BNB signals seller pressure building right inside the 741 resistance zone. 📊 With 15m RSI sitting near 46.9, momentum is tilting downward without being overextended, setting up a tactical short-term rotation lower.
Since higher timeframes remain range-bound, this counter-trend play demands surgical risk management and proper position sizing. 💡 A quick shift in order flow can trigger rapid acceleration down toward secondary demand blocks.
💬 Will buyers absorb this supply near range mid-levels, or are we slicing straight into 727.526? 👇
⚠️ Not financial advice. Always manage your risk. 🛡️
🏷️ #BNB #ShortSetup #Crypto #PriceAction
📉 🐻

If you are still blindly shorting strong momentum moves, stop now.
Most traders blow up their accounts trying to catch the exact top instead of waiting for real market confirmation. It feels tempting to fade every green candle, but front-running strength usually ends in liquidation.
The broader daily and weekly structure for $BTC remains undeniably bullish, and fighting that primary trend without a trigger is dangerous. While bulls argue that any short here is reckless, taking a calculated counter-trend scalp is valid if executed with discipline.
The key is waiting for a clean rejection and a confirmed lower-timeframe structure shift before taking action. Thinning buy volume and active sell-side order flow across majors like $ETH already hint at local exhaustion, but waiting for the actual breakdown separates a smart trade from pure gambling.
Where do you stand on taking counter-trend plays in this environment?
#CryptoTrading #Bitcoin #PriceAction
Most traders blow up their accounts trying to catch the exact top instead of waiting for real market confirmation. It feels tempting to fade every green candle, but front-running strength usually ends in liquidation.
The broader daily and weekly structure for $BTC remains undeniably bullish, and fighting that primary trend without a trigger is dangerous. While bulls argue that any short here is reckless, taking a calculated counter-trend scalp is valid if executed with discipline.
The key is waiting for a clean rejection and a confirmed lower-timeframe structure shift before taking action. Thinning buy volume and active sell-side order flow across majors like $ETH already hint at local exhaustion, but waiting for the actual breakdown separates a smart trade from pure gambling.
Where do you stand on taking counter-trend plays in this environment?
#CryptoTrading #Bitcoin #PriceAction

Most liquidity sweeps look like instant reversals right before they trap you into another leg down.
Traders constantly burn margin jumping into long positions the second a wick recovers, confusing a quick stop hunt with an actual trend shift.
That quick bounce back above 2.333 on the 15-minute chart might look like strength, but context is everything. The 1-hour timeframe is still printing clear lower highs and lower lows across the board, which means the higher timeframe trend remains firmly bearish.
When structural resistance stays intact on assets like $NEAR and $FET , a wick below key levels usually just grabs resting sell-side liquidity. It serves as fuel for downward continuation rather than a genuine shift in market character.
Are you treating this sweep as confirmation to short, or waiting for a structural break before taking a position?
#CryptoTrading #TechnicalAnalysis #PriceAction
Traders constantly burn margin jumping into long positions the second a wick recovers, confusing a quick stop hunt with an actual trend shift.
That quick bounce back above 2.333 on the 15-minute chart might look like strength, but context is everything. The 1-hour timeframe is still printing clear lower highs and lower lows across the board, which means the higher timeframe trend remains firmly bearish.
When structural resistance stays intact on assets like $NEAR and $FET , a wick below key levels usually just grabs resting sell-side liquidity. It serves as fuel for downward continuation rather than a genuine shift in market character.
Are you treating this sweep as confirmation to short, or waiting for a structural break before taking a position?
#CryptoTrading #TechnicalAnalysis #PriceAction

Most traders rush to buy liquidity sweeps thinking it is an instant reversal, but more often than not, it is just fuel for the trend to drop lower.
Getting chopped up trying to catch the absolute bottom on intraday dips is how accounts slowly bleed out. You see a quick wick, jump in early, and end up holding a bag right as momentum rolls over.
Looking at $NEAR right now, that sweep below 2.333 is not showing any real signs of buyer absorption. Instead of a sharp reclaim, price is printing another lower high on the 1h timeframe and grinding down about -0.6%. When a level breaks and fails to bounce aggressively, it usually signals that $SOL and other major L1 beta assets might follow the same path of least resistance.
Before trying to long these setups, wait for a confirmed shift in market structure rather than guessing the wick. Where do you see $NEAR finding actual demand from here?
#NEAR #CryptoTrading #PriceAction
Getting chopped up trying to catch the absolute bottom on intraday dips is how accounts slowly bleed out. You see a quick wick, jump in early, and end up holding a bag right as momentum rolls over.
Looking at $NEAR right now, that sweep below 2.333 is not showing any real signs of buyer absorption. Instead of a sharp reclaim, price is printing another lower high on the 1h timeframe and grinding down about -0.6%. When a level breaks and fails to bounce aggressively, it usually signals that $SOL and other major L1 beta assets might follow the same path of least resistance.
Before trying to long these setups, wait for a confirmed shift in market structure rather than guessing the wick. Where do you see $NEAR finding actual demand from here?
#NEAR #CryptoTrading #PriceAction



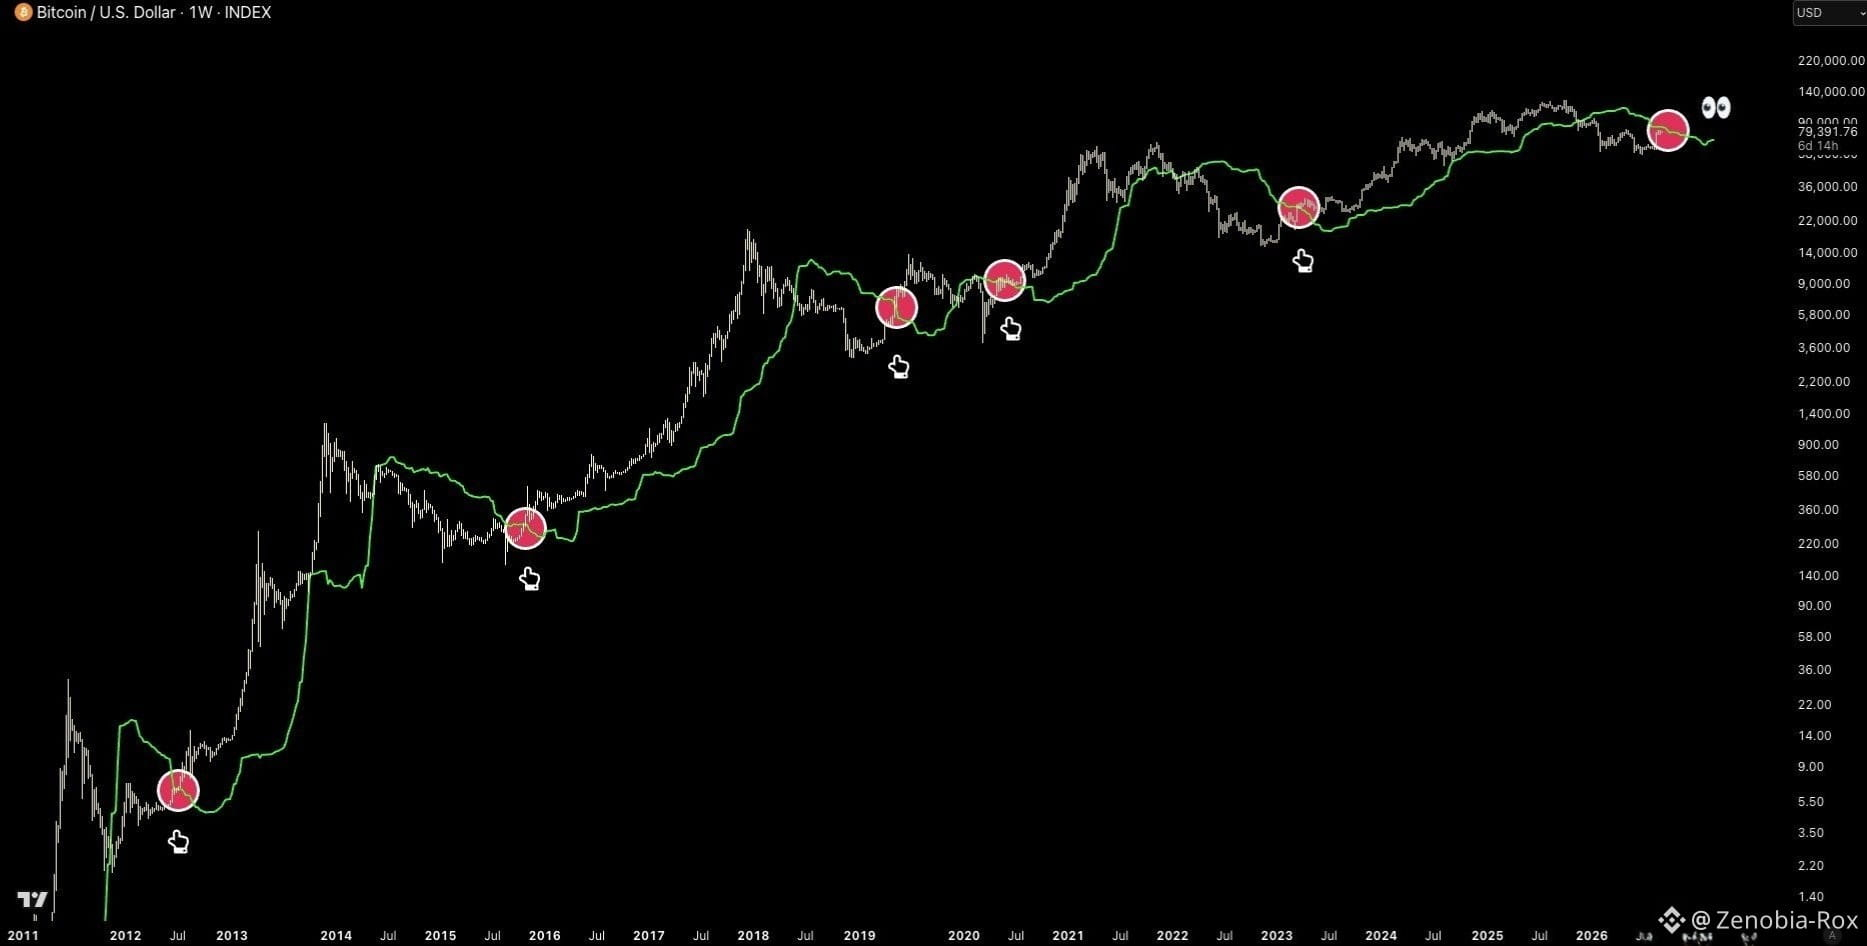
$BTC WEEKLY: THE TREND IS STILL BEING TESTED
Bitcoin is trading around $79,391 on the weekly chart, and the bigger picture remains constructive—but price is now sitting close to the green trend indicator that has historically acted as an important decision area.
📌 Executive View
The chart shows several previous periods where BTC reacted around this same green trend line before continuing into larger moves. The current price is again approaching that line, making this a high-interest confirmation zone, not a place to blindly chase.
Sentiment: 🟢 Bullish, with 7/10 confidence
Confirmation is still needed from weekly price action. $BTC
🔍 Technical Structure
The long-term structure remains upward, with BTC repeatedly forming higher major peaks and recoveries across the chart.
The green trend line is the key factor. Previous marked areas around 2012, 2015, 2019, 2020 and 2023 show notable reactions around this indicator.
Right now, BTC is around $79.4K, while the latest marked area suggests another potential trend decision.
🎯 Trade Plan
Entry: No precise entry is confirmed from the chart alone. A safer setup would be a weekly bullish reaction/reclaim around the green trend line.
TP1: ~$90K
TP2: ~$140K
TP3: ~$220K
These are based on visible chart levels, not guaranteed targets.
Stop Loss: No exact SL can be responsibly calculated without a confirmed entry. A weekly close decisively below the trend indicator would be the first warning.
Invalidation: Sustained weekly weakness below the green trend structure.
R:R: Cannot be accurately calculated until entry and stop are confirmed.
⚠️ Risk management matters here. Don’t treat historical reactions as a guarantee that the same pattern must repeat.$BTC
Will BTC defend this long-term trend structure again, or are we finally seeing a deeper correction?
#Crypto #Binance #PriceAction #TechnicalAnalysis #Binance
Bitcoin is trading around $79,391 on the weekly chart, and the bigger picture remains constructive—but price is now sitting close to the green trend indicator that has historically acted as an important decision area.
📌 Executive View
The chart shows several previous periods where BTC reacted around this same green trend line before continuing into larger moves. The current price is again approaching that line, making this a high-interest confirmation zone, not a place to blindly chase.
Sentiment: 🟢 Bullish, with 7/10 confidence
Confirmation is still needed from weekly price action. $BTC
🔍 Technical Structure
The long-term structure remains upward, with BTC repeatedly forming higher major peaks and recoveries across the chart.
The green trend line is the key factor. Previous marked areas around 2012, 2015, 2019, 2020 and 2023 show notable reactions around this indicator.
Right now, BTC is around $79.4K, while the latest marked area suggests another potential trend decision.
🎯 Trade Plan
Entry: No precise entry is confirmed from the chart alone. A safer setup would be a weekly bullish reaction/reclaim around the green trend line.
TP1: ~$90K
TP2: ~$140K
TP3: ~$220K
These are based on visible chart levels, not guaranteed targets.
Stop Loss: No exact SL can be responsibly calculated without a confirmed entry. A weekly close decisively below the trend indicator would be the first warning.
Invalidation: Sustained weekly weakness below the green trend structure.
R:R: Cannot be accurately calculated until entry and stop are confirmed.
⚠️ Risk management matters here. Don’t treat historical reactions as a guarantee that the same pattern must repeat.$BTC
Will BTC defend this long-term trend structure again, or are we finally seeing a deeper correction?
#Crypto #Binance #PriceAction #TechnicalAnalysis #Binance

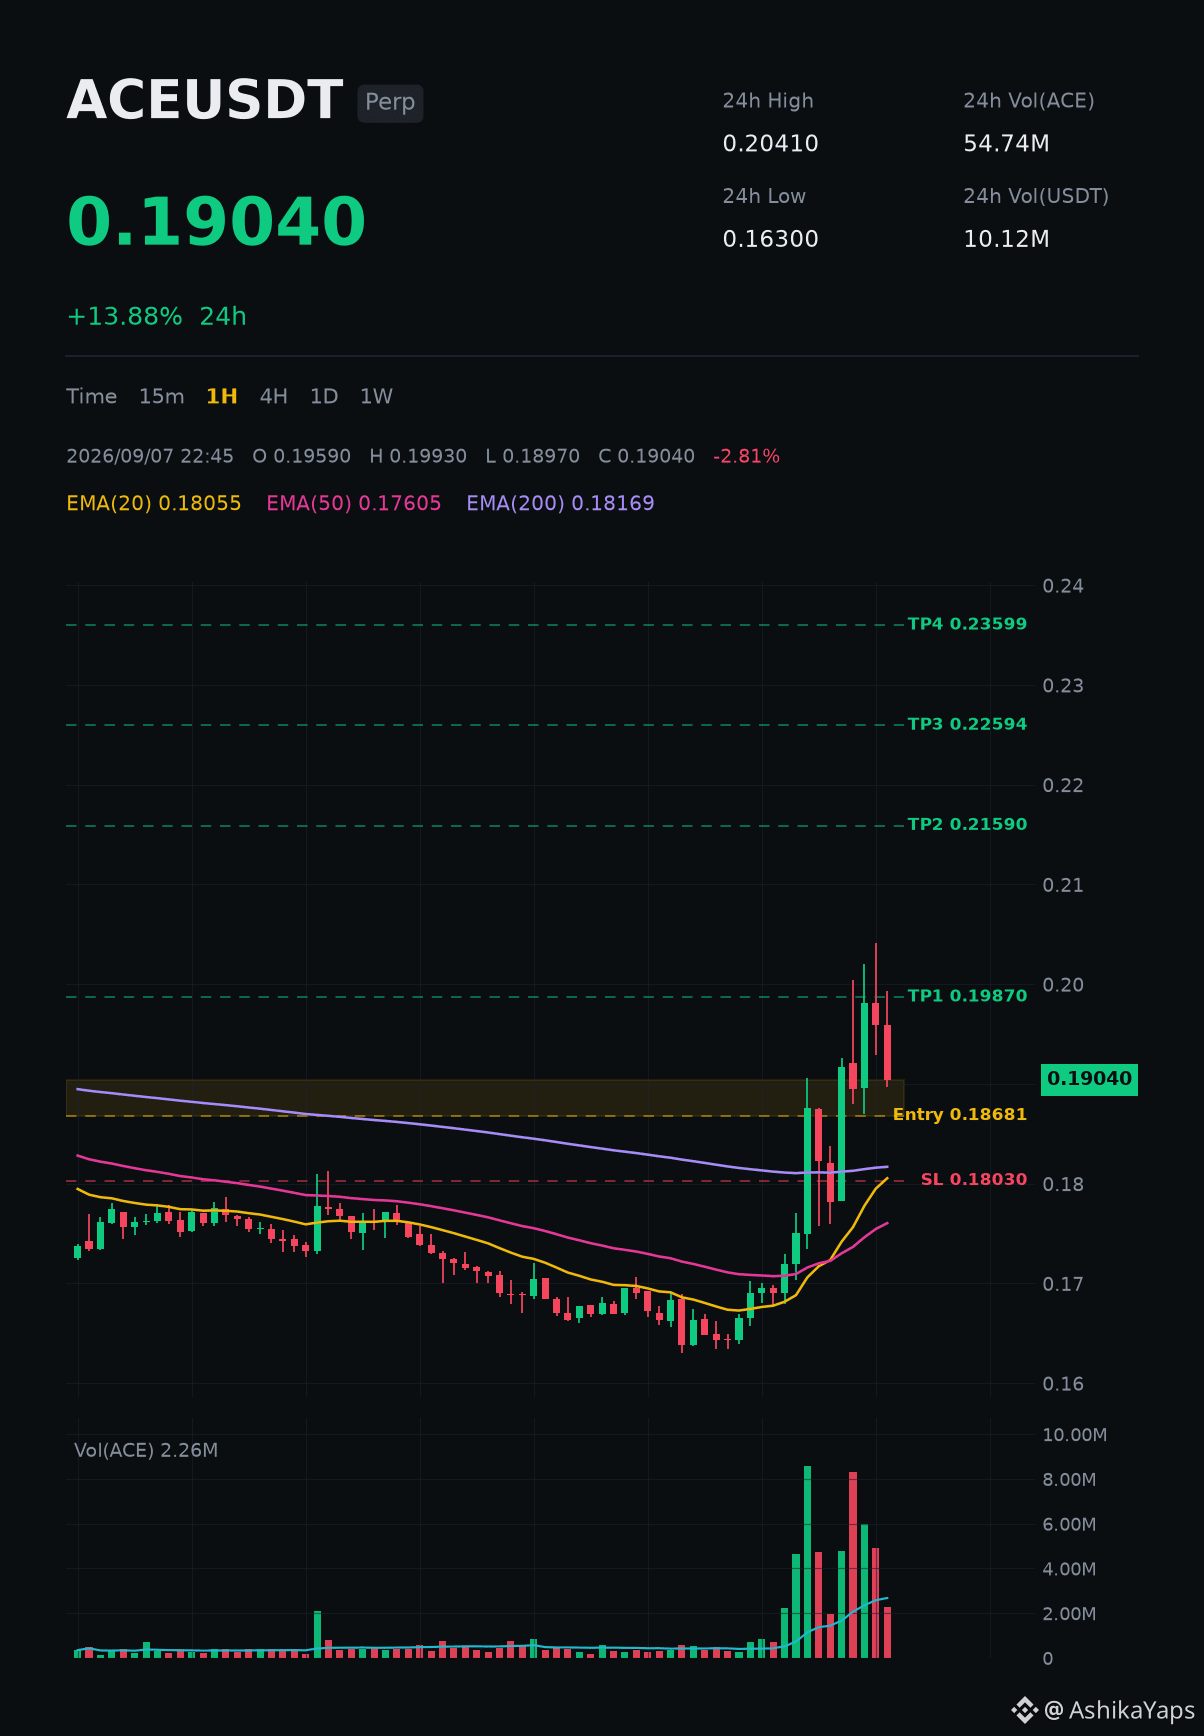
LONG $ACE one to watch
Entry: 0.18681 - 0.19040
TP1: 0.19870
TP2: 0.21590
TP3: 0.22594
TP4: 0.23599
SL: 0.18030
Setup: 4H trend supportive, RSI 62.
Risk: about 3.3 to 1 at TP2. Through 0.18030 the idea is wrong.
Trade ACE: spot https://www.binance.com/en/trade/ACE_USDT | futures https://www.binance.com/en/futures/ACEUSDT
$ACE #ACE #Write2Earn #ChartAnalysis #PriceAction
Automated technical analysis, not financial advice. I am not responsible for your trades. DYOR.
Entry: 0.18681 - 0.19040
TP1: 0.19870
TP2: 0.21590
TP3: 0.22594
TP4: 0.23599
SL: 0.18030
Setup: 4H trend supportive, RSI 62.
Risk: about 3.3 to 1 at TP2. Through 0.18030 the idea is wrong.
Trade ACE: spot https://www.binance.com/en/trade/ACE_USDT | futures https://www.binance.com/en/futures/ACEUSDT
$ACE #ACE #Write2Earn #ChartAnalysis #PriceAction
Automated technical analysis, not financial advice. I am not responsible for your trades. DYOR.
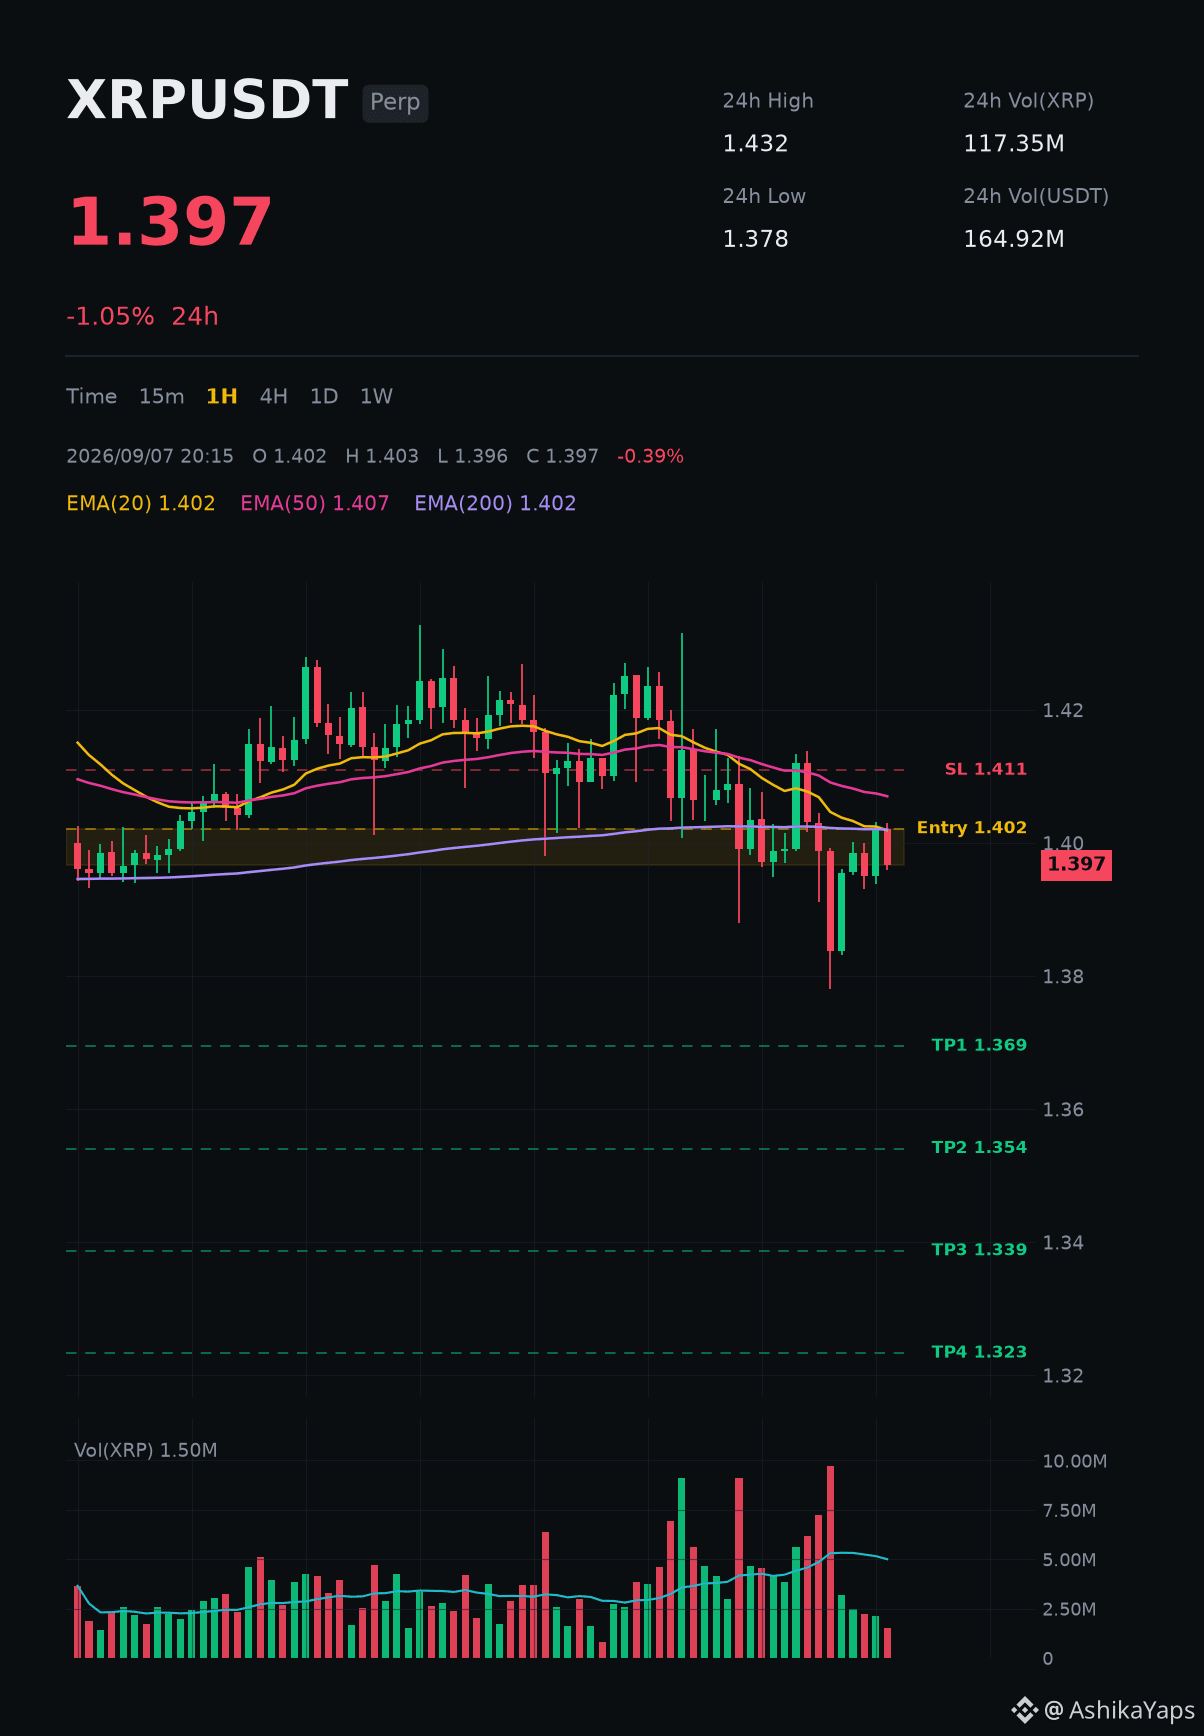
$XRP looks weak, here is the plan
Short zone: 1.397 - 1.402
Take profit: 1.369, then 1.354
Get out if it climbs above: 1.411
$XRP is at the bottom of its range. What that means
XRP is trading at 1.397, down 1.0% in the last 24 hours.
The trend is down and bounces keep getting sold.
The chart is squeezing into a descending channel; these usually end with a sharp move.
Red does not mean broken. It means wait for the chart to prove itself.
Trade XRP: spot https://www.binance.com/en/trade/XRP_USDT | futures https://www.binance.com/en/futures/XRPUSDT
$XRP #XRP #Write2Earn #PriceAction #TechnicalAnalysis
Automated technical analysis, not financial advice. I am not responsible for your trades. DYOR.
Short zone: 1.397 - 1.402
Take profit: 1.369, then 1.354
Get out if it climbs above: 1.411
$XRP is at the bottom of its range. What that means
XRP is trading at 1.397, down 1.0% in the last 24 hours.
The trend is down and bounces keep getting sold.
The chart is squeezing into a descending channel; these usually end with a sharp move.
Red does not mean broken. It means wait for the chart to prove itself.
Trade XRP: spot https://www.binance.com/en/trade/XRP_USDT | futures https://www.binance.com/en/futures/XRPUSDT
$XRP #XRP #Write2Earn #PriceAction #TechnicalAnalysis
Automated technical analysis, not financial advice. I am not responsible for your trades. DYOR.

Have you noticed how most traders enter before confirmation, then blame the market when the setup fails?
FOMO turns a clean $XRP short idea into an expensive guess. The goal isn’t to predict the top,it’s to make price prove weakness before risking capital.
Watch the 2.351,2.369 entry zone, but don’t click blindly. Wait for a bearish market-structure shift on the 15-minute or 5-minute chart, a bearish engulfing candle, or a failed hold below 2.333.
A second entry near 2.446 only makes sense if price tags the latest lower high. Let $BTC and $ETH provide market context, but let confirmation,not emotion,trigger the trade.
Would you wait for confirmation here, or enter the zone early?
#XRP #CryptoTrading #PriceAction
FOMO turns a clean $XRP short idea into an expensive guess. The goal isn’t to predict the top,it’s to make price prove weakness before risking capital.
Watch the 2.351,2.369 entry zone, but don’t click blindly. Wait for a bearish market-structure shift on the 15-minute or 5-minute chart, a bearish engulfing candle, or a failed hold below 2.333.
A second entry near 2.446 only makes sense if price tags the latest lower high. Let $BTC and $ETH provide market context, but let confirmation,not emotion,trigger the trade.
Would you wait for confirmation here, or enter the zone early?
#XRP #CryptoTrading #PriceAction

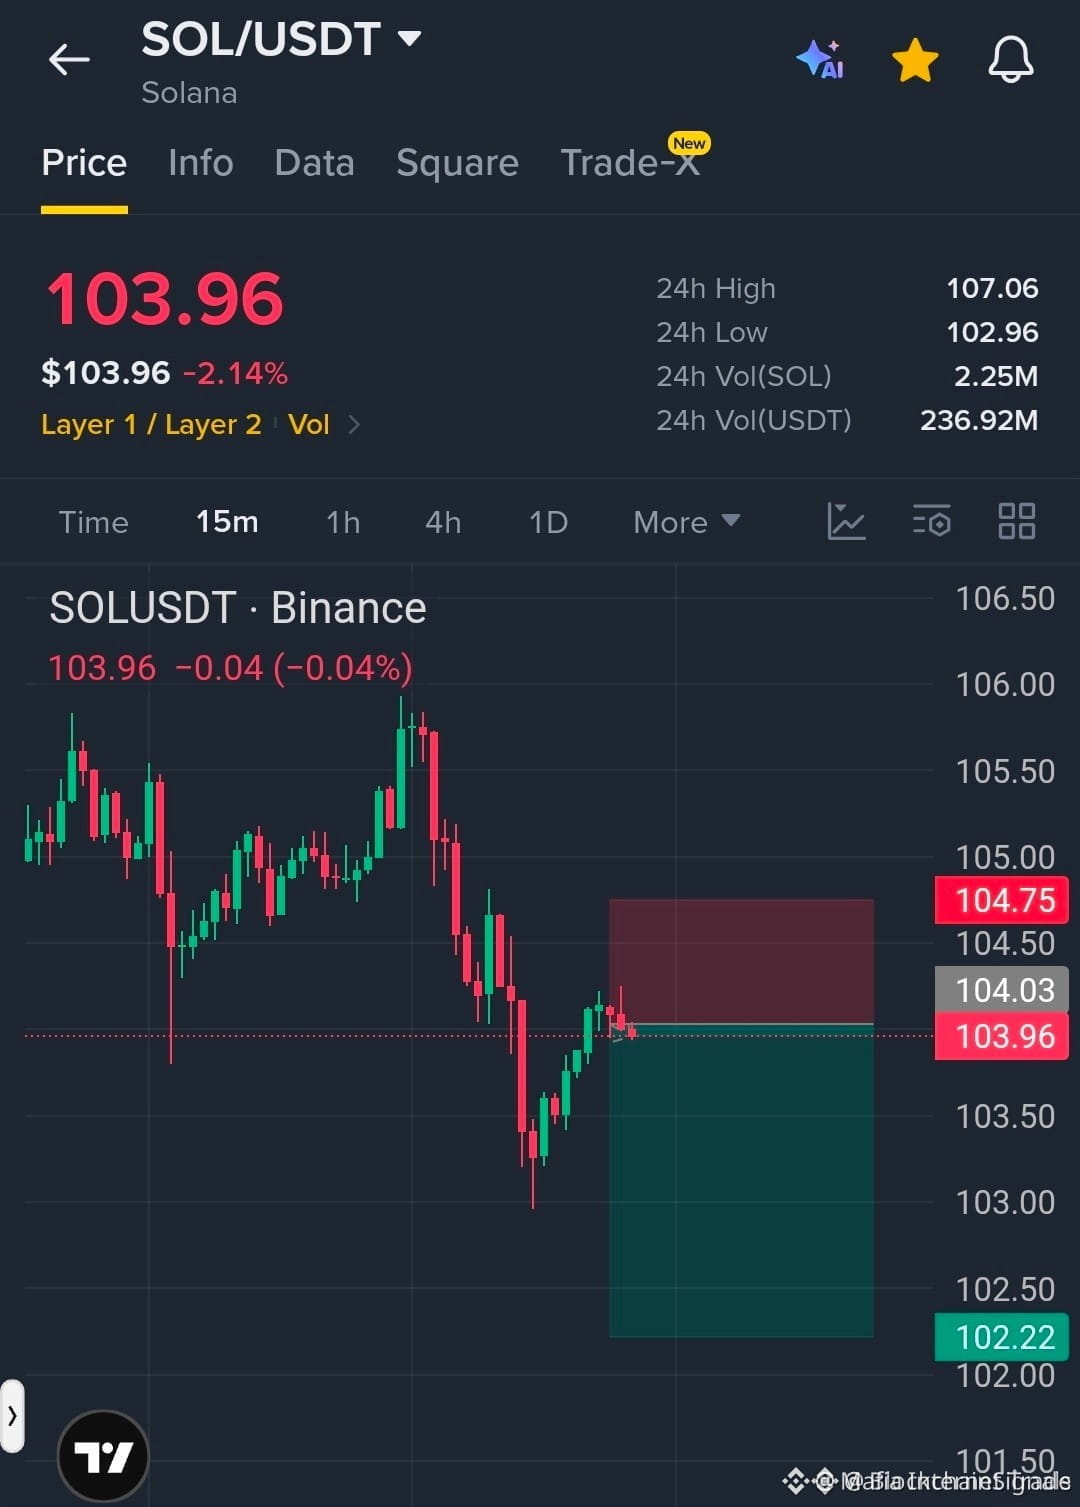
🚨 BEARS DEFEND THE 104 WALL AS $SOL FACES HEAVY OVERHEAD REJECTION! 📉
Entry: 104.03 ⚡
Target: 102.22 🎯
Stop Loss: 104.75 ⚠️
Bulls ran out of steam right at the 104.00 supply zone, leaving sellers in firm control of the order flow. 🐻 As long as price remains capped below resistance at 104.75, market momentum favors a clean roll-down toward lower liquidity pools. 📉
Risk parameters are strictly defined here, giving us a sharp risk-to-reward window as overhead selling volume expands. 📊 Patience remains essential while watching seller follow-through across lower timeframes. 💬 Are you leaning short at these levels or waiting for buyers to try one more retest? 👇
⚠️ Not financial advice. Always manage your risk. 🛡️
🏷️ #SOL #ShortSetup #PriceAction #Crypto
🎯 🐻
Entry: 104.03 ⚡
Target: 102.22 🎯
Stop Loss: 104.75 ⚠️
Bulls ran out of steam right at the 104.00 supply zone, leaving sellers in firm control of the order flow. 🐻 As long as price remains capped below resistance at 104.75, market momentum favors a clean roll-down toward lower liquidity pools. 📉
Risk parameters are strictly defined here, giving us a sharp risk-to-reward window as overhead selling volume expands. 📊 Patience remains essential while watching seller follow-through across lower timeframes. 💬 Are you leaning short at these levels or waiting for buyers to try one more retest? 👇
⚠️ Not financial advice. Always manage your risk. 🛡️
🏷️ #SOL #ShortSetup #PriceAction #Crypto
🎯 🐻

Catching falling knives before structural support confirms is the fastest way to turn a solid trading month into a rescue mission.
Most traders rush to buy the very first dip out of pure FOMO, only to watch their entry get dragged deeper into underwater territory.
Looking at the current setup, we need to respect the downside roadmap before getting eager. The primary level on watch is the 2.292 to 2.290 swing low, which serves as our first real liquidity test. If that shelf gives way under persistent sell pressure, expect a clean continuation down into the 2.152,2.138 pocket.
This structure looks eerily familiar to the mid-range bleed we saw on $SOL and $NEAR before their deeper corrections flushed out early longs. Watching how $FET handles these intermediate levels will give us the real clue on whether buyers have any appetite left.
Are you bidding the 2.290 sweep or waiting for a reaction at 2.138 before stepping in?
#CryptoTrading #Altcoins #PriceAction
Most traders rush to buy the very first dip out of pure FOMO, only to watch their entry get dragged deeper into underwater territory.
Looking at the current setup, we need to respect the downside roadmap before getting eager. The primary level on watch is the 2.292 to 2.290 swing low, which serves as our first real liquidity test. If that shelf gives way under persistent sell pressure, expect a clean continuation down into the 2.152,2.138 pocket.
This structure looks eerily familiar to the mid-range bleed we saw on $SOL and $NEAR before their deeper corrections flushed out early longs. Watching how $FET handles these intermediate levels will give us the real clue on whether buyers have any appetite left.
Are you bidding the 2.290 sweep or waiting for a reaction at 2.138 before stepping in?
#CryptoTrading #Altcoins #PriceAction

Picture this: you spot a setup approaching resistance, hit buy immediately out of fear of missing the move, and watch price dump straight into your stop. Most traders keep bleeding capital because they treat every level as an instant trigger rather than waiting for actual confirmation.
Take a look at how $FET reacted near major supply recently compared to previous $NEAR liquidity sweeps. A trader planned an initial short entry zone between 2.351 and 2.369, leaving room for a second check around 2.446 if price swept the previous lower high. Instead of blindly placing limit orders, the entire playbook relied on patience.
The edge came down to execution rules. Rather than jumping in early, the setup required a confirmed 5m or 15m market structure shift lower, a clear bearish engulfing close, or a clean breakdown below 2.333 before pulling the trigger on $SUI or similar setups. It reminds me of the classic Wyckoff distribution traps where early buyers provide exit liquidity before the real trend develops.
How often do you wait for lower-timeframe confirmation before entering a key level?
#CryptoTrading #TechnicalAnalysis #PriceAction
Take a look at how $FET reacted near major supply recently compared to previous $NEAR liquidity sweeps. A trader planned an initial short entry zone between 2.351 and 2.369, leaving room for a second check around 2.446 if price swept the previous lower high. Instead of blindly placing limit orders, the entire playbook relied on patience.
The edge came down to execution rules. Rather than jumping in early, the setup required a confirmed 5m or 15m market structure shift lower, a clear bearish engulfing close, or a clean breakdown below 2.333 before pulling the trigger on $SUI or similar setups. It reminds me of the classic Wyckoff distribution traps where early buyers provide exit liquidity before the real trend develops.
How often do you wait for lower-timeframe confirmation before entering a key level?
#CryptoTrading #TechnicalAnalysis #PriceAction

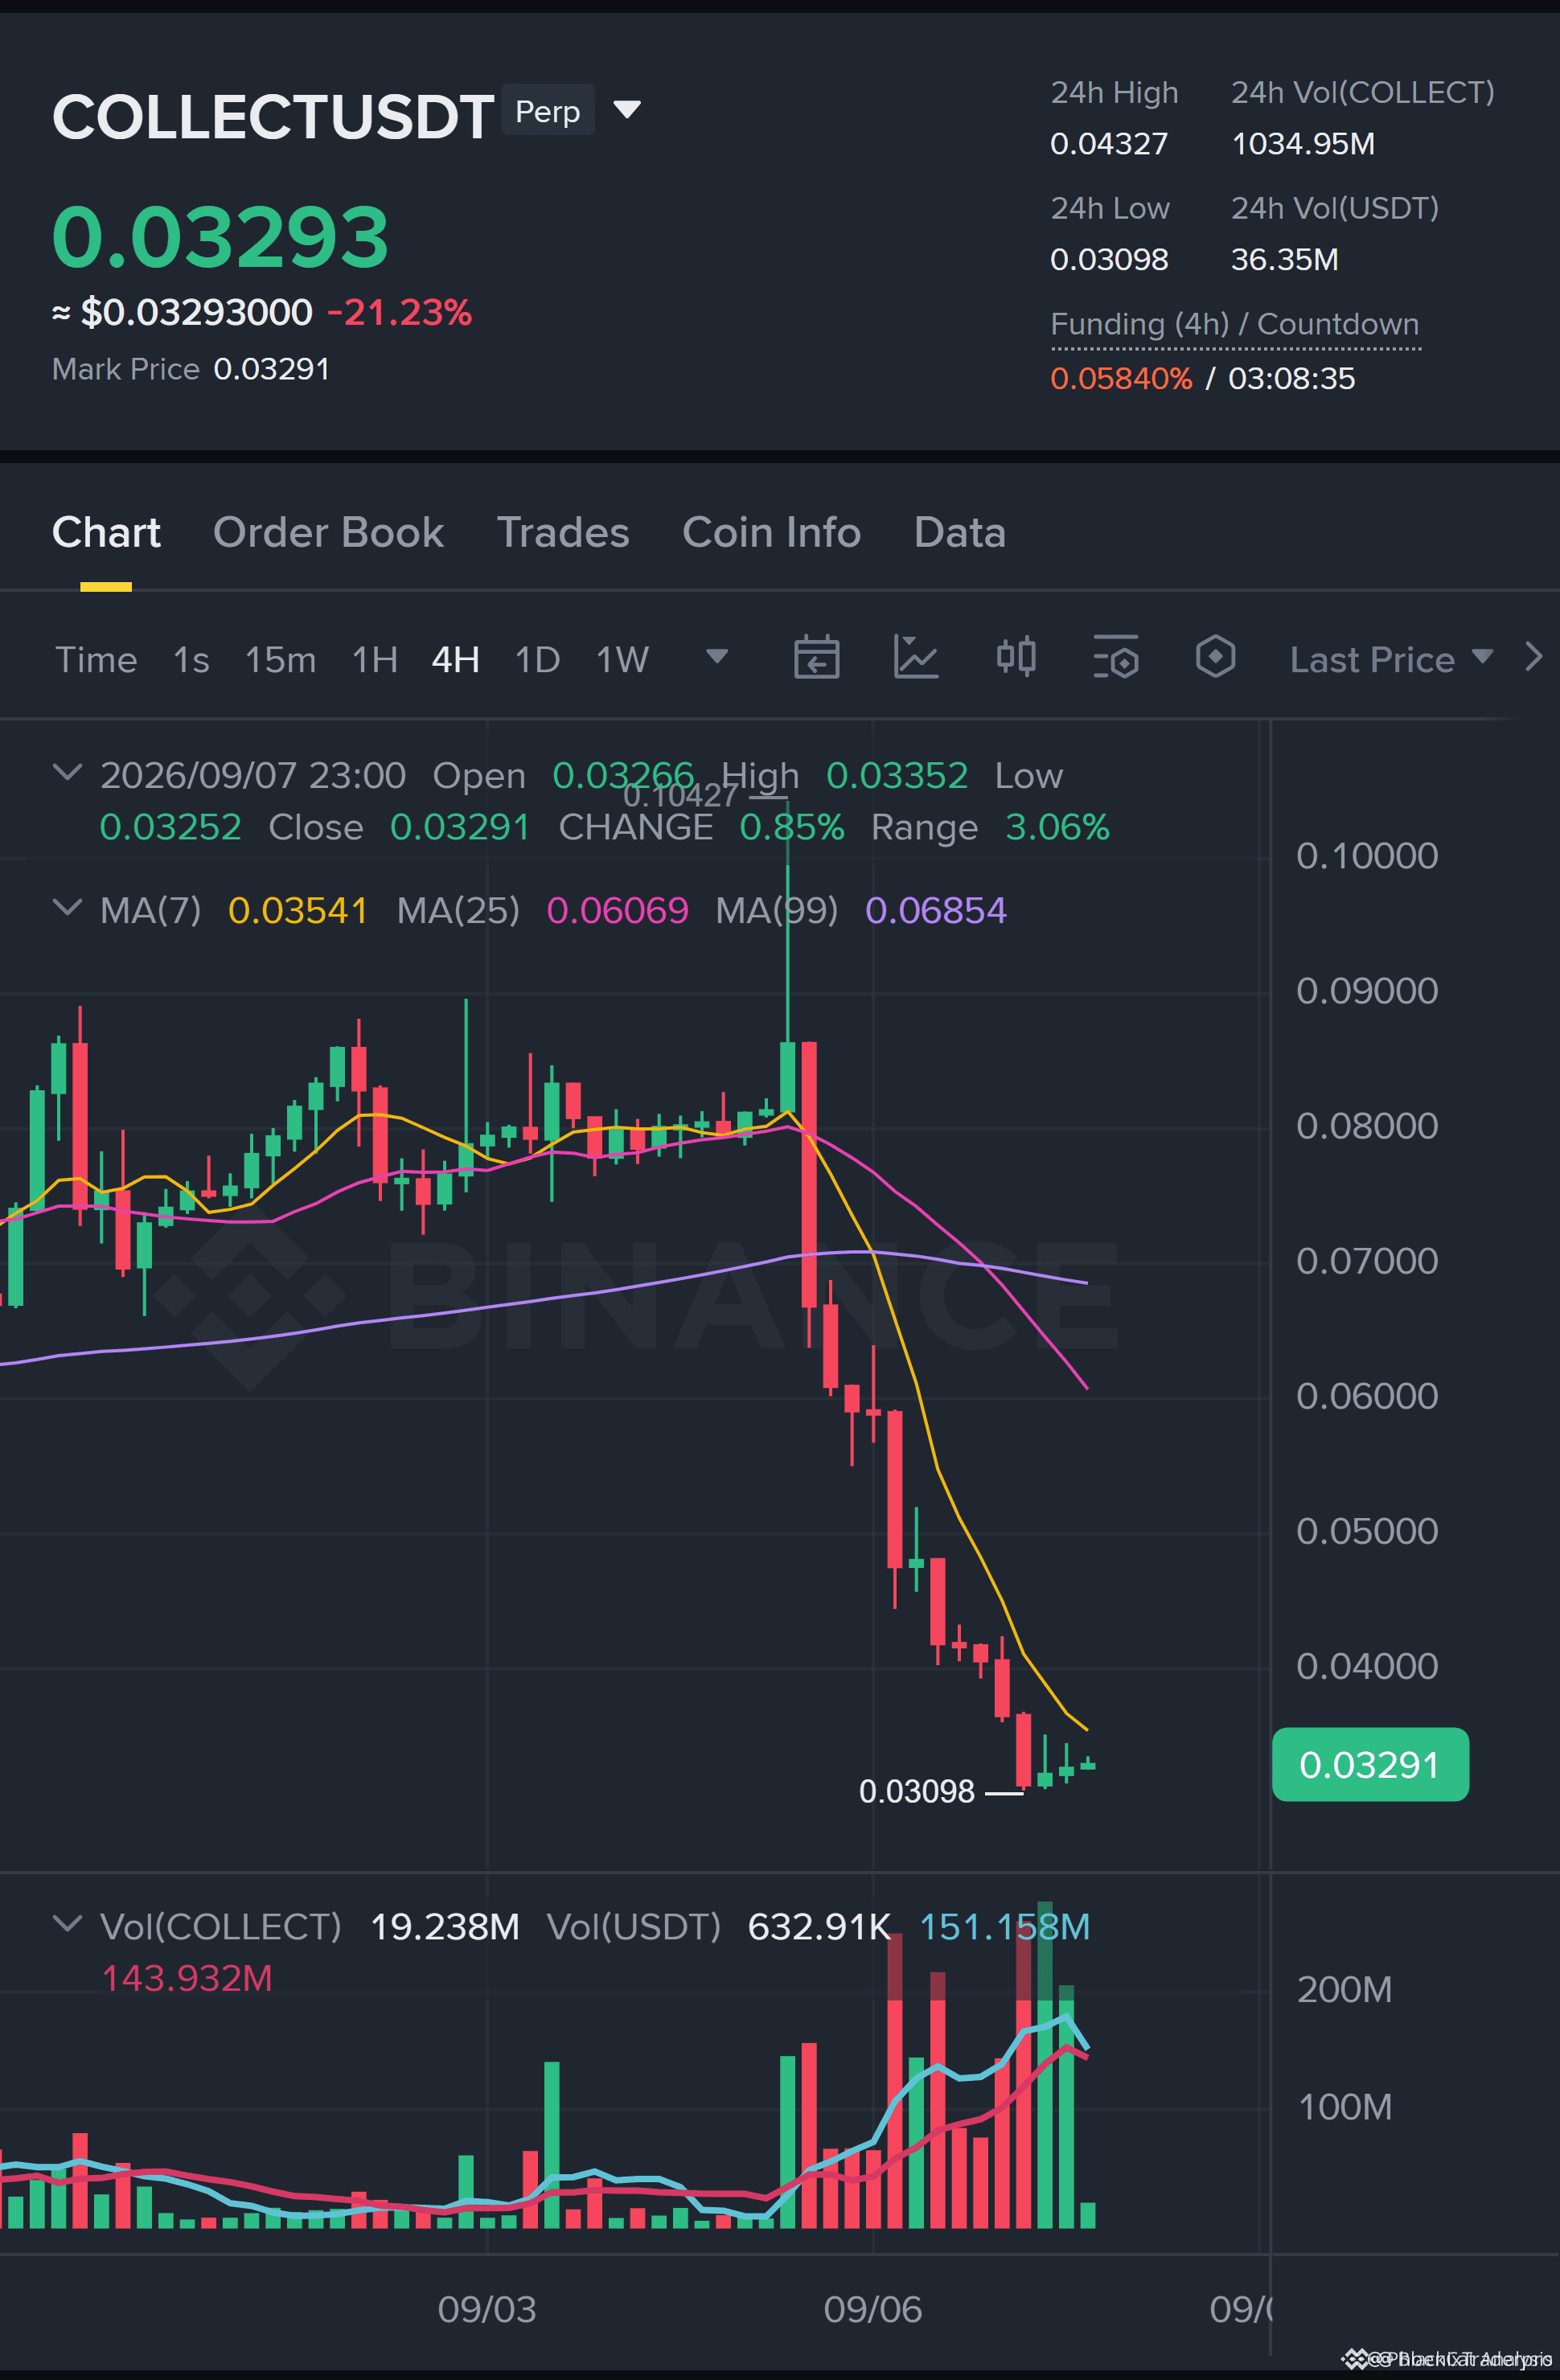
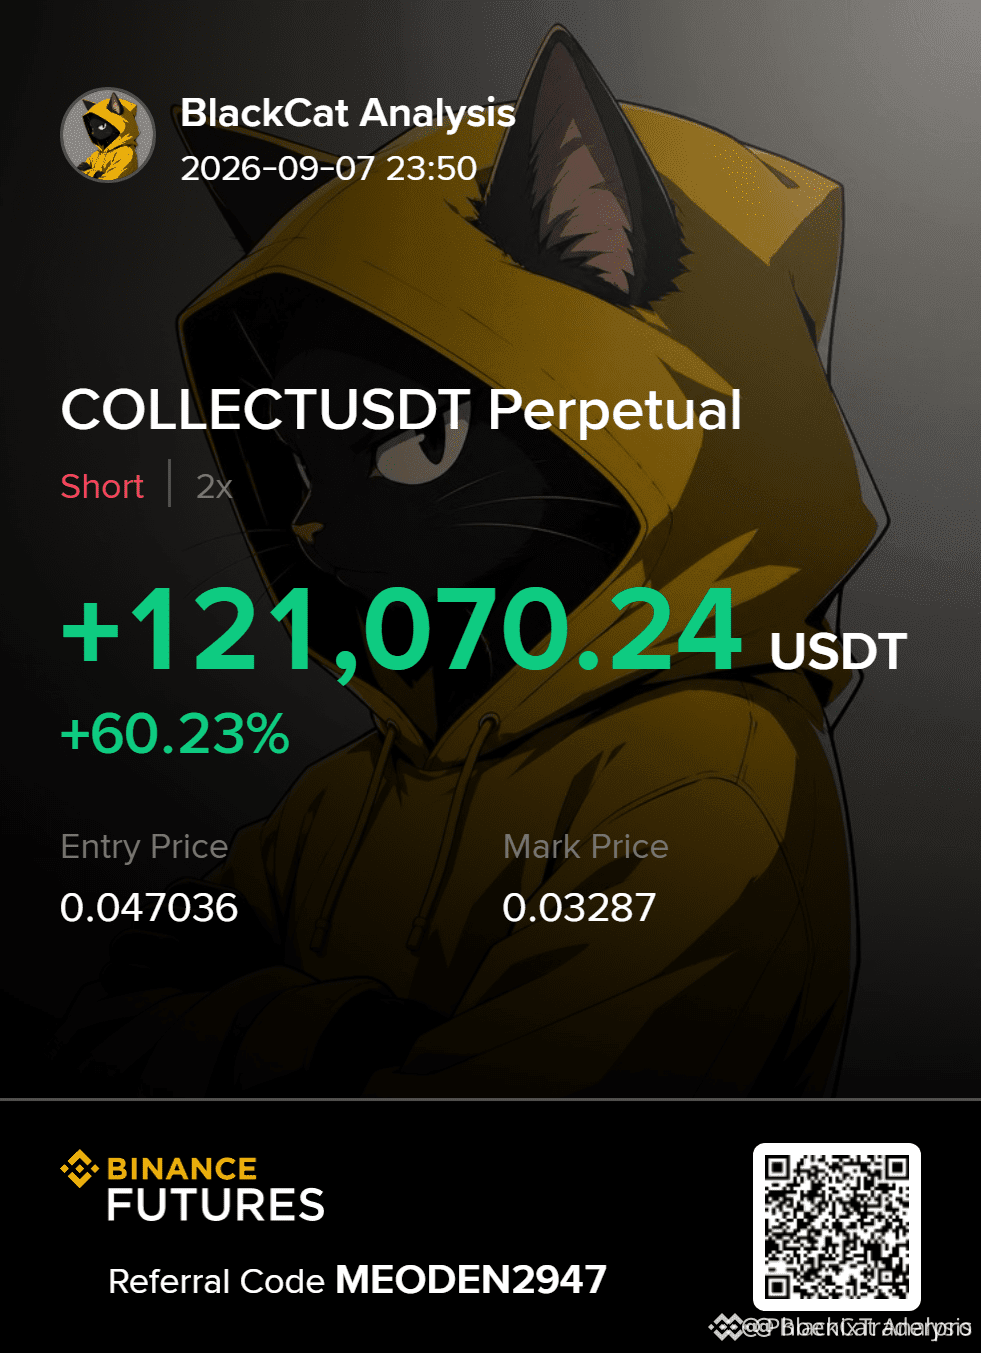
🚨 $COLLECT DISPLAYING HEAVY EXHAUSTION NEAR RESISTANCE AS SELLERS PREPARE TO TRIGGER A ROLLOVER! 📉
Entry: 0.03334 - 0.0337 ⚡
Target: 0.0320 - 0.03098 💥
Stop Loss: 0.03479 ⚠️
The 1-hour timeframe shows buying pressure evaporating right into a major supply overhead. 📉 Order flow signals indicate smart money is quietly building short positions, preparing to capitalize on a drop as bids thin out.
📌 Awaiting solid confirmation inside the entry zone protects our edge before scaling out across the downside targets down to 0.03098. 🦈 Risk-to-reward favors the bears heavily if this distribution pattern plays out as expected. 💭 Are you positioning for the breakdown here or waiting for support to flip? 👇
⚠️ Not financial advice. Always manage your risk. 🛡️
🏷️ #COLLECT #ShortSetup #CryptoTrading #PriceAction
🐻 📉
Entry: 0.03334 - 0.0337 ⚡
Target: 0.0320 - 0.03098 💥
Stop Loss: 0.03479 ⚠️
The 1-hour timeframe shows buying pressure evaporating right into a major supply overhead. 📉 Order flow signals indicate smart money is quietly building short positions, preparing to capitalize on a drop as bids thin out.
📌 Awaiting solid confirmation inside the entry zone protects our edge before scaling out across the downside targets down to 0.03098. 🦈 Risk-to-reward favors the bears heavily if this distribution pattern plays out as expected. 💭 Are you positioning for the breakdown here or waiting for support to flip? 👇
⚠️ Not financial advice. Always manage your risk. 🛡️
🏷️ #COLLECT #ShortSetup #CryptoTrading #PriceAction
🐻 📉

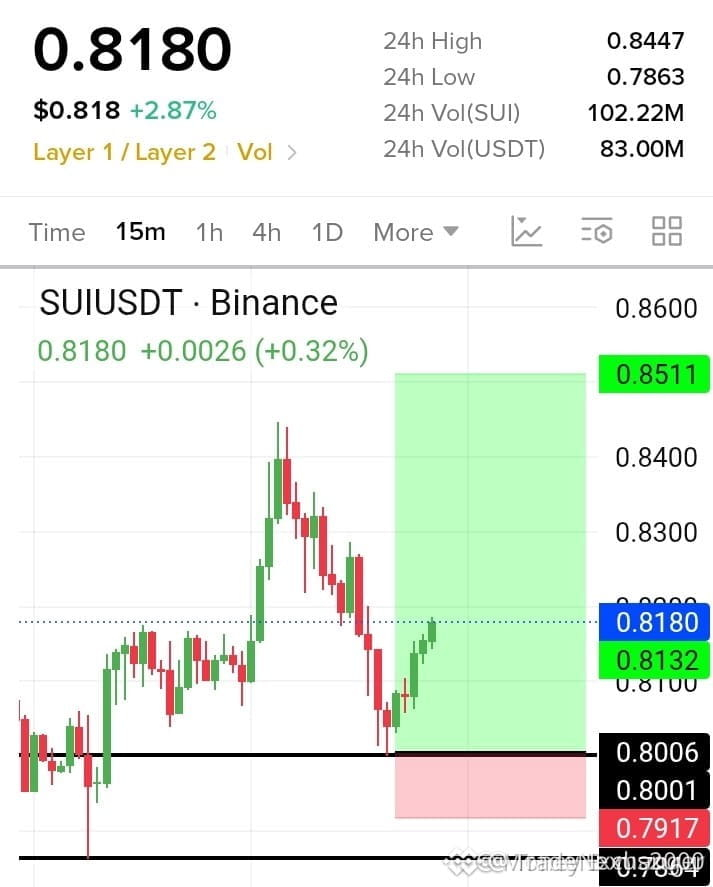
⚡ $SUI RECLAIMING DEMAND AS LIQUIDITY HUNTERS TARGET THE UPPER INEFFICIENCY! 📈
Entry: 0.8180 ⚡
Target: 0.8390 🎯
Stop Loss: 0.7995 ⚠️
📌 Price has swept local downside sell-side liquidity and is currently reclaiming intraday value around the 0.8180 demand block. 📊 Order flow indicates smart money absorption, setting up a swift structural expansion toward overhead buy-side liquidity pools.
💡 Lower timeframe market structure is realigning bullish, offering a clean setup to fill upper price imbalances while keeping risk defined below local structural lows. 🔍 Are you positioning inside this demand zone or watching for high-volume confirmation? 👇
⚠️ Not financial advice. Always manage your risk. 🛡️
🏷️ #SUI #Altcoins #PriceAction #TradingSetup
🎯 🦈
Entry: 0.8180 ⚡
Target: 0.8390 🎯
Stop Loss: 0.7995 ⚠️
📌 Price has swept local downside sell-side liquidity and is currently reclaiming intraday value around the 0.8180 demand block. 📊 Order flow indicates smart money absorption, setting up a swift structural expansion toward overhead buy-side liquidity pools.
💡 Lower timeframe market structure is realigning bullish, offering a clean setup to fill upper price imbalances while keeping risk defined below local structural lows. 🔍 Are you positioning inside this demand zone or watching for high-volume confirmation? 👇
⚠️ Not financial advice. Always manage your risk. 🛡️
🏷️ #SUI #Altcoins #PriceAction #TradingSetup
🎯 🦈

everyone thinks every liquidity sweep is an automatic reversal, but actually most of you are just longing into pure distribution.
ngl watching traders ape into falling knives just to get stopped out five minutes later hurts to see. you think you're frontrunning the bottom when you're really just providing exit liquidity for smart money.
take a look at what just went down on $NEAR . price swept below the 2.333 level, and instead of bouncing hard like the bulls hoped, it immediately printed another lower high on the 1h timeframe and dropped another -0.6%. that was not a fakeout reversal, ser. it was textbook bearish continuation while larger caps like $SOL and $BTC were chopping sideways.
when a structure keeps printing lower highs after taking out support, the sweep is simply fuel for the next leg down. if you don't wait for a clean reclaim before jumping in, you're basically gambling against the trend.
are you bidding this level or waiting for a confirmed shift in market structure?
#NEAR #CryptoTrading #PriceAction
ngl watching traders ape into falling knives just to get stopped out five minutes later hurts to see. you think you're frontrunning the bottom when you're really just providing exit liquidity for smart money.
take a look at what just went down on $NEAR . price swept below the 2.333 level, and instead of bouncing hard like the bulls hoped, it immediately printed another lower high on the 1h timeframe and dropped another -0.6%. that was not a fakeout reversal, ser. it was textbook bearish continuation while larger caps like $SOL and $BTC were chopping sideways.
when a structure keeps printing lower highs after taking out support, the sweep is simply fuel for the next leg down. if you don't wait for a clean reclaim before jumping in, you're basically gambling against the trend.
are you bidding this level or waiting for a confirmed shift in market structure?
#NEAR #CryptoTrading #PriceAction
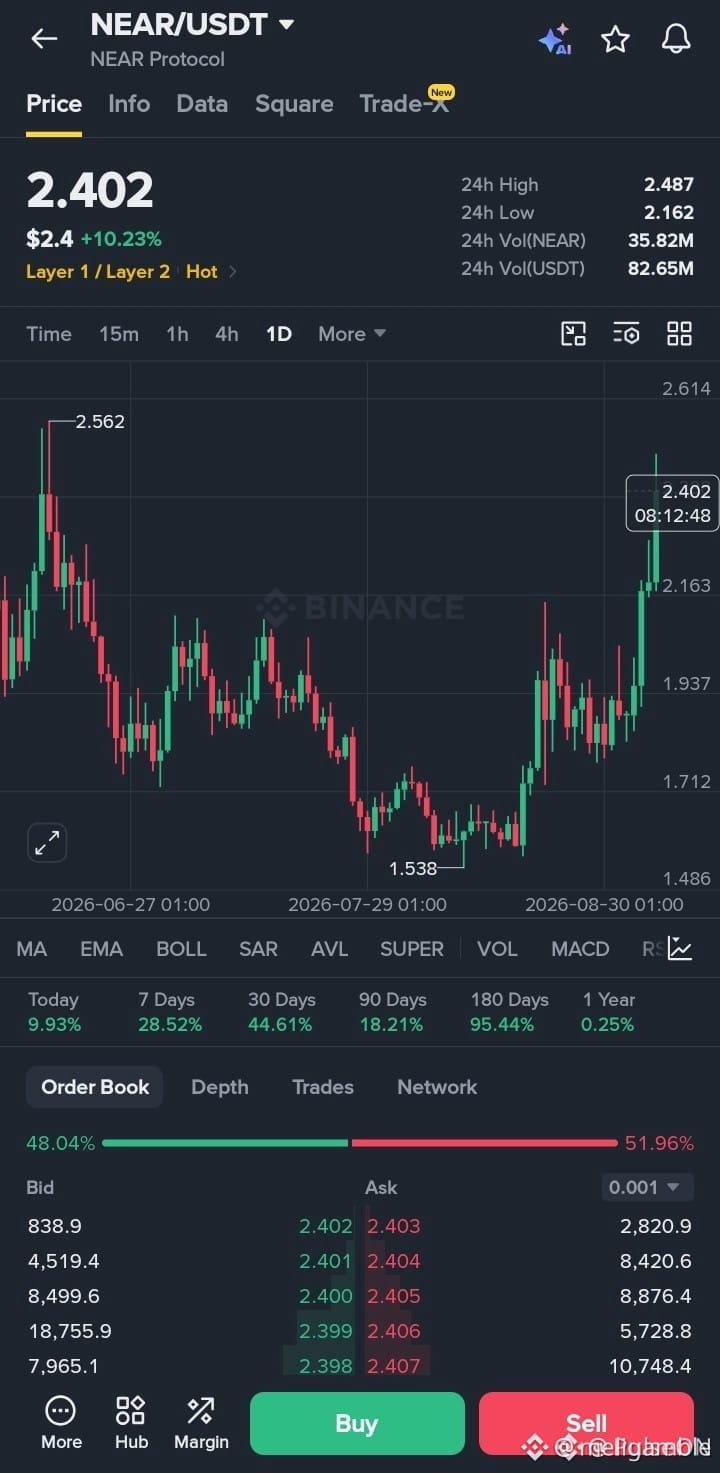
Picture this: a sharp reclaim after a local low sweeps the board, and every breakout trader rushes to long the bounce.
Most retail accounts get wiped out not during obvious selloffs, but inside these exact fakeout traps where a minor relief candle gets mistaken for a structural bottom.
Looking at the recent price action around 2.333 on $FET , we saw a quick 15m wick pierce below support and close right back above the level. Many immediately called it a textbook reversal. But when you zoom out to the 1h timeframe, the structural reality tells an entirely different story.
The 1h chart is still printing clear lower highs and lower lows without any sign of a break. When the higher-timeframe trend remains bearish, an isolated wick under 2.333 does not mean buyers have regained control. Instead, that sweep simply grabs liquidity to act as fuel for downside continuation across pairs like $NEAR .
Chasing lower-timeframe reclaims while ignoring higher-timeframe order flow is one of the easiest ways to get trapped before the next leg down.
Are you treating these lower-timeframe sweeps as reversal confirmation or continuation fuel?
#CryptoTrading #TechnicalAnalysis #PriceAction
Most retail accounts get wiped out not during obvious selloffs, but inside these exact fakeout traps where a minor relief candle gets mistaken for a structural bottom.
Looking at the recent price action around 2.333 on $FET , we saw a quick 15m wick pierce below support and close right back above the level. Many immediately called it a textbook reversal. But when you zoom out to the 1h timeframe, the structural reality tells an entirely different story.
The 1h chart is still printing clear lower highs and lower lows without any sign of a break. When the higher-timeframe trend remains bearish, an isolated wick under 2.333 does not mean buyers have regained control. Instead, that sweep simply grabs liquidity to act as fuel for downside continuation across pairs like $NEAR .
Chasing lower-timeframe reclaims while ignoring higher-timeframe order flow is one of the easiest ways to get trapped before the next leg down.
Are you treating these lower-timeframe sweeps as reversal confirmation or continuation fuel?
#CryptoTrading #TechnicalAnalysis #PriceAction

Why is everyone calling a bottom on every tiny liquidity wick while ignoring higher-timeframe reality?
Most traders keep donating liquidity to the market because they rush to long fake reversals, getting trapped right before the real dump happens.
Seeing a 15m wick dip below 2.333 and close back up might feel like an instant reversal signal on $FET or similar charts, but zoom out to the 1h. The hourly market structure is still printing clear lower highs and lower lows. That quick liquidity sweep under 2.333 was not a trend shift, it was just fuel collection for continuation downward.
If you want to trade this cleanly, stop front-running reversals against prevailing market flow. Wait for $SUI or $NEAR style structural breaks where price actually closes above the last lower high on the 1h before flipping your bias. Until then, these quick wick-grabs are just liquidity traps for impatient longs.
Are you treating this 2.333 wick as a reversal or just fuel for lower prices?
#CryptoTrading #TechnicalAnalysis #PriceAction
Most traders keep donating liquidity to the market because they rush to long fake reversals, getting trapped right before the real dump happens.
Seeing a 15m wick dip below 2.333 and close back up might feel like an instant reversal signal on $FET or similar charts, but zoom out to the 1h. The hourly market structure is still printing clear lower highs and lower lows. That quick liquidity sweep under 2.333 was not a trend shift, it was just fuel collection for continuation downward.
If you want to trade this cleanly, stop front-running reversals against prevailing market flow. Wait for $SUI or $NEAR style structural breaks where price actually closes above the last lower high on the 1h before flipping your bias. Until then, these quick wick-grabs are just liquidity traps for impatient longs.
Are you treating this 2.333 wick as a reversal or just fuel for lower prices?
#CryptoTrading #TechnicalAnalysis #PriceAction

$ETH CRACKS THE CRITICAL $2,500 FLOOR AS SELLERS SQUEEZE THE LIQUIDITY RANGE! 🚨 📉
Ethereum just slipped under the psychological $2,500 mark, hovering around $2,497.3. 📉 Despite the immediate breakdown below key support, $ETH remains up 0.79% on the daily chart, pointing to a tense compression zone.
🦈 Smart money is actively probing for sell-side liquidity beneath this pivot level. Order flow reflects intense friction between buyers attempting to hold the line and aggressive short pressure pushing for expansion. ⚡
💬 Are you treating this $2,500 breach as a bear trap or the start of a deeper pullback? 👇
⚠️ Not financial advice. Always manage your risk. 🛡️
🏷️ #ETH #Ethereum #Crypto #PriceAction
⚡ 💎
Ethereum just slipped under the psychological $2,500 mark, hovering around $2,497.3. 📉 Despite the immediate breakdown below key support, $ETH remains up 0.79% on the daily chart, pointing to a tense compression zone.
🦈 Smart money is actively probing for sell-side liquidity beneath this pivot level. Order flow reflects intense friction between buyers attempting to hold the line and aggressive short pressure pushing for expansion. ⚡
💬 Are you treating this $2,500 breach as a bear trap or the start of a deeper pullback? 👇
⚠️ Not financial advice. Always manage your risk. 🛡️
🏷️ #ETH #Ethereum #Crypto #PriceAction
⚡ 💎
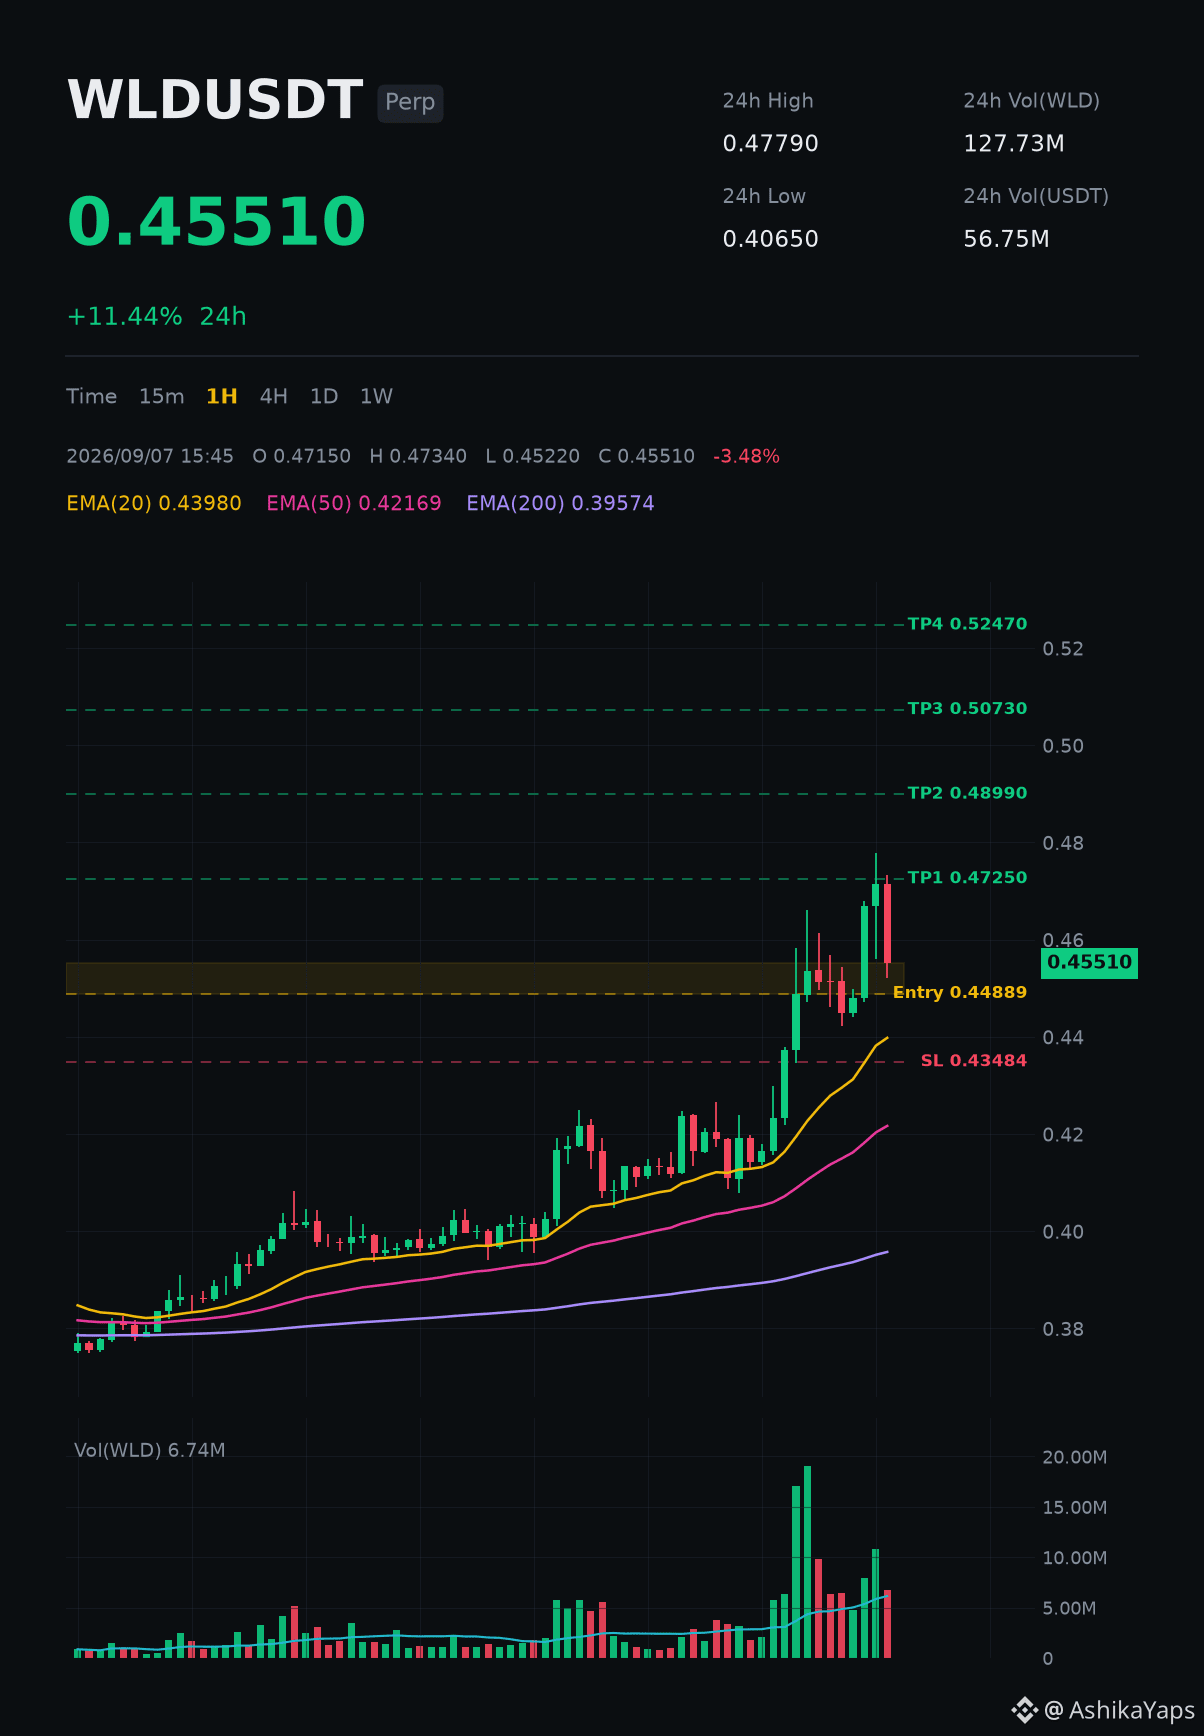
LONG $WLD levels marked
Entry: 0.44889 - 0.45510
TP1: 0.47250
TP2: 0.48990
TP3: 0.50730
TP4: 0.52470
SL: 0.43484
Setup: Price holding above the 200 EMA, long-term structure bullish, RSI 62.
Risk: about 2.2 to 1 at TP2. Through 0.43484 the idea is wrong.
Trade WLD: spot https://www.binance.com/en/trade/WLD_USDT | futures https://www.binance.com/en/futures/WLDUSDT
$WLD #WLD #Write2Earn #Altcoins #PriceAction
Automated technical analysis, not financial advice. I am not responsible for your trades. DYOR.
Entry: 0.44889 - 0.45510
TP1: 0.47250
TP2: 0.48990
TP3: 0.50730
TP4: 0.52470
SL: 0.43484
Setup: Price holding above the 200 EMA, long-term structure bullish, RSI 62.
Risk: about 2.2 to 1 at TP2. Through 0.43484 the idea is wrong.
Trade WLD: spot https://www.binance.com/en/trade/WLD_USDT | futures https://www.binance.com/en/futures/WLDUSDT
$WLD #WLD #Write2Earn #Altcoins #PriceAction
Automated technical analysis, not financial advice. I am not responsible for your trades. DYOR.

Support and resistance are areas—not laser lines. 🎯
Price rarely taps one exact number, reverses perfectly, and sends you a thank-you note.
Why? Because traders place orders across an area. Some buy early. Some wait for confirmation. Some take profit just before the obvious level.
So draw a zone, not a single thin line.
Example: price has reacted several times between 98 and 100. That whole range is a support zone. If price dips to 99.2, wicks below 98.8, then closes back inside the area, support may still be doing its job.
But if price closes decisively below the zone and starts holding underneath it, the idea has weakened. A wick is a test. Acceptance below is different. ⚠️
Practical rule:
Mark the cluster of prior reactions.
Watch how price behaves inside it.
Use candle closes and market structure—not one tiny wick—to judge a break.
And don’t enter just because price touched your line. Ask: are buyers or sellers actually defending this zone?
Levels guide your attention. Price action gives the answer. 🧠
Do you draw your support and resistance as lines or zones? 👇
#SupportResistance #PriceAction #CryptoTrading #TradingEducation
Price rarely taps one exact number, reverses perfectly, and sends you a thank-you note.
Why? Because traders place orders across an area. Some buy early. Some wait for confirmation. Some take profit just before the obvious level.
So draw a zone, not a single thin line.
Example: price has reacted several times between 98 and 100. That whole range is a support zone. If price dips to 99.2, wicks below 98.8, then closes back inside the area, support may still be doing its job.
But if price closes decisively below the zone and starts holding underneath it, the idea has weakened. A wick is a test. Acceptance below is different. ⚠️
Practical rule:
Mark the cluster of prior reactions.
Watch how price behaves inside it.
Use candle closes and market structure—not one tiny wick—to judge a break.
And don’t enter just because price touched your line. Ask: are buyers or sellers actually defending this zone?
Levels guide your attention. Price action gives the answer. 🧠
Do you draw your support and resistance as lines or zones? 👇
#SupportResistance #PriceAction #CryptoTrading #TradingEducation

$ZEC WEEKLY: MAJOR RESISTANCE TEST IS HERE
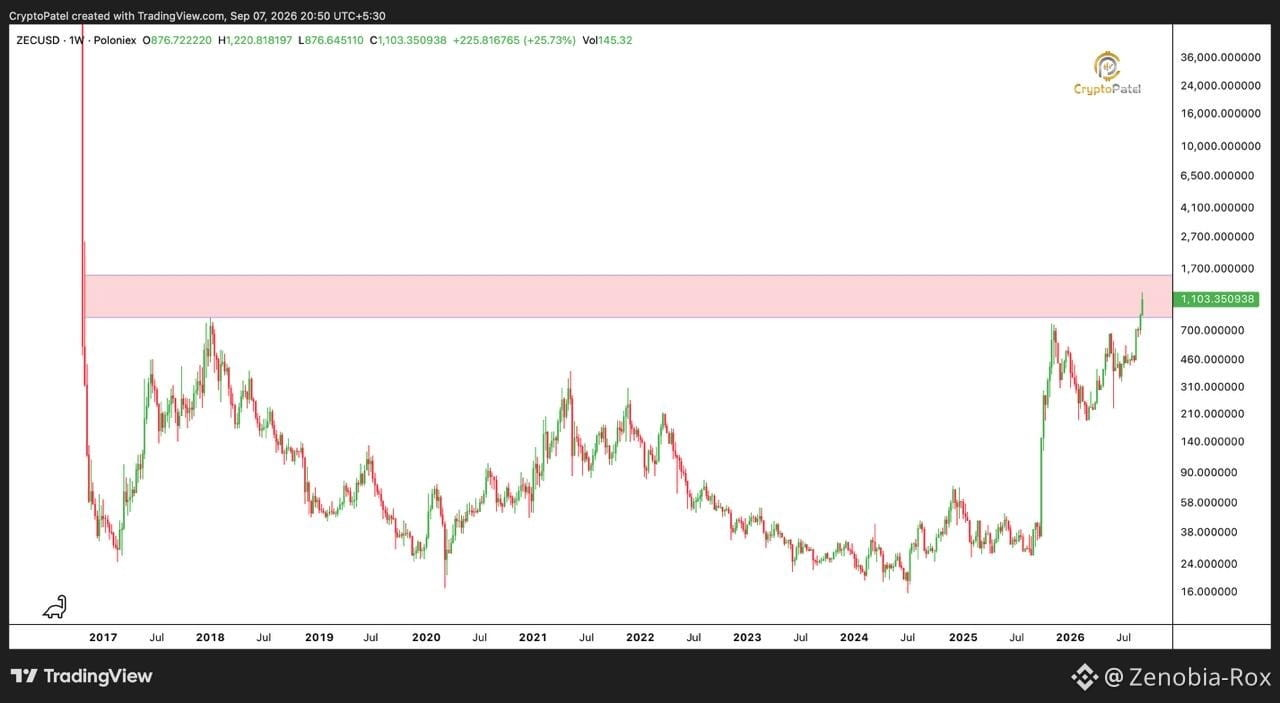
ZEC/USD is showing a powerful weekly breakout, but the most important part of the chart is not the pump — it’s what happens inside the major resistance zone.
The weekly candle is currently around $1,103, with a visible +25.73% move. Price has climbed dramatically from the long accumulation range and is now testing an overhead supply area that has been marked on the chart.
📊 Technical Breakdown
Resistance: 🔴 ~$800–$1,600
ZEC is already trading inside this zone. A strong weekly close above the zone would be the confirmation bulls need. $ZEC
Immediate support: 🟢 ~$700
This is the key breakout region visible below the current price. A successful retest here would make the bullish structure much healthier.
Next visible upside levels:
🎯 TP1: $1,700
🎯 TP2: $2,700
🎯 TP3: $4,100
These are chart-visible price levels, not guaranteed targets.
🧠 Trade Plan
I would not chase ZEC at $1,103 while price is sitting inside resistance.
A more attractive setup would be a pullback toward the $700–$800 area, followed by a confirmed bullish reaction.
Invalidation: A decisive weekly loss of the ~$700 area would weaken the breakout thesis.
Risk/Reward: Not reliably calculable at the current price because there is no confirmed entry or tight invalidation shown on the chart. Waiting for confirmation offers a cleaner setup.
Sentiment: Bullish, but confidence: 7/10. Momentum is strong, yet resistance is significant.
Would you rather wait for a breakout above $1,600, or look for a retest before entering? 👇
$ZEC
#altcoins
#TradingTales #PriceAction #Binance #cryptotrading
ZEC/USD is showing a powerful weekly breakout, but the most important part of the chart is not the pump — it’s what happens inside the major resistance zone.
The weekly candle is currently around $1,103, with a visible +25.73% move. Price has climbed dramatically from the long accumulation range and is now testing an overhead supply area that has been marked on the chart.
📊 Technical Breakdown
Resistance: 🔴 ~$800–$1,600
ZEC is already trading inside this zone. A strong weekly close above the zone would be the confirmation bulls need. $ZEC
Immediate support: 🟢 ~$700
This is the key breakout region visible below the current price. A successful retest here would make the bullish structure much healthier.
Next visible upside levels:
🎯 TP1: $1,700
🎯 TP2: $2,700
🎯 TP3: $4,100
These are chart-visible price levels, not guaranteed targets.
🧠 Trade Plan
I would not chase ZEC at $1,103 while price is sitting inside resistance.
A more attractive setup would be a pullback toward the $700–$800 area, followed by a confirmed bullish reaction.
Invalidation: A decisive weekly loss of the ~$700 area would weaken the breakout thesis.
Risk/Reward: Not reliably calculable at the current price because there is no confirmed entry or tight invalidation shown on the chart. Waiting for confirmation offers a cleaner setup.
Sentiment: Bullish, but confidence: 7/10. Momentum is strong, yet resistance is significant.
Would you rather wait for a breakout above $1,600, or look for a retest before entering? 👇
$ZEC
#altcoins
#TradingTales #PriceAction #Binance #cryptotrading
Log in to explore more content