Binance Square
#marketanalysis

marketanalysis

9.7M views
47,596 Discussing
Crypto Daily Signal
·
--
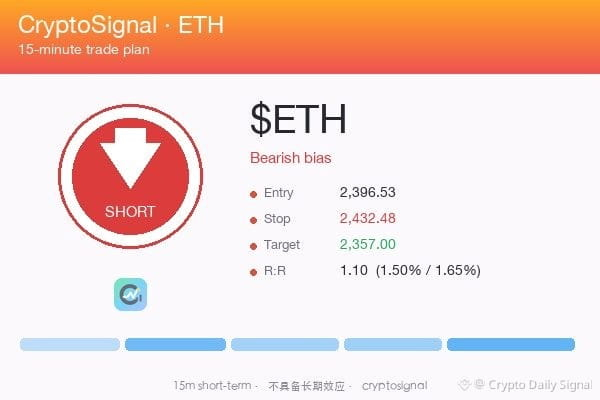
$ETH — honestly, this is a short here. The price is just trapped between that short-term support and resistance. Every push up runs straight into resistance, throwing up a big upper wick rejection near the local peak. The MAs are all sloped sideways too, just pure indecision right now. I'm fading any bounce back up towards that recent swing high. If it clips that range floor cleanly, I'm stepping in fast. Plan (15m only): entry ~1,948.80 · SL 1,978.03 · TP 1,910.55 · R:R 1.31 15m only — not a swing call. #MarketAnalysis {future}(ETHUSDT)
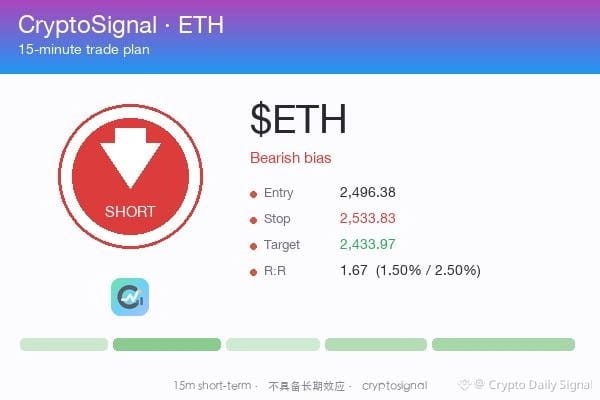
$ETH — honestly, this is a short here. The price is just trapped between that short-term support and resistance. Every push up runs straight into resistance, throwing up a big upper wick rejection near the local peak. The MAs are all sloped sideways too, just pure indecision right now. I'm fading any bounce back up towards that recent swing high. If it clips that range floor cleanly, I'm stepping in fast.
Plan (15m only): entry ~1,948.80 · SL 1,978.03 · TP 1,910.55 · R:R 1.31
15m only — not a swing call.
#MarketAnalysis

TRUMP Bear Trap Setup Unfolding As long as TRUMP stays below 1.88 resistance, it looks primed for a further decline. Bearish trend, falling volume, last candle is bearish, and the 10-bar trend is bearish. A daily close above 1.88 resistance breaks this setup. Are you shorting TRUMP at this level? #MarketAnalysis #CryptoInsights
TRUMP Bear Trap Setup Unfolding

As long as TRUMP stays below 1.88 resistance, it looks primed for a further decline.

Bearish trend, falling volume, last candle is bearish, and the 10-bar trend is bearish.

A daily close above 1.88 resistance breaks this setup.

Are you shorting TRUMP at this level?

#MarketAnalysis #CryptoInsights
Article
XRPUSDT Analysis: Market Structure, Current Momentum, and What Traders Should WatchIn crypto markets, the biggest challenge is not identifying movement it is understanding whether that movement represents real strength or temporary market noise. XRP has always been one of the assets that attracts strong attention because its price action often reflects a combination of market sentiment, liquidity conditions, and broader expectations around blockchain adoption. Currently, XRPUSDT perpetual futures are trading around 1.0886 USDT, showing a daily decline of approximately 1.31%. The asset has recorded a 24-hour high of 1.1163 and a 24-hour low of 1.0846, with trading volume reaching around 399.90 million XRP and approximately 440.36 million USDT in futures activity. The current price movement shows a market that is experiencing short-term pressure after failing to maintain higher levels. However, understanding XRP’s position requires looking beyond a single candle or percentage change. Short-Term Market Structure The recent XRP price action indicates a battle between buyers attempting to defend support and sellers trying to push the market lower. The price has moved close to the 24-hour low zone, suggesting that short-term traders are watching whether buyers can absorb selling pressure. The area around 1.0840–1.0880 has become an important zone in the current structure. If buyers continue defending this region, XRP may attempt to recover toward previous intraday levels. However, if this support fails, it could indicate that sellers still have control over short-term momentum. Markets often move through phases of expansion and consolidation. After strong movements, assets usually require time to establish a new balance between buyers and sellers. XRP’s current behavior appears to be a search for that balance. Volume Shows Continued Market Interest One important factor is trading activity. XRP futures volume remains significant, showing that market participants are actively positioning around the asset. High volume during price declines can represent different scenarios. It may indicate strong selling pressure, but it can also show buyers entering the market as prices become more attractive. Volume alone does not determine direction; it must be combined with price structure and market reaction. The key question is not simply whether XRP is falling, but whether buyers are willing to defend important levels. Technical Perspective From a short-term technical viewpoint, XRP is currently trading below the recent high of 1.1163. This suggests that the market has not yet regained enough momentum to challenge the upper range. For bullish momentum to strengthen, XRP would need to reclaim higher resistance areas and show consistent buying interest. A recovery above recent intraday resistance could improve market confidence. On the other hand, continued weakness near current levels may increase the possibility of further downside exploration. Traders often monitor whether a support zone creates a reversal or becomes a temporary stop before another move lower. Market Psychology Around XRP XRP has historically attracted a large community of traders and investors because of its long-standing position in the crypto market. This creates unique market psychology around the asset. Strong community interest can provide liquidity and attention, but price movement still depends on supply, demand, broader market conditions, and trader positioning. In futures markets especially, leverage can amplify both gains and losses. A sudden movement in either direction can trigger liquidations, creating additional volatility. This is why disciplined risk management remains important when analyzing perpetual contracts. Broader Factors Influencing XRP Like most major cryptocurrencies, XRP does not move in isolation. Bitcoin’s market direction, overall liquidity conditions, regulatory developments, and investor sentiment can influence XRP’s performance. When the broader market becomes risk-averse, even strong assets can experience selling pressure. Similarly, improving market confidence can create opportunities for recovery across large-cap cryptocurrencies. Therefore, XRP traders should consider both XRP-specific factors and the overall crypto environment. What Traders Should Monitor Next The next important phase for XRP will likely depend on how price reacts around current support levels. Key areas to observe: - Whether buyers defend the 1.0840–1.0880 region. - Whether XRP can regain momentum above recent resistance zones. - Whether trading volume supports a recovery attempt. - Whether broader crypto market sentiment improves or weakens. Instead of focusing only on short-term price changes, traders should observe how the market behaves around important levels. A strong reaction from buyers or sellers often provides more information than a single price movement. Final Thoughts XRPUSDT is currently showing a market in a short-term battle between buyers and sellers. The recent decline has created uncertainty, but the continued trading volume indicates that market interest remains active. The important factor is not simply whether XRP moves up or down in the next few candles. The bigger question is whether the market can establish a stable structure where buyers regain confidence or sellers continue controlling momentum. For traders, patience and confirmation remain essential. In volatile futures markets, understanding market structure is often more valuable than reacting to every small movement. @Ripple-Labs @Binance_Academy_ID @binance_south_africa #blockchain #MarketAnalysis #CryptoMarket #FuturesTrading #XRP $XRP $ETH $AKE {spot}(XRPUSDT) {spot}(ETHUSDT) {future}(AKEUSDT)

XRPUSDT Analysis: Market Structure, Current Momentum, and What Traders Should Watch

In crypto markets, the biggest challenge is not identifying movement it is understanding whether that movement represents real strength or temporary market noise. XRP has always been one of the assets that attracts strong attention because its price action often reflects a combination of market sentiment, liquidity conditions, and broader expectations around blockchain adoption.
Currently, XRPUSDT perpetual futures are trading around 1.0886 USDT, showing a daily decline of approximately 1.31%. The asset has recorded a 24-hour high of 1.1163 and a 24-hour low of 1.0846, with trading volume reaching around 399.90 million XRP and approximately 440.36 million USDT in futures activity.
The current price movement shows a market that is experiencing short-term pressure after failing to maintain higher levels. However, understanding XRP’s position requires looking beyond a single candle or percentage change.
Short-Term Market Structure
The recent XRP price action indicates a battle between buyers attempting to defend support and sellers trying to push the market lower. The price has moved close to the 24-hour low zone, suggesting that short-term traders are watching whether buyers can absorb selling pressure.
The area around 1.0840–1.0880 has become an important zone in the current structure. If buyers continue defending this region, XRP may attempt to recover toward previous intraday levels. However, if this support fails, it could indicate that sellers still have control over short-term momentum.
Markets often move through phases of expansion and consolidation. After strong movements, assets usually require time to establish a new balance between buyers and sellers. XRP’s current behavior appears to be a search for that balance.
Volume Shows Continued Market Interest
One important factor is trading activity. XRP futures volume remains significant, showing that market participants are actively positioning around the asset.
High volume during price declines can represent different scenarios. It may indicate strong selling pressure, but it can also show buyers entering the market as prices become more attractive. Volume alone does not determine direction; it must be combined with price structure and market reaction.
The key question is not simply whether XRP is falling, but whether buyers are willing to defend important levels.
Technical Perspective
From a short-term technical viewpoint, XRP is currently trading below the recent high of 1.1163. This suggests that the market has not yet regained enough momentum to challenge the upper range.
For bullish momentum to strengthen, XRP would need to reclaim higher resistance areas and show consistent buying interest. A recovery above recent intraday resistance could improve market confidence.
On the other hand, continued weakness near current levels may increase the possibility of further downside exploration. Traders often monitor whether a support zone creates a reversal or becomes a temporary stop before another move lower.
Market Psychology Around XRP
XRP has historically attracted a large community of traders and investors because of its long-standing position in the crypto market. This creates unique market psychology around the asset.
Strong community interest can provide liquidity and attention, but price movement still depends on supply, demand, broader market conditions, and trader positioning.
In futures markets especially, leverage can amplify both gains and losses. A sudden movement in either direction can trigger liquidations, creating additional volatility. This is why disciplined risk management remains important when analyzing perpetual contracts.
Broader Factors Influencing XRP
Like most major cryptocurrencies, XRP does not move in isolation. Bitcoin’s market direction, overall liquidity conditions, regulatory developments, and investor sentiment can influence XRP’s performance.
When the broader market becomes risk-averse, even strong assets can experience selling pressure. Similarly, improving market confidence can create opportunities for recovery across large-cap cryptocurrencies.
Therefore, XRP traders should consider both XRP-specific factors and the overall crypto environment.
What Traders Should Monitor Next
The next important phase for XRP will likely depend on how price reacts around current support levels.
Key areas to observe:
- Whether buyers defend the 1.0840–1.0880 region.
- Whether XRP can regain momentum above recent resistance zones.
- Whether trading volume supports a recovery attempt.
- Whether broader crypto market sentiment improves or weakens.
Instead of focusing only on short-term price changes, traders should observe how the market behaves around important levels. A strong reaction from buyers or sellers often provides more information than a single price movement.
Final Thoughts
XRPUSDT is currently showing a market in a short-term battle between buyers and sellers. The recent decline has created uncertainty, but the continued trading volume indicates that market interest remains active.
The important factor is not simply whether XRP moves up or down in the next few candles. The bigger question is whether the market can establish a stable structure where buyers regain confidence or sellers continue controlling momentum.
For traders, patience and confirmation remain essential. In volatile futures markets, understanding market structure is often more valuable than reacting to every small movement.
@XRP @Binance Academy Indonesian @Binance South Africa Official
#blockchain #MarketAnalysis #CryptoMarket

#FuturesTrading #XRP
$XRP $ETH $AKE

$OP — look man, it is looking soft right now. Short. It's totally trapped between that range high and low, nothing breaking out. More importantly, the recent candles are showing strong bearish rejection right near the top boundary. Supply is just dominating this little move. I'm fading any weak bounce trying to push higher. If it dips below the range floor, that's my confirmation. Plan (15m only): entry ~0.09450 · SL 0.09592 · TP 0.09240 · R:R 1.48 15m only — not a swing call. #MarketAnalysis {future}(OPUSDT)
$OP — look man, it is looking soft right now. Short. It's totally trapped between that range high and low, nothing breaking out. More importantly, the recent candles are showing strong bearish rejection right near the top boundary. Supply is just dominating this little move. I'm fading any weak bounce trying to push higher. If it dips below the range floor, that's my confirmation.

Plan (15m only): entry ~0.09450 · SL 0.09592 · TP 0.09240 · R:R 1.48
15m only — not a swing call.
#MarketAnalysis
$DEXE — look, I'm fading this here. The price just won't crack that recent resistance zone. Multiple upper wicks rejecting the prior high boundary every single time. Plus, the last few candles are showing lower highs, so there's zero upward momentum building. This is trapped between defined support and resistance. I'm waiting for that confirmed close below the range floor before I take full conviction. Plan (15m only): entry ~3.4160 · SL 3.4673 · TP 3.3306 · R:R 1.67 15m only — not a swing call. #MarketAnalysis {future}(DEXEUSDT)
$DEXE — look, I'm fading this here. The price just won't crack that recent resistance zone. Multiple upper wicks rejecting the prior high boundary every single time. Plus, the last few candles are showing lower highs, so there's zero upward momentum building. This is trapped between defined support and resistance. I'm waiting for that confirmed close below the range floor before I take full conviction.

Plan (15m only): entry ~3.4160 · SL 3.4673 · TP 3.3306 · R:R 1.67
15m only — not a swing call.
#MarketAnalysis
🚨 $HYPE GETS READY A NEW IMPULSE? While everyone waits — the chart is already sending a signal $HYPE /USDT — LONG 📍 Entry: 59.05–59.30 🛑 SL: 58.10 🎯 Targets: • TP1: 59.90 • TP2: 60.10 • TP3: 60.80 🚀 Why does this setup draw attention? 📊 The 4H model shows 79% confidence for LONG The current zone may become the point where buyers try to regain control. 🤔 What do you think, $HYPE will set up a breakout, or will the market check the entry zone again? $HYPE #MarketAnalysis {future}(HYPEUSDT)
🚨 $HYPE GETS READY A NEW IMPULSE? While everyone waits — the chart is already sending a signal

$HYPE /USDT — LONG

📍 Entry: 59.05–59.30
🛑 SL: 58.10

🎯 Targets:
• TP1: 59.90
• TP2: 60.10
• TP3: 60.80 🚀

Why does this setup draw attention?

📊 The 4H model shows 79% confidence for LONG

The current zone may become the point where buyers try to regain control.

🤔 What do you think, $HYPE will set up a breakout, or will the market check the entry zone again?

$HYPE

#MarketAnalysis
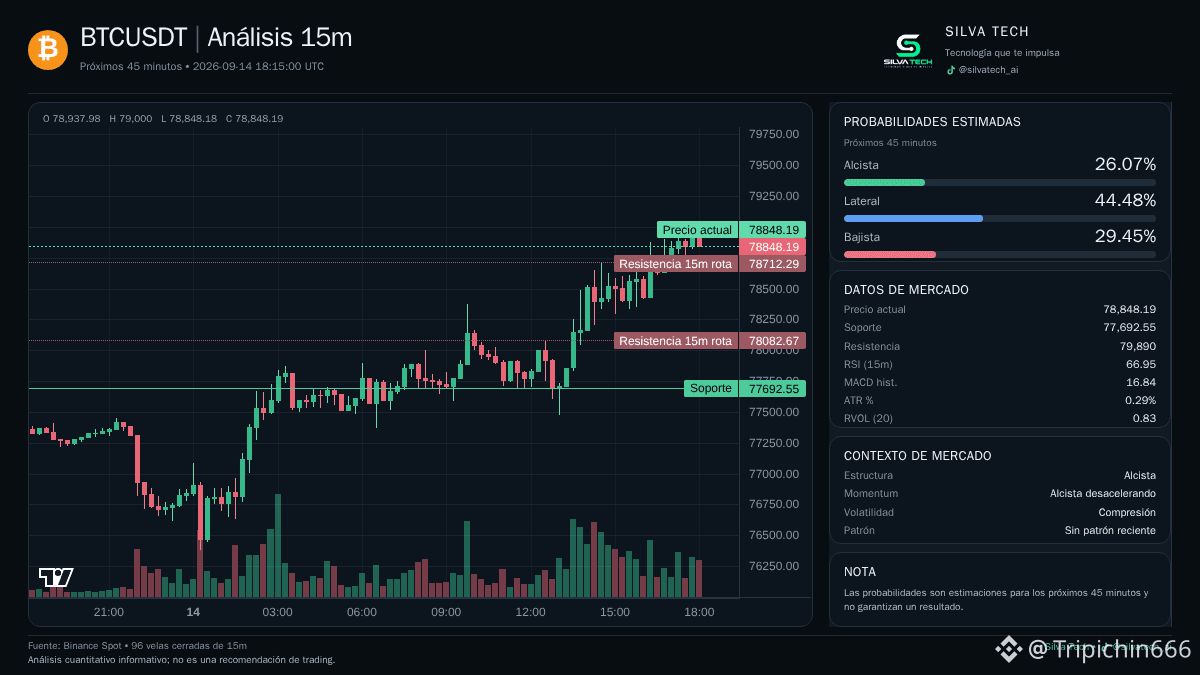
🚨BTC Market Update: Liquidity Sweep & What’s Next? Bitcoin (BTC) is currently trading right around the $63,750 mark after clearing out a substantial amount of long liquidity at lower levels. Here is a breakdown of what the chart and liquidation heatmaps are showing: 📊 Key Data & Liquidity Overview Current Price:~$63,754 Recent Liquidations:Around $93.3M in total BTC positions liquidated over the last 24 hours, with over $77M of that being long positions. In just the past hour alone, roughly $35.4M in longs were wiped out as the price swept down. Upper Liquidity (The Targets):There is a massive cluster of short liquidity stacked higher up between $65,500 and $67,000+(with over $160M–$200M in potential liquidations waiting above). Lower Liquidity / Support:The immediate support sits right around $63,500 (trendline zone). If this level fails and the trend reverses, the next key downside target is near $61,600. 💡Market Outlook As seen in the chart, the market has taken out the bulk of the immediate downside liquidity. Unless there is a sudden fundamental shift or bad news that forces a trend reversal, price action is heavily favoured to bounce back upwards to hunt the liquidity sitting higher up. However, if $63,500 breaks down firmly, expect a visit down towards $61,600 before finding the next solid footing. ⚠️ This is a not financial advice. Always do your own research and manage your risk strictly. #Bitcoin {spot}(BTCUSDT) #BTC #CryptoTrading #Liquidity #MarketAnalysis $BTC
🚨BTC Market Update: Liquidity Sweep & What’s Next?
Bitcoin (BTC) is currently trading right around the $63,750 mark after clearing out a substantial amount of long liquidity at lower levels.
Here is a breakdown of what the chart and liquidation heatmaps are showing:
📊 Key Data & Liquidity Overview
Current Price:~$63,754
Recent Liquidations:Around $93.3M in total BTC positions liquidated over the last 24 hours, with over $77M of that being long positions. In just the past hour alone, roughly $35.4M in longs were wiped out as the price swept down.
Upper Liquidity (The Targets):There is a massive cluster of short liquidity stacked higher up between $65,500 and $67,000+(with over $160M–$200M in potential liquidations waiting above).
Lower Liquidity / Support:The immediate support sits right around $63,500 (trendline zone). If this level fails and the trend reverses, the next key downside target is near $61,600.
💡Market Outlook
As seen in the chart, the market has taken out the bulk of the immediate downside liquidity. Unless there is a sudden fundamental shift or bad news that forces a trend reversal, price action is heavily favoured to bounce back upwards to hunt the liquidity sitting higher up.
However, if $63,500 breaks down firmly, expect a visit down towards $61,600 before finding the next solid footing.
⚠️ This is a not financial advice. Always do your own research and manage your risk strictly.
#Bitcoin

#BTC #CryptoTrading #Liquidity #MarketAnalysis $BTC
$RE — I like the long here, look. It bounced right off that rising trendline and keeping up higher lows through this whole pullback. That price slope stays clear above the longer-term MA too. This consolidation felt like a pause, not a reversal. I'm waiting for that decisive break above the last swing high to confirm it. If it fails to reclaim the range floor, though, I'm cutting fast. Plan (15m only): entry ~0.48780 · SL 0.48048 · TP 0.49800 · R:R 1.39 15m only — not a swing call. #MarketAnalysis {future}(REUSDT)
$RE — I like the long here, look. It bounced right off that rising trendline and keeping up higher lows through this whole pullback. That price slope stays clear above the longer-term MA too. This consolidation felt like a pause, not a reversal. I'm waiting for that decisive break above the last swing high to confirm it. If it fails to reclaim the range floor, though, I'm cutting fast.
Plan (15m only): entry ~0.48780 · SL 0.48048 · TP 0.49800 · R:R 1.39
15m only — not a swing call.
#MarketAnalysis
$ETH /USDT – Eyes on the Next Breakout 💎 📍 Entry Zone: $1,930 – $1,960 🎯 Target 1: $1,985 🎯 Target 2: $2,040 🛑 Stop Loss: Below $1,910 Market Pulse: Ethereum is holding above an important demand zone, showing resilience despite recent market fluctuations. The current price action suggests buyers are gradually regaining confidence, while a decisive move above nearby resistance could fuel the next bullish wave. Strong trading volume would add further confirmation to the setup. #ETH #Ethereum #Binance #CryptoTrading #MarketAnalysis
$ETH /USDT – Eyes on the Next Breakout 💎

📍 Entry Zone: $1,930 – $1,960

🎯 Target 1: $1,985
🎯 Target 2: $2,040

🛑 Stop Loss: Below $1,910

Market Pulse:

Ethereum is holding above an important demand zone, showing resilience despite recent market fluctuations. The current price action suggests buyers are gradually regaining confidence, while a decisive move above nearby resistance could fuel the next bullish wave. Strong trading volume would add further confirmation to the setup.

#ETH #Ethereum #Binance #CryptoTrading #MarketAnalysis
⚡🔥$RE This coin wasn't on my radar a few days ago, but now it's hard to ignore. Current Price: $0.4867 Key Levels Support: $0.4720 – $0.4780 Major Support: $0.4500 Resistance: $0.5000 Bullish Targets: $0.5200 → $0.5500 → $0.6000 TRADE HARE ➡️ $RE 📈 Trend is improving 💪 Buyers are stepping in 💰 Momentum is building 🎯 A key level is being tested The market often rewards patience, and this setup is becoming more interesting every day. 🚀 Breakout incoming? 📉 Or another fake move? 👇 What's your prediction? #BinanceSquare #CryptoTrading #MarketAnalysis #TradingSignals #CryptoCommunity
⚡🔥$RE This coin wasn't on my radar a few days ago, but now it's hard to ignore.

Current Price: $0.4867
Key Levels
Support: $0.4720 – $0.4780
Major Support: $0.4500
Resistance: $0.5000
Bullish Targets: $0.5200 → $0.5500 → $0.6000

TRADE HARE ➡️ $RE

📈 Trend is improving
💪 Buyers are stepping in
💰 Momentum is building
🎯 A key level is being tested

The market often rewards patience, and this setup is becoming more interesting every day.

🚀 Breakout incoming?
📉 Or another fake move?

👇 What's your prediction?

#BinanceSquare
#CryptoTrading
#MarketAnalysis
#TradingSignals
#CryptoCommunity
$BANK — honestly, this is a short here. It's just riding the top of that tight consolidation range right now. At those recent candles, they're dripping with upper wicks, showing sellers are stepping in hard at the higher price levels. Plus, the last push just failed again to sustain above the local high we made earlier. I'm fading any bounce until we see that range floor get smashed through on volume. Plan (15m only): entry ~0.34430 · SL 0.34946 · TP 0.33569 · R:R 1.67 15m only — not a swing call. #MarketAnalysis {future}(BANKUSDT)
$BANK — honestly, this is a short here. It's just riding the top of that tight consolidation range right now. At those recent candles, they're dripping with upper wicks, showing sellers are stepping in hard at the higher price levels. Plus, the last push just failed again to sustain above the local high we made earlier. I'm fading any bounce until we see that range floor get smashed through on volume.
Plan (15m only): entry ~0.34430 · SL 0.34946 · TP 0.33569 · R:R 1.67
15m only — not a swing call.
#MarketAnalysis
$SOL — honestly, the chart still says it has not invalidated the short case; the daily and four-hour views both suggest sellers are in control, even during this retracement. The current bearish momentum printing out with a large candle body aligns with the higher timeframe bias. This bearish bias remains intact unless we see a solid close back above the recent swing high. No chase outside the zone; the stop defines the whole idea. Execution plan (SOLUSDT — SHORT) Entry: 73.85 - 74.03 | SL: 74.37 Take profit: 73.51 → 73.17 → 72.74 #SOL #MarketAnalysis {future}(SOLUSDT)
$SOL — honestly, the chart still says it has not invalidated the short case; the daily and four-hour views both suggest sellers are in control, even during this retracement. The current bearish momentum printing out with a large candle body aligns with the higher timeframe bias. This bearish bias remains intact unless we see a solid close back above the recent swing high.

No chase outside the zone; the stop defines the whole idea.

Execution plan (SOLUSDT — SHORT)
Entry: 73.85 - 74.03 | SL: 74.37
Take profit: 73.51 → 73.17 → 72.74

#SOL #MarketAnalysis
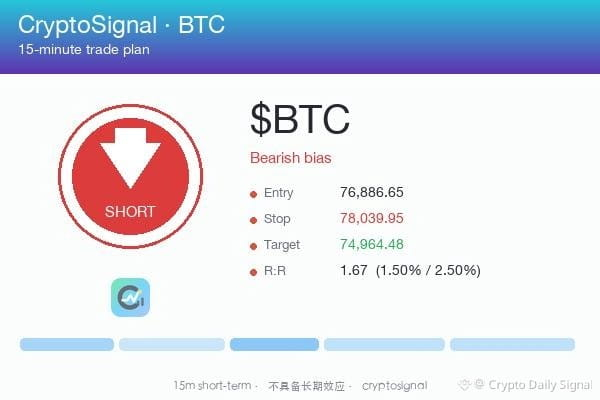
$BTC — ngl, this is a layup short. . Structure is capped by that recent swing high, and sellers are still in control. We're testing the range floor right now, which is exactly what I wanted. Plus, that last candle popped up with a huge upper wick—that's a clear rejection of higher bids. I'm fading the little bounce that tries to come back up. If it breaks this floor low on a red bar, I'm in. Plan (15m only): entry ~63,797.80 · SL 64,754.77 · TP 62,202.86 · R:R 1.67 15m only — not a swing call. #MarketAnalysis {future}(BTCUSDT)
$BTC — ngl, this is a layup short. . Structure is capped by that recent swing high, and sellers are still in control. We're testing the range floor right now, which is exactly what I wanted. Plus, that last candle popped up with a huge upper wick—that's a clear rejection of higher bids. I'm fading the little bounce that tries to come back up. If it breaks this floor low on a red bar, I'm in.

Plan (15m only): entry ~63,797.80 · SL 64,754.77 · TP 62,202.86 · R:R 1.67
15m only — not a swing call.
#MarketAnalysis
$DOT is a short watch, not a blind chase. The daily trend remains bearish, while the four-hour view is bearish, so I would rather let price come into the map. If that zone rejects the idea instead of confirming it, I am out. Patience matters more than being first. Trade Plan — DOTUSDT SHORT Entry: 0.8108 - 0.8122 Stop Loss: 0.8156 TP1: 0.8074 | TP2: 0.8042 | TP3: 0.8001 I am tracking the reaction inside the entry zone. What would make you pass on it? #DOT #MarketAnalysis {future}(DOTUSDT)
$DOT is a short watch, not a blind chase. The daily trend remains bearish, while the four-hour view is bearish, so I would rather let price come into the map. If that zone rejects the idea instead of confirming it, I am out. Patience matters more than being first.

Trade Plan — DOTUSDT SHORT
Entry: 0.8108 - 0.8122
Stop Loss: 0.8156
TP1: 0.8074 | TP2: 0.8042 | TP3: 0.8001

I am tracking the reaction inside the entry zone. What would make you pass on it?

#DOT #MarketAnalysis
🔥 BREAKING NEWS 🔥 Bitcoin ($BTC) has reached market capitulation levels comparable to those observed in 2022. Historically, such severe sell-off phases have marked optimal accumulation periods for long-term investors, suggesting current price levels may present a strategic entry opportunity. #Bitcoin #Crypto #MarketAnalysis $AVAX $APT Source: Compiled
🔥 BREAKING NEWS 🔥

Bitcoin ($BTC ) has reached market capitulation levels comparable to those observed in 2022. Historically, such severe sell-off phases have marked optimal accumulation periods for long-term investors, suggesting current price levels may present a strategic entry opportunity.

#Bitcoin #Crypto #MarketAnalysis

$AVAX $APT

Source: Compiled
🔥 BREAKING NEWS 🔥 Bitcoin ($BTC) has reached market capitulation levels comparable to those observed in 2022. Historically, such severe sell-off phases have marked optimal accumulation periods for long-term investors, suggesting current price levels may present a strategic entry opportunity. #Bitcoin #Crypto #MarketAnalysis $AVAX $APT Source: Compiled
🔥 BREAKING NEWS 🔥

Bitcoin ($BTC ) has reached market capitulation levels comparable to those observed in 2022. Historically, such severe sell-off phases have marked optimal accumulation periods for long-term investors, suggesting current price levels may present a strategic entry opportunity.

#Bitcoin #Crypto #MarketAnalysis

$AVAX $APT

Source: Compiled
$BNB is looking shaky, man. Short. The price is camped right at the lower boundary of this range. Plus, it's been throwing up multiple lower highs since that last peak, showing buyers just aren't convinced to push through the resistance. I'm fading the bounce until we get a clean break below that range floor. If it gets swallowed below that support, I'm in. Plan (15m only): entry ~566.293 · SL 574.787 · TP 552.136 · R:R 1.67 15m only — not a swing call. #MarketAnalysis {future}(BNBUSDT)
$BNB is looking shaky, man. Short. The price is camped right at the lower boundary of this range. Plus, it's been throwing up multiple lower highs since that last peak, showing buyers just aren't convinced to push through the resistance. I'm fading the bounce until we get a clean break below that range floor. If it gets swallowed below that support, I'm in.
Plan (15m only): entry ~566.293 · SL 574.787 · TP 552.136 · R:R 1.67
15m only — not a swing call.
#MarketAnalysis
$BTC — bro, here's my read: it continues to favor the short case despite the current tight consolidation. Chasing further downside while the price stays trapped in that descending channel feels premature. We need to see a definite break below the bottom boundary confirmed by a bearish candle for this thesis to get stronger. The levels matter more than the prediction. Size it accordingly. Trade Plan — BTCUSDT SHORT Entry: 63,668.3 - 63,773.3 Stop Loss: 64,039.4 TP1: 63,402.2 | TP2: 63,147.3 | TP3: 62,828.7 #BTC #MarketAnalysis {future}(BTCUSDT)
$BTC — bro, here's my read: it continues to favor the short case despite the current tight consolidation. Chasing further downside while the price stays trapped in that descending channel feels premature. We need to see a definite break below the bottom boundary confirmed by a bearish candle for this thesis to get stronger.

The levels matter more than the prediction. Size it accordingly.

Trade Plan — BTCUSDT SHORT
Entry: 63,668.3 - 63,773.3
Stop Loss: 64,039.4
TP1: 63,402.2 | TP2: 63,147.3 | TP3: 62,828.7

#BTC #MarketAnalysis
$BANK — look guys, I'm fading this one. It's boxed in tight, just riding that range floor for now. The most recent candle threw up a massive upper wick, which just screams selling pressure hitting that high boundary. Plus, it keeps tapping the local resistance but never gets a clean break above it. I'm shorting the next dip back into the range. Plan (15m only): entry ~0.38086 · SL 0.38657 · TP 0.37134 · R:R 1.67 15m only — not a swing call. #MarketAnalysis {future}(BANKUSDT)
$BANK — look guys, I'm fading this one. It's boxed in tight, just riding that range floor for now. The most recent candle threw up a massive upper wick, which just screams selling pressure hitting that high boundary. Plus, it keeps tapping the local resistance but never gets a clean break above it. I'm shorting the next dip back into the range.
Plan (15m only): entry ~0.38086 · SL 0.38657 · TP 0.37134 · R:R 1.67
15m only — not a swing call.
#MarketAnalysis
$AAVE looks primed for a breakout As long as AAVE stays above the 82.70 support, expect price to retest the 102.54 resistance and potentially break out to new highs. MAs trending upward, indicating a strong uptrend Bullish momentum with a 10-bar trend indicator Price action is respecting key levels A daily close under 82.70 invalidates this trade setup Where do you see $AAVE heading next? #MarketAnalysis
$AAVE looks primed for a breakout

As long as AAVE stays above the 82.70 support, expect price to retest the 102.54 resistance and potentially break out to new highs.

MAs trending upward, indicating a strong uptrend
Bullish momentum with a 10-bar trend indicator
Price action is respecting key levels

A daily close under 82.70 invalidates this trade setup

Where do you see $AAVE heading next?

#MarketAnalysis
Log in to explore more content
Join global crypto users on Binance Square
⚡️ Get latest and useful information about crypto.
💬 Trusted by the world’s largest crypto exchange.
👍 Discover real insights from verified creators.
Email / Phone number