

#cryptoeducation
cryptoeducation
Просмотров: 3.6M
22,833 обсуждают
Популярные
Новые

·
--
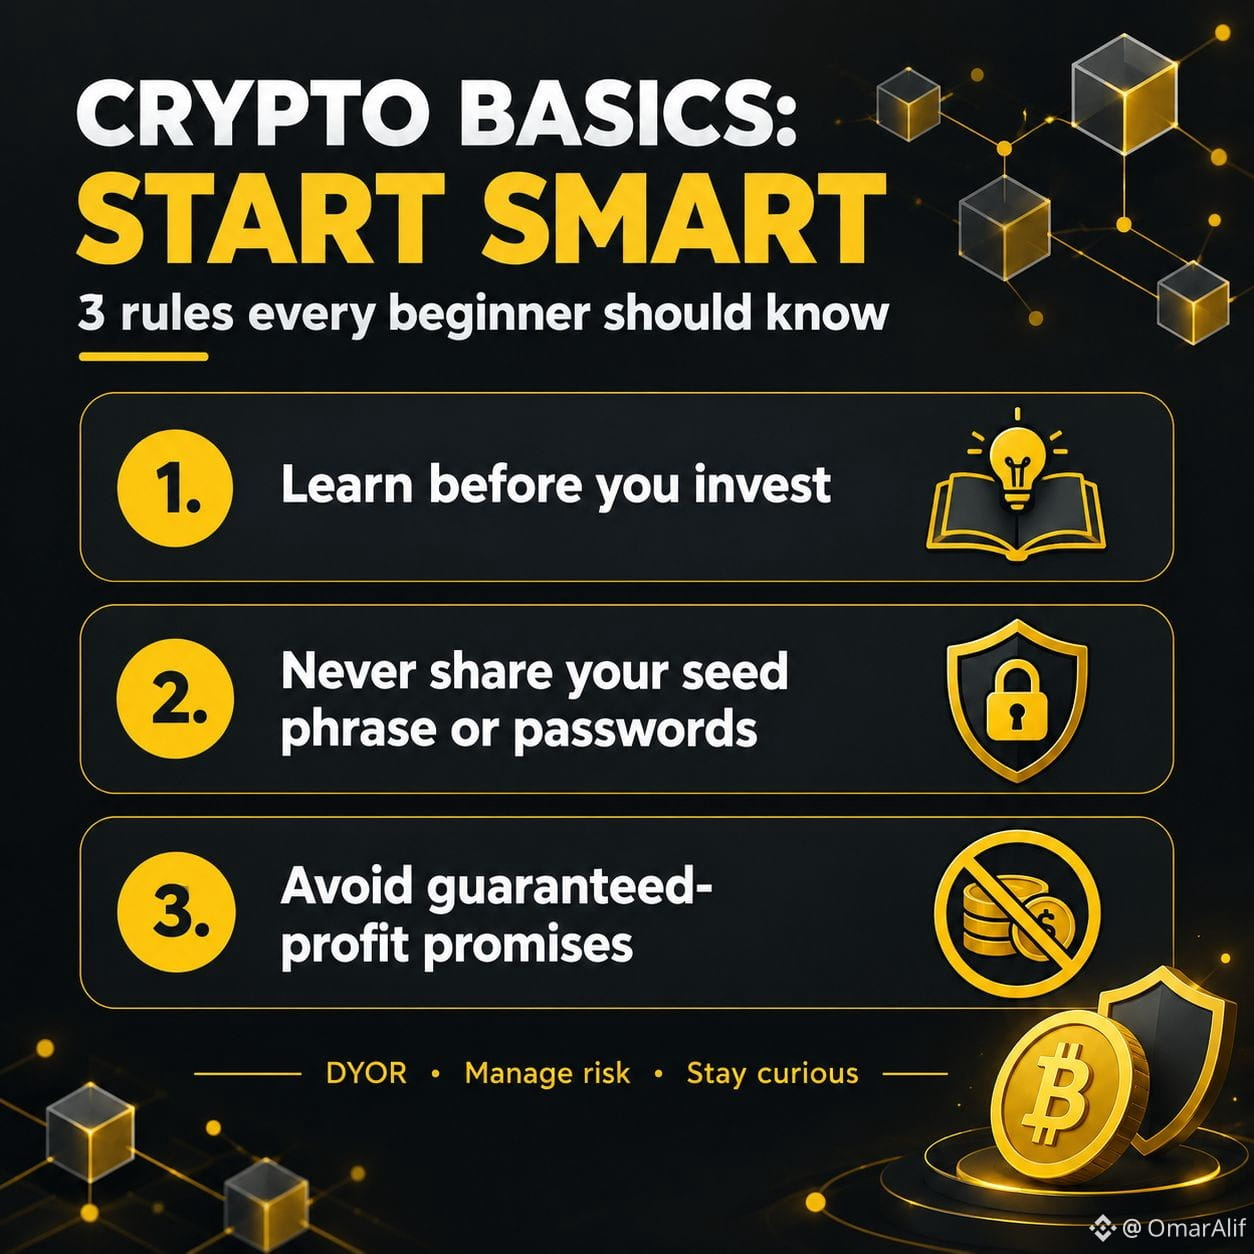
🚀 CRYPTO BASICS: START SMART
New to crypto? Remember these 3 essential rules! 🔐
📚 1. Learn Before You Invest
Understand the project, its risks, and the technology before making any decision.
🛡️ 2. Protect Your Account
Never share your password, 2FA codes, or wallet seed phrase with anyone.
⚠️ 3. Beware of Guaranteed Profits
Crypto markets are volatile. No one can guarantee profits, and you should never invest money you cannot afford to lose.
💡 Remember: Knowledge is your first investment.
💬 Question: What was the first thing you learned about crypto? Share it in the comments!
#Binance #CryptoEducation #blockchains #CryptoNewss #Web3
1
52

Demystifying Market Depth: How to Read Order Books and Measure True Crypto LiquidityWhen transitioning from a novice trader to an intermediate market participant, one of the most vital adjustments you can make is changing how you look at price action. Beginners typically rely exclusively on line or candlestick charts, which show historical price movement—what has already happened. Intermediate traders, however, look at the order book and market depth to understand what is likely to happen when large orders hit the exchange.
Market depth represents an exchange's ability to absorb large market orders without causing significant price fluctuations. It is a real-time window into supply and demand, revealing where buyers and sellers have placed their conditional orders. By understanding how to read market depth, traders can better estimate execution costs, detect potential manipulation, and navigate volatile market conditions with far greater precision.
---
### 1. The Anatomy of an Order Book
To understand market depth, you must first master its foundation: the order book. An order book is a real-time, continuously updated list of open buy and sell limit orders for a specific asset. It is split into two primary sides:
1. **The Bid Side (Buyers):** Located on the left or bottom (depending on the interface), bids represent traders offering to buy an asset at a specified price. Bids are sorted in descending order, with the highest bid price sitting at the very top.
2. **The Ask Side (Sellers):** Also known as the "offer" side, asks represent traders offering to sell an asset at a specified price. Asks are sorted in ascending order, with the lowest ask price sitting at the top.
The gap between the highest bid and the lowest ask is known as the **bid-ask spread**. In highly liquid markets, such as Bitcoin or Ethereum on major global exchanges, this spread is often just a fraction of a cent or a single tick size. In less liquid markets, such as micro-cap altcoins, the spread can be significantly wider, meaning you pay an immediate premium just to enter or exit a position using a market order.
The order book consists of **limit orders**—traders saying, "I want to buy/sell $X amount, but only if the price reaches $Y." When someone submits a **market order**, saying "I want to buy/sell $X amount immediately at the best available price," that market order matches against the existing limit orders in the book, consuming available liquidity.
---
### 2. How to Read a Market Depth Chart
While numerical order books list prices line-by-line, a **market depth chart** offers a visual representation of this data. It plots cumulative order volume along a horizontal price axis.
The chart is divided into two colored zones:
* **Green Curve (Cumulative Bids):** Displays the total amount of buying power available as price decreases.
* **Red Curve (Cumulative Asks):** Displays the total amount of selling pressure available as price increases.
#### Understanding Slope and Depth
* **Steep Slopes (Liquidity Walls):** A sudden, near-vertical rise in either curve indicates a massive cluster of limit orders concentrated at a specific price point. These are commonly referred to as "buy walls" or "sell walls."
* **Gradual Slopes:** A smooth, upward slope suggests liquidity is evenly distributed across a wide range of prices, indicating a healthier and less concentrated market environment.
When an asset approaches a massive **buy wall**, it means a large amount of capital is waiting to purchase the asset at that price level. In theory, price will struggle to drop below that point until all those limit orders are completely filled. Conversely, a massive **sell wall** acts as potential overhead resistance, requiring significant buying volume to breach.
---
### 3. Practical Execution: Slippage and Price Impact
One of the most practical applications of reading market depth is calculating **price impact** and **slippage** before executing a trade.
* **Slippage** occurs when a market order executes at a price different from the price expected when the trade was submitted.
* **Price Impact** refers to how much your own trade shifts the market price of the asset.
#### Practical Example:
Imagine you want to buy 50 units of a mid-cap crypto asset using a market order. The current top of the ask side is $100, but there are only 10 units available at $100.
The order book looks like this:
* Ask Level 1: 10 units at $100
* Ask Level 2: 15 units at $101
* Ask Level 3: 25 units at $103
If you click "Market Buy" for 50 units, the exchange engine fills your order sequentially:
1. It buys 10 units at $100 ($1,000)
2. It buys 15 units at $101 ($1,515)
3. It buys 25 units at $103 ($2,575)
Your total cost is $5,090, meaning your **average execution price** was $101.80 per unit, even though the displayed price when you clicked buy was $100. You experienced an average slippage of 1.8%. Furthermore, you consumed all liquidity up to $103, pushing the new market price of the asset up to $103 for the next trader.
By analyzing the market depth prior to execution, you can determine whether your order size is too large for the current order book and adjust your strategy—such as splitting the trade into smaller chunks over time or utilizing limit orders instead.
---
### 4. Advanced Order Book Dynamics: Illusions and Manipulation
While market depth provides valuable insight, intermediate traders must understand that the order book is not a static representation of true intent. Because limit orders can be canceled instantly at zero cost, market depth can sometimes be misleading.
#### 1. Spoofing and Fake Walls
Spoofing is an illegal or prohibited market manipulation tactic where a large trader or algorithmic bot places a massive limit order (e.g., a huge sell wall) with no intention of letting it execute. The goal is to create the illusion of heavy resistance, causing smaller traders to panic and sell their holdings. Once the price drops to the manipulator's desired entry zone, they cancel the fake sell wall and buy the asset at a discount.
#### 2. Iceberg Orders
Institutional participants rarely place massive limit orders directly on the order book, as doing so alerts the market to their intentions. Instead, they use **iceberg orders**. An iceberg order breaks a massive trade into small, visible slices. As soon as one visible slice is filled, another automatically takes its place. If a price level appears to have only 1 unit available but repeatedly absorbs dozens of market buys without moving, you are likely witnessing an iceberg buy order absorbing selling volume.
#### 3. Dynamic Automated Liquidity
In modern crypto markets, a vast majority of order book depth is provided by algorithmic Market Makers (MMs). These automated bots continuously update their bids and asks thousands of times per minute in response to broader market movements. During periods of sudden macro volatility, these algorithms can retract their orders in milliseconds, causing depth to evaporate instantly and leading to severe liquidity gaps.
---
### 5. Risks, Limitations, and Best Practices
Relying solely on market depth carries distinct risks that every trader must account for:
* **Liquidity Fragmentation:** Crypto trading takes place across dozens of centralized and decentralized venues. Excellent depth on one primary exchange does not guarantee global market liquidity, nor does it prevent price arbitrage across platforms.
* **Order Book Speed:** Algorithmic systems move faster than human perception. A wall visible on a depth chart can vanish a split second before a market order arrives.
* **Over-reliance on Static Levels:** Treat buy and sell walls as tentative indicators rather than guaranteed support or resistance levels.
#### Practical Best Practices:
1. **Match Order Type to Liquidity:** Always check market depth before executing large market orders. If the order book is thin, use patient limit orders or algorithmic TWAP (Time-Weighted Average Price) strategies.
2. **Look for Confirmation:** Never buy or sell solely because a large wall appeared on the depth chart. Look for confirmation across volume indicators, historical support/resistance, and general market momentum.
3. **Monitor Order Book Velocity:** Pay attention to how quickly orders are filled versus canceled. A wall that actively absorbs orders is far more meaningful than a wall that retreats whenever price approaches it.
---
### Conclusion
Market depth transforms how you view the crypto ecosystem by shifting your focus from historical price movements to live structural liquidity. By learning to interpret order books, identify slippage risks, and recognize common visual illusions like spoofing walls, you equip yourself with the tools required to trade more effectively and protect your capital from unnecessary execution drag.
#CryptoEducation #MarketDepth #TradingStrategy
Demystifying Market Depth: How to Read Order Books and Measure True Crypto Liquidity
When transitioning from a novice trader to an intermediate market participant, one of the most vital adjustments you can make is changing how you look at price action. Beginners typically rely exclusively on line or candlestick charts, which show historical price movement—what has already happened. Intermediate traders, however, look at the order book and market depth to understand what is likely to happen when large orders hit the exchange.
Market depth represents an exchange's ability to absorb large market orders without causing significant price fluctuations. It is a real-time window into supply and demand, revealing where buyers and sellers have placed their conditional orders. By understanding how to read market depth, traders can better estimate execution costs, detect potential manipulation, and navigate volatile market conditions with far greater precision.
---
### 1. The Anatomy of an Order Book
To understand market depth, you must first master its foundation: the order book. An order book is a real-time, continuously updated list of open buy and sell limit orders for a specific asset. It is split into two primary sides:
1. **The Bid Side (Buyers):** Located on the left or bottom (depending on the interface), bids represent traders offering to buy an asset at a specified price. Bids are sorted in descending order, with the highest bid price sitting at the very top.
2. **The Ask Side (Sellers):** Also known as the "offer" side, asks represent traders offering to sell an asset at a specified price. Asks are sorted in ascending order, with the lowest ask price sitting at the top.
The gap between the highest bid and the lowest ask is known as the **bid-ask spread**. In highly liquid markets, such as Bitcoin or Ethereum on major global exchanges, this spread is often just a fraction of a cent or a single tick size. In less liquid markets, such as micro-cap altcoins, the spread can be significantly wider, meaning you pay an immediate premium just to enter or exit a position using a market order.
The order book consists of **limit orders**—traders saying, "I want to buy/sell $X amount, but only if the price reaches $Y." When someone submits a **market order**, saying "I want to buy/sell $X amount immediately at the best available price," that market order matches against the existing limit orders in the book, consuming available liquidity.
---
### 2. How to Read a Market Depth Chart
While numerical order books list prices line-by-line, a **market depth chart** offers a visual representation of this data. It plots cumulative order volume along a horizontal price axis.
The chart is divided into two colored zones:
* **Green Curve (Cumulative Bids):** Displays the total amount of buying power available as price decreases.
* **Red Curve (Cumulative Asks):** Displays the total amount of selling pressure available as price increases.
#### Understanding Slope and Depth
* **Steep Slopes (Liquidity Walls):** A sudden, near-vertical rise in either curve indicates a massive cluster of limit orders concentrated at a specific price point. These are commonly referred to as "buy walls" or "sell walls."
* **Gradual Slopes:** A smooth, upward slope suggests liquidity is evenly distributed across a wide range of prices, indicating a healthier and less concentrated market environment.
When an asset approaches a massive **buy wall**, it means a large amount of capital is waiting to purchase the asset at that price level. In theory, price will struggle to drop below that point until all those limit orders are completely filled. Conversely, a massive **sell wall** acts as potential overhead resistance, requiring significant buying volume to breach.
---
### 3. Practical Execution: Slippage and Price Impact
One of the most practical applications of reading market depth is calculating **price impact** and **slippage** before executing a trade.
* **Slippage** occurs when a market order executes at a price different from the price expected when the trade was submitted.
* **Price Impact** refers to how much your own trade shifts the market price of the asset.
#### Practical Example:
Imagine you want to buy 50 units of a mid-cap crypto asset using a market order. The current top of the ask side is $100, but there are only 10 units available at $100.
The order book looks like this:
* Ask Level 1: 10 units at $100
* Ask Level 2: 15 units at $101
* Ask Level 3: 25 units at $103
If you click "Market Buy" for 50 units, the exchange engine fills your order sequentially:
1. It buys 10 units at $100 ($1,000)
2. It buys 15 units at $101 ($1,515)
3. It buys 25 units at $103 ($2,575)
Your total cost is $5,090, meaning your **average execution price** was $101.80 per unit, even though the displayed price when you clicked buy was $100. You experienced an average slippage of 1.8%. Furthermore, you consumed all liquidity up to $103, pushing the new market price of the asset up to $103 for the next trader.
By analyzing the market depth prior to execution, you can determine whether your order size is too large for the current order book and adjust your strategy—such as splitting the trade into smaller chunks over time or utilizing limit orders instead.
---
### 4. Advanced Order Book Dynamics: Illusions and Manipulation
While market depth provides valuable insight, intermediate traders must understand that the order book is not a static representation of true intent. Because limit orders can be canceled instantly at zero cost, market depth can sometimes be misleading.
#### 1. Spoofing and Fake Walls
Spoofing is an illegal or prohibited market manipulation tactic where a large trader or algorithmic bot places a massive limit order (e.g., a huge sell wall) with no intention of letting it execute. The goal is to create the illusion of heavy resistance, causing smaller traders to panic and sell their holdings. Once the price drops to the manipulator's desired entry zone, they cancel the fake sell wall and buy the asset at a discount.
#### 2. Iceberg Orders
Institutional participants rarely place massive limit orders directly on the order book, as doing so alerts the market to their intentions. Instead, they use **iceberg orders**. An iceberg order breaks a massive trade into small, visible slices. As soon as one visible slice is filled, another automatically takes its place. If a price level appears to have only 1 unit available but repeatedly absorbs dozens of market buys without moving, you are likely witnessing an iceberg buy order absorbing selling volume.
#### 3. Dynamic Automated Liquidity
In modern crypto markets, a vast majority of order book depth is provided by algorithmic Market Makers (MMs). These automated bots continuously update their bids and asks thousands of times per minute in response to broader market movements. During periods of sudden macro volatility, these algorithms can retract their orders in milliseconds, causing depth to evaporate instantly and leading to severe liquidity gaps.
---
### 5. Risks, Limitations, and Best Practices
Relying solely on market depth carries distinct risks that every trader must account for:
* **Liquidity Fragmentation:** Crypto trading takes place across dozens of centralized and decentralized venues. Excellent depth on one primary exchange does not guarantee global market liquidity, nor does it prevent price arbitrage across platforms.
* **Order Book Speed:** Algorithmic systems move faster than human perception. A wall visible on a depth chart can vanish a split second before a market order arrives.
* **Over-reliance on Static Levels:** Treat buy and sell walls as tentative indicators rather than guaranteed support or resistance levels.
#### Practical Best Practices:
1. **Match Order Type to Liquidity:** Always check market depth before executing large market orders. If the order book is thin, use patient limit orders or algorithmic TWAP (Time-Weighted Average Price) strategies.
2. **Look for Confirmation:** Never buy or sell solely because a large wall appeared on the depth chart. Look for confirmation across volume indicators, historical support/resistance, and general market momentum.
3. **Monitor Order Book Velocity:** Pay attention to how quickly orders are filled versus canceled. A wall that actively absorbs orders is far more meaningful than a wall that retreats whenever price approaches it.
---
### Conclusion
Market depth transforms how you view the crypto ecosystem by shifting your focus from historical price movements to live structural liquidity. By learning to interpret order books, identify slippage risks, and recognize common visual illusions like spoofing walls, you equip yourself with the tools required to trade more effectively and protect your capital from unnecessary execution drag.
#CryptoEducation #MarketDepth #TradingStrategy
42
·
--
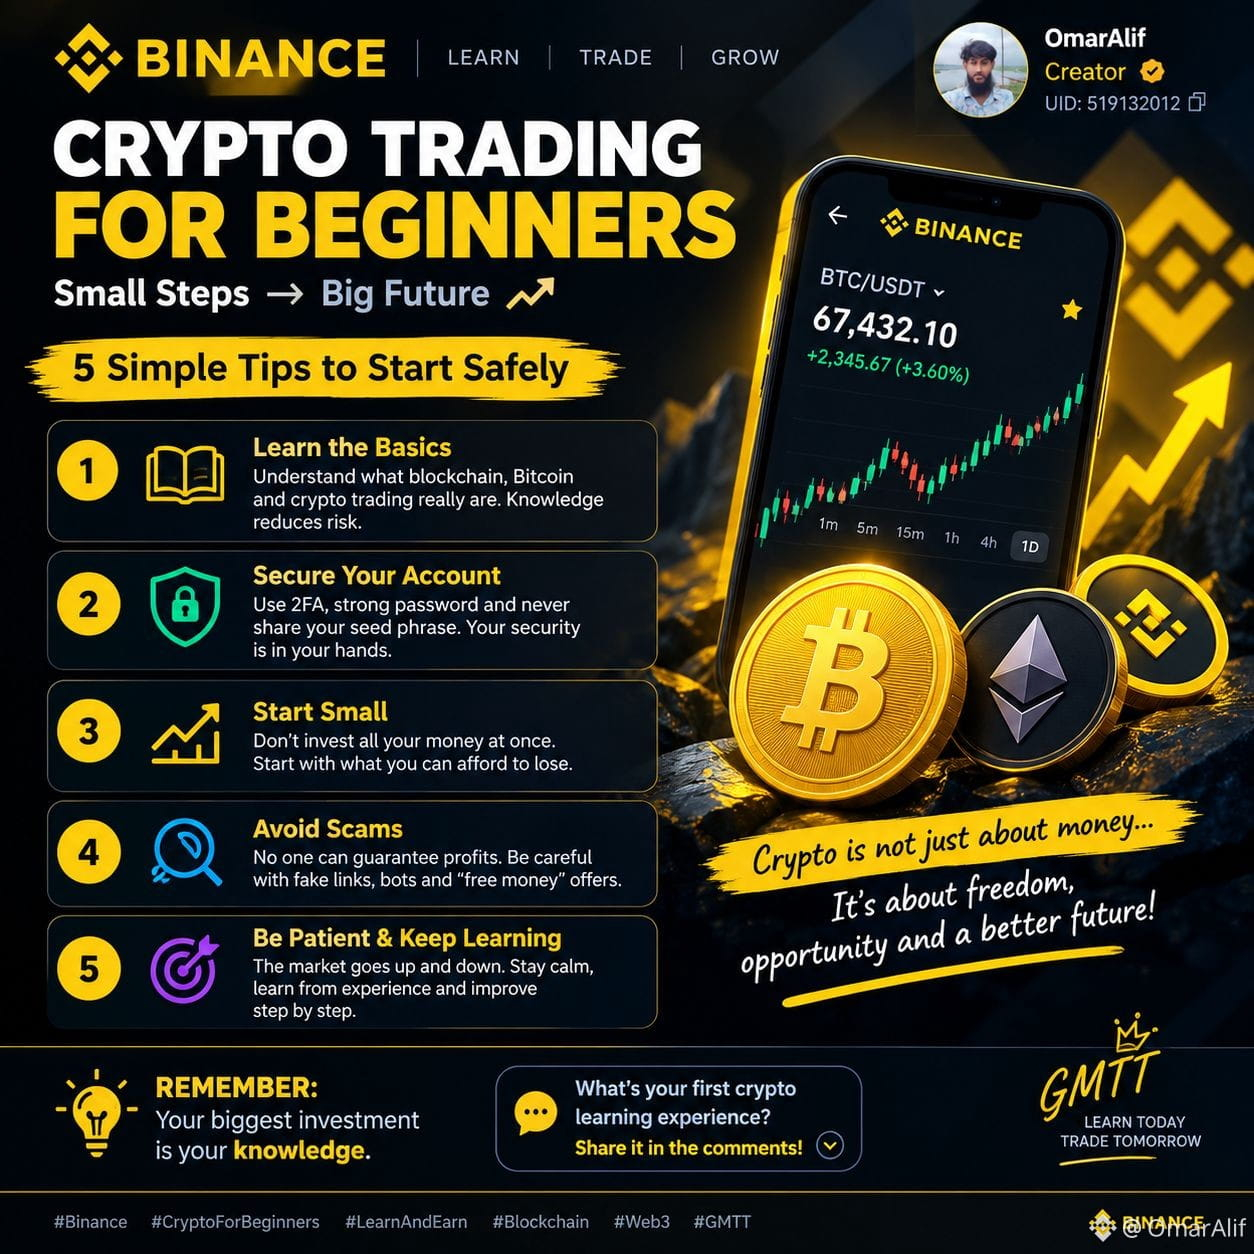
🚀 CRYPTO IS A JOURNEY, NOT A GET-RICH-QUICK SCHEME!
💡 Every expert was once a beginner.
If you want to grow in the crypto world, remember these 5 golden rules:
📚 Learn before you trade. 🔐 Protect your account and assets. 📉 Understand risk before chasing profit. 🚫 Stay away from scams and fake promises. 🎯 Be patient, consistent, and keep learning.
Your greatest asset isn't Bitcoin or any other coin — it's the knowledge behind your decisions. 🧠
🔥 Learn today. Make smarter decisions tomorrow.
💬 What's ONE crypto lesson you wish every beginner knew? Share it below! 👇
#Binance #CryptoEducation #Blockchain #LearnAndEarn #Web3
1
95

·
--
📖 Glossary: Slippage
Slippage is the gap between the price you clicked and the price you actually got.
Why it happens 👇
• Market orders take whatever sits in the order book
• Thin books (small caps, quiet hours) mean bigger gaps
• Fast moves on news can jump right past your price
Example: you market-buy at $1.00, the book is thin, and your average fill comes in at $1.03. That 3% is slippage, on top of fees.
How to keep it small:
✅ Use limit orders when you're not in a rush
✅ Check order book depth before a big order
✅ Split large orders into smaller pieces
Ever had a fill way off from what you expected? 👀
#cryptoeducation #cryptotrading #CryptoMarket #Binance
1

·
--
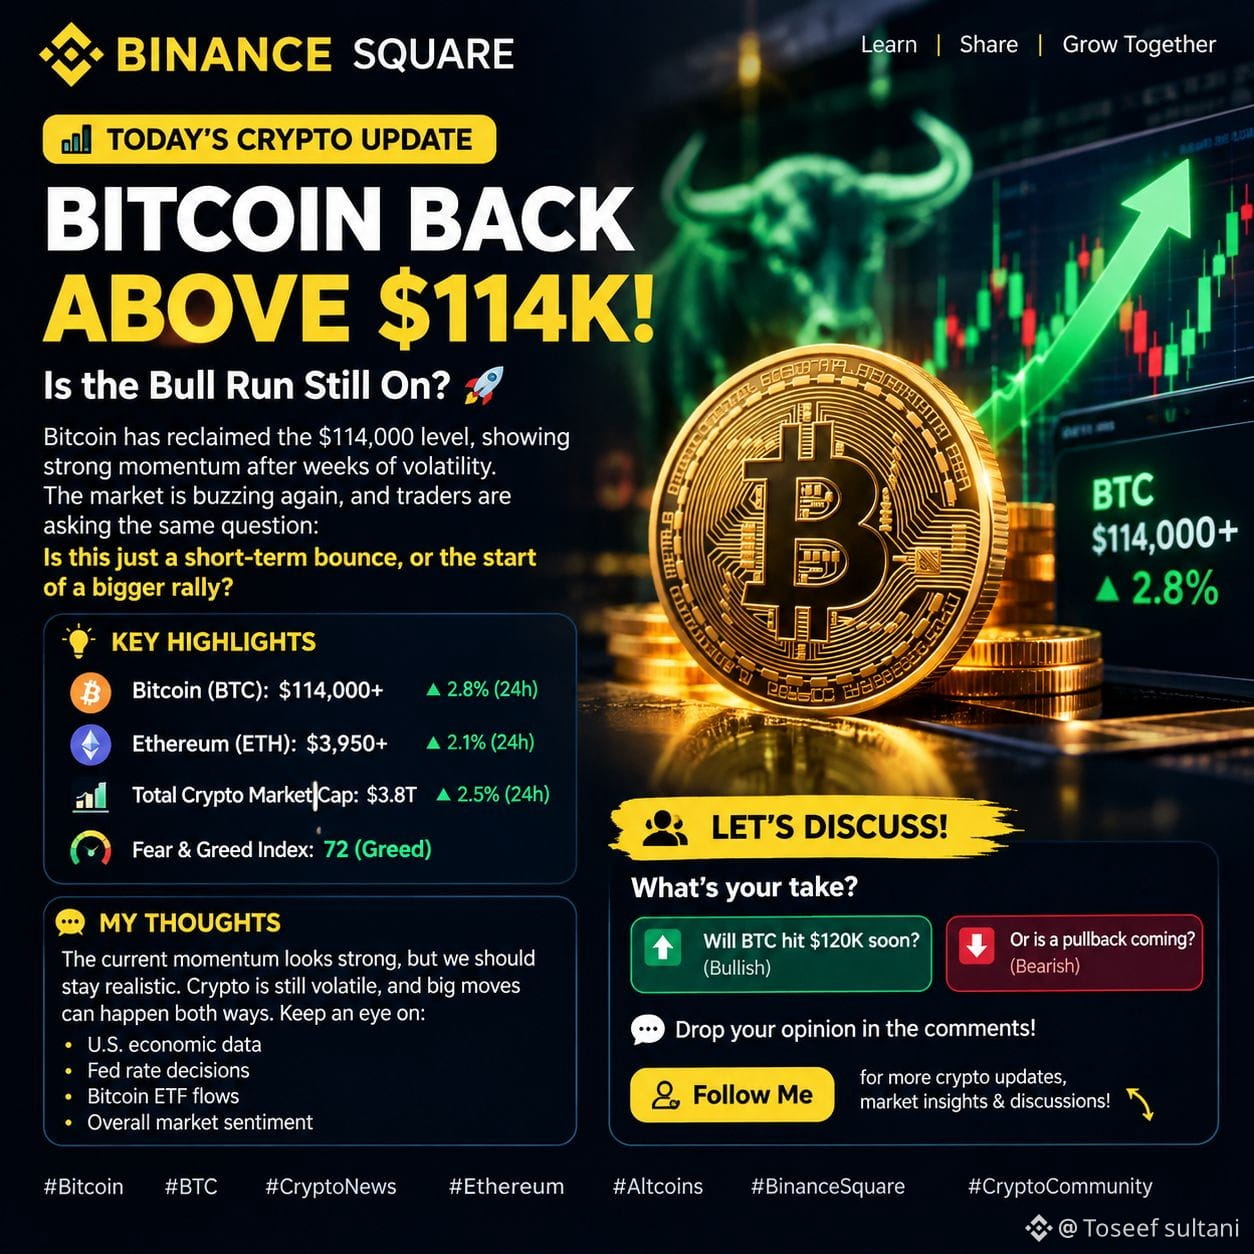
₿ BITCOIN IN 3 QUICK FACTS!
• Maximum supply: 21 million BTC.
• Bitcoin uses blockchain technology.
• Its price depends on supply demand and market sentiment.
💡 Remember: Bitcoin is limited in supply, but its price is never guaranteed to rise.
👇 One question: Do you understand Bitcoin better now?
Follow for daily crypto knowledge!
#BitcoinDunyamiz #BTC #cryptoeducation #BinanceSquar #FedWatch
53

Статья
Are you just watching the market, or are you actually using Binance to its full potential?Being a smart user on Binance means moving beyond just staring at charts and hoping for the best. To survive and thrive in this ecosystem, you need to use the right tools for the right market conditions.
Here is a quick guide to leveling up your Binance experience today:
1️⃣ Protect Your Capital First: Before jumping into high-risk trades, use Binance Academy to research project fundamentals. Avoid trading purely on social media hype.
2️⃣ Master the Interface Risk-Free: Don't lose real money testing new strategies. Use Binance Mock Trading to practice with virtual funds until you feel confident.
3️⃣ Build Passive Wealth: Don't let your assets sit idle. Check out Binance Earn for flexible savings or locked staking to grow your portfolio safely even during market consolidation.
4️⃣ Automate and De-risk: Explore the Binance Trading Bots feature (like Spot Grid) to accumulate your favorite assets like BTC or ETH without letting emotions dictate your entry points.
Success in crypto isn't about getting lucky once; it's about building consistent, smart habits.
What is your go-to feature on Binance? Drop it in the comments below! 👇
#BİNANCESQUARE #CryptoTrading. ng #BinanceEarnings #tradingtips #cryptoeducation
Support My Content: If you found this guide helpful, feel free to show some love by leaving a Tip 👇. Every bit of support helps me dedicate more time to research and provide deep-market insights for our community! Don't forget to Follow!
Are you just watching the market, or are you actually using Binance to its full potential?
Being a smart user on Binance means moving beyond just staring at charts and hoping for the best. To survive and thrive in this ecosystem, you need to use the right tools for the right market conditions.
Here is a quick guide to leveling up your Binance experience today:
1️⃣ Protect Your Capital First: Before jumping into high-risk trades, use Binance Academy to research project fundamentals. Avoid trading purely on social media hype.
2️⃣ Master the Interface Risk-Free: Don't lose real money testing new strategies. Use Binance Mock Trading to practice with virtual funds until you feel confident.
3️⃣ Build Passive Wealth: Don't let your assets sit idle. Check out Binance Earn for flexible savings or locked staking to grow your portfolio safely even during market consolidation.
4️⃣ Automate and De-risk: Explore the Binance Trading Bots feature (like Spot Grid) to accumulate your favorite assets like BTC or ETH without letting emotions dictate your entry points.
Success in crypto isn't about getting lucky once; it's about building consistent, smart habits.
What is your go-to feature on Binance? Drop it in the comments below! 👇
#BİNANCESQUARE #CryptoTrading. ng #BinanceEarnings #tradingtips #cryptoeducation
Support My Content: If you found this guide helpful, feel free to show some love by leaving a Tip 👇. Every bit of support helps me dedicate more time to research and provide deep-market insights for our community! Don't forget to Follow!
69

·
--
I trade crypto 2 ways: spot and futures. Spot means I own the asset, I buy $BTC and it's in my wallet. Futures is different, I trade contracts that settle later. I don't own the asset, I own a promise to buy or sell it. THIS CHANGES THE GAME. I can go long or short without holding the coin, it's a contract. Understand the difference before you start, don't get caught off guard #CryptoEducation #Futures #Trading
I trade crypto 2 ways: spot and futures. Spot means I own the asset, I buy $BTC and it's in my wallet. Futures is different, I trade contracts that settle later. I don't own the asset, I own a promise to buy or sell it. THIS CHANGES THE GAME. I can go long or short without holding the coin, it's a contract. Understand the difference before you start, don't get caught off guard #CryptoEducation #Futures #Trading
13

·
--
🚀 CRYPTO KNOWLEDGE IS YOUR REAL POWER!
📚 Learn about a project before investing your money.
⚠️ Never trust guaranteed-profit promises or online hype.
🛡️ Protect your funds and always manage your risk.
💬 What is more important in crypto: Knowledge, Patience, or Risk Management? Share your opinion!
Follow @akhtarameerchishti
[https://www.binance.com/en/square/profile/akhtarameerchishti](https://www.binance.com/en/square/profile/akhtarameerchishti)
#Crypto #Bitcoin #CryptoEducation #RiskManagement #BinanceSquare
🚀 CRYPTO KNOWLEDGE IS YOUR REAL POWER!
📚 Learn about a project before investing your money.
⚠️ Never trust guaranteed-profit promises or online hype.
🛡️ Protect your funds and always manage your risk.
💬 What is more important in crypto: Knowledge, Patience, or Risk Management? Share your opinion!
Follow @akhtarameerchishti
https://www.binance.com/en/square/profile/akhtarameerchishti
#Crypto #Bitcoin #CryptoEducation #RiskManagement #BinanceSquare
67

·
--
Crypto Is More Than Coins — It’s an Entire Digital Infrastructure 🌐
When people discuss crypto, they often focus only on Bitcoin’s price or the latest market trend.
But behind every transaction, an entire system is working.
🔹 Nodes help maintain and verify blockchain data.
🔹 Validators help confirm transactions and maintain network security.
🔹 Transaction fees compensate network participants and help manage demand.
🔹 Network protocols define how different participants communicate.
Understanding this infrastructure gives us a deeper perspective on how digital assets actually work.
The real innovation isn't just the coin — it's the system that makes digital ownership possible.
💬 Question: Which part of crypto infrastructure would you like to understand better: nodes, validators, or transaction fees?
#CryptoEducation #BlockchainTechnology #BinanceSquare #DigitalAssets
31

·
--
Статья
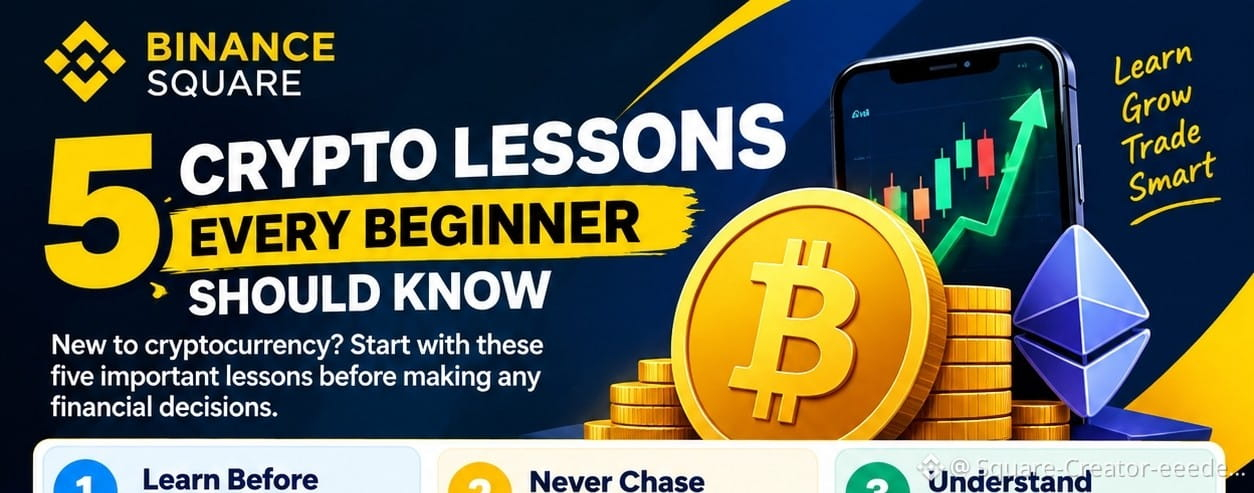
📘 5 Crypto Lessons Every Beginner Should Know 🚀New to cryptocurrency? Start with these five important lessons before making any financial decisions.
{spot}(BTCUSDT)
{spot}(ETHUSDT)
$NVDAB
✅ 1. Learn Before You Invest
Understand Bitcoin, blockchain, wallets, and how crypto markets work.
✅ 2. Never Chase Hype
A coin trending on social media is not necessarily a good investment.
✅ 3. Understand Risk Management
Crypto prices can change rapidly. Never risk money you cannot afford to lose.
✅ 4. Beware of Scams
Avoid guaranteed-profit promises, fake giveaways, and suspicious links.
✅ 5. Do Your Own Research
Check official project information, token supply, liquidity, and potential risks.
💡 Remember: Knowledge and patience matter more than chasing quick profits.
👇 Question of the Day: What crypto topic should I explain next — Bitcoin, Ethereum, or Risk Management?
Follow for more simple and practical crypto education!
$NVDAB $AAPLB
#BinanceSquare #CryptoEducation #Bitcoin
📘 5 Crypto Lessons Every Beginner Should Know 🚀
New to cryptocurrency? Start with these five important lessons before making any financial decisions.
$NVDAB
✅ 1. Learn Before You Invest
Understand Bitcoin, blockchain, wallets, and how crypto markets work.
✅ 2. Never Chase Hype
A coin trending on social media is not necessarily a good investment.
✅ 3. Understand Risk Management
Crypto prices can change rapidly. Never risk money you cannot afford to lose.
✅ 4. Beware of Scams
Avoid guaranteed-profit promises, fake giveaways, and suspicious links.
✅ 5. Do Your Own Research
Check official project information, token supply, liquidity, and potential risks.
💡 Remember: Knowledge and patience matter more than chasing quick profits.
👇 Question of the Day: What crypto topic should I explain next — Bitcoin, Ethereum, or Risk Management?
Follow for more simple and practical crypto education!
$NVDAB $AAPLB
#BinanceSquare #CryptoEducation #Bitcoin
1
45

·
--
Рост
🚨 THE NEXT CRYPTO OPPORTUNITY? 👀📈
Most people watch the price. Smart investors study the market. 🧠
Before choosing any cryptocurrency, ask yourself 3 questions:
🔹 1. Does the project solve a real-world problem? 🔹 2. Is its trading volume increasing? 🔹 3. Is the price rising because of real demand or just hype?
💡 Remember: A low-priced coin is NOT necessarily a cheap investment!
⚠️ Never invest money you cannot afford to lose. Always do your own research (DYOR).
🔥 YOUR TURN!
If you could choose ONE crypto to research for the next 12 months, which would it be?
₿ Bitcoin (BTC) Ξ Ethereum (ETH) ◎ Solana (SOL)
👇 Comment your choice and tell us WHY!
$BTC
{spot}(BTCUSDT)
#BinanceSquare #Bitcoin #Ethereum #solana #CryptoEducation
🚨 THE NEXT CRYPTO OPPORTUNITY? 👀📈
Most people watch the price. Smart investors study the market. 🧠
Before choosing any cryptocurrency, ask yourself 3 questions:
🔹 1. Does the project solve a real-world problem? 🔹 2. Is its trading volume increasing? 🔹 3. Is the price rising because of real demand or just hype?
💡 Remember: A low-priced coin is NOT necessarily a cheap investment!
⚠️ Never invest money you cannot afford to lose. Always do your own research (DYOR).
🔥 YOUR TURN!
If you could choose ONE crypto to research for the next 12 months, which would it be?
₿ Bitcoin (BTC) Ξ Ethereum (ETH) ◎ Solana (SOL)
👇 Comment your choice and tell us WHY!
$BTC
#BinanceSquare #Bitcoin #Ethereum #solana #CryptoEducation
94

🚨 The Smart Money Question Nobody Asks!
Everyone wants to know: “Which coin will pump next?” 📈
But smart crypto investors ask a different question:
🔹 What problem does this project solve?
🔹 Is the community growing naturally?
🔹 Is the token's utility real?
🔹 What are the risks if the hype disappears?
Hype can attract attention. Real utility can build long-term value. 💡
Never buy just because a coin is trending. Do your own research, manage your risk, and avoid investing money you cannot afford to lose.
👇 Your turn: What matters most to you when researching a crypto project?
A) Technology
B) Community
C) Tokenomics
D) Market momentum
Share your answer in the comments! Let's learn together. 🚀
#BinanceSquare #CryptoEducation #DYOR $BTC
{spot}(BTCUSDT)
#Bitcoin
🚨 The Smart Money Question Nobody Asks!
Everyone wants to know: “Which coin will pump next?” 📈
But smart crypto investors ask a different question:
🔹 What problem does this project solve?
🔹 Is the community growing naturally?
🔹 Is the token's utility real?
🔹 What are the risks if the hype disappears?
Hype can attract attention. Real utility can build long-term value. 💡
Never buy just because a coin is trending. Do your own research, manage your risk, and avoid investing money you cannot afford to lose.
👇 Your turn: What matters most to you when researching a crypto project?
A) Technology
B) Community
C) Tokenomics
D) Market momentum
Share your answer in the comments! Let's learn together. 🚀
#BinanceSquare #CryptoEducation #DYOR $BTC
#Bitcoin

1
77


Статья
🚨 5 Crypto Trading Mistakes Beginners Must Avoid!Many people enter the crypto market hoping to make profits, but one small mistake can lead to big losses. 📉
If you're new to crypto, understanding these 5 common mistakes can help you make more informed decisions. 👇
1️⃣ Buying Because of FOMO
When a coin pumps, many traders buy out of fear of missing out. But prices can reverse at any time. Always research before entering a trade.
2️⃣ Using Too Much Leverage
Leverage can amplify both profits and losses. Even a small market move can liquidate a highly leveraged position.
3️⃣ Ignoring Risk Management
Never focus only on how much you could earn. Understand how much you could lose, and avoid risking money you cannot afford to lose.
4️⃣ Following Hype Without Research
A trending coin isn't automatically a good investment. Check its utility, tokenomics, liquidity, development activity, and potential risks.
5️⃣ Letting Emotions Control Decisions
Fear and greed often lead to impulsive trading. Having a clear plan can help you avoid emotional decisions.
💡 Remember: Crypto offers opportunities, but it also carries significant risks. Education and discipline matter more than chasing quick profits.
🔥 Let's discuss!
Which mistake do you think causes the most losses for beginners: FOMO, excessive leverage, or emotional trading?
Share your thoughts in the comments! 👇
#cryptoeducation #BinanceSquare #bitcoin #cryptotrading #RiskManagement
🚨 5 Crypto Trading Mistakes Beginners Must Avoid!
Many people enter the crypto market hoping to make profits, but one small mistake can lead to big losses. 📉
If you're new to crypto, understanding these 5 common mistakes can help you make more informed decisions. 👇
1️⃣ Buying Because of FOMO
When a coin pumps, many traders buy out of fear of missing out. But prices can reverse at any time. Always research before entering a trade.
2️⃣ Using Too Much Leverage
Leverage can amplify both profits and losses. Even a small market move can liquidate a highly leveraged position.
3️⃣ Ignoring Risk Management
Never focus only on how much you could earn. Understand how much you could lose, and avoid risking money you cannot afford to lose.
4️⃣ Following Hype Without Research
A trending coin isn't automatically a good investment. Check its utility, tokenomics, liquidity, development activity, and potential risks.
5️⃣ Letting Emotions Control Decisions
Fear and greed often lead to impulsive trading. Having a clear plan can help you avoid emotional decisions.
💡 Remember: Crypto offers opportunities, but it also carries significant risks. Education and discipline matter more than chasing quick profits.
🔥 Let's discuss!
Which mistake do you think causes the most losses for beginners: FOMO, excessive leverage, or emotional trading?
Share your thoughts in the comments! 👇
#cryptoeducation #BinanceSquare #bitcoin #cryptotrading #RiskManagement
2
174

·
--
Падение
Хранение $BNB 0.3 USDT
{spot}(BTCUSDT)
🚀 Crypto Portfolio Strategy 2026: Why DCA (Dollar-Cost Averaging) is the Smartest Move for Long-Term Investors!
Post Body:
In the fast-paced world of cryptocurrency, volatility is guaranteed. Prices pump, prices dump, and emotions often take over. That is where DCA (Dollar-Cost Averaging) comes in as a game-changer for disciplined investors.
Instead of trying to time the market—which even the pros rarely get right—DCA involves investing a fixed amount of capital at regular intervals, regardless of whether the market is up or down.
Here is why this strategy works wonders:
Removes Emotion from Trading: FOMO (Fear of Missing Out) and panic selling destroy more portfolios than bad projects. DCA keeps your strategy systematic and stress-free.
Lowers Average Cost: When prices drop, your fixed amount buys more shares/tokens, automatically reducing your overall average entry price.
Perfect for Long-Term Growth: Ideal for building positions in strong, fundamental assets over a 5 to 10-year horizon without worrying about daily chart fluctuations.
💡 Pro Tip: Combine a disciplined DCA approach with thorough fundamental research (DYOR) to build a resilient portfolio.
What is your favorite accumulation strategy during market dips? Let’s discuss in the comments below! 👇
Tags / Hashtags:
#BinanceSquare #CryptoTrading #DCA #InvestingTips #CryptoEducation
$BTC
$BNB
12
·
--
Beginner tip 💡 Set your stop-loss before you enter, not after.
Once a trade is open, your head starts bargaining. "It'll come back." "Just a bit lower." That's how a small loss turns into a big one.
Before you hit Buy:
✅ Pick the price where your idea is wrong
✅ Size the trade so that loss is one you can live with (many traders cap it at 1-2% of the account)
✅ Place the stop-loss order right away, not "later"
A stop isn't a guarantee. In a fast move price can slip past it. Still, having one beats staring at a red screen hoping.
Do you set your stop first, or wait and see? 👇
Not financial advice.
#cryptotrading #cryptoeducation #RiskManagement #Binance
6

Статья
📚Crypto Education: 7 Smart Rules EveryBeginner Should Know! 🚀The crypto market offers opportunities, but success requires knowledge, patience, and discipline. 💡
1️⃣ Learn Before You Invest 📖
Understand Bitcoin, Ethereum, blockchain technology, and how crypto markets work before making any financial decisions.
2️⃣ Never Invest Blindly ⚠️
Research a project's utility, team, tokenomics, and long-term potential. Never buy a coin just because someone says it will pump.
3️⃣ Manage Your Risk 🛡️
Only use money you can afford to lose. Crypto prices can change rapidly, and no profit is guaranteed.
4️⃣ Avoid FOMO 🧠
When a coin suddenly pumps, don't rush to buy. Always do your own research and make decisions calmly.
5️⃣ Protect Your Assets 🔐
Use strong passwords, enable two-factor authentication, and never share your passwords or wallet recovery phrases.
6️⃣ Think Long-Term 🌱
Building knowledge is more valuable than chasing every market movement. Patience and consistency can help you become a more informed crypto participant.
7️⃣ DYOR — Do Your Own Research 🔍
Learn to analyze projects independently instead of blindly following influencers or social media predictions.
🔥 Remember: In crypto, protecting your capital and improving your knowledge should always come before chasing profits.
💬 Question for the community: What is the most important crypto lesson you have learned?
❤️ Like | 🔁 Share | 💬 Comment | ➕ Follow for more crypto education!
Disclaimer: This content is for educational purposes only and is not financial advice. Always do your own research before making financial decisions.
$BTC $BNB $ETH
#cryptoeducation #BinanceSquare #bitcoin #blockchain #dyor
📚Crypto Education: 7 Smart Rules EveryBeginner Should Know! 🚀
The crypto market offers opportunities, but success requires knowledge, patience, and discipline. 💡
1️⃣ Learn Before You Invest 📖
Understand Bitcoin, Ethereum, blockchain technology, and how crypto markets work before making any financial decisions.
2️⃣ Never Invest Blindly ⚠️
Research a project's utility, team, tokenomics, and long-term potential. Never buy a coin just because someone says it will pump.
3️⃣ Manage Your Risk 🛡️
Only use money you can afford to lose. Crypto prices can change rapidly, and no profit is guaranteed.
4️⃣ Avoid FOMO 🧠
When a coin suddenly pumps, don't rush to buy. Always do your own research and make decisions calmly.
5️⃣ Protect Your Assets 🔐
Use strong passwords, enable two-factor authentication, and never share your passwords or wallet recovery phrases.
6️⃣ Think Long-Term 🌱
Building knowledge is more valuable than chasing every market movement. Patience and consistency can help you become a more informed crypto participant.
7️⃣ DYOR — Do Your Own Research 🔍
Learn to analyze projects independently instead of blindly following influencers or social media predictions.
🔥 Remember: In crypto, protecting your capital and improving your knowledge should always come before chasing profits.
💬 Question for the community: What is the most important crypto lesson you have learned?
❤️ Like | 🔁 Share | 💬 Comment | ➕ Follow for more crypto education!
Disclaimer: This content is for educational purposes only and is not financial advice. Always do your own research before making financial decisions.
$BTC $BNB $ETH
#cryptoeducation #BinanceSquare #bitcoin #blockchain #dyor
1
86

·
--
📚 Crypto Education — Breakouts
🚀 A move above resistance is not automatically a confirmed breakout.
📊 Traders often watch:
🟢 Volume expansion
🟢 Candle close
🟢 Retest of resistance
⚡ Momentum
🔎 Higher-timeframe structure
⚠️ Weak volume can increase the chance of a false breakout.
🤔 What confirmation do you wait for?
#CryptoEducation #Binance #Trading #Breakout
31
·
--
🧐 Myth vs Fact
❌ Myth: "If a coin is listed on a big exchange, it's a safe bet."
✅ Fact: A listing means a token passed a review. It does NOT mean the price can only go up.
Listed coins can still:
📉 drop 50%+ in a bear market
🔓 face big token unlocks that add new supply
😴 lose attention once the hype fades
Before you buy anything, check:
1️⃣ What the project actually does
2️⃣ Circulating vs max supply (and the unlock schedule)
3️⃣ Real trading volume, not just the price
A listing is the start of your research, not the end of it. DYOR, not financial advice.
What's the first thing you check before buying a new coin? 👇
#CryptoEducation #cryptotrading #Binance #crypto
2

·
--
Падение
🚨 GOOGLE CLOUD IS ENTERING CRYPTO CUSTODY — WHY IT MATTERS
Crypto isn't just about buying Bitcoin ($BTC ) and hoping the price goes up.
🔐 What is crypto custody?
It's the technology and process used to securely store and manage digital assets.
Google Cloud is testing an institutional custody service using Multi-Party Computation (MPC) technology.
🧠 Why does this matter?
✅ Helps institutions manage digital assets
✅ Can reduce risks associated with a single private key
✅ Could support wider institutional adoption
⚠️ Better security technology doesn't eliminate every risk, and institutional adoption doesn't guarantee higher crypto prices.
👇 YOUR TAKE:
Would stronger custody technology make you more confident about crypto?
YES or NO — and why?
#crypto #bitcoin #BTC #blockchain #cryptoeducation
210

Why Smart Crypto Investors Focus on Risk Management
?The cryptocurrency market offers exciting opportunities, but it also comes with significant risks. Many beginners focus only on making profits, while experienced market participants understand the importance of protecting their capital.
1. Never Follow Hype Blindly
A coin trending on social media is not automatically a good investment. Before making a decision, research the project's purpose, technology, token supply, and potential risks.
2. Understand Market Volatility
Crypto prices can move sharply within a short period. A sudden pump may be followed by a correction, so investors should avoid emotional decisions.
3. Be Careful With Leverage
Futures trading can magnify both profits and losses. High leverage can lead to liquidation even when the market moves only slightly against a position. Beginners should understand these risks before trading.
4. Protect Your Assets
Use strong account security, enable two-factor authentication, and never share passwords or verification codes. Security is an essential part of responsible crypto participation.
Final Thoughts
Success in crypto is not about winning every trade. It is about learning continuously, managing risk, and making informed decisions instead of following hype.
Discussion: What is the most important risk management rule every crypto beginner should know?
#CryptoEducation #RiskManagement #Bitcoin #BinanceSquare
Why Smart Crypto Investors Focus on Risk Management ?
The cryptocurrency market offers exciting opportunities, but it also comes with significant risks. Many beginners focus only on making profits, while experienced market participants understand the importance of protecting their capital.
1. Never Follow Hype Blindly
A coin trending on social media is not automatically a good investment. Before making a decision, research the project's purpose, technology, token supply, and potential risks.
2. Understand Market Volatility
Crypto prices can move sharply within a short period. A sudden pump may be followed by a correction, so investors should avoid emotional decisions.
3. Be Careful With Leverage
Futures trading can magnify both profits and losses. High leverage can lead to liquidation even when the market moves only slightly against a position. Beginners should understand these risks before trading.
4. Protect Your Assets
Use strong account security, enable two-factor authentication, and never share passwords or verification codes. Security is an essential part of responsible crypto participation.
Final Thoughts
Success in crypto is not about winning every trade. It is about learning continuously, managing risk, and making informed decisions instead of following hype.
Discussion: What is the most important risk management rule every crypto beginner should know?
#CryptoEducation #RiskManagement #Bitcoin #BinanceSquare
21
Войдите, чтобы посмотреть больше материала
Присоединяйтесь к пользователям криптовалют по всему миру на Binance Square
⚡️ Получайте новейшую и полезную информацию о криптоактивах.
💬 Нам доверяет крупнейшая в мире криптобиржа.
👍 Получите достоверные аналитические данные от верифицированных создателей контента.
Эл. почта/номер телефона
В тренде
1
#FedWatch
Просмотров: 16.3M
39,205 обсуждают
2
#EarningsSeason
Просмотров: 6.4M
31,924 обсуждают
3
#USMidtermElections
Просмотров: 26,759
531 обсуждают
4
#BitcoinDropsBelow$80K
Просмотров: 18,892
85 обсуждают
5
#BoEOpensConsultationOnTokenizedCollateralForClearing
Просмотров: 255
18 обсуждают
6
#BrazilCryptoExchangesMustApplyForLicensesByFriday
Просмотров: 19,827
447 обсуждают
7
#ICEPartnersWithTradeXYZToBringPerpetualContractsToUS
Просмотров: 661
14 обсуждают
8
#SolidusLabsReportsSuspected$170MSpoofingOnHyperliquidOilContracts
Просмотров: 1,428
24 обсуждают
9
#StanDruckenmillerBecomesInvestorInTradeXYZ
Просмотров: 15,895
405 обсуждают
10
#RussiaProposedNonCustodialWalletLimitsExcludeIntlSettlements
Просмотров: 1,786
39 обсуждают