

Mastering Market Moves with jacob
769 Публикации

Mastering Market Moves with jacob
Отправить жалобу
Заблокировать пользователя
Sharing deep insights market knowledge news proven trading strategies and indicators
Случайный трейдер
2.8 г
8.2K+ подписок(и/а)
3.3K+ подписчиков(а)
1.9K+ понравилось
Посты
Все
Цитирования
Видео
PINNED
🇺🇸 U.S INFLATION IS UP TO 3% LOWER THAN EXPECTED YOU KNOW WHAT HAPPENS NEXT #CPIWatch #Inflation #APRBinanceTGE #MarketRebound
🇺🇸 U.S INFLATION IS UP TO 3% LOWER THAN EXPECTED YOU KNOW WHAT HAPPENS NEXT #CPIWatch #Inflation #APRBinanceTGE #MarketRebound
3
1
48
20.8k
PINNED
SEPTEMBER CPI REPORT INFLASTION LOWER THAN EXPECTED
#Inflation #CPIWatch #MarketRebound #BitcoinETFNetInflows
SEPTEMBER CPI REPORT INFLASTION LOWER THAN EXPECTED
#Inflation #CPIWatch #MarketRebound #BitcoinETFNetInflows
#Inflation #CPIWatch #MarketRebound #BitcoinETFNetInflows
9
3.5k
Crypto News Digest: Datavault AI Loses BTC Access, $BTC Nears $81K Before Fed Rate DecisionHere are today's top stories in crypto:
1. Datavault AI Stock Plunges 50%
• What happened: Corporate treasury firm Datavault AI saw its stock crash 50% after reporting it can no longer access its $BTC reserves.
• Why it matters: Highlights critical operational and custody risks for public corporations holding cryptocurrency reserves.
• Source: CoinDesk
2. Bitcoin Nears $81,000 Ahead of Federal Reserve Decision
• What happened: $BTC approached $81,000 as market participants await the Fed's upcoming interest rate policy decision.
• Why it matters: Macroeconomic policy shifts continue to serve as a primary catalyst for market liquidity.
• Source: CoinDesk
3. Crypto Giants Increase $BTC and $ETH Holdings
• What happened: Major institutional players are expanding their long-term positions in Bitcoin and Ethereum.
• Why it matters: Indicates strong institutional conviction despite broader macroeconomic uncertainty.
• Source: Yahoo Finance
#CryptoNews #Bitcoin #Ethereum
Crypto News Digest: Datavault AI Loses BTC Access, $BTC Nears $81K Before Fed Rate Decision
Here are today's top stories in crypto:
1. Datavault AI Stock Plunges 50%
• What happened: Corporate treasury firm Datavault AI saw its stock crash 50% after reporting it can no longer access its $BTC reserves.
• Why it matters: Highlights critical operational and custody risks for public corporations holding cryptocurrency reserves.
• Source: CoinDesk
2. Bitcoin Nears $81,000 Ahead of Federal Reserve Decision
• What happened: $BTC approached $81,000 as market participants await the Fed's upcoming interest rate policy decision.
• Why it matters: Macroeconomic policy shifts continue to serve as a primary catalyst for market liquidity.
• Source: CoinDesk
3. Crypto Giants Increase $BTC and $ETH Holdings
• What happened: Major institutional players are expanding their long-term positions in Bitcoin and Ethereum.
• Why it matters: Indicates strong institutional conviction despite broader macroeconomic uncertainty.
• Source: Yahoo Finance
#CryptoNews #Bitcoin #Ethereum
77
CRYPTO MARKET SNAPSHOT
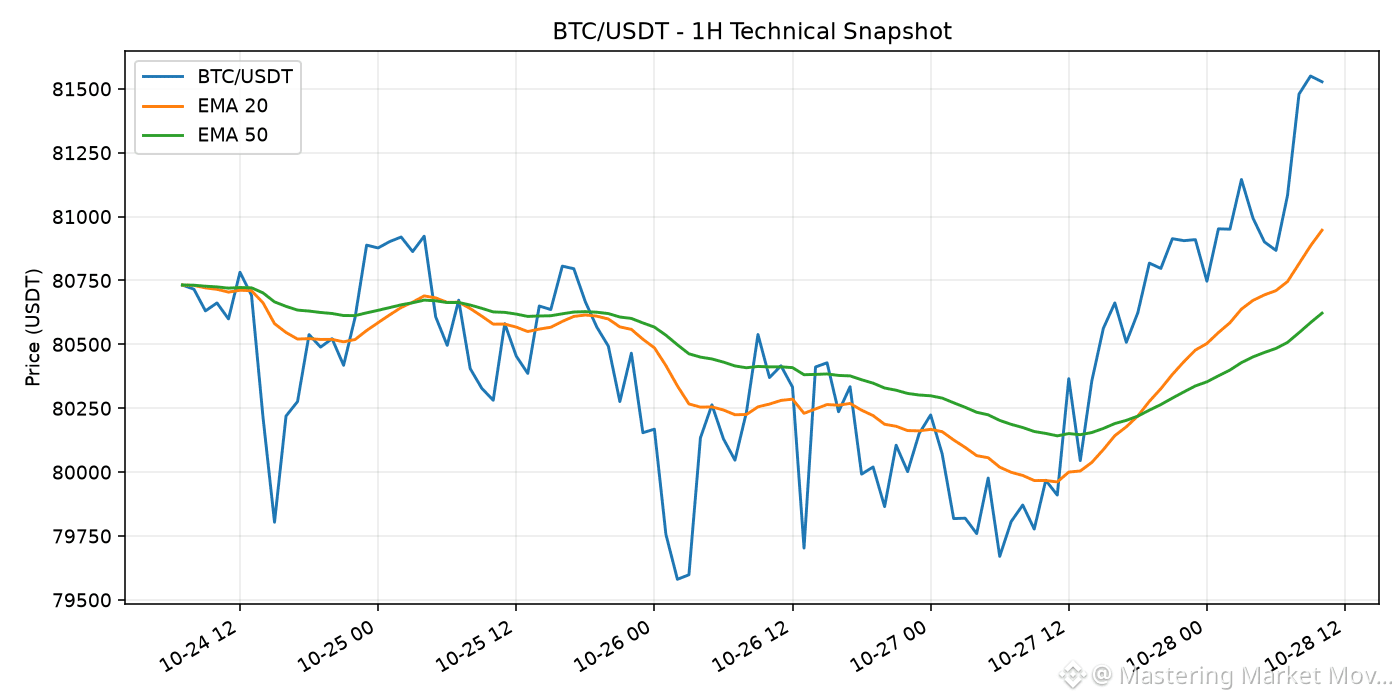
Data timestamp: 2026-10-28 10:06 UTC. BTC/USDT is $81,527.60 (+2.35% over 24h). Market direction can vary by asset and timeframe, so review liquidity and your own risk limits before making decisions.
Watchlist: $BTC $ETH
#CryptoMarket #Bitcoin #Ethereum
Educational commentary only; not financial advice.
1
73
HIGH-VOLUME ALTCOIN WATCH
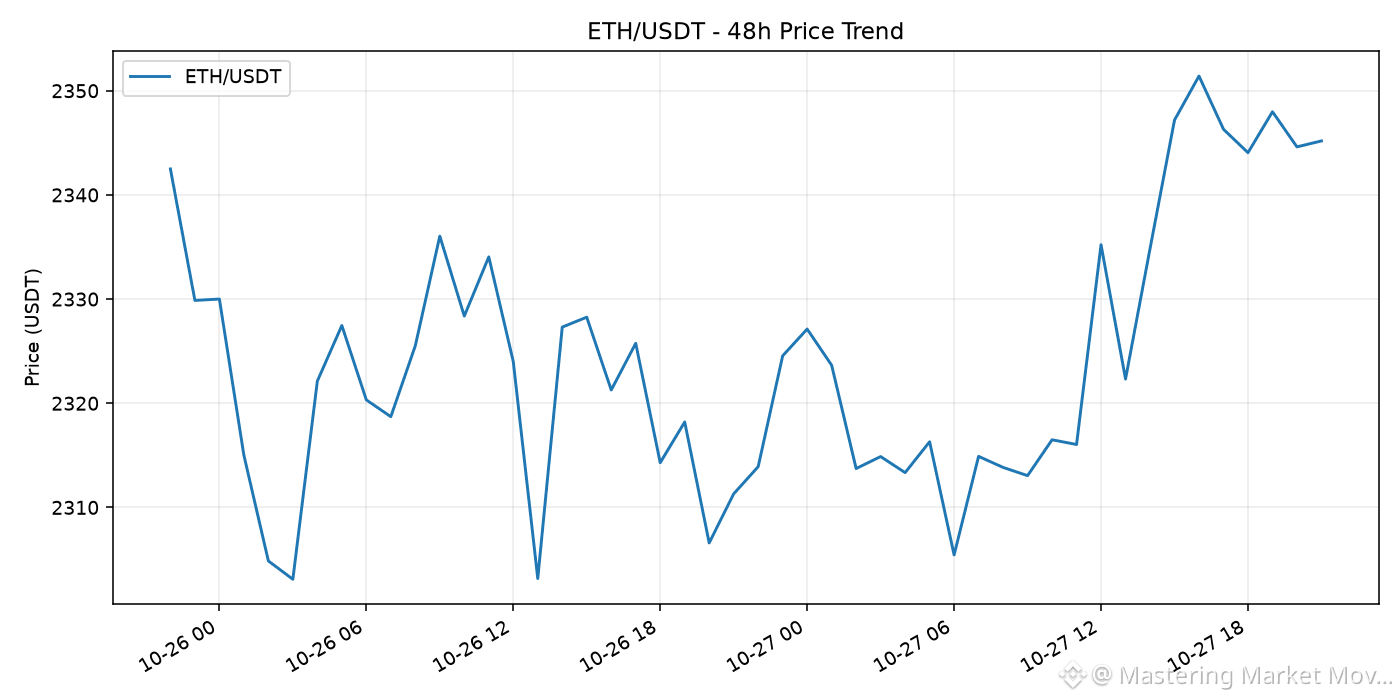
Snapshot: 2026-10-27 21:02 UTC. $ETH/USDT is among the highest-volume eligible USDT spot pairs in this snapshot. Last price: $2,345.18; 24h change: +1.47%; 24h quote volume: $478,614,382.
High volume signals activity, not guaranteed continuation. Check the chart, official announcements and downside scenarios independently.
$ETH #Crypto #Altcoins #MarketAnalysis
Educational commentary only; not financial advice.
HIGH-VOLUME ALTCOIN WATCH
Snapshot: 2026-10-27 21:02 UTC. $ETH /USDT is among the highest-volume eligible USDT spot pairs in this snapshot. Last price: $2,345.18; 24h change: +1.47%; 24h quote volume: $478,614,382.
High volume signals activity, not guaranteed continuation. Check the chart, official announcements and downside scenarios independently.
$ETH #Crypto #Altcoins #MarketAnalysis
Educational commentary only; not financial advice.
62
Demystifying Market Depth: How to Read Order Books Beyond the Candlestick ChartWhen most market participants look at a cryptocurrency exchange, their attention is immediately drawn to candlestick charts. Candlesticks provide a vivid historical narrative of where price has traveled, highlighting recent highs, lows, and volatility. However, relying solely on historical price action means looking in the rearview mirror. To understand where price might experience immediate friction, acceleration, or resistance, market participants must learn to evaluate market depth.
Market depth offers a real-time window into the structural supply and demand dynamics of a financial asset. It reveals the underlying order book mechanics that power central limit order books (CLOBs) across digital asset exchanges. For intermediate traders and crypto enthusiasts looking to mature beyond basic technical analysis, mastering market depth is an essential step toward understanding liquidity, execution quality, and market microstructure.
---
### What Is Market Depth and How Does the Order Book Work?
At its core, market depth refers to the exchange’s ability to absorb relatively large market orders without causing significant price fluctuations. It measures the total volume of open, unexecuted limit orders resting on an exchange’s order book at various price points above and below the current market price.
To understand market depth, one must first break down the mechanics of the order book, which consists of two primary sides:
1. **The Bid Side (Buyers):** Represents all resting limit orders from participants willing to buy the asset at a specified price or lower. The highest bid price is known as the "best bid."
2. **The Ask or Offer Side (Sellers):** Represents all resting limit orders from participants willing to sell the asset at a specified price or higher. The lowest ask price is known as the "best ask."
The difference between the best bid and the best ask is called the **bid-ask spread**. In highly liquid assets like Bitcoin or Ethereum on major exchanges, this spread is often razor-thin—sometimes just a fraction of a cent or a single tick size. In less liquid altcoins, the spread can widen significantly, exposing traders to higher execution costs.
Market depth measures how much volume is waiting in the wings on both sides of the spread. When an exchange advertises a "1% market depth of $5 million," it means that $5 million worth of capital in limit orders is resting within 1% above and below the mid-market price.
---
### Visualizing Market Depth: The Depth Chart
Most major crypto exchanges provide a graphical visualization known as the **Depth Chart**. This chart plots cumulative order volume on the vertical axis (Y-axis) against price on the horizontal axis (X-axis).
- **The Green Area (Bids):** Slopes downward to the left of the current market price, accumulating all buy orders.
- **The Red Area (Asks):** Slopes upward to the right of the current market price, accumulating all sell orders.
When examining a depth chart, you will frequently notice sharp vertical steepenings in the green or red visualization. These are commonly referred to as **buy walls** or **sell walls**.
- **A Buy Wall** indicates a massive concentration of resting buy limit orders at a specific price level. Graphically, it creates a steep vertical "step" on the green side.
- **A Sell Wall** indicates a heavy concentration of resting sell limit orders, forming a steep vertical "step" on the red side.
In theory, a large buy wall acts as structural support because market sellers must fill all the orders in that wall before price can drop further. Conversely, a sell wall acts as structural resistance because buyers must consume all the resting sell orders before price can move higher. However, as we will explore later, relying purely on visual walls can be deceptive.
---
### Slippage and Price Impact: A Practical Execution Scenario
Understanding market depth is practical, not just theoretical—it directly influences trade execution costs through a phenomenon known as **slippage**.
Slippage occurs when a market order executes at a price different from the expected price at the time the order was submitted. This happens because a market order immediately matches against the best available limit orders in the order book. If the volume of the market order exceeds the volume available at the best bid or ask, the order fills progressively through the book, taking less favorable prices until the full order size is satisfied.
#### A Concrete Example:
Imagine an investor wants to place a market buy order for 100 units of an asset. The current order book displays the following ask liquidity:
- **Level 1 (Best Ask):** 20 units available at $10.00
- **Level 2:** 30 units available at $10.10
- **Level 3:** 50 units available at $10.30
If the investor submits a market buy order for 100 units, the exchange matches the order sequentially:
1. 20 units fill at $10.00 ($200)
2. 30 units fill at $10.10 ($303)
3. 50 units fill at $10.30 ($515)
The total capital spent is $1,018, resulting in an average execution price of **$10.18 per unit**. Although the market price appeared to be $10.00 when the order was submitted, the size of the order relative to the order book's depth resulted in a 1.8% negative slippage.
In deep markets, absorbing a large order requires moving through minimal price tiers. In thin, illiquid markets, a modest order can sweep multiple price levels, causing severe price impact and unexpected losses.
---
### Deceptions in the Order Book: Spoofing and Iceberg Orders
While market depth provides valuable visibility, intermediate participants must recognize that the order book is an active, dynamic arena influenced by institutional traders, algorithmic bots, and high-frequency trading (HFT) firms. What you see is not always what gets executed.
#### 1. Spoofing
Spoofing is a manipulative tactic where large traders place substantial limit orders on the book with no intention of letting them execute. For instance, a trader wanting to drive prices up might place a massive visible buy wall below the current price. Retail traders interpret this wall as strong support and begin buying ahead of it. Once the price bounces upward, the spoofer cancels their massive buy order and sells their original inventory into the artificially generated momentum.
#### 2. Iceberg Orders
Institutional participants looking to buy or sell large allocations usually avoid placing massive visible limit orders because doing so alerts the market and moves prices against them. Instead, they utilize **iceberg orders**. An iceberg order splits a massive order into small visible tranches. As soon as one small tranche fills, another automatically populates at the same or adjacent price level. Consequently, an apparently thin price level on the depth chart might actually contain vast hidden liquidity.
#### 3. Order Book Liquidity Is Dynamic
Limit orders are non-binding commitments until executed. Algorithmic software can pull thousands of orders from the book in milliseconds during sudden high-volatility events, causing depth to evaporate precisely when it is needed most.
---
### How to Use Market Depth Responsibly in Strategy
To integrate market depth analysis effectively without falling into common traps, intermediate traders should observe the following guidelines:
1. **Assess Depth Before Position Sizing:** Before placing large trades, especially in secondary or tertiary altcoins, calculate the available liquidity within 1% to 2% of the mid-market price to estimate potential slippage.
2. **Use Limit Orders Wisely:** If market depth is shallow, utilize limit orders or algorithmic execution strategies (such as TWAP—Time-Weighted Average Price) to enter and exit positions gradually, rather than using market orders that sweep the book.
3. **Cross-Reference with Volume Profiles:** Do not rely on resting order books in isolation. Compare current order book depth with historical volume profile tools (like Point of Control or Volume by Price) to verify whether resting order walls align with real historical trading activity.
4. **Beware of Single-Exchange Bias:** Order book depth on one exchange only reflects liquidity localized to that specific venue. Global liquidity is aggregated across multiple centralized platforms and decentralized liquidity pools.
---
### Risks, Limitations, and Final Thoughts
Market depth is a powerful lens into real-time exchange dynamics, but it is not a standalone crystal ball. Price movement in cryptocurrency markets is governed by a complex interplay of global macro factors, sudden news events, derivative liquidations, and cross-venue arbitrage.
Resting order book depth can disappear instantly during panic events or surge during consolidation. No indicator, including market depth, guarantees trading performance or eliminates financial risk. Traders should always employ strict risk management frameworks, including proper position sizing and predefined stop parameters, rather than relying blindly on apparent buy or sell support shown on a chart.
By moving beyond simple candlestick patterns and learning to evaluate order books critically, market participants gain a deeper appreciation for liquidity mechanics—enabling smarter execution, better risk control, and a clearer understanding of market reality.
#CryptoEducation #MarketDepth #TradingStrategy
Demystifying Market Depth: How to Read Order Books Beyond the Candlestick Chart
When most market participants look at a cryptocurrency exchange, their attention is immediately drawn to candlestick charts. Candlesticks provide a vivid historical narrative of where price has traveled, highlighting recent highs, lows, and volatility. However, relying solely on historical price action means looking in the rearview mirror. To understand where price might experience immediate friction, acceleration, or resistance, market participants must learn to evaluate market depth.
Market depth offers a real-time window into the structural supply and demand dynamics of a financial asset. It reveals the underlying order book mechanics that power central limit order books (CLOBs) across digital asset exchanges. For intermediate traders and crypto enthusiasts looking to mature beyond basic technical analysis, mastering market depth is an essential step toward understanding liquidity, execution quality, and market microstructure.
---
### What Is Market Depth and How Does the Order Book Work?
At its core, market depth refers to the exchange’s ability to absorb relatively large market orders without causing significant price fluctuations. It measures the total volume of open, unexecuted limit orders resting on an exchange’s order book at various price points above and below the current market price.
To understand market depth, one must first break down the mechanics of the order book, which consists of two primary sides:
1. **The Bid Side (Buyers):** Represents all resting limit orders from participants willing to buy the asset at a specified price or lower. The highest bid price is known as the "best bid."
2. **The Ask or Offer Side (Sellers):** Represents all resting limit orders from participants willing to sell the asset at a specified price or higher. The lowest ask price is known as the "best ask."
The difference between the best bid and the best ask is called the **bid-ask spread**. In highly liquid assets like Bitcoin or Ethereum on major exchanges, this spread is often razor-thin—sometimes just a fraction of a cent or a single tick size. In less liquid altcoins, the spread can widen significantly, exposing traders to higher execution costs.
Market depth measures how much volume is waiting in the wings on both sides of the spread. When an exchange advertises a "1% market depth of $5 million," it means that $5 million worth of capital in limit orders is resting within 1% above and below the mid-market price.
---
### Visualizing Market Depth: The Depth Chart
Most major crypto exchanges provide a graphical visualization known as the **Depth Chart**. This chart plots cumulative order volume on the vertical axis (Y-axis) against price on the horizontal axis (X-axis).
- **The Green Area (Bids):** Slopes downward to the left of the current market price, accumulating all buy orders.
- **The Red Area (Asks):** Slopes upward to the right of the current market price, accumulating all sell orders.
When examining a depth chart, you will frequently notice sharp vertical steepenings in the green or red visualization. These are commonly referred to as **buy walls** or **sell walls**.
- **A Buy Wall** indicates a massive concentration of resting buy limit orders at a specific price level. Graphically, it creates a steep vertical "step" on the green side.
- **A Sell Wall** indicates a heavy concentration of resting sell limit orders, forming a steep vertical "step" on the red side.
In theory, a large buy wall acts as structural support because market sellers must fill all the orders in that wall before price can drop further. Conversely, a sell wall acts as structural resistance because buyers must consume all the resting sell orders before price can move higher. However, as we will explore later, relying purely on visual walls can be deceptive.
---
### Slippage and Price Impact: A Practical Execution Scenario
Understanding market depth is practical, not just theoretical—it directly influences trade execution costs through a phenomenon known as **slippage**.
Slippage occurs when a market order executes at a price different from the expected price at the time the order was submitted. This happens because a market order immediately matches against the best available limit orders in the order book. If the volume of the market order exceeds the volume available at the best bid or ask, the order fills progressively through the book, taking less favorable prices until the full order size is satisfied.
#### A Concrete Example:
Imagine an investor wants to place a market buy order for 100 units of an asset. The current order book displays the following ask liquidity:
- **Level 1 (Best Ask):** 20 units available at $10.00
- **Level 2:** 30 units available at $10.10
- **Level 3:** 50 units available at $10.30
If the investor submits a market buy order for 100 units, the exchange matches the order sequentially:
1. 20 units fill at $10.00 ($200)
2. 30 units fill at $10.10 ($303)
3. 50 units fill at $10.30 ($515)
The total capital spent is $1,018, resulting in an average execution price of **$10.18 per unit**. Although the market price appeared to be $10.00 when the order was submitted, the size of the order relative to the order book's depth resulted in a 1.8% negative slippage.
In deep markets, absorbing a large order requires moving through minimal price tiers. In thin, illiquid markets, a modest order can sweep multiple price levels, causing severe price impact and unexpected losses.
---
### Deceptions in the Order Book: Spoofing and Iceberg Orders
While market depth provides valuable visibility, intermediate participants must recognize that the order book is an active, dynamic arena influenced by institutional traders, algorithmic bots, and high-frequency trading (HFT) firms. What you see is not always what gets executed.
#### 1. Spoofing
Spoofing is a manipulative tactic where large traders place substantial limit orders on the book with no intention of letting them execute. For instance, a trader wanting to drive prices up might place a massive visible buy wall below the current price. Retail traders interpret this wall as strong support and begin buying ahead of it. Once the price bounces upward, the spoofer cancels their massive buy order and sells their original inventory into the artificially generated momentum.
#### 2. Iceberg Orders
Institutional participants looking to buy or sell large allocations usually avoid placing massive visible limit orders because doing so alerts the market and moves prices against them. Instead, they utilize **iceberg orders**. An iceberg order splits a massive order into small visible tranches. As soon as one small tranche fills, another automatically populates at the same or adjacent price level. Consequently, an apparently thin price level on the depth chart might actually contain vast hidden liquidity.
#### 3. Order Book Liquidity Is Dynamic
Limit orders are non-binding commitments until executed. Algorithmic software can pull thousands of orders from the book in milliseconds during sudden high-volatility events, causing depth to evaporate precisely when it is needed most.
---
### How to Use Market Depth Responsibly in Strategy
To integrate market depth analysis effectively without falling into common traps, intermediate traders should observe the following guidelines:
1. **Assess Depth Before Position Sizing:** Before placing large trades, especially in secondary or tertiary altcoins, calculate the available liquidity within 1% to 2% of the mid-market price to estimate potential slippage.
2. **Use Limit Orders Wisely:** If market depth is shallow, utilize limit orders or algorithmic execution strategies (such as TWAP—Time-Weighted Average Price) to enter and exit positions gradually, rather than using market orders that sweep the book.
3. **Cross-Reference with Volume Profiles:** Do not rely on resting order books in isolation. Compare current order book depth with historical volume profile tools (like Point of Control or Volume by Price) to verify whether resting order walls align with real historical trading activity.
4. **Beware of Single-Exchange Bias:** Order book depth on one exchange only reflects liquidity localized to that specific venue. Global liquidity is aggregated across multiple centralized platforms and decentralized liquidity pools.
---
### Risks, Limitations, and Final Thoughts
Market depth is a powerful lens into real-time exchange dynamics, but it is not a standalone crystal ball. Price movement in cryptocurrency markets is governed by a complex interplay of global macro factors, sudden news events, derivative liquidations, and cross-venue arbitrage.
Resting order book depth can disappear instantly during panic events or surge during consolidation. No indicator, including market depth, guarantees trading performance or eliminates financial risk. Traders should always employ strict risk management frameworks, including proper position sizing and predefined stop parameters, rather than relying blindly on apparent buy or sell support shown on a chart.
By moving beyond simple candlestick patterns and learning to evaluate order books critically, market participants gain a deeper appreciation for liquidity mechanics—enabling smarter execution, better risk control, and a clearer understanding of market reality.
#CryptoEducation #MarketDepth #TradingStrategy
67
BTC/USDT TECHNICAL CHECK - 1H
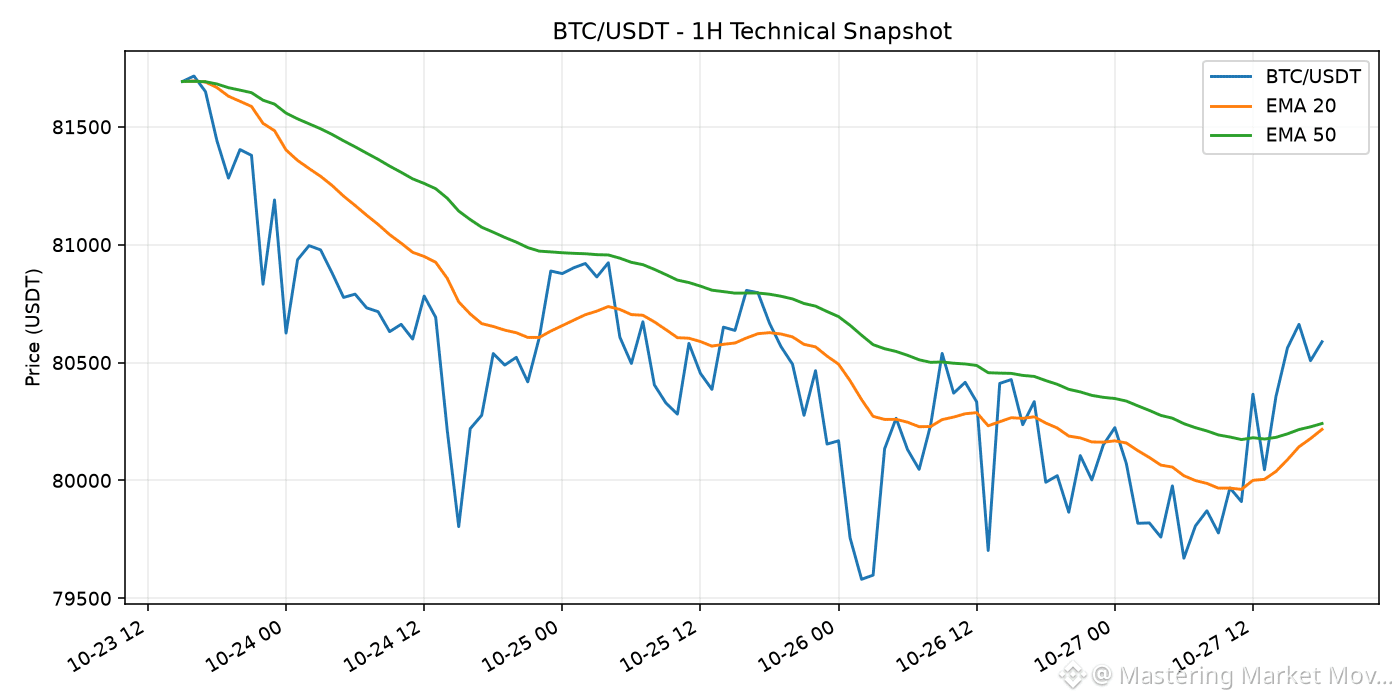
Snapshot: 2026-10-27 18:34 UTC. Latest close: $80,588.01. RSI(14): 65.4. EMA20 is below EMA50 on this snapshot. This is a momentum observation, not a standalone buy or sell signal. RSI can remain elevated or depressed during strong trends; confirm with price structure and risk management.
$BTC #Bitcoin #TechnicalAnalysis
Educational commentary only; not financial advice.
90
CRYPTO MARKET SNAPSHOT
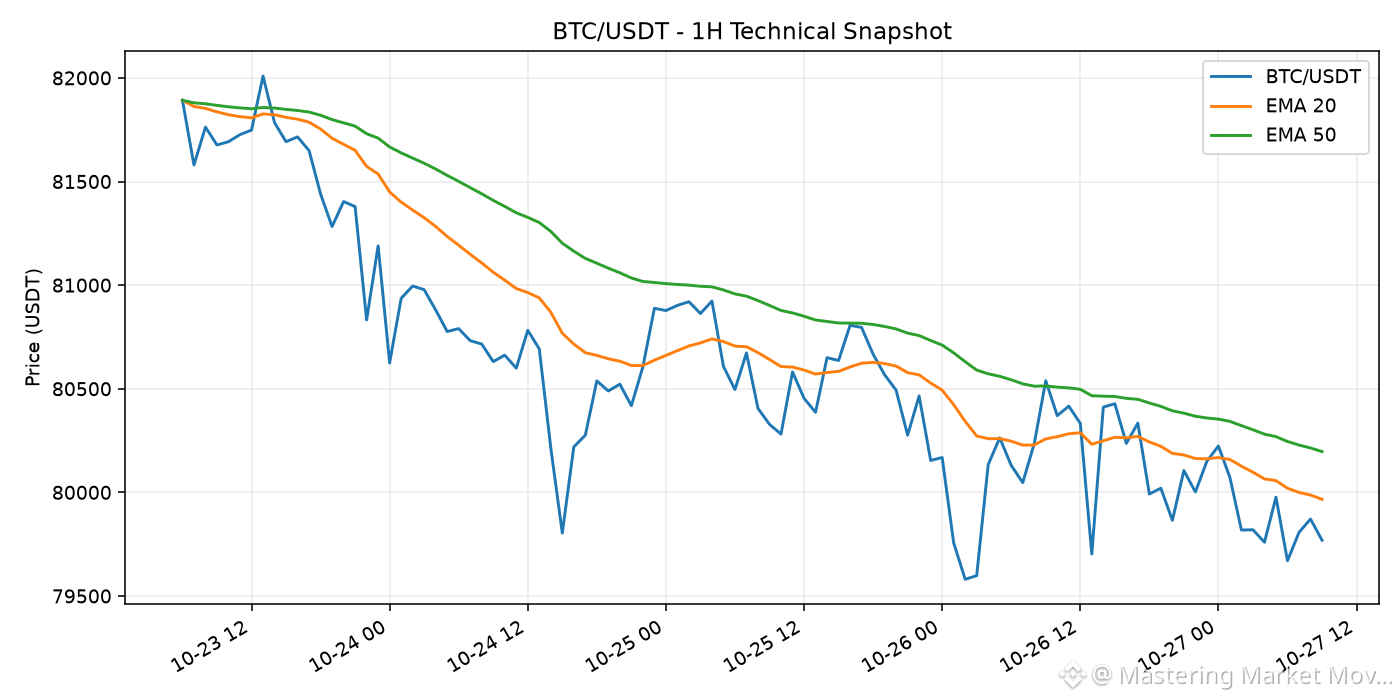
Data timestamp: 2026-10-27 09:24 UTC. BTC/USDT is $79,769.04 (-0.87% over 24h). Market direction can vary by asset and timeframe, so review liquidity and your own risk limits before making decisions.
Watchlist: $BTC $ETH
#CryptoMarket #Bitcoin #Ethereum
Educational commentary only; not financial advice.
87
HIGH-VOLUME ALTCOIN WATCH
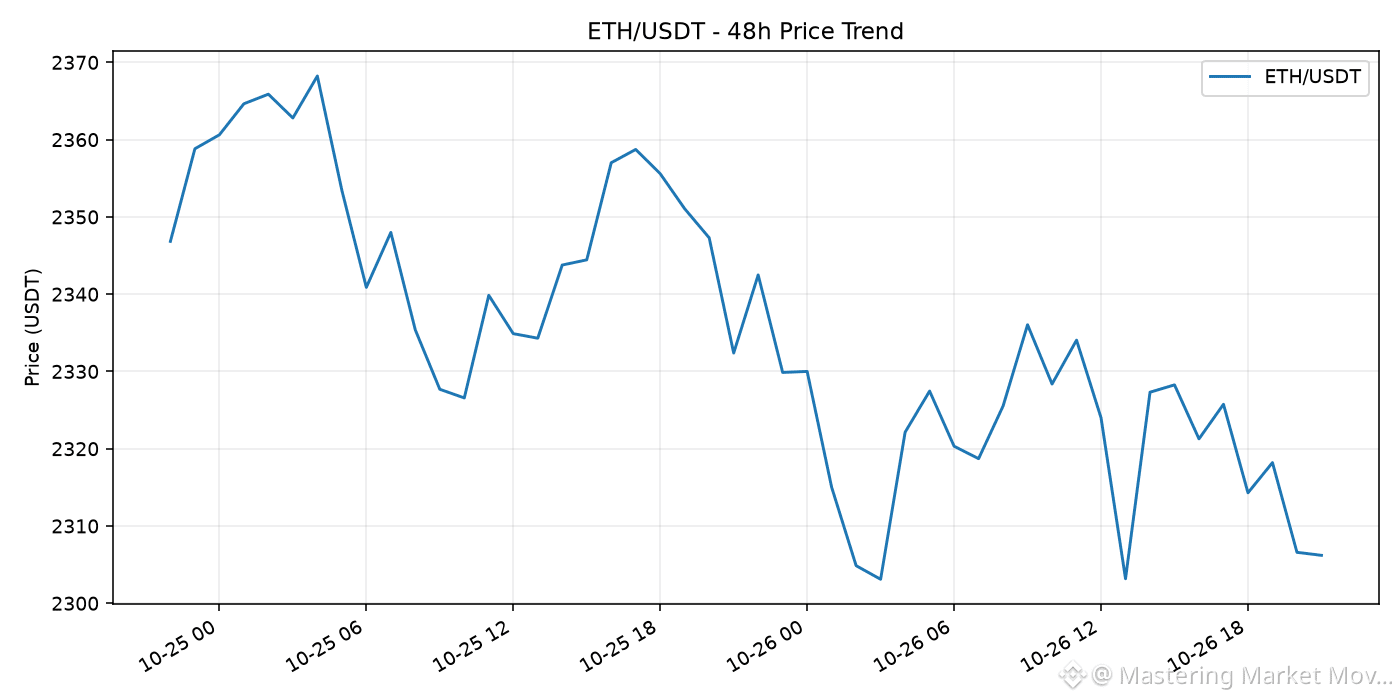
Snapshot: 2026-10-26 21:15 UTC. $ETH/USDT is among the highest-volume eligible USDT spot pairs in this snapshot. Last price: $2,306.09; 24h change: -1.63%; 24h quote volume: $478,502,306.
High volume signals activity, not guaranteed continuation. Check the chart, official announcements and downside scenarios independently.
$ETH #Crypto #Altcoins #MarketAnalysis
Educational commentary only; not financial advice.
HIGH-VOLUME ALTCOIN WATCH
Snapshot: 2026-10-26 21:15 UTC. $ETH /USDT is among the highest-volume eligible USDT spot pairs in this snapshot. Last price: $2,306.09; 24h change: -1.63%; 24h quote volume: $478,502,306.
High volume signals activity, not guaranteed continuation. Check the chart, official announcements and downside scenarios independently.
$ETH #Crypto #Altcoins #MarketAnalysis
Educational commentary only; not financial advice.
48
Demystifying Market Depth: How to Read Order Books and Manage Execution RiskWhen entering the cryptocurrency market, beginner traders often devote most of their time to analyzing candlestick charts and momentum indicators. While historical price patterns offer valuable insights into market sentiment, they only tell half the story. The price displayed on a standard chart represents the last completed trade—a historical footprint. It does not explicitly reveal where future buying or selling interest lies.
To understand true market supply and demand, intermediate traders must look beneath the surface of raw price charts and master the concept of market depth. Understanding market depth allows market participants to evaluate liquidity, anticipate short-term price resistance, accurately project execution costs, and mitigate hidden risks such as slippage.
---
### 1. The Core Architecture of Market Depth
At its core, market depth measures an exchange's ability to absorb large trade orders without causing significant price movements. Market depth is sustained by the order book—a continuously updating electronic ledger that matches buyers and sellers.
An order book consists of two main sides:
* **Bids (Buy Orders):** The list of active limit orders from buyers who wish to purchase an asset at a specified price or lower. Bids are arranged in descending order, with the highest buy offer sitting at the top of the bid column.
* **Asks or Offers (Sell Orders):** The list of active limit orders from sellers offering to sell an asset at a specified price or higher. Asks are arranged in ascending order, with the lowest sell offer sitting at the top of the ask column.
The difference between the highest bid price and the lowest ask price is known as the **bid-ask spread**.
In high-liquidity assets like Bitcoin or Ethereum on major exchanges, the bid-ask spread is typically negligible—often fractions of a cent or a fraction of a percent. This narrow spread indicates a highly efficient market with abundant active participants. Conversely, low-cap altcoins or assets listed on illiquid exchanges often exhibit wide spreads. A wide spread signifies lower liquidity, forcing traders to pay a premium when buying or accept a discount when selling.
---
### 2. Reading the Depth Chart: Visualizing Supply and Demand
Most modern exchange interfaces provide a visual representation of market depth alongside the order book text columns. This graph, commonly referred to as the **Depth Chart**, plots cumulative order volume on the vertical axis against asset price on the horizontal axis.
The depth chart is divided into two colored slopes:
* **Green Slope (Bids):** Represents the cumulative volume of buy orders sitting below the current market price.
* **Red Slope (Asks):** Represents the cumulative volume of sell orders sitting above the current market price.
#### Buy Walls and Sell Walls
When examining a depth chart, traders often notice steep vertical spikes along either side of the curve. These visual barriers are known as "walls."
* **Buy Wall:** A massive accumulation of limit buy orders concentrated at a specific price level. A substantial buy wall indicates strong support, as market sellers must consume all the volume in that wall before the price can decline further.
* **Sell Wall:** A massive accumulation of limit sell orders concentrated at a specific price level. A sell wall acts as heavy resistance, requiring buyers to absorb significant volume before the price can push higher.
While walls can represent genuine institutional interest or psychological price levels (such as round numbers like $50,000 or $100), traders must approach them with caution, as order books are dynamic and subject to strategic manipulation.
---
### 3. Practical Application: Calculating Slippage and Real Execution Costs
One of the most practical applications of market depth analysis is calculating **slippage**—the difference between the expected price of a trade and the price at which the trade is actually executed.
Slippage typically occurs when using market orders during periods of low market depth or high price volatility. A market order prioritizes execution speed over price, filling immediately against the best available limit orders in the order book.
#### A Walkthrough Calculation of Slippage
Imagine a trader wants to execute a market buy order for 5 units of an asset. The asset's last traded price is $1,000, leading the trader to assume the trade will cost roughly $5,000.
However, looking at the current ask side of the order book reveals thin liquidity:
* **Level 1 Ask:** 1 unit available at $1,001
* **Level 2 Ask:** 2 units available at $1,005
* **Level 3 Ask:** 2 units available at $1,010
When the trader submits a market buy order for 5 units, the exchange matches the order sequentially down the order book:
1. The first 1 unit fills at **$1,001** (Total: $1,001)
2. The next 2 units fill at **$1,005** (Total: $2,010)
3. The final 2 units fill at **$1,010** (Total: $2,020)
**Total Capital Spent:** $1,001 + $2,010 + $2,020 = **$5,031**
**Average Execution Price per Unit:** $5,031 / 5 = **$1,006.20**
Because the order book lacked sufficient depth at the top ask price, the trader experienced an average execution price $6.20 higher per unit than the lowest available ask. On large institutional orders or low-liquidity pairs, slippage can easily reach several percentage points, drastically impairing trade profitability.
---
### 4. Market Depth Distortions, Manipulation, and Risks
While market depth provides valuable insights, relying solely on static order book data introduces significant risks. Order books are fluid environments where orders can be placed, modified, or canceled within milliseconds.
#### Phantom Liquidity and Spoofing
Not all visible order book liquidity represents a genuine intention to trade. **Spoofing** occurs when a trader places large limit orders (buy or sell walls) with no intention of letting them fill. The goal is to create a false impression of market demand or supply, tricking other market participants into buying or selling ahead of the wall. Once price approaches the fake order, the spoofer cancels it instantly.
#### Iceberg Orders
Institutional traders executing multi-million dollar positions rarely submit a single, massive limit order, as doing so would alert the market and push prices away from their entry point. Instead, they use **iceberg orders**. An iceberg order splits a large order into small, visible tranches. As soon as one visible tranche fills, another is automatically posted. Consequently, an apparently thin order book may conceal substantial underlying liquidity.
#### Liquidation Cascades and Thin Liquidity
During market-wide volatility, depth can deteriorate rapidly. In leveraged derivatives markets, falling prices trigger automated market liquidations. These forced market sell orders sweep through bid depth rapidly. If buying interest is thin, price slippage accelerates, triggering further liquidations lower down the book. This creates a severe cascade effect where price decouples temporarily from fundamental valuation.
---
### 5. Execution Strategies for Intermediate Traders
To navigate market depth effectively and minimize execution costs, traders can adopt several tactical approaches:
1. **Use Limit Orders to Control Price:** By utilizing limit orders rather than market orders, you ensure your trade executes only at your specified price or better, completely eliminating negative slippage (though introducing the risk of non-execution).
2. **Split Large Orders (Scaling In/Out):** If trading size relative to the asset's average depth, break the total trade into smaller tranches spread across time or price levels.
3. **Utilize Algorithmic Orders:** Algorithmic tools like Time-Weighted Average Price (TWAP) allow traders to distribute orders automatically over a set period, minimizing order book footprint and reducing market impact.
4. **Monitor Cross-Venue Liquidity:** Cryptocurrency markets are fragmented across multiple global exchanges. Liquidity that appears thin on one venue may be significantly deeper on another.
---
### Summary
Market depth serves as the vital link between raw trade data and price action. By learning to interpret order books, spot real versus prospective liquidity, and calculate potential slippage, intermediate traders transition from simply reacting to price movements to understanding the underlying mechanics that drive them. Always remember that order books are dynamic tools; pairing depth analysis with disciplined risk management remains essential for long-term trading consistency.
#CryptoEducation #OrderBook #TradingStrategy
Demystifying Market Depth: How to Read Order Books and Manage Execution Risk
When entering the cryptocurrency market, beginner traders often devote most of their time to analyzing candlestick charts and momentum indicators. While historical price patterns offer valuable insights into market sentiment, they only tell half the story. The price displayed on a standard chart represents the last completed trade—a historical footprint. It does not explicitly reveal where future buying or selling interest lies.
To understand true market supply and demand, intermediate traders must look beneath the surface of raw price charts and master the concept of market depth. Understanding market depth allows market participants to evaluate liquidity, anticipate short-term price resistance, accurately project execution costs, and mitigate hidden risks such as slippage.
---
### 1. The Core Architecture of Market Depth
At its core, market depth measures an exchange's ability to absorb large trade orders without causing significant price movements. Market depth is sustained by the order book—a continuously updating electronic ledger that matches buyers and sellers.
An order book consists of two main sides:
* **Bids (Buy Orders):** The list of active limit orders from buyers who wish to purchase an asset at a specified price or lower. Bids are arranged in descending order, with the highest buy offer sitting at the top of the bid column.
* **Asks or Offers (Sell Orders):** The list of active limit orders from sellers offering to sell an asset at a specified price or higher. Asks are arranged in ascending order, with the lowest sell offer sitting at the top of the ask column.
The difference between the highest bid price and the lowest ask price is known as the **bid-ask spread**.
In high-liquidity assets like Bitcoin or Ethereum on major exchanges, the bid-ask spread is typically negligible—often fractions of a cent or a fraction of a percent. This narrow spread indicates a highly efficient market with abundant active participants. Conversely, low-cap altcoins or assets listed on illiquid exchanges often exhibit wide spreads. A wide spread signifies lower liquidity, forcing traders to pay a premium when buying or accept a discount when selling.
---
### 2. Reading the Depth Chart: Visualizing Supply and Demand
Most modern exchange interfaces provide a visual representation of market depth alongside the order book text columns. This graph, commonly referred to as the **Depth Chart**, plots cumulative order volume on the vertical axis against asset price on the horizontal axis.
The depth chart is divided into two colored slopes:
* **Green Slope (Bids):** Represents the cumulative volume of buy orders sitting below the current market price.
* **Red Slope (Asks):** Represents the cumulative volume of sell orders sitting above the current market price.
#### Buy Walls and Sell Walls
When examining a depth chart, traders often notice steep vertical spikes along either side of the curve. These visual barriers are known as "walls."
* **Buy Wall:** A massive accumulation of limit buy orders concentrated at a specific price level. A substantial buy wall indicates strong support, as market sellers must consume all the volume in that wall before the price can decline further.
* **Sell Wall:** A massive accumulation of limit sell orders concentrated at a specific price level. A sell wall acts as heavy resistance, requiring buyers to absorb significant volume before the price can push higher.
While walls can represent genuine institutional interest or psychological price levels (such as round numbers like $50,000 or $100), traders must approach them with caution, as order books are dynamic and subject to strategic manipulation.
---
### 3. Practical Application: Calculating Slippage and Real Execution Costs
One of the most practical applications of market depth analysis is calculating **slippage**—the difference between the expected price of a trade and the price at which the trade is actually executed.
Slippage typically occurs when using market orders during periods of low market depth or high price volatility. A market order prioritizes execution speed over price, filling immediately against the best available limit orders in the order book.
#### A Walkthrough Calculation of Slippage
Imagine a trader wants to execute a market buy order for 5 units of an asset. The asset's last traded price is $1,000, leading the trader to assume the trade will cost roughly $5,000.
However, looking at the current ask side of the order book reveals thin liquidity:
* **Level 1 Ask:** 1 unit available at $1,001
* **Level 2 Ask:** 2 units available at $1,005
* **Level 3 Ask:** 2 units available at $1,010
When the trader submits a market buy order for 5 units, the exchange matches the order sequentially down the order book:
1. The first 1 unit fills at **$1,001** (Total: $1,001)
2. The next 2 units fill at **$1,005** (Total: $2,010)
3. The final 2 units fill at **$1,010** (Total: $2,020)
**Total Capital Spent:** $1,001 + $2,010 + $2,020 = **$5,031**
**Average Execution Price per Unit:** $5,031 / 5 = **$1,006.20**
Because the order book lacked sufficient depth at the top ask price, the trader experienced an average execution price $6.20 higher per unit than the lowest available ask. On large institutional orders or low-liquidity pairs, slippage can easily reach several percentage points, drastically impairing trade profitability.
---
### 4. Market Depth Distortions, Manipulation, and Risks
While market depth provides valuable insights, relying solely on static order book data introduces significant risks. Order books are fluid environments where orders can be placed, modified, or canceled within milliseconds.
#### Phantom Liquidity and Spoofing
Not all visible order book liquidity represents a genuine intention to trade. **Spoofing** occurs when a trader places large limit orders (buy or sell walls) with no intention of letting them fill. The goal is to create a false impression of market demand or supply, tricking other market participants into buying or selling ahead of the wall. Once price approaches the fake order, the spoofer cancels it instantly.
#### Iceberg Orders
Institutional traders executing multi-million dollar positions rarely submit a single, massive limit order, as doing so would alert the market and push prices away from their entry point. Instead, they use **iceberg orders**. An iceberg order splits a large order into small, visible tranches. As soon as one visible tranche fills, another is automatically posted. Consequently, an apparently thin order book may conceal substantial underlying liquidity.
#### Liquidation Cascades and Thin Liquidity
During market-wide volatility, depth can deteriorate rapidly. In leveraged derivatives markets, falling prices trigger automated market liquidations. These forced market sell orders sweep through bid depth rapidly. If buying interest is thin, price slippage accelerates, triggering further liquidations lower down the book. This creates a severe cascade effect where price decouples temporarily from fundamental valuation.
---
### 5. Execution Strategies for Intermediate Traders
To navigate market depth effectively and minimize execution costs, traders can adopt several tactical approaches:
1. **Use Limit Orders to Control Price:** By utilizing limit orders rather than market orders, you ensure your trade executes only at your specified price or better, completely eliminating negative slippage (though introducing the risk of non-execution).
2. **Split Large Orders (Scaling In/Out):** If trading size relative to the asset's average depth, break the total trade into smaller tranches spread across time or price levels.
3. **Utilize Algorithmic Orders:** Algorithmic tools like Time-Weighted Average Price (TWAP) allow traders to distribute orders automatically over a set period, minimizing order book footprint and reducing market impact.
4. **Monitor Cross-Venue Liquidity:** Cryptocurrency markets are fragmented across multiple global exchanges. Liquidity that appears thin on one venue may be significantly deeper on another.
---
### Summary
Market depth serves as the vital link between raw trade data and price action. By learning to interpret order books, spot real versus prospective liquidity, and calculate potential slippage, intermediate traders transition from simply reacting to price movements to understanding the underlying mechanics that drive them. Always remember that order books are dynamic tools; pairing depth analysis with disciplined risk management remains essential for long-term trading consistency.
#CryptoEducation #OrderBook #TradingStrategy
121
BTC/USDT TECHNICAL CHECK - 1H
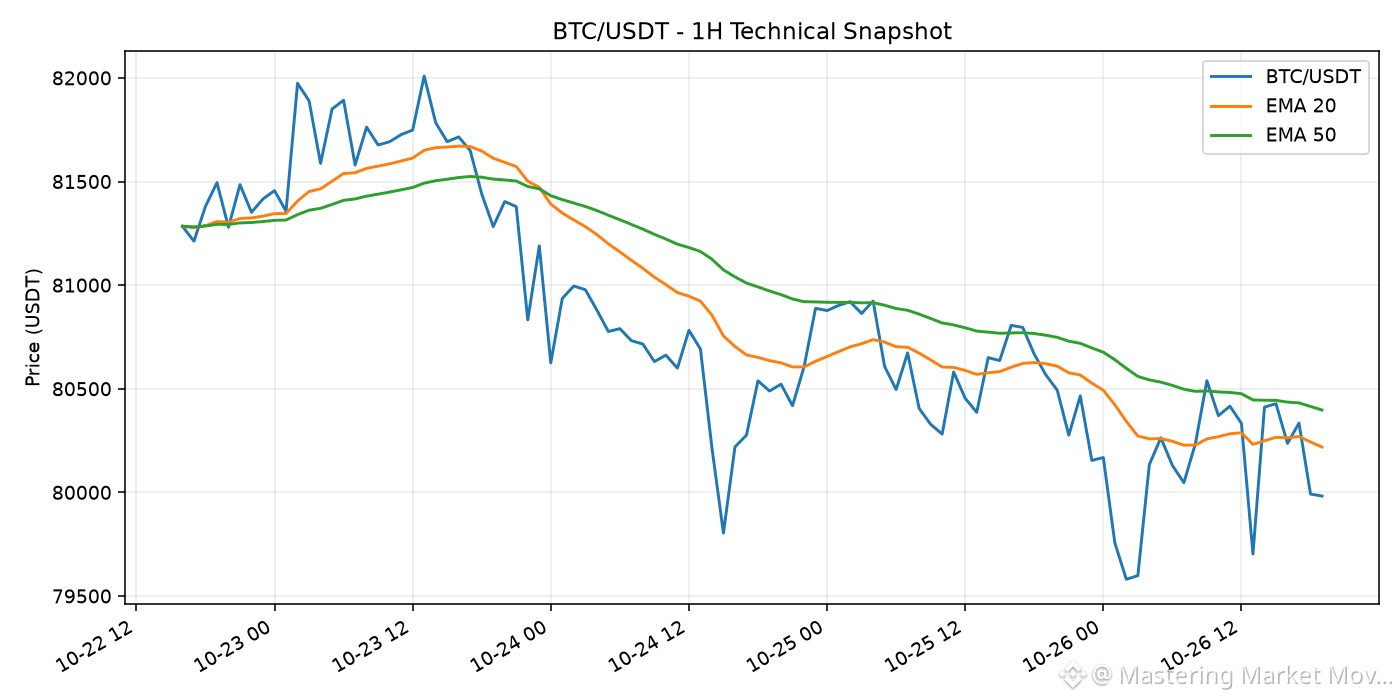
Snapshot: 2026-10-26 19:02 UTC. Latest close: $79,982.02. RSI(14): 45.3. EMA20 is below EMA50 on this snapshot. This is a momentum observation, not a standalone buy or sell signal. RSI can remain elevated or depressed during strong trends; confirm with price structure and risk management.
$BTC #Bitcoin #TechnicalAnalysis
Educational commentary only; not financial advice.
45
CRYPTO MARKET SNAPSHOT
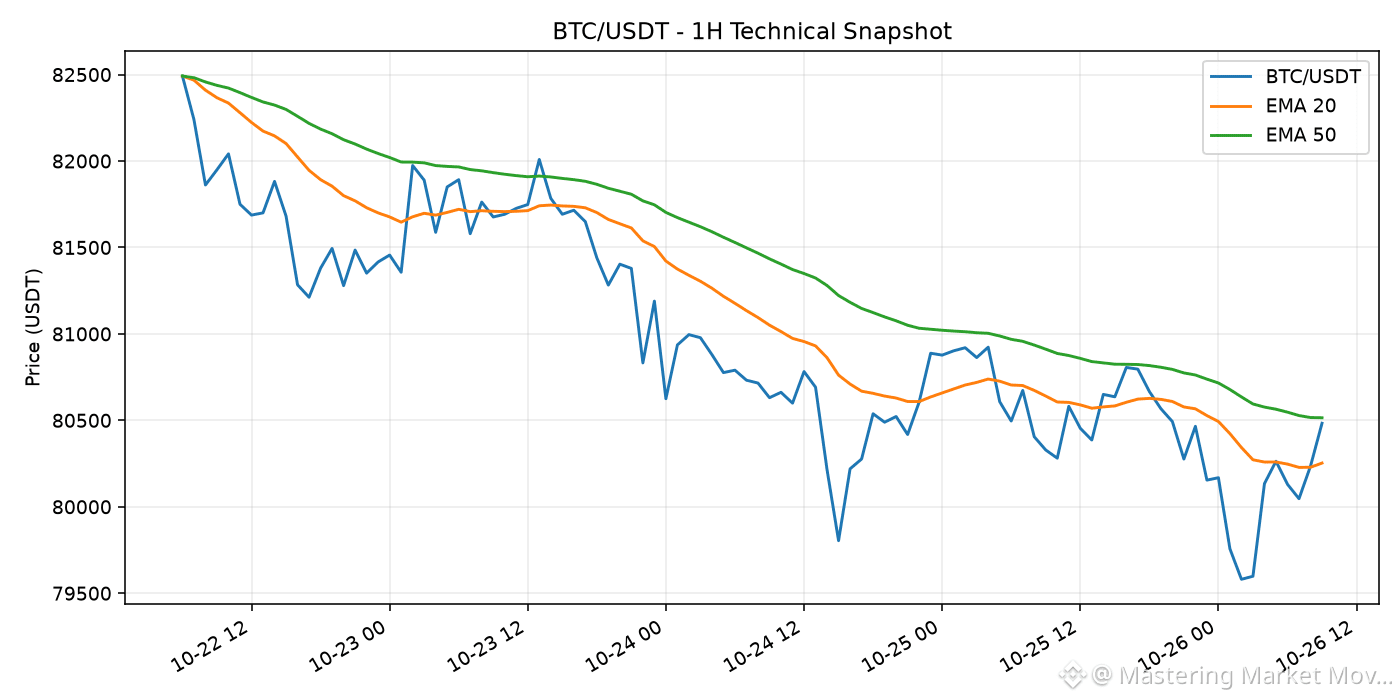
Data timestamp: 2026-10-26 09:26 UTC. BTC/USDT is $80,483.14 (+0.31% over 24h). Market direction can vary by asset and timeframe, so review liquidity and your own risk limits before making decisions.
Watchlist: $BTC $ETH
#CryptoMarket #Bitcoin #Ethereum
Educational commentary only; not financial advice.
60
Crypto News Update: $BTC Wallet Vulnerability, Unlinked Coins, and $ETH Foundation SalesHere are today's top cryptocurrency news headlines:
1. Bitcoin Wallet Bug Identified
- What happened: A vulnerability in select Bitcoin wallets allowed malicious servers to divert funds when users attempted to speed up transaction speeds.
- Why it matters: Exposes potential security risks in wallet infrastructure and fee-bumping procedures for $BTC users.
- Source: CoinDesk
2. 11 Million Bitcoin Unclaimed
- What happened: Analysis revealed that over 11 million Bitcoin cannot be attributed to any identifiable owner or entity.
- Why it matters: Illustrates the massive volume of early, lost, or untraceable coins in the $BTC supply.
- Source: CoinDesk
3. Ethereum Foundation Sells $ETH
- What happened: The Ethereum Foundation executed a sale of 2,785 $ETH through Cowswap.
- Why it matters: Provides visibility into the foundation's continuous treasury management and operational spending.
- Source: Blockchain News
4. Legislative Push After Bitcoin Kiosk Loss
- What happened: A North Carolina victim lost her savings to a gas-station crypto ATM, driving a legislative response that could mandate refunds beginning in January.
- Why it matters: Signals heightened regulatory oversight and consumer safety measures targeting physical crypto machines.
- Source: Yahoo Finance
#CryptoNews #Bitcoin #Ethereum
Crypto News Update: $BTC Wallet Vulnerability, Unlinked Coins, and $ETH Foundation Sales
Here are today's top cryptocurrency news headlines:
1. Bitcoin Wallet Bug Identified
- What happened: A vulnerability in select Bitcoin wallets allowed malicious servers to divert funds when users attempted to speed up transaction speeds.
- Why it matters: Exposes potential security risks in wallet infrastructure and fee-bumping procedures for $BTC users.
- Source: CoinDesk
2. 11 Million Bitcoin Unclaimed
- What happened: Analysis revealed that over 11 million Bitcoin cannot be attributed to any identifiable owner or entity.
- Why it matters: Illustrates the massive volume of early, lost, or untraceable coins in the $BTC supply.
- Source: CoinDesk
3. Ethereum Foundation Sells $ETH
- What happened: The Ethereum Foundation executed a sale of 2,785 $ETH through Cowswap.
- Why it matters: Provides visibility into the foundation's continuous treasury management and operational spending.
- Source: Blockchain News
4. Legislative Push After Bitcoin Kiosk Loss
- What happened: A North Carolina victim lost her savings to a gas-station crypto ATM, driving a legislative response that could mandate refunds beginning in January.
- Why it matters: Signals heightened regulatory oversight and consumer safety measures targeting physical crypto machines.
- Source: Yahoo Finance
#CryptoNews #Bitcoin #Ethereum
1
109
HIGH-VOLUME ALTCOIN WATCH
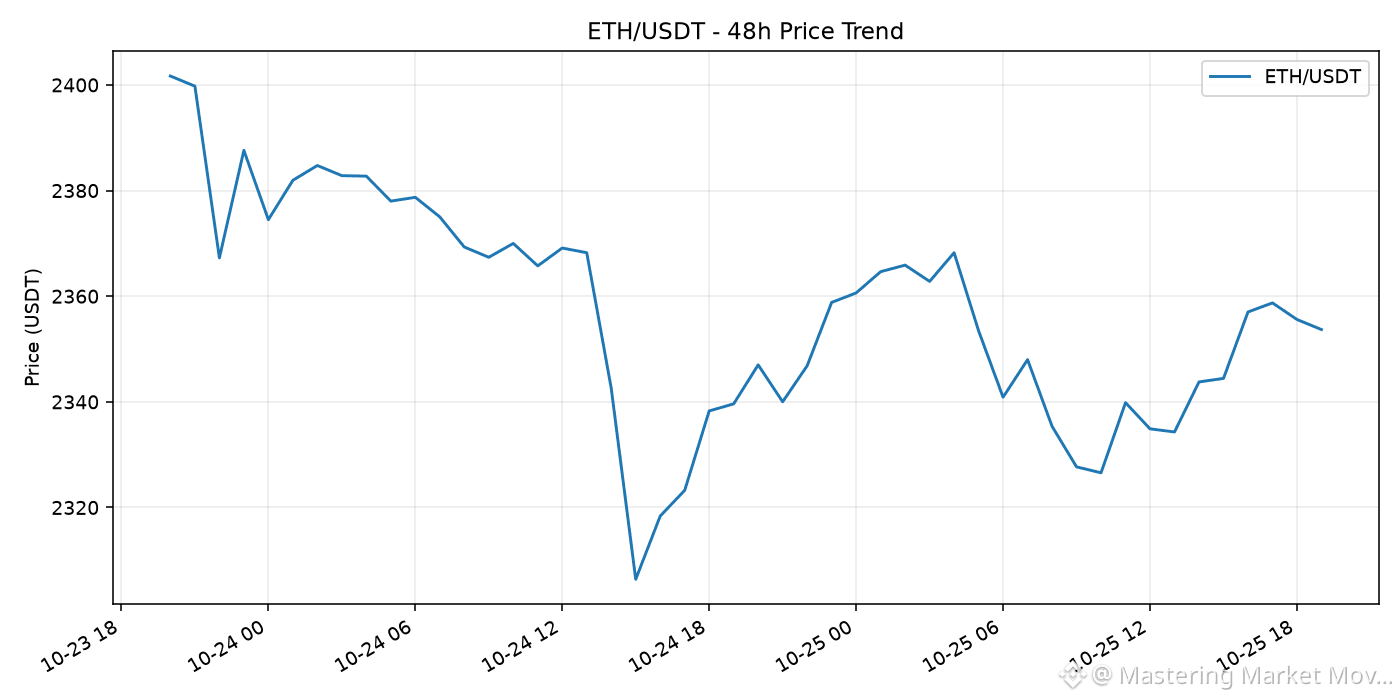
Snapshot: 2026-10-25 19:22 UTC. $ETH/USDT is among the highest-volume eligible USDT spot pairs in this snapshot. Last price: $2,353.69; 24h change: +0.71%; 24h quote volume: $260,156,844.
High volume signals activity, not guaranteed continuation. Check the chart, official announcements and downside scenarios independently.
$ETH #Crypto #Altcoins #MarketAnalysis
Educational commentary only; not financial advice.
HIGH-VOLUME ALTCOIN WATCH
Snapshot: 2026-10-25 19:22 UTC. $ETH /USDT is among the highest-volume eligible USDT spot pairs in this snapshot. Last price: $2,353.69; 24h change: +0.71%; 24h quote volume: $260,156,844.
High volume signals activity, not guaranteed continuation. Check the chart, official announcements and downside scenarios independently.
$ETH #Crypto #Altcoins #MarketAnalysis
Educational commentary only; not financial advice.
1
70
Decoding Market Depth: How to Read Order Books and Avoid Crypto Trading PitfallsPrice charts show where an asset has been, but market depth reveals the underlying structural mechanics holding it up. Intermediate crypto traders frequently transition from relying solely on basic technical analysis—such as trendlines, relative strength index (RSI), or moving averages—to realizing that price action is ultimately driven by order execution against available market liquidity.
Understanding market depth allows traders to look beneath the surface of candlestick charts. By examining real-time supply and demand across various price levels, you can better evaluate execution costs, detect potential manipulation, and make more informed trading decisions.
---
### 1. The Core Mechanics of an Order Book
To understand market depth, you must first understand the central limit order book (CLOB). A CLOB is a dynamic, real-time ledger that aggregates all outstanding open buy and sell limit orders for a specific asset pair.
The order book is divided into two main sides:
* **Bids (Buy Orders):** Located below the current market price, bids represent traders who are willing to purchase the asset at specific price points.
* **Asks or Offers (Sell Orders):** Located above the current market price, asks represent traders who are willing to sell the asset at specific price points.
The intersection where the highest bid meets the lowest ask determines the prevailing spot price of the asset. The gap between these two figures is known as the **bid-ask spread**.
```
[ ASKS ] 102.00 USDT — 5.0 Tokens
101.50 USDT — 3.0 Tokens
101.00 USDT — 1.5 Tokens <-- Lowest Ask
---------------------------------------- <-- Bid-Ask Spread
[ BIDS ] 100.50 USDT — 2.0 Tokens <-- Highest Bid
100.00 USDT — 4.0 Tokens
99.50 USDT — 8.0 Tokens
```
Market participants are broadly categorized into two roles based on how they interact with this structure:
1. **Liquidity Providers (Makers):** Traders who place limit orders that do not fill immediately. These orders sit in the book, adding "depth" and structure to the market.
2. **Liquidity Takers (Takers):** Traders who place market orders (or marketable limit orders) that execute instantly against existing orders in the book, removing depth.
Market depth is simply the cumulative measure of all open bid and ask limit orders at various price distances from the mid-market price.
---
### 2. Visualizing Depth: The Depth Chart Explained
Most cryptocurrency exchanges visualize this order book data through a graphical representation known as a **depth chart**.
A depth chart plots price along the horizontal (X) axis and cumulative order volume along the vertical (Y) axis. It typically displays two opposing colored slopes:
* **Green Side (Bids):** Represents the cumulative buy order volume extending downward from the current market price.
* **Red Side (Asks):** Represents the cumulative sell order volume extending upward from the current market price.
#### How to Read the Slopes
* **Steep Incline (Liquidity Wall):** A sudden, near-vertical jump in the depth chart indicates a massive concentration of limit orders at a specific price level. This represents a significant cluster of buying interest (bid wall) or selling pressure (ask wall).
* **Gradual Slope (Flat Depth):** A gently sloping line suggests that orders are evenly distributed across price tiers. In this environment, price tends to move smoothly without sudden structural resistance.
---
### 3. Practical Application: Calculating Slippage and Order Impact
One of the most practical uses of market depth is estimating **slippage**—the difference between the expected price of a trade and the actual price at which the trade executes.
When a trader places a large market order, it consumes the nearest available limit orders in the order book. If the volume of the market order exceeds the volume available at the top bid or ask, the order "walks the book," filling remaining portions at progressively worse prices.
#### Practical Scenario: Executing a Large Trade
Imagine an intermediate-cap altcoin with a current top ask price of 10.00 USDT. A trader wishes to execute a market buy order for 1,000 tokens using stablecoins.
Suppose the order book looks like this:
* **Level 1 Ask:** 200 tokens at 10.00 USDT
* **Level 2 Ask:** 300 tokens at 10.10 USDT
* **Level 3 Ask:** 500 tokens at 10.30 USDT
Here is how the 1,000-token market buy order fills:
1. Fills 200 tokens at 10.00 USDT = 2,000 USDT
2. Fills 300 tokens at 10.10 USDT = 3,030 USDT
3. Fills 500 tokens at 10.30 USDT = 5,150 USDT
* **Total Cost:** 10,180 USDT
* **Average Execution Price:** 10.18 USDT per token
* **Effective Slippage:** 1.8% higher than the initial top-of-book price (10.00 USDT).
If the same 1,000-token order were placed in a high-depth market like Bitcoin or Ethereum, the top level of the book would easily absorb the entire order volume. The order would fill completely at the top ask price with virtually zero slippage.
Understanding this distinction prevents traders from experiencing unexpected losses due to execution inefficiencies in low-depth markets.
---
### 4. Advanced Dynamics: Spoofing, Icebergs, and Phantom Depth
While order books provide essential transparency, interpreting market depth is not always straightforward. Experienced market participants and automated trading algorithms can manipulate or obscure order book data.
#### Spoofing and Layering
Spoofing occurs when a trader places large limit orders on one side of the order book with no intention of letting them execute. For example, a trader might place a massive buy wall at 95 USDT to create the illusion of strong support.
Retail traders, seeing this artificial support, may buy the asset, pushing the price up. Once the price rises, the spoofer cancels the non-bona-fide buy order and sells their inventory into the market-driven rally.
#### Iceberg Orders
Large institutional traders often avoid revealing their full intentions to the public order book. To achieve this, they use **iceberg orders**.
An iceberg order splits a massive order into smaller visible tranches. Once one small tranche fills, another is automatically submitted. A market depth chart may show only 10 Bitcoin available at a specific price, but as soon as those 10 are bought, another 10 appear at the exact same price. The true depth remains hidden beneath the surface.
#### Dynamic Liquidity
Order books represent *intent*, not binding commitment. During periods of sharp macroeconomic volatility, market makers often pull their limit orders to reduce risk exposure. As a result, market depth can evaporate in seconds, causing market spreads to widen significantly and price volatility to spike dramatically.
---
### 5. Best Practices for Incorporating Market Depth into Risk Management
To use market depth effectively without falling for common traps, intermediate traders should integrate the following practices into their workflow:
1. **Size Positions Relative to Depth:** Before opening a trade, verify that the market depth within a 1% to 2% price range can absorb your position size without severe slippage.
2. **Use Limit Orders for Entry and Exit:** By utilizing limit orders instead of market orders, you act as a liquidity provider. This eliminates slippage and typically qualifies you for lower fee tiers on most trading platforms.
3. **Cross-Reference Multiple Data Points:** Never rely on an order book wall in isolation. Combine market depth analysis with volume profiles, historic support/resistance levels, and overall market context.
4. **Monitor Order Flow, Not Just Static Walls:** A genuine buy or ask wall is often filled or held firmly, whereas artificial walls tend to move or disappear entirely as the spot price approaches them.
---
### Final Thoughts
Market depth offers a fundamental look at the balance between supply and demand in crypto trading. It shifts the trader's perspective from reacting to past price movements to understanding real-time liquidity conditions.
By analyzing order book dynamics, accounting for execution slippage, and remaining mindful of phantom order strategies, intermediate traders can significantly refine their execution techniques and strengthen their overall risk management framework.
---
#CryptoEducation #MarketDepth #TradingStrategy
Decoding Market Depth: How to Read Order Books and Avoid Crypto Trading Pitfalls
Price charts show where an asset has been, but market depth reveals the underlying structural mechanics holding it up. Intermediate crypto traders frequently transition from relying solely on basic technical analysis—such as trendlines, relative strength index (RSI), or moving averages—to realizing that price action is ultimately driven by order execution against available market liquidity.
Understanding market depth allows traders to look beneath the surface of candlestick charts. By examining real-time supply and demand across various price levels, you can better evaluate execution costs, detect potential manipulation, and make more informed trading decisions.
---
### 1. The Core Mechanics of an Order Book
To understand market depth, you must first understand the central limit order book (CLOB). A CLOB is a dynamic, real-time ledger that aggregates all outstanding open buy and sell limit orders for a specific asset pair.
The order book is divided into two main sides:
* **Bids (Buy Orders):** Located below the current market price, bids represent traders who are willing to purchase the asset at specific price points.
* **Asks or Offers (Sell Orders):** Located above the current market price, asks represent traders who are willing to sell the asset at specific price points.
The intersection where the highest bid meets the lowest ask determines the prevailing spot price of the asset. The gap between these two figures is known as the **bid-ask spread**.
```
[ ASKS ] 102.00 USDT — 5.0 Tokens
101.50 USDT — 3.0 Tokens
101.00 USDT — 1.5 Tokens <-- Lowest Ask
---------------------------------------- <-- Bid-Ask Spread
[ BIDS ] 100.50 USDT — 2.0 Tokens <-- Highest Bid
100.00 USDT — 4.0 Tokens
99.50 USDT — 8.0 Tokens
```
Market participants are broadly categorized into two roles based on how they interact with this structure:
1. **Liquidity Providers (Makers):** Traders who place limit orders that do not fill immediately. These orders sit in the book, adding "depth" and structure to the market.
2. **Liquidity Takers (Takers):** Traders who place market orders (or marketable limit orders) that execute instantly against existing orders in the book, removing depth.
Market depth is simply the cumulative measure of all open bid and ask limit orders at various price distances from the mid-market price.
---
### 2. Visualizing Depth: The Depth Chart Explained
Most cryptocurrency exchanges visualize this order book data through a graphical representation known as a **depth chart**.
A depth chart plots price along the horizontal (X) axis and cumulative order volume along the vertical (Y) axis. It typically displays two opposing colored slopes:
* **Green Side (Bids):** Represents the cumulative buy order volume extending downward from the current market price.
* **Red Side (Asks):** Represents the cumulative sell order volume extending upward from the current market price.
#### How to Read the Slopes
* **Steep Incline (Liquidity Wall):** A sudden, near-vertical jump in the depth chart indicates a massive concentration of limit orders at a specific price level. This represents a significant cluster of buying interest (bid wall) or selling pressure (ask wall).
* **Gradual Slope (Flat Depth):** A gently sloping line suggests that orders are evenly distributed across price tiers. In this environment, price tends to move smoothly without sudden structural resistance.
---
### 3. Practical Application: Calculating Slippage and Order Impact
One of the most practical uses of market depth is estimating **slippage**—the difference between the expected price of a trade and the actual price at which the trade executes.
When a trader places a large market order, it consumes the nearest available limit orders in the order book. If the volume of the market order exceeds the volume available at the top bid or ask, the order "walks the book," filling remaining portions at progressively worse prices.
#### Practical Scenario: Executing a Large Trade
Imagine an intermediate-cap altcoin with a current top ask price of 10.00 USDT. A trader wishes to execute a market buy order for 1,000 tokens using stablecoins.
Suppose the order book looks like this:
* **Level 1 Ask:** 200 tokens at 10.00 USDT
* **Level 2 Ask:** 300 tokens at 10.10 USDT
* **Level 3 Ask:** 500 tokens at 10.30 USDT
Here is how the 1,000-token market buy order fills:
1. Fills 200 tokens at 10.00 USDT = 2,000 USDT
2. Fills 300 tokens at 10.10 USDT = 3,030 USDT
3. Fills 500 tokens at 10.30 USDT = 5,150 USDT
* **Total Cost:** 10,180 USDT
* **Average Execution Price:** 10.18 USDT per token
* **Effective Slippage:** 1.8% higher than the initial top-of-book price (10.00 USDT).
If the same 1,000-token order were placed in a high-depth market like Bitcoin or Ethereum, the top level of the book would easily absorb the entire order volume. The order would fill completely at the top ask price with virtually zero slippage.
Understanding this distinction prevents traders from experiencing unexpected losses due to execution inefficiencies in low-depth markets.
---
### 4. Advanced Dynamics: Spoofing, Icebergs, and Phantom Depth
While order books provide essential transparency, interpreting market depth is not always straightforward. Experienced market participants and automated trading algorithms can manipulate or obscure order book data.
#### Spoofing and Layering
Spoofing occurs when a trader places large limit orders on one side of the order book with no intention of letting them execute. For example, a trader might place a massive buy wall at 95 USDT to create the illusion of strong support.
Retail traders, seeing this artificial support, may buy the asset, pushing the price up. Once the price rises, the spoofer cancels the non-bona-fide buy order and sells their inventory into the market-driven rally.
#### Iceberg Orders
Large institutional traders often avoid revealing their full intentions to the public order book. To achieve this, they use **iceberg orders**.
An iceberg order splits a massive order into smaller visible tranches. Once one small tranche fills, another is automatically submitted. A market depth chart may show only 10 Bitcoin available at a specific price, but as soon as those 10 are bought, another 10 appear at the exact same price. The true depth remains hidden beneath the surface.
#### Dynamic Liquidity
Order books represent *intent*, not binding commitment. During periods of sharp macroeconomic volatility, market makers often pull their limit orders to reduce risk exposure. As a result, market depth can evaporate in seconds, causing market spreads to widen significantly and price volatility to spike dramatically.
---
### 5. Best Practices for Incorporating Market Depth into Risk Management
To use market depth effectively without falling for common traps, intermediate traders should integrate the following practices into their workflow:
1. **Size Positions Relative to Depth:** Before opening a trade, verify that the market depth within a 1% to 2% price range can absorb your position size without severe slippage.
2. **Use Limit Orders for Entry and Exit:** By utilizing limit orders instead of market orders, you act as a liquidity provider. This eliminates slippage and typically qualifies you for lower fee tiers on most trading platforms.
3. **Cross-Reference Multiple Data Points:** Never rely on an order book wall in isolation. Combine market depth analysis with volume profiles, historic support/resistance levels, and overall market context.
4. **Monitor Order Flow, Not Just Static Walls:** A genuine buy or ask wall is often filled or held firmly, whereas artificial walls tend to move or disappear entirely as the spot price approaches them.
---
### Final Thoughts
Market depth offers a fundamental look at the balance between supply and demand in crypto trading. It shifts the trader's perspective from reacting to past price movements to understanding real-time liquidity conditions.
By analyzing order book dynamics, accounting for execution slippage, and remaining mindful of phantom order strategies, intermediate traders can significantly refine their execution techniques and strengthen their overall risk management framework.
---
#CryptoEducation #MarketDepth #TradingStrategy
93
BTC/USDT TECHNICAL CHECK - 1H
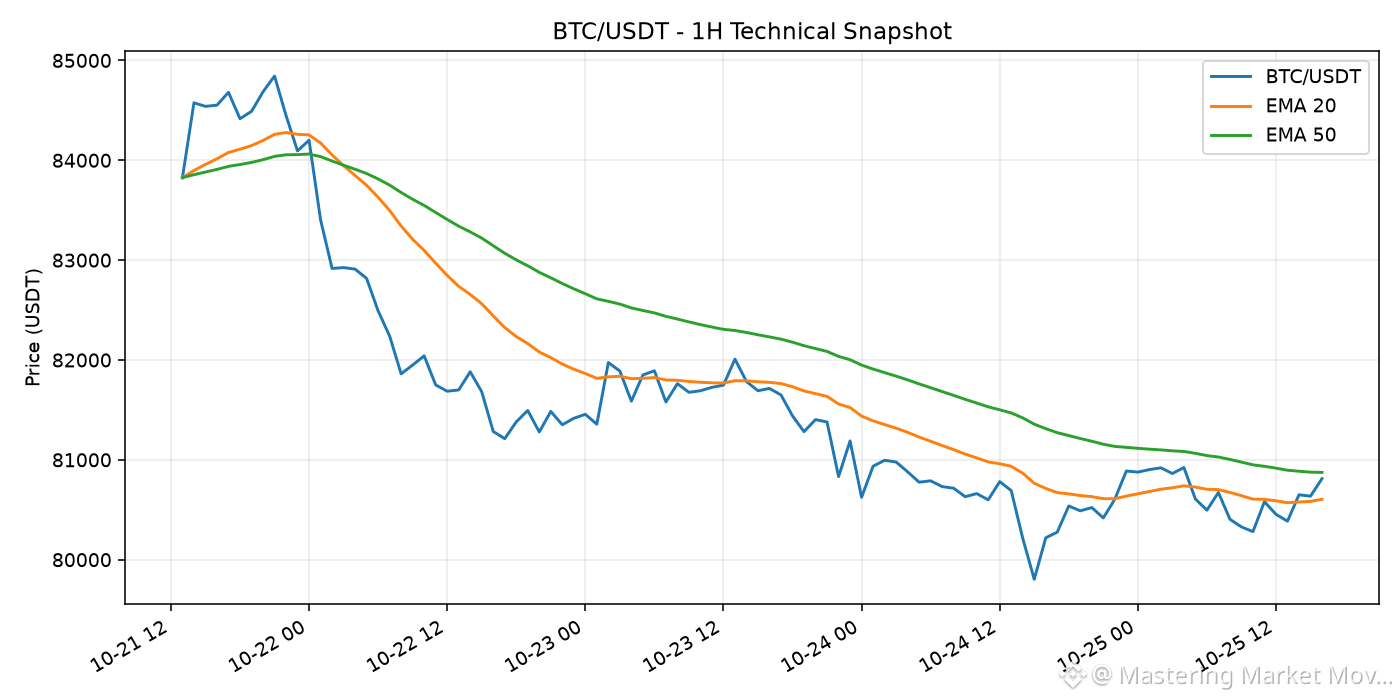
Snapshot: 2026-10-25 16:58 UTC. Latest close: $80,812.00. RSI(14): 47.4. EMA20 is below EMA50 on this snapshot. This is a momentum observation, not a standalone buy or sell signal. RSI can remain elevated or depressed during strong trends; confirm with price structure and risk management.
$BTC #Bitcoin #TechnicalAnalysis
Educational commentary only; not financial advice.
2
158
Статья
Market Snapshot: BNB Shows Relative Strength as BTC and ETH ConsolidateThe crypto market displays mixed performance over the last 24 hours with divergence among top assets.
**Price Action & Relative Strength**
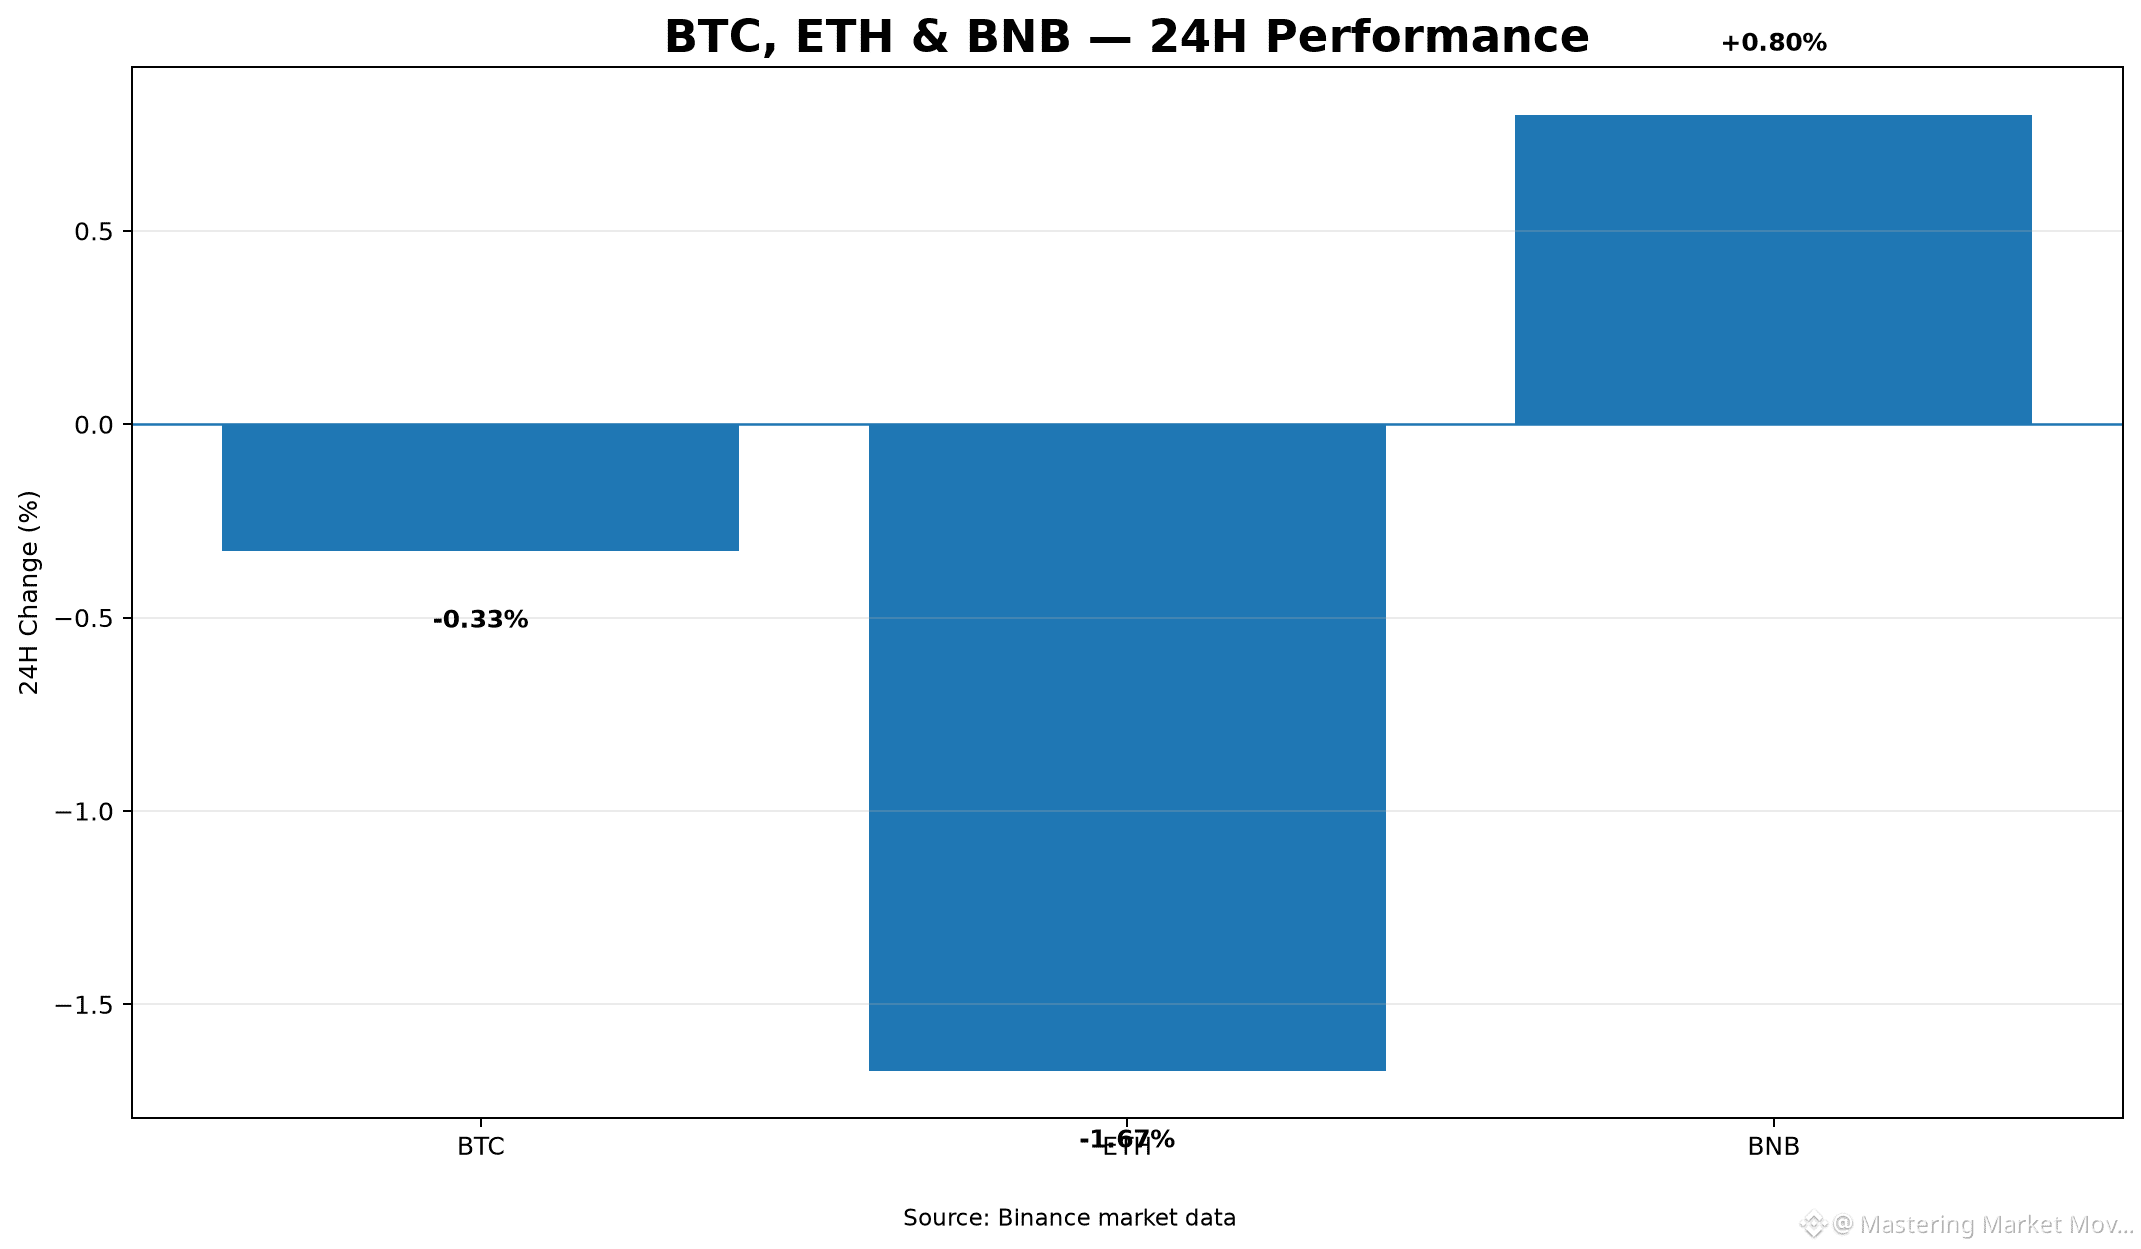
$BTC is currently trading at $80,320.09, down slightly by -0.327%. $ETH shows broader weakness, declining -1.671% to $2,326.64. In contrast, $BNB demonstrates relative strength as the top gainer among the three, rising +0.8% to $738.07.
**Ranges & Volume Analysis**
- BTC traded between a 24h high of $81,033.69 and a low of $79,220.74, generating $774.61M in 24h quote volume (9,650.91 BTC).
- ETH fluctuated between $2,373.32 and $2,282.46, with $474.43M in quote volume (203,550.54 ETH).
- BNB saw a 24h range from $718.00 to $748.65, backed by $87.28M in quote volume (118,930.70 BNB).
**Volatility & Market Scenarios**
Volatility remains focused within defined intraday ranges, with BTC holding above the $79.2k level.
- **Bullish Scenario:** A sustained push above local resistance levels ($81,033.69 for BTC and $2,373.32 for ETH) could lead to broader upside continuation.
- **Bearish Scenario:** A breakdown below key 24h support levels ($79,220.74 for BTC and $2,282.46 for ETH) could trigger further short-term downward retests.
**Risks & What to Watch**
Key risks include low volume continuation during price pullbacks. Watch whether BNB can maintain its positive momentum and if BTC holds its 24h low during upcoming sessions.
#CryptoAnalysis #MarketUpdate #TechnicalAnalysis
Market Snapshot: BNB Shows Relative Strength as BTC and ETH Consolidate
The crypto market displays mixed performance over the last 24 hours with divergence among top assets.
**Price Action & Relative Strength**
$BTC is currently trading at $80,320.09, down slightly by -0.327%. $ETH shows broader weakness, declining -1.671% to $2,326.64. In contrast, $BNB demonstrates relative strength as the top gainer among the three, rising +0.8% to $738.07.
**Ranges & Volume Analysis**
- BTC traded between a 24h high of $81,033.69 and a low of $79,220.74, generating $774.61M in 24h quote volume (9,650.91 BTC).
- ETH fluctuated between $2,373.32 and $2,282.46, with $474.43M in quote volume (203,550.54 ETH).
- BNB saw a 24h range from $718.00 to $748.65, backed by $87.28M in quote volume (118,930.70 BNB).
**Volatility & Market Scenarios**
Volatility remains focused within defined intraday ranges, with BTC holding above the $79.2k level.
- **Bullish Scenario:** A sustained push above local resistance levels ($81,033.69 for BTC and $2,373.32 for ETH) could lead to broader upside continuation.
- **Bearish Scenario:** A breakdown below key 24h support levels ($79,220.74 for BTC and $2,282.46 for ETH) could trigger further short-term downward retests.
**Risks & What to Watch**
Key risks include low volume continuation during price pullbacks. Watch whether BNB can maintain its positive momentum and if BTC holds its 24h low during upcoming sessions.
#CryptoAnalysis #MarketUpdate #TechnicalAnalysis
1
117
CRYPTO MARKET SNAPSHOT
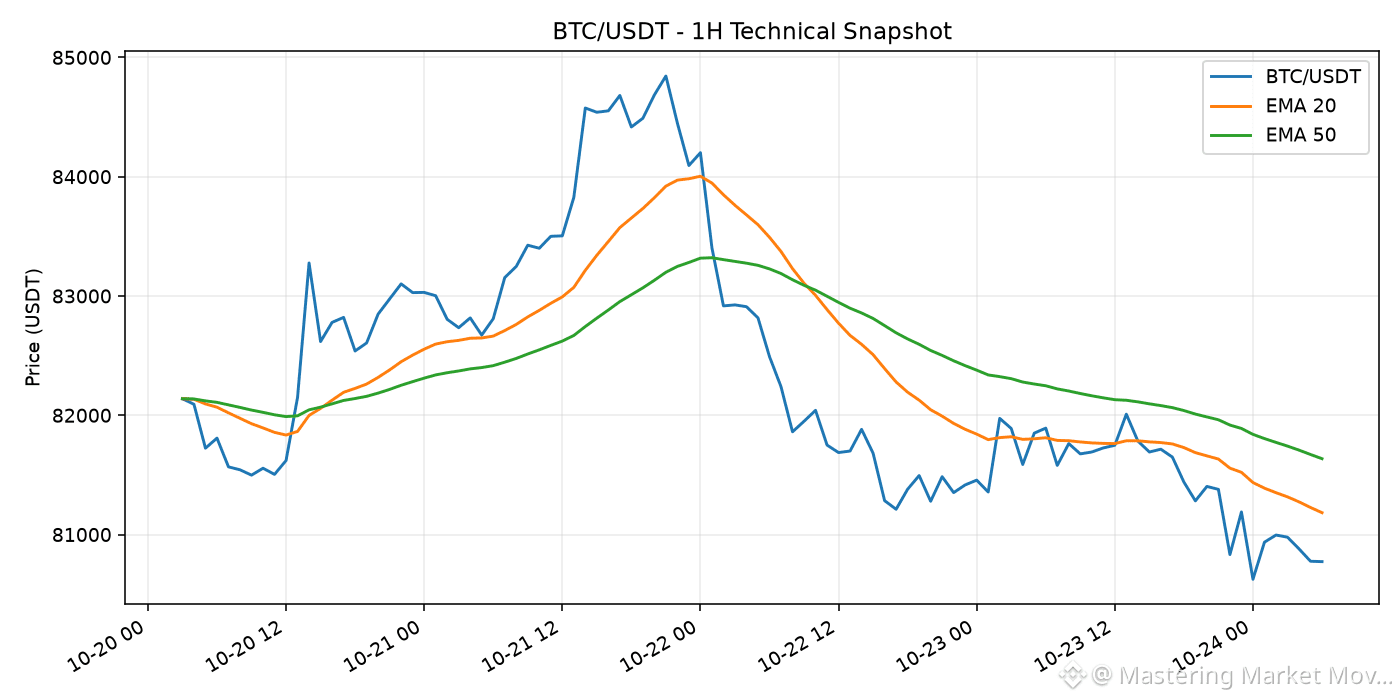
Data timestamp: 2026-10-24 06:54 UTC. BTC/USDT is $80,772.87 (-1.40% over 24h). Market direction can vary by asset and timeframe, so review liquidity and your own risk limits before making decisions.
Watchlist: $BTC $ETH
#CryptoMarket #Bitcoin #Ethereum
Educational commentary only; not financial advice.
1
120
Статья
Crypto Market Analysis: BTC, ETH, and BNB Test 24-Hour LowsThe overall market has experienced a moderate pullback over the past 24 hours, with major assets trading near their daily support levels.
Price & Range Overview:
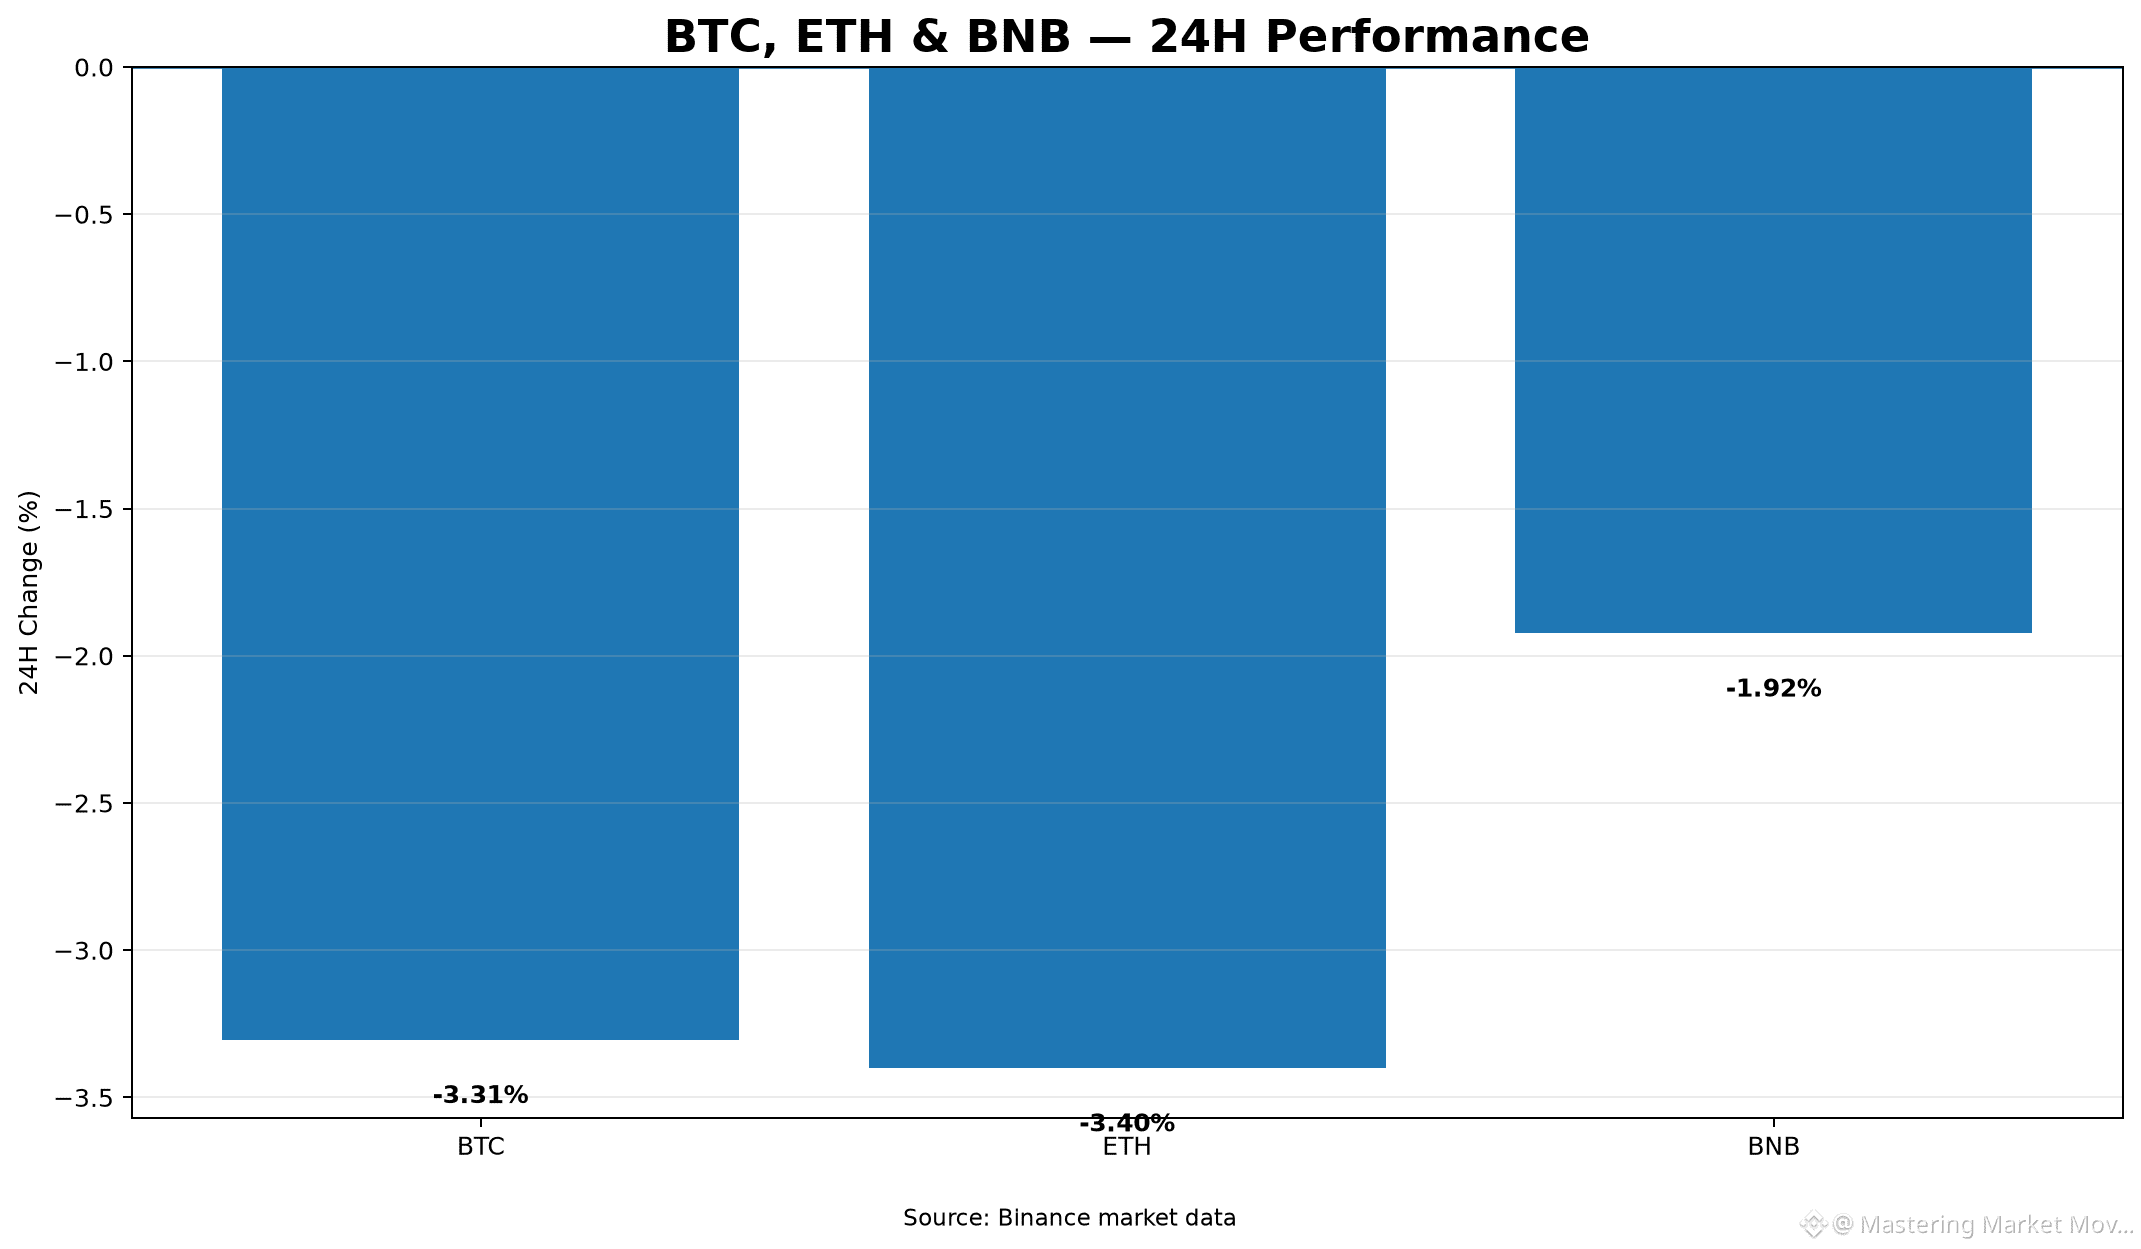
- $BTC is trading at $81,804.01, down 3.31% over the last 24 hours, within a range of $81,376.10 (low) to $84,898.00 (high).
- $ETH is priced at $2,410.37, recording a 3.40% decline, fluctuating between $2,395.00 and $2,526.62.
- $BNB sits at $733.64, dropping 1.92%, with a 24-hour range of $730.35 to $751.86.
Volume & Relative Strength:
Quote volume remains substantial, led by Bitcoin at $1.77B, followed by Ethereum at $668.87M and BNB at $81.08M. In terms of relative strength, BNB demonstrated more resilience during this market dip compared to Bitcoin and Ethereum, losing significantly less percentage-wise.
Volatility & Market Scenarios:
Intraday volatility was notable, with Bitcoin moving across a ~$3,522 range and Ethereum covering a ~$131 range.
- Bullish Scenario: A strong defense of current 24-hour lows could spur a recovery, pushing prices back toward the top of their daily ranges as volume consolidates.
- Bearish Scenario: A breach below current 24-hour support levels ($81,376.10, $2,395.00, and $730.35) could trigger further short-term downside exploration.
Risks & What to Watch:
Primary risks include ongoing market-wide volatility and sustained selling pressure. Market participants should watch for buyer defense around recent 24-hour lows and monitor shifts in 24-hour volume for signs of momentum reversals.
#CryptoAnalysis #MarketUpdate #TechnicalAnalysis
Crypto Market Analysis: BTC, ETH, and BNB Test 24-Hour Lows
The overall market has experienced a moderate pullback over the past 24 hours, with major assets trading near their daily support levels.
Price & Range Overview:
- $BTC is trading at $81,804.01, down 3.31% over the last 24 hours, within a range of $81,376.10 (low) to $84,898.00 (high).
- $ETH is priced at $2,410.37, recording a 3.40% decline, fluctuating between $2,395.00 and $2,526.62.
- $BNB sits at $733.64, dropping 1.92%, with a 24-hour range of $730.35 to $751.86.
Volume & Relative Strength:
Quote volume remains substantial, led by Bitcoin at $1.77B, followed by Ethereum at $668.87M and BNB at $81.08M. In terms of relative strength, BNB demonstrated more resilience during this market dip compared to Bitcoin and Ethereum, losing significantly less percentage-wise.
Volatility & Market Scenarios:
Intraday volatility was notable, with Bitcoin moving across a ~$3,522 range and Ethereum covering a ~$131 range.
- Bullish Scenario: A strong defense of current 24-hour lows could spur a recovery, pushing prices back toward the top of their daily ranges as volume consolidates.
- Bearish Scenario: A breach below current 24-hour support levels ($81,376.10, $2,395.00, and $730.35) could trigger further short-term downside exploration.
Risks & What to Watch:
Primary risks include ongoing market-wide volatility and sustained selling pressure. Market participants should watch for buyer defense around recent 24-hour lows and monitor shifts in 24-hour volume for signs of momentum reversals.
#CryptoAnalysis #MarketUpdate #TechnicalAnalysis
90
Crypto Roundup: JPMorgan Expands to Ethereum, Strategy Buys More BTCHere are the top stories shaping the crypto landscape today:
1. JPMorgan Brings JPM Coin to Ethereum
- What happened: JPMorgan expanded its Kinexys-powered deposit token (JPM Coin) to the public Ethereum network for institutional clients.
- Why it matters: This moves real bank deposits onto a public layer-1 blockchain, signaling deeper institutional integration with $ETH.
- Source: Bloomberg / Decrypt
2. Strategy Purchases $22M in Bitcoin
- What happened: Strategy acquired an additional $22 million worth of Bitcoin while raising its share buyback plans.
- Why it matters: Demonstrates sustained corporate treasury accumulation of $BTC.
- Source: Fortune
3. DOJ Scrutinizes Crypto ATM Operators
- What happened: The US Department of Justice confirmed investigations into crypto kiosk companies following victim scam reports.
- Why it matters: Increased federal oversight could lead to stricter compliance regulations for physical crypto access points.
- Source: WRAL
4. Crypto Exchanges Race for US Prediction Markets
- What happened: Leading crypto exchanges are actively working to launch event-based prediction markets in the United States.
- Why it matters: Highlights growing demand for event-driven derivatives and decentralized betting infrastructure in regulated markets.
- Source: Financial Times
#CryptoNews #Bitcoin #Ethereum
Crypto Roundup: JPMorgan Expands to Ethereum, Strategy Buys More BTC
Here are the top stories shaping the crypto landscape today:
1. JPMorgan Brings JPM Coin to Ethereum
- What happened: JPMorgan expanded its Kinexys-powered deposit token (JPM Coin) to the public Ethereum network for institutional clients.
- Why it matters: This moves real bank deposits onto a public layer-1 blockchain, signaling deeper institutional integration with $ETH .
- Source: Bloomberg / Decrypt
2. Strategy Purchases $22M in Bitcoin
- What happened: Strategy acquired an additional $22 million worth of Bitcoin while raising its share buyback plans.
- Why it matters: Demonstrates sustained corporate treasury accumulation of $BTC .
- Source: Fortune
3. DOJ Scrutinizes Crypto ATM Operators
- What happened: The US Department of Justice confirmed investigations into crypto kiosk companies following victim scam reports.
- Why it matters: Increased federal oversight could lead to stricter compliance regulations for physical crypto access points.
- Source: WRAL
4. Crypto Exchanges Race for US Prediction Markets
- What happened: Leading crypto exchanges are actively working to launch event-based prediction markets in the United States.
- Why it matters: Highlights growing demand for event-driven derivatives and decentralized betting infrastructure in regulated markets.
- Source: Financial Times
#CryptoNews #Bitcoin #Ethereum
94
Войдите, чтобы посмотреть больше материала
Присоединяйтесь к пользователям криптовалют по всему миру на Binance Square
⚡️ Получайте новейшую и полезную информацию о криптоактивах.
💬 Нам доверяет крупнейшая в мире криптобиржа.
👍 Получите достоверные аналитические данные от верифицированных создателей контента.
Эл. почта/номер телефона
В тренде
CanMicrosoftDeliverOnAI
Просмотров: 371,947
2,916 обсуждают
Earnings Season Session 3: Will Google & Microsoft Beat Earnings Expectations?
Binance Square Official
·Лайков: 141
·Просмотров: 70.7k
CanGoogleDefindItsCore
Просмотров: 223,226
2,076 обсуждают
EarningsSeason
Просмотров: 5.9M
28,971 обсуждают