

ScalpingX
14.5k 投稿

ScalpingX
報告
ユーザーをブロック
A short-term trader who embraces high-risk, high-reward strategies with an unconventional mindset.
44 フォロー
1.7K+ フォロワー
10.3K+ いいね
投稿
すべて
引用
·
--
翻訳参照
Global chemicals diverge as oil keeps costs elevated while production margins remain under pressure
🛢 Brent around $102/bbl continues to keep feedstock costs elevated, particularly for naphtha and oil-dependent crackers. However, finished-product prices have not risen fast enough to fully offset higher input costs, leaving margins across several chains under pressure.
🇪🇺 Europe is entering October with a clearer upward pricing trend. Olefin contracts are expected to rise by around EUR 60–80/ton, while styrene could increase by roughly EUR 100–150/ton. Polyolefins, polystyrene and PET had already moved higher beforehand. Even so, ethylene, PE and PP spreads remain below year-ago levels, suggesting much of the increase still reflects feedstock cost pass-through rather than stronger pricing power.
🇨🇳 China has effectively frozen price indications during Golden Week, but unchanged quotations do not mean supply and demand are balanced. PP and PE inventories at Sinopec and CNPC remain above seasonal averages, while suppliers avoided aggressive price cuts ahead of the holiday.
📉 Pressure may become more visible after China reopens on October 8. If inventories fail to decline sufficiently in the first week and new PE–PP capacity starts as scheduled in the second half of the month, polyolefin prices could face stronger downside pressure by the third week after the holiday.
🌍 The US is following a different path from Europe, with most major-volume resins expected to trade flat to lower in October. The broader picture is therefore not a synchronized global chemical upcycle, but a widening divergence between feedstock costs, demand conditions and the ability of producers to defend margins across regions.
#ChemicalMarkets $CL
Global chemicals diverge as oil keeps costs elevated while production margins remain under pressure
🛢 Brent around $102/bbl continues to keep feedstock costs elevated, particularly for naphtha and oil-dependent crackers. However, finished-product prices have not risen fast enough to fully offset higher input costs, leaving margins across several chains under pressure.
🇪🇺 Europe is entering October with a clearer upward pricing trend. Olefin contracts are expected to rise by around EUR 60–80/ton, while styrene could increase by roughly EUR 100–150/ton. Polyolefins, polystyrene and PET had already moved higher beforehand. Even so, ethylene, PE and PP spreads remain below year-ago levels, suggesting much of the increase still reflects feedstock cost pass-through rather than stronger pricing power.
🇨🇳 China has effectively frozen price indications during Golden Week, but unchanged quotations do not mean supply and demand are balanced. PP and PE inventories at Sinopec and CNPC remain above seasonal averages, while suppliers avoided aggressive price cuts ahead of the holiday.
📉 Pressure may become more visible after China reopens on October 8. If inventories fail to decline sufficiently in the first week and new PE–PP capacity starts as scheduled in the second half of the month, polyolefin prices could face stronger downside pressure by the third week after the holiday.
🌍 The US is following a different path from Europe, with most major-volume resins expected to trade flat to lower in October. The broader picture is therefore not a synchronized global chemical upcycle, but a widening divergence between feedstock costs, demand conditions and the ability of producers to defend margins across regions.
#ChemicalMarkets $CL
🛢 Brent around $102/bbl continues to keep feedstock costs elevated, particularly for naphtha and oil-dependent crackers. However, finished-product prices have not risen fast enough to fully offset higher input costs, leaving margins across several chains under pressure.
🇪🇺 Europe is entering October with a clearer upward pricing trend. Olefin contracts are expected to rise by around EUR 60–80/ton, while styrene could increase by roughly EUR 100–150/ton. Polyolefins, polystyrene and PET had already moved higher beforehand. Even so, ethylene, PE and PP spreads remain below year-ago levels, suggesting much of the increase still reflects feedstock cost pass-through rather than stronger pricing power.
🇨🇳 China has effectively frozen price indications during Golden Week, but unchanged quotations do not mean supply and demand are balanced. PP and PE inventories at Sinopec and CNPC remain above seasonal averages, while suppliers avoided aggressive price cuts ahead of the holiday.
📉 Pressure may become more visible after China reopens on October 8. If inventories fail to decline sufficiently in the first week and new PE–PP capacity starts as scheduled in the second half of the month, polyolefin prices could face stronger downside pressure by the third week after the holiday.
🌍 The US is following a different path from Europe, with most major-volume resins expected to trade flat to lower in October. The broader picture is therefore not a synchronized global chemical upcycle, but a widening divergence between feedstock costs, demand conditions and the ability of producers to defend margins across regions.
#ChemicalMarkets $CL

66
·
--
ブリッシュ
原油の供給は回復しつつあるが、ディーゼルのボトルネックは依然として解消されていない
🛢 ブレントは1バレル当たり102ドルを上回って週を終えた一方、WTIは前週金曜から約1.4%下落した。中東の原油輸出は紛争前水準のほぼ98%まで回復しており、実物の原油供給が徐々に正常化していることを示唆している。
⛽ 主要な懸念は精製と完成品にある。中東の精製能力は1日あたり約300万バレルが依然として稼働停止のままで、域内のディーゼル輸出は紛争前水準の約25%にとどまっている。ロシアも10月末までディーゼル輸出の制限を維持している。
📉 米国の留出油(ディスティレート)在庫は1億522万バレルで、5年平均を約14%下回っている。ディーゼルのクラックス(採算)は依然として非常に高い水準にあり、市場は原油そのものの不足よりも、精製製品の不足を織り込んでいることを示している。
🇨🇳 中国は10月のディーゼル、ガソリン、ジェット燃料の輸出を承認しておらず、国際市場への代替供給がさらに細っている。これとは逆に、欧州やその他のG7諸国は、市場の圧力を和らげるために緊急のディーゼル備蓄の活用を検討している。
🚢 ホルムズ海峡は、保険や海上輸送コストが高止まりしているため、引き続き海上で運ばれる原油にリスクプレミアムを織り込ませている。したがって、湾岸の原油輸出の回復は、エネルギーショックが終わったことを意味するわけではない。ボトルネックは、次第に精製能力、輸送、そしてディーゼルの入手可能性へとシフトしてきている。
#EnergyMarkets $CL $NATGAS
原油の供給は回復しつつあるが、ディーゼルのボトルネックは依然として解消されていない
🛢 ブレントは1バレル当たり102ドルを上回って週を終えた一方、WTIは前週金曜から約1.4%下落した。中東の原油輸出は紛争前水準のほぼ98%まで回復しており、実物の原油供給が徐々に正常化していることを示唆している。
⛽ 主要な懸念は精製と完成品にある。中東の精製能力は1日あたり約300万バレルが依然として稼働停止のままで、域内のディーゼル輸出は紛争前水準の約25%にとどまっている。ロシアも10月末までディーゼル輸出の制限を維持している。
📉 米国の留出油(ディスティレート)在庫は1億522万バレルで、5年平均を約14%下回っている。ディーゼルのクラックス(採算)は依然として非常に高い水準にあり、市場は原油そのものの不足よりも、精製製品の不足を織り込んでいることを示している。
🇨🇳 中国は10月のディーゼル、ガソリン、ジェット燃料の輸出を承認しておらず、国際市場への代替供給がさらに細っている。これとは逆に、欧州やその他のG7諸国は、市場の圧力を和らげるために緊急のディーゼル備蓄の活用を検討している。
🚢 ホルムズ海峡は、保険や海上輸送コストが高止まりしているため、引き続き海上で運ばれる原油にリスクプレミアムを織り込ませている。したがって、湾岸の原油輸出の回復は、エネルギーショックが終わったことを意味するわけではない。ボトルネックは、次第に精製能力、輸送、そしてディーゼルの入手可能性へとシフトしてきている。
#EnergyMarkets $CL $NATGAS
🛢 ブレントは1バレル当たり102ドルを上回って週を終えた一方、WTIは前週金曜から約1.4%下落した。中東の原油輸出は紛争前水準のほぼ98%まで回復しており、実物の原油供給が徐々に正常化していることを示唆している。
⛽ 主要な懸念は精製と完成品にある。中東の精製能力は1日あたり約300万バレルが依然として稼働停止のままで、域内のディーゼル輸出は紛争前水準の約25%にとどまっている。ロシアも10月末までディーゼル輸出の制限を維持している。
📉 米国の留出油(ディスティレート)在庫は1億522万バレルで、5年平均を約14%下回っている。ディーゼルのクラックス(採算)は依然として非常に高い水準にあり、市場は原油そのものの不足よりも、精製製品の不足を織り込んでいることを示している。
🇨🇳 中国は10月のディーゼル、ガソリン、ジェット燃料の輸出を承認しておらず、国際市場への代替供給がさらに細っている。これとは逆に、欧州やその他のG7諸国は、市場の圧力を和らげるために緊急のディーゼル備蓄の活用を検討している。
🚢 ホルムズ海峡は、保険や海上輸送コストが高止まりしているため、引き続き海上で運ばれる原油にリスクプレミアムを織り込ませている。したがって、湾岸の原油輸出の回復は、エネルギーショックが終わったことを意味するわけではない。ボトルネックは、次第に精製能力、輸送、そしてディーゼルの入手可能性へとシフトしてきている。
#EnergyMarkets $CL $NATGAS

114
·
--
ブリッシュ
本人確認中
翻訳参照
U.S. grains weaken on inventories and demand, while sugar breaks to an 18-month high
🌽 Corn led the weekly decline after U.S. stocks as of September 1 reached 2.095 billion bushels, above all market estimates and roughly 173 million bushels higher than USDA’s previous projection. December corn lost about 30.5 cents over the week, while drier Midwest weather remained favorable for harvesting and kept near-term supply pressure elevated.
🫘 Soybeans sent a more mixed signal, with stocks at just 315 million bushels, below both market expectations and the year-earlier level. However, soybeans were excluded from the agricultural products covered by the U.S.–China tariff reduction agreement, leaving demand concerns strong enough to outweigh the relatively tighter balance sheet.
🌾 Wheat held up better as inventories remained well below year-ago levels and production came in close to expectations. This helped Chicago wheat avoid the sharper adjustment seen in corn, although a stronger USD and favorable harvest conditions continued to limit upside.
🍬 Sugar moved in the opposite direction, with ICE raw sugar rising toward 19 cents/lb, its highest level in roughly 18 months. Prices were supported by weaker Brazilian output, relatively tight Indian inventories, and the potential for mills to continue favoring ethanol while energy prices remain elevated.
📅 Attention now turns to the October 9 WASDE report. Markets will watch how much of the unexpectedly large corn inventory is incorporated into the 2026/27 balance sheet, while soybeans may still need clearer Chinese buying signals to decouple from broader grain-market pressure.
#Agriculture $TRB $TREE
U.S. grains weaken on inventories and demand, while sugar breaks to an 18-month high
🌽 Corn led the weekly decline after U.S. stocks as of September 1 reached 2.095 billion bushels, above all market estimates and roughly 173 million bushels higher than USDA’s previous projection. December corn lost about 30.5 cents over the week, while drier Midwest weather remained favorable for harvesting and kept near-term supply pressure elevated.
🫘 Soybeans sent a more mixed signal, with stocks at just 315 million bushels, below both market expectations and the year-earlier level. However, soybeans were excluded from the agricultural products covered by the U.S.–China tariff reduction agreement, leaving demand concerns strong enough to outweigh the relatively tighter balance sheet.
🌾 Wheat held up better as inventories remained well below year-ago levels and production came in close to expectations. This helped Chicago wheat avoid the sharper adjustment seen in corn, although a stronger USD and favorable harvest conditions continued to limit upside.
🍬 Sugar moved in the opposite direction, with ICE raw sugar rising toward 19 cents/lb, its highest level in roughly 18 months. Prices were supported by weaker Brazilian output, relatively tight Indian inventories, and the potential for mills to continue favoring ethanol while energy prices remain elevated.
📅 Attention now turns to the October 9 WASDE report. Markets will watch how much of the unexpectedly large corn inventory is incorporated into the 2026/27 balance sheet, while soybeans may still need clearer Chinese buying signals to decouple from broader grain-market pressure.
#Agriculture $TRB $TREE
🌽 Corn led the weekly decline after U.S. stocks as of September 1 reached 2.095 billion bushels, above all market estimates and roughly 173 million bushels higher than USDA’s previous projection. December corn lost about 30.5 cents over the week, while drier Midwest weather remained favorable for harvesting and kept near-term supply pressure elevated.
🫘 Soybeans sent a more mixed signal, with stocks at just 315 million bushels, below both market expectations and the year-earlier level. However, soybeans were excluded from the agricultural products covered by the U.S.–China tariff reduction agreement, leaving demand concerns strong enough to outweigh the relatively tighter balance sheet.
🌾 Wheat held up better as inventories remained well below year-ago levels and production came in close to expectations. This helped Chicago wheat avoid the sharper adjustment seen in corn, although a stronger USD and favorable harvest conditions continued to limit upside.
🍬 Sugar moved in the opposite direction, with ICE raw sugar rising toward 19 cents/lb, its highest level in roughly 18 months. Prices were supported by weaker Brazilian output, relatively tight Indian inventories, and the potential for mills to continue favoring ethanol while energy prices remain elevated.
📅 Attention now turns to the October 9 WASDE report. Markets will watch how much of the unexpectedly large corn inventory is incorporated into the 2026/27 balance sheet, while soybeans may still need clearer Chinese buying signals to decouple from broader grain-market pressure.
#Agriculture $TRB $TREE

1.3k
·
--
翻訳参照
High yields keep markets divided as AI chips continue to support Nasdaq and Nikkei
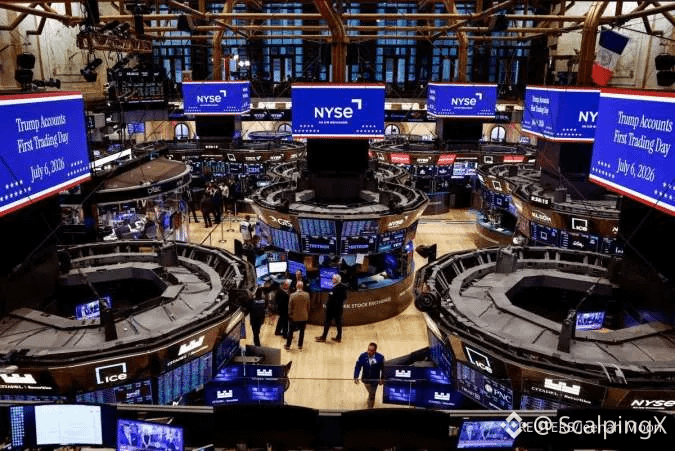
📊 Global equities did not move into a broad risk-off phase during the week of September 28–October 2, but market divergence became increasingly clear. The S&P 500 fell 0.27% and the Dow lost 1.26% for the week, while the Nasdaq still gained 0.45%, supported by technology and semiconductor stocks.
📉 U.S. nonfarm payrolls rose by just 29,000, sharply reducing expectations for a Fed rate hike in October and helping equities recover late in the week. However, the 10-year Treasury yield still finished near 5.28% after reaching 5.34%, showing that pressure from long-term borrowing costs remains elevated.
🔎 Market breadth was also weaker than the major indices suggested, with only around 35% of stocks in the tracked universe advancing during the week. Technology continued to outperform, while financials and healthcare declined more sharply, reflecting continued concentration in a relatively narrow group of market leaders.
💻 A similar pattern appeared across Asia. The Nikkei gained nearly 3% on strength in chip and semiconductor-equipment stocks, while the broader TOPIX declined. Taiwan remained positive, while the Hang Seng, KOSPI and Nifty weakened under pressure from high U.S. yields and thinner regional liquidity.
🇪🇺 Europe continued to underperform the U.S., with the STOXX 600 falling more than 1% and the CAC 40 losing over 2%. Rising French bond yields and a wider spread over German debt kept fiscal risk and financing costs as stronger headwinds than the positive signals coming from economic activity data.
⚖️ Overall, the week was better characterized by valuation divergence than by a broad market sell-off. AI chips and selected growth stocks continued to support major indices, but elevated yields, weak breadth and pressure in Europe suggest that the rally has yet to broaden meaningfully.
#MarketInsight $GOOGLB $MUB $INTCB
High yields keep markets divided as AI chips continue to support Nasdaq and Nikkei
📊 Global equities did not move into a broad risk-off phase during the week of September 28–October 2, but market divergence became increasingly clear. The S&P 500 fell 0.27% and the Dow lost 1.26% for the week, while the Nasdaq still gained 0.45%, supported by technology and semiconductor stocks.
📉 U.S. nonfarm payrolls rose by just 29,000, sharply reducing expectations for a Fed rate hike in October and helping equities recover late in the week. However, the 10-year Treasury yield still finished near 5.28% after reaching 5.34%, showing that pressure from long-term borrowing costs remains elevated.
🔎 Market breadth was also weaker than the major indices suggested, with only around 35% of stocks in the tracked universe advancing during the week. Technology continued to outperform, while financials and healthcare declined more sharply, reflecting continued concentration in a relatively narrow group of market leaders.
💻 A similar pattern appeared across Asia. The Nikkei gained nearly 3% on strength in chip and semiconductor-equipment stocks, while the broader TOPIX declined. Taiwan remained positive, while the Hang Seng, KOSPI and Nifty weakened under pressure from high U.S. yields and thinner regional liquidity.
🇪🇺 Europe continued to underperform the U.S., with the STOXX 600 falling more than 1% and the CAC 40 losing over 2%. Rising French bond yields and a wider spread over German debt kept fiscal risk and financing costs as stronger headwinds than the positive signals coming from economic activity data.
⚖️ Overall, the week was better characterized by valuation divergence than by a broad market sell-off. AI chips and selected growth stocks continued to support major indices, but elevated yields, weak breadth and pressure in Europe suggest that the rally has yet to broaden meaningfully.
#MarketInsight $GOOGLB $MUB $INTCB
📊 Global equities did not move into a broad risk-off phase during the week of September 28–October 2, but market divergence became increasingly clear. The S&P 500 fell 0.27% and the Dow lost 1.26% for the week, while the Nasdaq still gained 0.45%, supported by technology and semiconductor stocks.
📉 U.S. nonfarm payrolls rose by just 29,000, sharply reducing expectations for a Fed rate hike in October and helping equities recover late in the week. However, the 10-year Treasury yield still finished near 5.28% after reaching 5.34%, showing that pressure from long-term borrowing costs remains elevated.
🔎 Market breadth was also weaker than the major indices suggested, with only around 35% of stocks in the tracked universe advancing during the week. Technology continued to outperform, while financials and healthcare declined more sharply, reflecting continued concentration in a relatively narrow group of market leaders.
💻 A similar pattern appeared across Asia. The Nikkei gained nearly 3% on strength in chip and semiconductor-equipment stocks, while the broader TOPIX declined. Taiwan remained positive, while the Hang Seng, KOSPI and Nifty weakened under pressure from high U.S. yields and thinner regional liquidity.
🇪🇺 Europe continued to underperform the U.S., with the STOXX 600 falling more than 1% and the CAC 40 losing over 2%. Rising French bond yields and a wider spread over German debt kept fiscal risk and financing costs as stronger headwinds than the positive signals coming from economic activity data.
⚖️ Overall, the week was better characterized by valuation divergence than by a broad market sell-off. AI chips and selected growth stocks continued to support major indices, but elevated yields, weak breadth and pressure in Europe suggest that the rally has yet to broaden meaningfully.
#MarketInsight $GOOGLB $MUB $INTCB
1
85
·
--
ブリッシュ
米国の利回りとドル高が、物理的な供給の逼迫にもかかわらず金属を圧迫
📉 金は週末にかけて1オンス約4,140ドルで着地し、約3.4%下落。銀やプラチナも弱含んだ。米国のNFPが軟調だったことで、金は金曜に1%超まで一時的に持ち直したが、国債利回りが再び上昇し、DXYが3週連続で上昇したため、リバウンドはすぐに失速した。
🏦 主要な要因は機会費用だった。米国10年債利回りは2002年以来の高水準に達し、利回りのない金属をまず圧迫。一方で中東の緊張は、安全資産としての金への持続的な需要を生むというよりも、主に原油と利回りを通じて波及した。
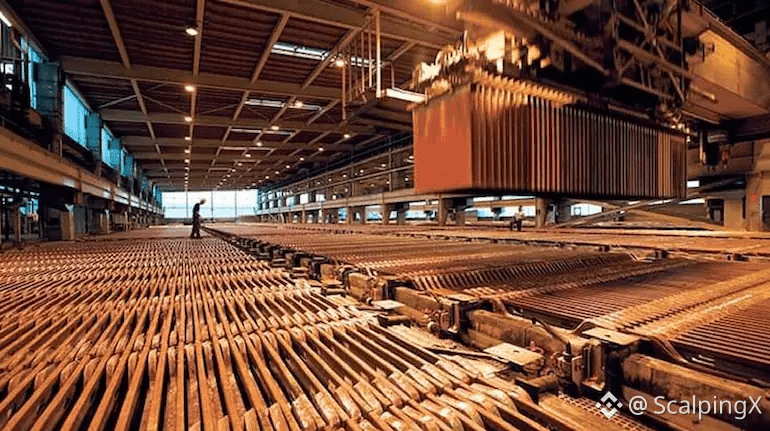
⛏️ LME銅は、現物条件が比較的タイトな状態を保っていたにもかかわらず、約2%下落して1トン約14,300ドルになった。SHFE在庫は38,744トンと、4カ月で79%減。中国の精錬所メンテナンスやチリでの混乱が、供給面の背景をさらに押し下げた。
🏭 アルミニウムにも目立つズレが見られた。LME在庫は非常に低い水準にとどまり、年間の湾岸(Gulf)供給能力のうち約56万トンに影響が出ているにもかかわらず、価格は6営業日で4%超下落し、先物曲線はコンタンゴのままだった。市場は現在、供給リスクよりも需要やマクロ環境をより重く織り込んでいる。
🧱 シンガポールの鉄鉱石は、より長期の安値近辺まで下げて1トン約91ドルに後退。中国がゴールデンウィークの休日に入ったことや、大手製鉄所がコークス価格を引き下げたことが背景だ。今後のセッションで流動性が薄いと、ベースメタルは、休日明けに中国の現物需要が戻るまで、ドルや原油、供給関連のヘッドラインに対して一段と敏感になり得る。
#Metals $XAU $XAG $COPPER
米国の利回りとドル高が、物理的な供給の逼迫にもかかわらず金属を圧迫
📉 金は週末にかけて1オンス約4,140ドルで着地し、約3.4%下落。銀やプラチナも弱含んだ。米国のNFPが軟調だったことで、金は金曜に1%超まで一時的に持ち直したが、国債利回りが再び上昇し、DXYが3週連続で上昇したため、リバウンドはすぐに失速した。
🏦 主要な要因は機会費用だった。米国10年債利回りは2002年以来の高水準に達し、利回りのない金属をまず圧迫。一方で中東の緊張は、安全資産としての金への持続的な需要を生むというよりも、主に原油と利回りを通じて波及した。
⛏️ LME銅は、現物条件が比較的タイトな状態を保っていたにもかかわらず、約2%下落して1トン約14,300ドルになった。SHFE在庫は38,744トンと、4カ月で79%減。中国の精錬所メンテナンスやチリでの混乱が、供給面の背景をさらに押し下げた。
🏭 アルミニウムにも目立つズレが見られた。LME在庫は非常に低い水準にとどまり、年間の湾岸(Gulf)供給能力のうち約56万トンに影響が出ているにもかかわらず、価格は6営業日で4%超下落し、先物曲線はコンタンゴのままだった。市場は現在、供給リスクよりも需要やマクロ環境をより重く織り込んでいる。
🧱 シンガポールの鉄鉱石は、より長期の安値近辺まで下げて1トン約91ドルに後退。中国がゴールデンウィークの休日に入ったことや、大手製鉄所がコークス価格を引き下げたことが背景だ。今後のセッションで流動性が薄いと、ベースメタルは、休日明けに中国の現物需要が戻るまで、ドルや原油、供給関連のヘッドラインに対して一段と敏感になり得る。
#Metals $XAU $XAG $COPPER
📉 金は週末にかけて1オンス約4,140ドルで着地し、約3.4%下落。銀やプラチナも弱含んだ。米国のNFPが軟調だったことで、金は金曜に1%超まで一時的に持ち直したが、国債利回りが再び上昇し、DXYが3週連続で上昇したため、リバウンドはすぐに失速した。
🏦 主要な要因は機会費用だった。米国10年債利回りは2002年以来の高水準に達し、利回りのない金属をまず圧迫。一方で中東の緊張は、安全資産としての金への持続的な需要を生むというよりも、主に原油と利回りを通じて波及した。
⛏️ LME銅は、現物条件が比較的タイトな状態を保っていたにもかかわらず、約2%下落して1トン約14,300ドルになった。SHFE在庫は38,744トンと、4カ月で79%減。中国の精錬所メンテナンスやチリでの混乱が、供給面の背景をさらに押し下げた。
🏭 アルミニウムにも目立つズレが見られた。LME在庫は非常に低い水準にとどまり、年間の湾岸(Gulf)供給能力のうち約56万トンに影響が出ているにもかかわらず、価格は6営業日で4%超下落し、先物曲線はコンタンゴのままだった。市場は現在、供給リスクよりも需要やマクロ環境をより重く織り込んでいる。
🧱 シンガポールの鉄鉱石は、より長期の安値近辺まで下げて1トン約91ドルに後退。中国がゴールデンウィークの休日に入ったことや、大手製鉄所がコークス価格を引き下げたことが背景だ。今後のセッションで流動性が薄いと、ベースメタルは、休日明けに中国の現物需要が戻るまで、ドルや原油、供給関連のヘッドラインに対して一段と敏感になり得る。
#Metals $XAU $XAG $COPPER

250
·
--
ブリッシュ
翻訳参照
USD rises for a third straight week despite sharply weaker US payrolls
📈 The DXY ended the week around 101.93, up roughly 0.94% despite falling on Friday after the jobs report. September nonfarm payrolls increased by only 29,000, unemployment rose to 4.2%, and the previous two months were revised down by a combined 60,000, significantly reducing expectations for another Fed rate hike in October.
📉 However, weaker labor data was not enough to reverse the dollar’s broader trend. The US 10-year Treasury yield climbed to around 5.34% during the week and, after dropping sharply following NFP, quickly rebounded as oil prices and Middle East risks continued to sustain the inflation premium. Markets therefore shifted from expecting an immediate Fed hike toward a delay, rather than pricing in a new easing cycle.
🇪🇺 EUR/USD fell about 1.2% over the week to around 1.1256. The euro faced simultaneous pressure from higher energy costs, a less hawkish ECB outlook and French fiscal risks, while the France–Germany 10-year yield spread widened above 150 basis points. Higher-than-expected Eurozone inflation also failed to generate a meaningful positive reaction in the euro.
🇯🇵 USD/JPY remained near 158 as the US–Japan yield gap continued to support the dollar. Tokyo inflation accelerated, but markets still see limited chances of a BoJ hike in October, while the 159–160 area is increasingly constrained by intervention warnings from Japanese authorities.
⛽ The broader structure of the week shows that FX remains more sensitive to yields and energy than to a single labor-market release. NFP slowed the dollar’s momentum in the short term, but it was not enough to remove the greenback’s relative advantage over currencies more exposed to the energy shock.
#ForexInsights $TRX
USD rises for a third straight week despite sharply weaker US payrolls
📈 The DXY ended the week around 101.93, up roughly 0.94% despite falling on Friday after the jobs report. September nonfarm payrolls increased by only 29,000, unemployment rose to 4.2%, and the previous two months were revised down by a combined 60,000, significantly reducing expectations for another Fed rate hike in October.
📉 However, weaker labor data was not enough to reverse the dollar’s broader trend. The US 10-year Treasury yield climbed to around 5.34% during the week and, after dropping sharply following NFP, quickly rebounded as oil prices and Middle East risks continued to sustain the inflation premium. Markets therefore shifted from expecting an immediate Fed hike toward a delay, rather than pricing in a new easing cycle.
🇪🇺 EUR/USD fell about 1.2% over the week to around 1.1256. The euro faced simultaneous pressure from higher energy costs, a less hawkish ECB outlook and French fiscal risks, while the France–Germany 10-year yield spread widened above 150 basis points. Higher-than-expected Eurozone inflation also failed to generate a meaningful positive reaction in the euro.
🇯🇵 USD/JPY remained near 158 as the US–Japan yield gap continued to support the dollar. Tokyo inflation accelerated, but markets still see limited chances of a BoJ hike in October, while the 159–160 area is increasingly constrained by intervention warnings from Japanese authorities.
⛽ The broader structure of the week shows that FX remains more sensitive to yields and energy than to a single labor-market release. NFP slowed the dollar’s momentum in the short term, but it was not enough to remove the greenback’s relative advantage over currencies more exposed to the energy shock.
#ForexInsights $TRX
📈 The DXY ended the week around 101.93, up roughly 0.94% despite falling on Friday after the jobs report. September nonfarm payrolls increased by only 29,000, unemployment rose to 4.2%, and the previous two months were revised down by a combined 60,000, significantly reducing expectations for another Fed rate hike in October.
📉 However, weaker labor data was not enough to reverse the dollar’s broader trend. The US 10-year Treasury yield climbed to around 5.34% during the week and, after dropping sharply following NFP, quickly rebounded as oil prices and Middle East risks continued to sustain the inflation premium. Markets therefore shifted from expecting an immediate Fed hike toward a delay, rather than pricing in a new easing cycle.
🇪🇺 EUR/USD fell about 1.2% over the week to around 1.1256. The euro faced simultaneous pressure from higher energy costs, a less hawkish ECB outlook and French fiscal risks, while the France–Germany 10-year yield spread widened above 150 basis points. Higher-than-expected Eurozone inflation also failed to generate a meaningful positive reaction in the euro.
🇯🇵 USD/JPY remained near 158 as the US–Japan yield gap continued to support the dollar. Tokyo inflation accelerated, but markets still see limited chances of a BoJ hike in October, while the 159–160 area is increasingly constrained by intervention warnings from Japanese authorities.
⛽ The broader structure of the week shows that FX remains more sensitive to yields and energy than to a single labor-market release. NFP slowed the dollar’s momentum in the short term, but it was not enough to remove the greenback’s relative advantage over currencies more exposed to the energy shock.
#ForexInsights $TRX

9
·
--
ブリッシュ
G7は備蓄から1億バレルを放出することに合意し、ディーゼルを早期に優先
🛢 G7メンバーは、IEAを通じて4か月間にわたり、緊急備蓄から約1億バレルを放出するために協調することで合意した。開始は即時。ディーゼル供給の相当部分は、燃料市場の圧力を和らげるため、最初の20日間に前倒しで投入される見通しだ。
📉 最終合意の前に、米国のディーゼル先物は約3.25%下落し、欧州のディーゼルはほぼ5.75%下落した。G7メンバーはまた、相互間でエネルギー輸出を制限しないこと、ならびに製油所のメンテナンス日程を調整することも約束した。
⚠️ ただし、この声明は「1億バレル」のうち、どれだけが本当に新規の供給を意味するのかを明確に示していない。量の一部は、3月に発表されたIEAの約束と重複する可能性がある。
🔎 現物のバレルが速やかに市場に出れば短期的な価格圧力は緩和し得るが、根本的なリスクは製油所の能力と、実際のディーゼル供給不足にある。
#EnergyMarkets $CL
G7は備蓄から1億バレルを放出することに合意し、ディーゼルを早期に優先
🛢 G7メンバーは、IEAを通じて4か月間にわたり、緊急備蓄から約1億バレルを放出するために協調することで合意した。開始は即時。ディーゼル供給の相当部分は、燃料市場の圧力を和らげるため、最初の20日間に前倒しで投入される見通しだ。
📉 最終合意の前に、米国のディーゼル先物は約3.25%下落し、欧州のディーゼルはほぼ5.75%下落した。G7メンバーはまた、相互間でエネルギー輸出を制限しないこと、ならびに製油所のメンテナンス日程を調整することも約束した。
⚠️ ただし、この声明は「1億バレル」のうち、どれだけが本当に新規の供給を意味するのかを明確に示していない。量の一部は、3月に発表されたIEAの約束と重複する可能性がある。
🔎 現物のバレルが速やかに市場に出れば短期的な価格圧力は緩和し得るが、根本的なリスクは製油所の能力と、実際のディーゼル供給不足にある。
#EnergyMarkets $CL
🛢 G7メンバーは、IEAを通じて4か月間にわたり、緊急備蓄から約1億バレルを放出するために協調することで合意した。開始は即時。ディーゼル供給の相当部分は、燃料市場の圧力を和らげるため、最初の20日間に前倒しで投入される見通しだ。
📉 最終合意の前に、米国のディーゼル先物は約3.25%下落し、欧州のディーゼルはほぼ5.75%下落した。G7メンバーはまた、相互間でエネルギー輸出を制限しないこと、ならびに製油所のメンテナンス日程を調整することも約束した。
⚠️ ただし、この声明は「1億バレル」のうち、どれだけが本当に新規の供給を意味するのかを明確に示していない。量の一部は、3月に発表されたIEAの約束と重複する可能性がある。
🔎 現物のバレルが速やかに市場に出れば短期的な価格圧力は緩和し得るが、根本的なリスクは製油所の能力と、実際のディーゼル供給不足にある。
#EnergyMarkets $CL

118
·
--
ブリッシュ
強い米ドルと弱い中国の需要が重しとなり、銅が下落
📉 LME銅は1トン当たり約14,300ドルで取引されており、今週は約2〜2.3%下落しています。米ドルが17か月ぶりの高値に達したこと、エネルギーコストが高止まりしていること、そしてホリデー期間中の弱い中国の景況感が背景です。
⛏️ 現在の圧力は、供給要因というよりマクロ主導のようです。チリの銅生産は8月に12.8%減少しました。一方、エスコンディーダでは監督者が契約提案を拒否したことで労働リスクがなお残っていますが、ストはまだ始まっていません。
🏭 鉄鉱石は、中国の鉄鋼需要が鈍化し、製鉄所のマージンが弱いままであること、そして連休前の在庫積み増しが概ね一巡したことから、1トン当たり約91〜92ドルまでさらに下げています。
📊 今回の動きは、銅の需給ひっ迫(供給のタイトさ)という物語がまだ反転したことを示してはいません。今日の米雇用者数(ペイロール)が、ドル、利回り、そして景気敏感な金属にとって次の重要なカタリストになります。
#Copper $COPPER
強い米ドルと弱い中国の需要が重しとなり、銅が下落
📉 LME銅は1トン当たり約14,300ドルで取引されており、今週は約2〜2.3%下落しています。米ドルが17か月ぶりの高値に達したこと、エネルギーコストが高止まりしていること、そしてホリデー期間中の弱い中国の景況感が背景です。
⛏️ 現在の圧力は、供給要因というよりマクロ主導のようです。チリの銅生産は8月に12.8%減少しました。一方、エスコンディーダでは監督者が契約提案を拒否したことで労働リスクがなお残っていますが、ストはまだ始まっていません。
🏭 鉄鉱石は、中国の鉄鋼需要が鈍化し、製鉄所のマージンが弱いままであること、そして連休前の在庫積み増しが概ね一巡したことから、1トン当たり約91〜92ドルまでさらに下げています。
📊 今回の動きは、銅の需給ひっ迫(供給のタイトさ)という物語がまだ反転したことを示してはいません。今日の米雇用者数(ペイロール)が、ドル、利回り、そして景気敏感な金属にとって次の重要なカタリストになります。
#Copper $COPPER
📉 LME銅は1トン当たり約14,300ドルで取引されており、今週は約2〜2.3%下落しています。米ドルが17か月ぶりの高値に達したこと、エネルギーコストが高止まりしていること、そしてホリデー期間中の弱い中国の景況感が背景です。
⛏️ 現在の圧力は、供給要因というよりマクロ主導のようです。チリの銅生産は8月に12.8%減少しました。一方、エスコンディーダでは監督者が契約提案を拒否したことで労働リスクがなお残っていますが、ストはまだ始まっていません。
🏭 鉄鉱石は、中国の鉄鋼需要が鈍化し、製鉄所のマージンが弱いままであること、そして連休前の在庫積み増しが概ね一巡したことから、1トン当たり約91〜92ドルまでさらに下げています。
📊 今回の動きは、銅の需給ひっ迫(供給のタイトさ)という物語がまだ反転したことを示してはいません。今日の米雇用者数(ペイロール)が、ドル、利回り、そして景気敏感な金属にとって次の重要なカタリストになります。
#Copper $COPPER
63
·
--
ブリッシュ
翻訳参照
$SOXLB
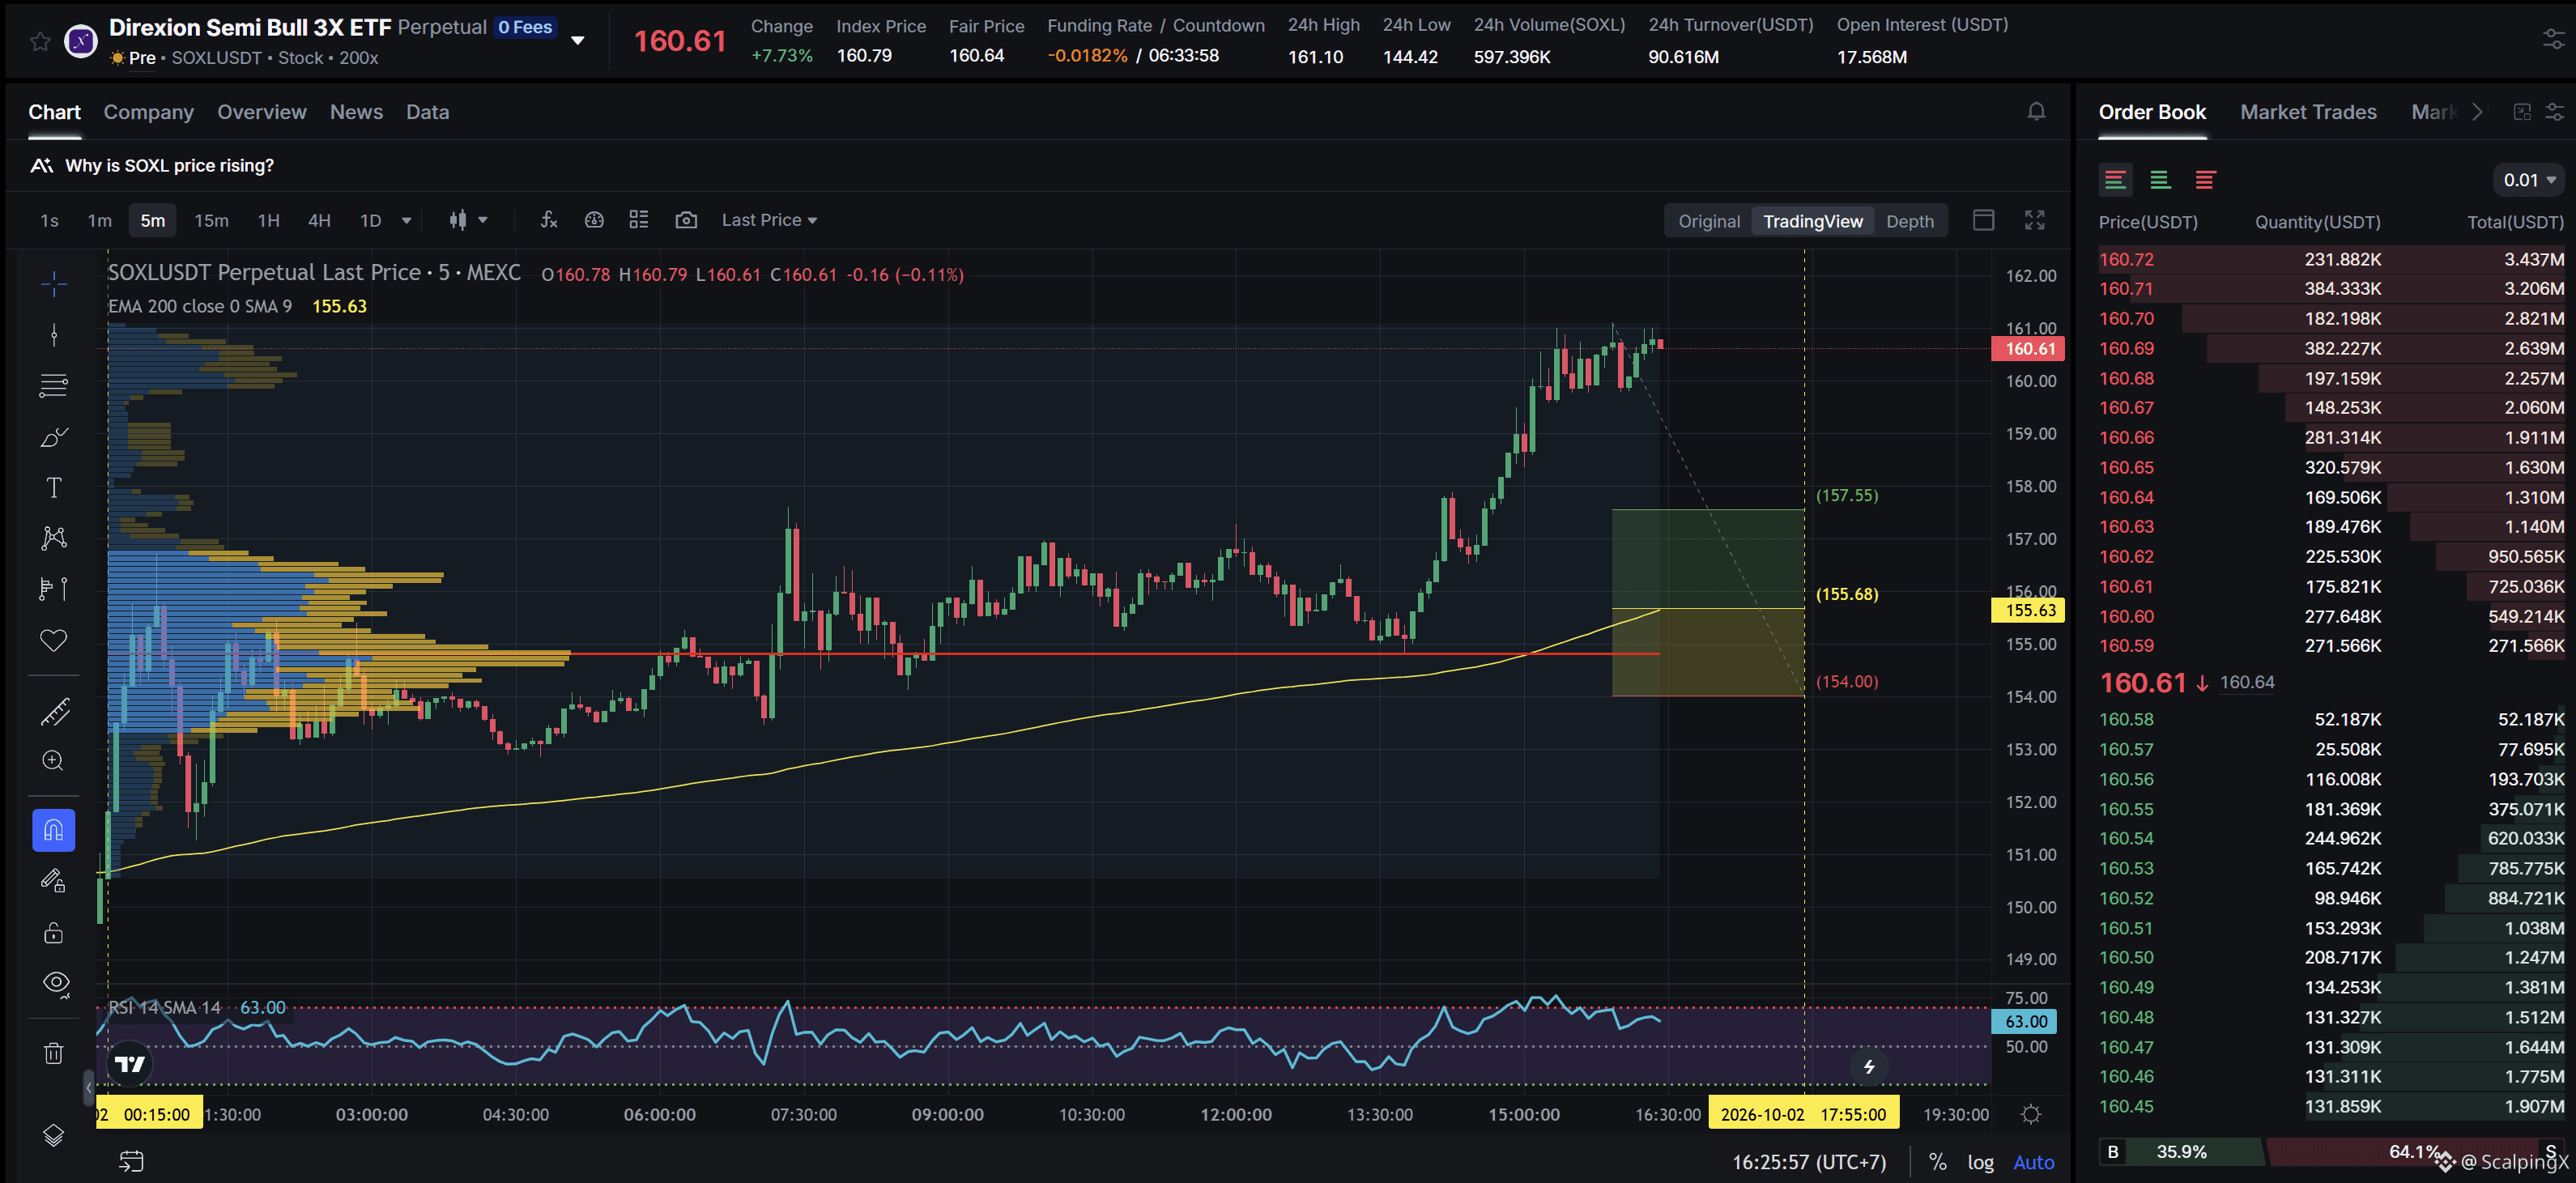
SC02 M5 - pending Long order. Entry contains POC + not affected by any weak zone, the current support zone is approximately 1.06% wide. The uptrend has lasted 16 hours 10 minutes, with a maximum recorded price increase of 6.90%. If price loses this support zone, the trend is highly likely to reverse downward.
$SOXLB
SC02 M5 - pending Long order. Entry contains POC + not affected by any weak zone, the current support zone is approximately 1.06% wide. The uptrend has lasted 16 hours 10 minutes, with a maximum recorded price increase of 6.90%. If price loses this support zone, the trend is highly likely to reverse downward.
SC02 M5 - pending Long order. Entry contains POC + not affected by any weak zone, the current support zone is approximately 1.06% wide. The uptrend has lasted 16 hours 10 minutes, with a maximum recorded price increase of 6.90%. If price loses this support zone, the trend is highly likely to reverse downward.
28
·
--
ブリッシュ
Amazonは、Nvidiaのチップ800億ドル分をSPVへ移すことを検討
💻 Amazonは、約80億ドル相当のNvidia Grace Blackwellチップを特別目的事業体(SPV)に移す計画を検討しており、その一方でチップは同社のデータセンターネットワーク内で引き続き使用されるとされています。取引はまだ確定しておらず、AmazonもNvidiaもこれを確認していません。
🏦 その仕組みは、セール・アンド・リースバック型に似ています。資産の所有権はSPVへ移りますが、Amazonは運用のため引き続きそれらをリースします。これにより、AIの計算能力を低下させることなく、Amazonのバランスシート上で直接保有する資本の額を抑えられる可能性があります。
📊 実施されれば、この構造はAI投資サイクルの新しい資金調達モデルを示すシグナルになり得ます。つまり、民間クレジットやSPVが、GPUやデータセンター・インフラのファイナンスにおいてより大きな役割を担うことになります。
⚠️ 注目すべきポイントは、保証条件とチップの残存価値です。GPUの更新サイクルが急速に進む場合、貸し手はより強い保護を求める可能性があります。
#AIInfrastructure $XRP
Amazonは、Nvidiaのチップ800億ドル分をSPVへ移すことを検討
💻 Amazonは、約80億ドル相当のNvidia Grace Blackwellチップを特別目的事業体(SPV)に移す計画を検討しており、その一方でチップは同社のデータセンターネットワーク内で引き続き使用されるとされています。取引はまだ確定しておらず、AmazonもNvidiaもこれを確認していません。
🏦 その仕組みは、セール・アンド・リースバック型に似ています。資産の所有権はSPVへ移りますが、Amazonは運用のため引き続きそれらをリースします。これにより、AIの計算能力を低下させることなく、Amazonのバランスシート上で直接保有する資本の額を抑えられる可能性があります。
📊 実施されれば、この構造はAI投資サイクルの新しい資金調達モデルを示すシグナルになり得ます。つまり、民間クレジットやSPVが、GPUやデータセンター・インフラのファイナンスにおいてより大きな役割を担うことになります。
⚠️ 注目すべきポイントは、保証条件とチップの残存価値です。GPUの更新サイクルが急速に進む場合、貸し手はより強い保護を求める可能性があります。
#AIInfrastructure $XRP
💻 Amazonは、約80億ドル相当のNvidia Grace Blackwellチップを特別目的事業体(SPV)に移す計画を検討しており、その一方でチップは同社のデータセンターネットワーク内で引き続き使用されるとされています。取引はまだ確定しておらず、AmazonもNvidiaもこれを確認していません。
🏦 その仕組みは、セール・アンド・リースバック型に似ています。資産の所有権はSPVへ移りますが、Amazonは運用のため引き続きそれらをリースします。これにより、AIの計算能力を低下させることなく、Amazonのバランスシート上で直接保有する資本の額を抑えられる可能性があります。
📊 実施されれば、この構造はAI投資サイクルの新しい資金調達モデルを示すシグナルになり得ます。つまり、民間クレジットやSPVが、GPUやデータセンター・インフラのファイナンスにおいてより大きな役割を担うことになります。
⚠️ 注目すべきポイントは、保証条件とチップの残存価値です。GPUの更新サイクルが急速に進む場合、貸し手はより強い保護を求める可能性があります。
#AIInfrastructure $XRP

76
·
--
ブリッシュ
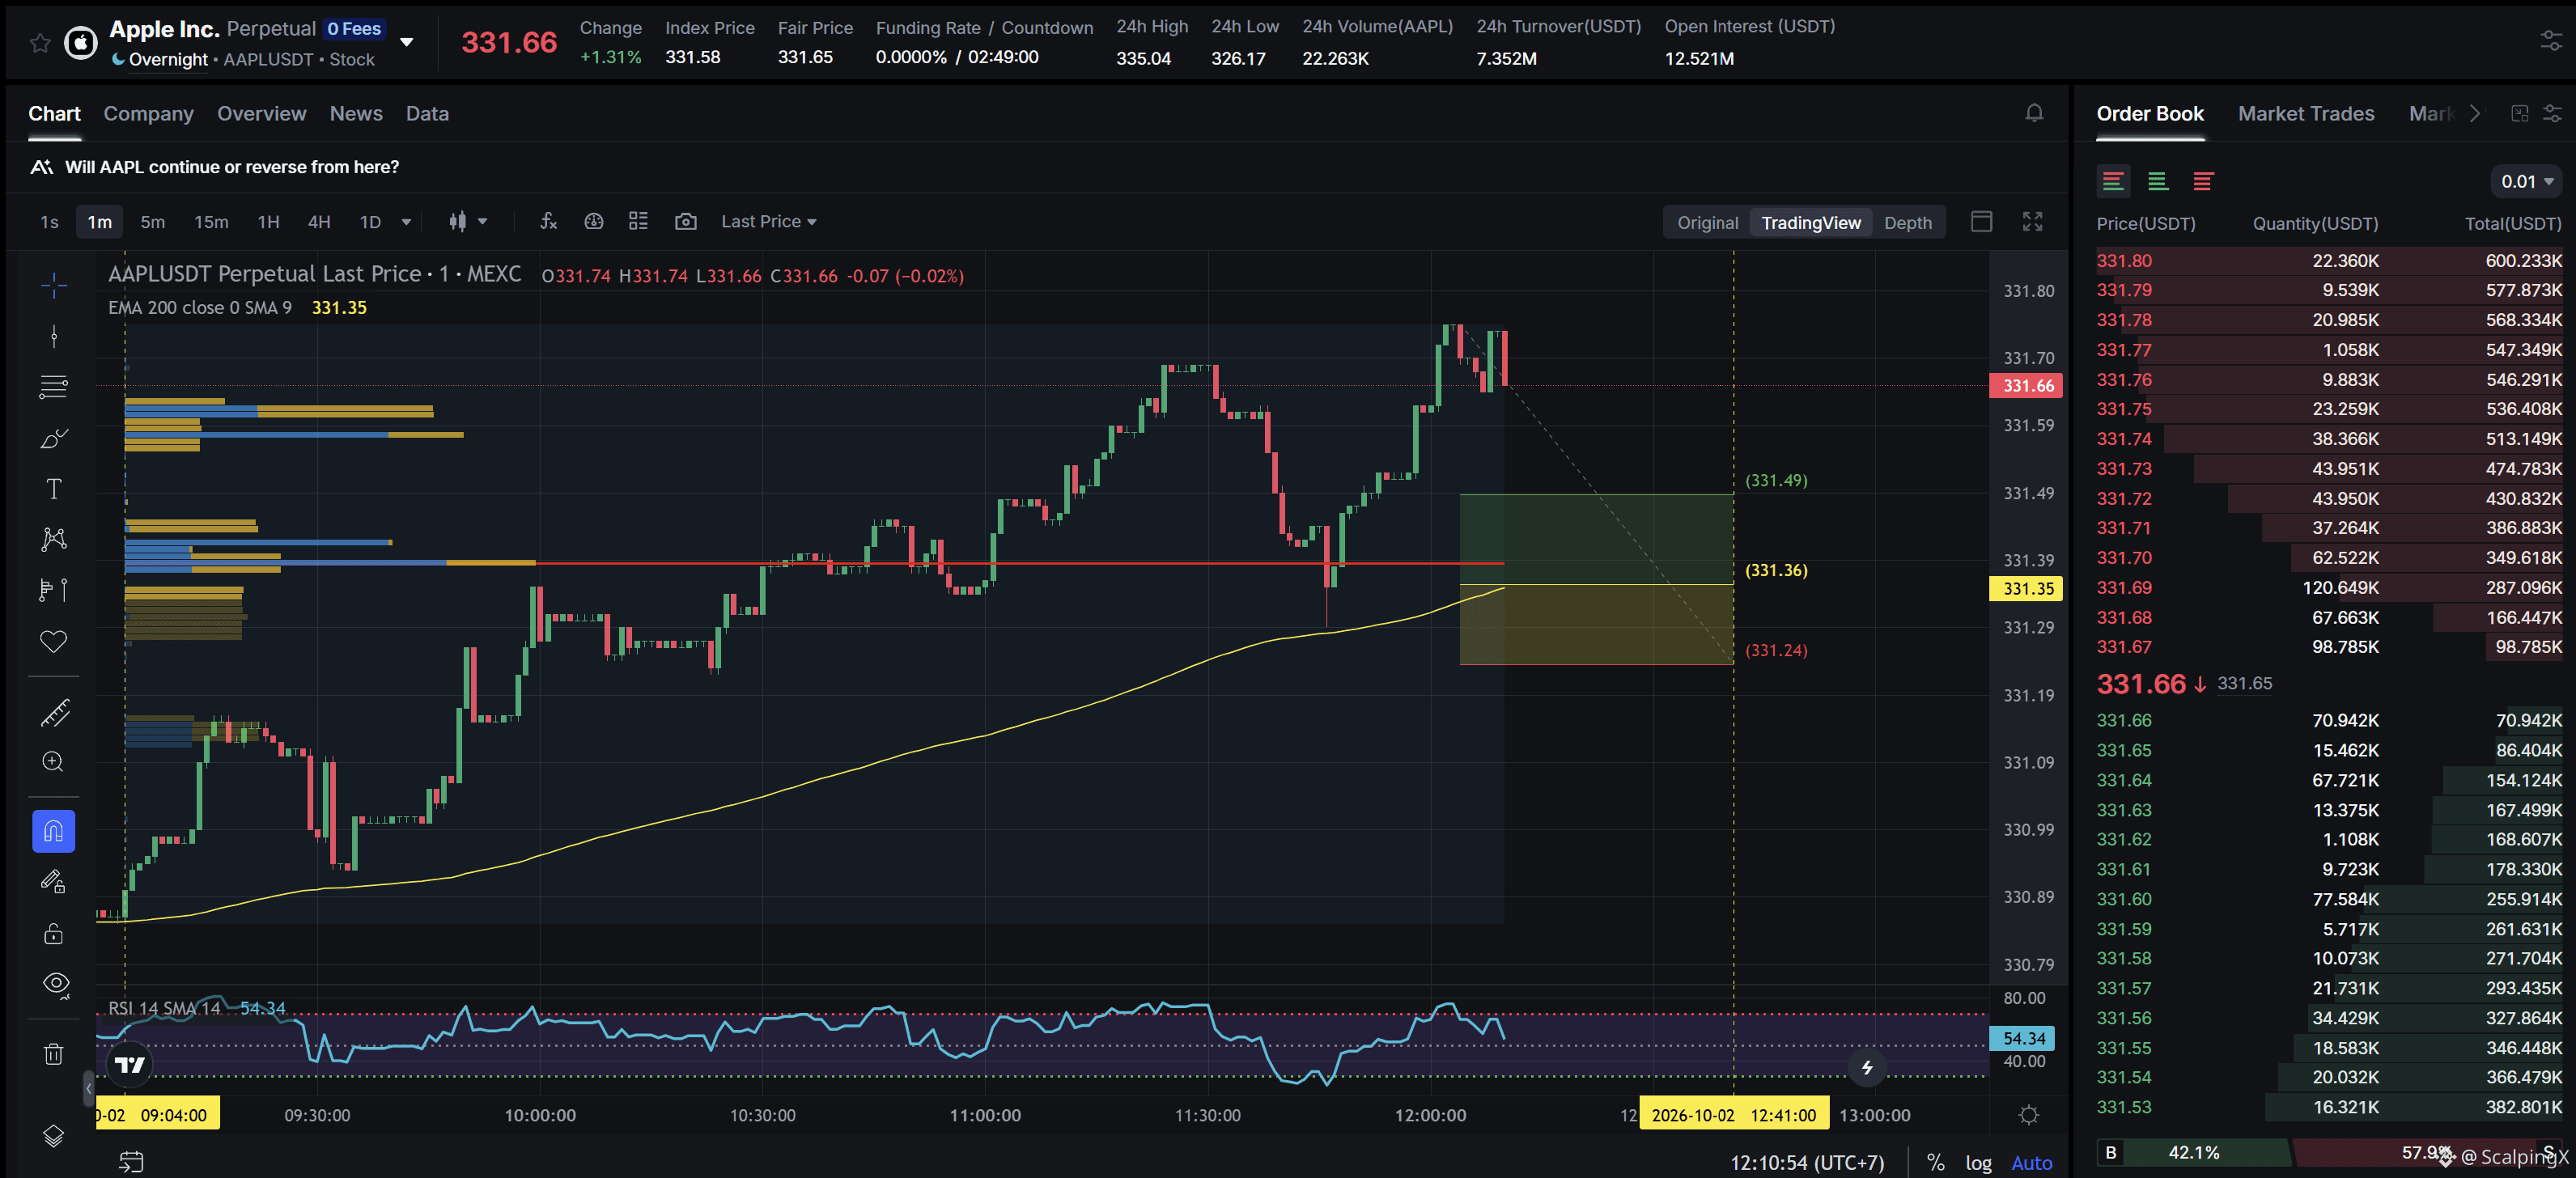
$AAPL - 時価総額 4.82T$
SC02 M1 - 長期注文待ち。エントリーはLVN内にあり、いかなる弱いゾーンにも影響されません。現在のサポートゾーンの幅は約0.04%です。上昇トレンドは3時間8分継続しており、記録された最大の価格上昇は0.27%でした。このサポートゾーンを価格が失う場合、トレンドは下方向へ反転する可能性が非常に高いです。
$AAPL - 時価総額 4.82T$
SC02 M1 - 長期注文待ち。エントリーはLVN内にあり、いかなる弱いゾーンにも影響されません。現在のサポートゾーンの幅は約0.04%です。上昇トレンドは3時間8分継続しており、記録された最大の価格上昇は0.27%でした。このサポートゾーンを価格が失う場合、トレンドは下方向へ反転する可能性が非常に高いです。
SC02 M1 - 長期注文待ち。エントリーはLVN内にあり、いかなる弱いゾーンにも影響されません。現在のサポートゾーンの幅は約0.04%です。上昇トレンドは3時間8分継続しており、記録された最大の価格上昇は0.27%でした。このサポートゾーンを価格が失う場合、トレンドは下方向へ反転する可能性が非常に高いです。
55
·
--
ブリッシュ
製造業の物価上昇圧力が高まり、賃金支払い前の局面でも米新規失業保険申請件数は20万を下回った
📉 9月26日までの週の米新規失業保険申請件数は197,000件に低下し、20万件の予想を下回った。これにより、20万件を下回るのは3週連続となる。継続受給者数も170万1000件に減少し、2023年4月以来の低水準となった。
🏭 チャレンジャーのデータによると、米企業は9月に43,281件の雇用削減を発表した。これは8月から18%減、前年同月から20%減。雇用は比較的慎重なままである一方、レイオフは限定的であることを示唆している。
📈 一方で、ISM製造業景況指数は54.5で横ばいとなり、支払価格指数は71.1から77.9へと急上昇した。まだ大きく悪化していない雇用環境と、より強い投入コストの圧力が組み合わさり、FRBが金融緩和に踏み切る余地を圧迫している。
⏳ 本日後半に予定される9月の雇用統計(給与支払い分)が、労働環境が本当に冷え込んでいるのかどうかの次の大きな試金石となる。
#USJobs $BNB
製造業の物価上昇圧力が高まり、賃金支払い前の局面でも米新規失業保険申請件数は20万を下回った
📉 9月26日までの週の米新規失業保険申請件数は197,000件に低下し、20万件の予想を下回った。これにより、20万件を下回るのは3週連続となる。継続受給者数も170万1000件に減少し、2023年4月以来の低水準となった。
🏭 チャレンジャーのデータによると、米企業は9月に43,281件の雇用削減を発表した。これは8月から18%減、前年同月から20%減。雇用は比較的慎重なままである一方、レイオフは限定的であることを示唆している。
📈 一方で、ISM製造業景況指数は54.5で横ばいとなり、支払価格指数は71.1から77.9へと急上昇した。まだ大きく悪化していない雇用環境と、より強い投入コストの圧力が組み合わさり、FRBが金融緩和に踏み切る余地を圧迫している。
⏳ 本日後半に予定される9月の雇用統計(給与支払い分)が、労働環境が本当に冷え込んでいるのかどうかの次の大きな試金石となる。
#USJobs $BNB
📉 9月26日までの週の米新規失業保険申請件数は197,000件に低下し、20万件の予想を下回った。これにより、20万件を下回るのは3週連続となる。継続受給者数も170万1000件に減少し、2023年4月以来の低水準となった。
🏭 チャレンジャーのデータによると、米企業は9月に43,281件の雇用削減を発表した。これは8月から18%減、前年同月から20%減。雇用は比較的慎重なままである一方、レイオフは限定的であることを示唆している。
📈 一方で、ISM製造業景況指数は54.5で横ばいとなり、支払価格指数は71.1から77.9へと急上昇した。まだ大きく悪化していない雇用環境と、より強い投入コストの圧力が組み合わさり、FRBが金融緩和に踏み切る余地を圧迫している。
⏳ 本日後半に予定される9月の雇用統計(給与支払い分)が、労働環境が本当に冷え込んでいるのかどうかの次の大きな試金石となる。
#USJobs $BNB

154
ログインして、さらにコンテンツを読む
厳選トピックで世界の暗号資産トレーダーの仲間入り
⚡️ 暗号資産に関する最新かつ有益な情報が見つかります。
💬 世界最大の暗号資産取引所から信頼されています。
👍 認証を受けたクリエイターから、有益なインサイトを得られます。
メール / 電話番号
トレンドトピック
ZcashETFPostsFirstWeeklyOutflow$93.6M
閲覧回数 24,152
66人が討論中
#ZcashETFPostsFirstWeeklyOutflow$93.6M 📊 グレイスケールのスポット・ジーキャッシュ(ZEC)ETF、週次で9,360万ドルの資金流出を記録
機関投資家の資金フローに新たなダイナミクスが見え始めています。グレイスケールのスポットZcash ETFは、初の大きな週次ネット資金流出を記録したばかりで、これまでの強い立ち上がりの勢いからの注目すべき変化を示しています。
🔹数字 グレイスケールのスポットZEC ETF(ティッカー:ZCSH)は、過去1週間で約9,360万ドルのネット流出を記録しました。特筆すべき引き出しは9月下旬と10月上旬に集中していました。
🔹 背景 これは堅調な初期局面に続く動きです。グレイスケールのZcash Trustから転換し、8月下旬にNYSE Arcaへ上場した後、このファンドは9月中旬までに累計でネット流入が2億7100万ドルに達していました。
💡 市場への影響分析
•短期的なダイナミクス 大型ETFの資金流出は、償還請求に対応するためにファンドが保有を調整する過程で、基礎となる資産に一時的な売り圧力をもたらす可能性があります。
•センチメント&リバランス この下落は、ジーキャッシュの長期的な有用性やプライバシー重視の価値提案が根本的に変わったことというより、初期の機関投資家による通常の利確、あるいはポートフォリオのリバランスを反映しているのかもしれません。
•エコシステムの注目点 市場参加者は、これがZCSHに特有の一過性の出来事なのか、それともプライバシー志向のデジタル資産に対する機関の食欲が広く冷え込んでいることを示唆するのかを注視します。
💬 あなたの見解は? この週次の資金流出を、強いスタートの後の健全な市場調整と見ますか?それとも、プライバシー・コインへの向けた機関のセンチメントが変化しているサインだと見ますか?下のコメント欄であなたの考えを聞かせてください!
#Zcash #ZEC #CryptoETF #InstitutionalCrypto #MarketUpdate
これは教育目的のみです。投資助言ではありません(NFA)。常に自己調査(DYOR)を行ってください。
$GLMR $QI $ONE
piknkkk
·いいね:0件
·閲覧回数 45
GreekPoliceBustCryptoScamRingArrest17
閲覧回数 34,222
365人が討論中
BitcoinRejectedAt$87K
閲覧回数 101,170
127人が討論中