
蛋挞7x
336 Posts

蛋挞7x
Report
Block User
32 Following
41 Followers
27 Liked
Posts
·
--
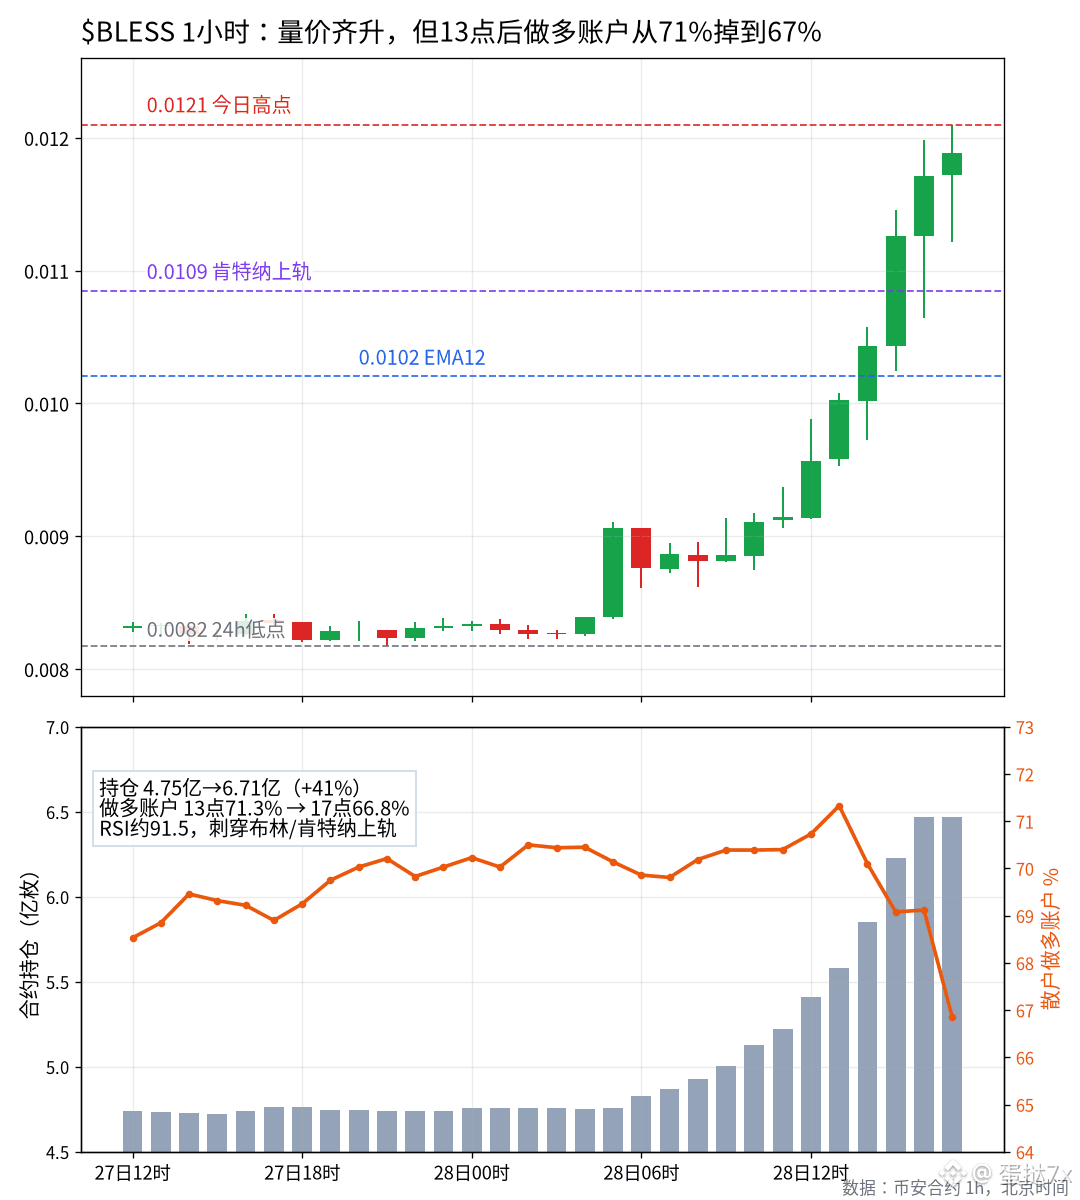
$BLESS The contract is up about 43% over the past 24 hours, with roughly $37.5 million in trading volume. During the session, it climbed from 0.0082 to a high of 0.0121. The 5 a.m. hourly candle rose from 0.0084 to 0.0091, then price kept grinding higher, touching 0.0120 at 4 p.m. and hovering around 0.0119 at 5 p.m. Since last night, open interest has grown from about 475 million tokens to roughly 671 million in real time. Price and volume are both rising—the kind of action the market can easily read as a healthy breakout with the trend now established.
But the latter part of the move tells a very different story. At 1 p.m., when the price was still around 0.010, the share of retail accounts holding long positions peaked at 71.3%. After that, the price rose another roughly 19% by 5 p.m., reaching a high of 0.0121, but the share of long accounts fell to 66.8%, while large traders’ long positioning stayed pinned at around 56%. Open interest is still making new highs, but the number of accounts paying to hold longs is shrinking. Unlike $XAN this afternoon, where deeply negative funding meant shorts were paying to hold on, BLESS funding is still positive, so longs are paying—but there are fewer of them now, rather than more piling in to confirm the breakout.
The mechanism is simple: price and volume are confirming the direction, but the account structure is already retreating. Whoever is still paying to hold a position in an extremely overbought zone is the one who’ll feel the pain first on a pullback.
Technically, the 1-hour RSI is around 91.5. Price has simultaneously pierced the upper Bollinger Band at 0.0116 and the upper Keltner Channel at 0.0109. The EMA12 is at 0.0102, the EMA50 at 0.0089, and ATR is about 4.1%. The structure is still holding above the 12-period moving average, but the RSI has entered an exceptionally rare extreme zone. This isn’t quiet consolidation in a range; volatility has already expanded. The invalidation condition is clear: only if price regains and holds above 0.012 while the share of retail long accounts climbs back above 70% would that count as bulls retaking control of this move.
I’m treating this stretch around 0.012 as an overheated spike, and I’m not adding to my position. On a pullback, I’ll first watch whether the upper Keltner Channel at 0.0109 can turn into support. If it can’t hold, the next level is the 12-period moving average at 0.0102. Until open interest falls back below 550 million tokens and RSI drops below 70, I won’t treat this stretch as the start of a new base. I have no position in BLESS here.
$BLESS #合约 #Overbought
$BLESS The contract is up about 43% over the past 24 hours, with roughly $37.5 million in trading volume. During the session, it climbed from 0.0082 to a high of 0.0121. The 5 a.m. hourly candle rose from 0.0084 to 0.0091, then price kept grinding higher, touching 0.0120 at 4 p.m. and hovering around 0.0119 at 5 p.m. Since last night, open interest has grown from about 475 million tokens to roughly 671 million in real time. Price and volume are both rising—the kind of action the market can easily read as a healthy breakout with the trend now established.
But the latter part of the move tells a very different story. At 1 p.m., when the price was still around 0.010, the share of retail accounts holding long positions peaked at 71.3%. After that, the price rose another roughly 19% by 5 p.m., reaching a high of 0.0121, but the share of long accounts fell to 66.8%, while large traders’ long positioning stayed pinned at around 56%. Open interest is still making new highs, but the number of accounts paying to hold longs is shrinking. Unlike $XAN this afternoon, where deeply negative funding meant shorts were paying to hold on, BLESS funding is still positive, so longs are paying—but there are fewer of them now, rather than more piling in to confirm the breakout.
The mechanism is simple: price and volume are confirming the direction, but the account structure is already retreating. Whoever is still paying to hold a position in an extremely overbought zone is the one who’ll feel the pain first on a pullback.
Technically, the 1-hour RSI is around 91.5. Price has simultaneously pierced the upper Bollinger Band at 0.0116 and the upper Keltner Channel at 0.0109. The EMA12 is at 0.0102, the EMA50 at 0.0089, and ATR is about 4.1%. The structure is still holding above the 12-period moving average, but the RSI has entered an exceptionally rare extreme zone. This isn’t quiet consolidation in a range; volatility has already expanded. The invalidation condition is clear: only if price regains and holds above 0.012 while the share of retail long accounts climbs back above 70% would that count as bulls retaking control of this move.
I’m treating this stretch around 0.012 as an overheated spike, and I’m not adding to my position. On a pullback, I’ll first watch whether the upper Keltner Channel at 0.0109 can turn into support. If it can’t hold, the next level is the 12-period moving average at 0.0102. Until open interest falls back below 550 million tokens and RSI drops below 70, I won’t treat this stretch as the start of a new base. I have no position in BLESS here.
$BLESS #合约 #Overbought
But the latter part of the move tells a very different story. At 1 p.m., when the price was still around 0.010, the share of retail accounts holding long positions peaked at 71.3%. After that, the price rose another roughly 19% by 5 p.m., reaching a high of 0.0121, but the share of long accounts fell to 66.8%, while large traders’ long positioning stayed pinned at around 56%. Open interest is still making new highs, but the number of accounts paying to hold longs is shrinking. Unlike $XAN this afternoon, where deeply negative funding meant shorts were paying to hold on, BLESS funding is still positive, so longs are paying—but there are fewer of them now, rather than more piling in to confirm the breakout.
The mechanism is simple: price and volume are confirming the direction, but the account structure is already retreating. Whoever is still paying to hold a position in an extremely overbought zone is the one who’ll feel the pain first on a pullback.
Technically, the 1-hour RSI is around 91.5. Price has simultaneously pierced the upper Bollinger Band at 0.0116 and the upper Keltner Channel at 0.0109. The EMA12 is at 0.0102, the EMA50 at 0.0089, and ATR is about 4.1%. The structure is still holding above the 12-period moving average, but the RSI has entered an exceptionally rare extreme zone. This isn’t quiet consolidation in a range; volatility has already expanded. The invalidation condition is clear: only if price regains and holds above 0.012 while the share of retail long accounts climbs back above 70% would that count as bulls retaking control of this move.
I’m treating this stretch around 0.012 as an overheated spike, and I’m not adding to my position. On a pullback, I’ll first watch whether the upper Keltner Channel at 0.0109 can turn into support. If it can’t hold, the next level is the 12-period moving average at 0.0102. Until open interest falls back below 550 million tokens and RSI drops below 70, I won’t treat this stretch as the start of a new base. I have no position in BLESS here.
$BLESS #合约 #Overbought
109
·
--
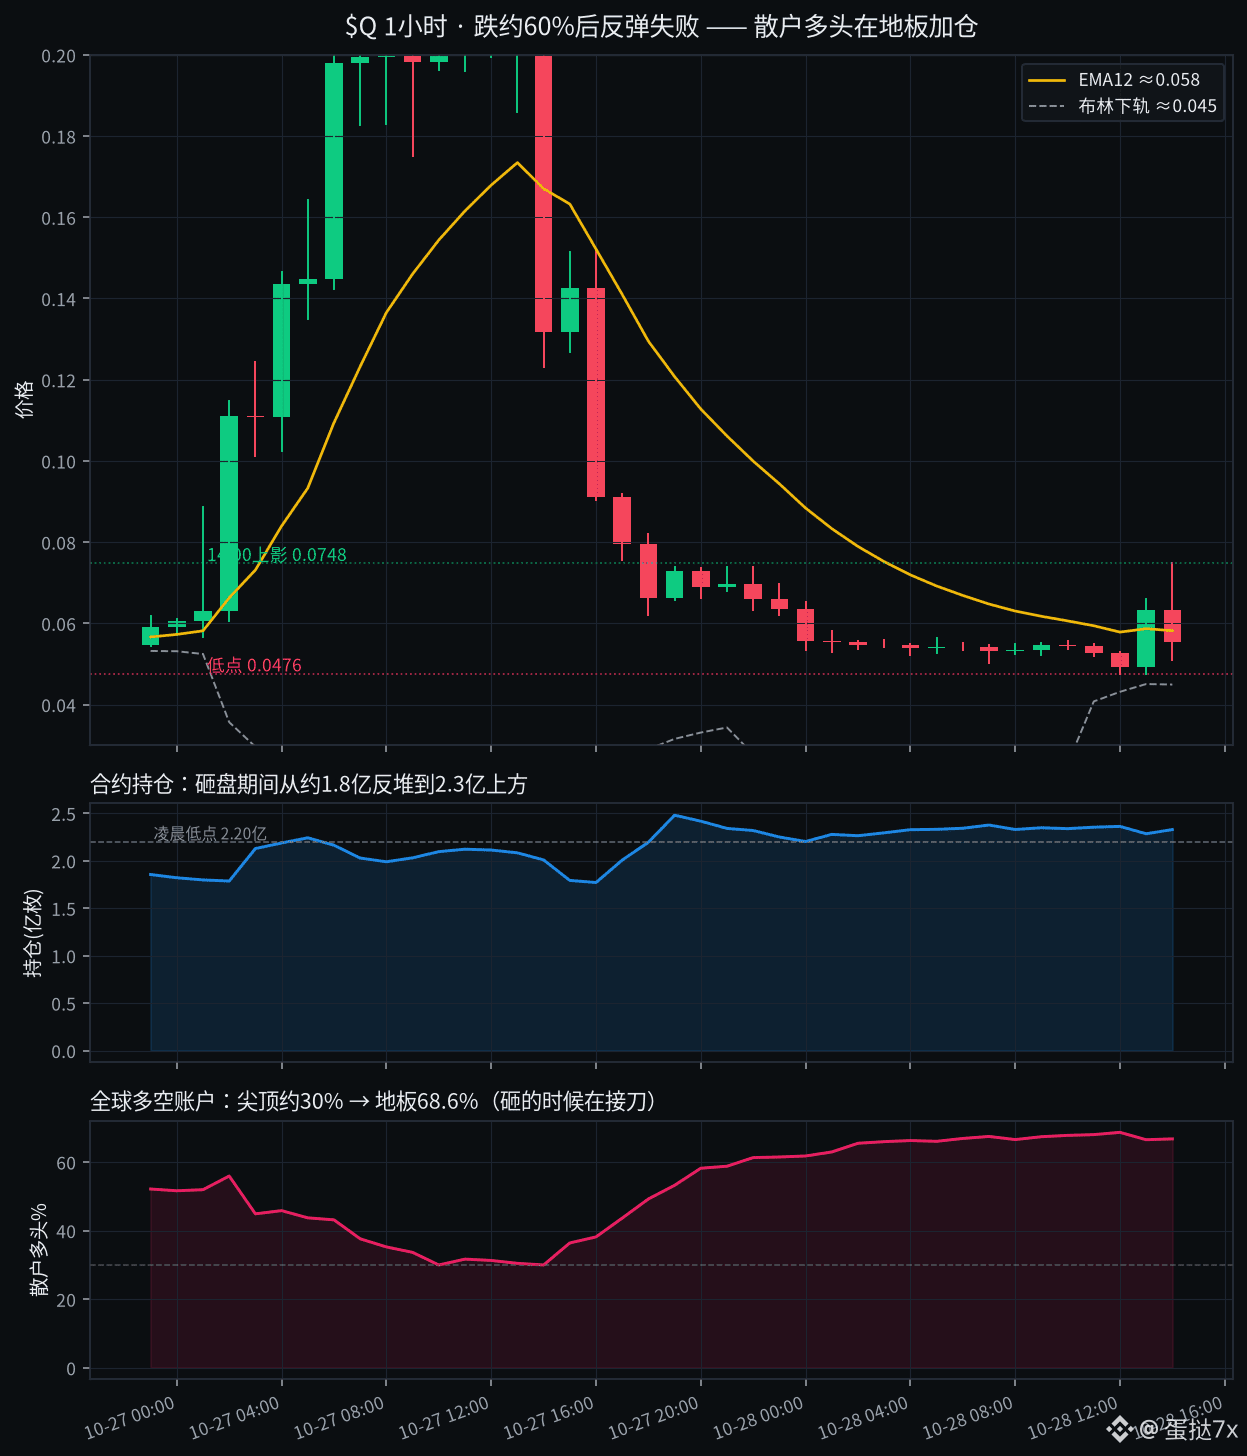
From 13:00 to 14:08, the price of contract $Q 18 rose from a low of 0.0476 to 0.0748, with a single-hour trading volume of approximately $50.8 million. It looked like a V-shaped reversal about to hold; however, the same hourly candle left a long upper shadow, indicating a pullback to the 0.055-0.058 range. The 24-hour contract fell by approximately 60%, with a trading volume of about $610 million, a high of 0.157 and a low of 0.0476. After such a drop, a further rebound would easily be interpreted by the market as a complete clearing and the start of a reversal.
The position distribution is completely reversed. Near yesterday's peak, only about 30% of retail investors remained long, with over 60% switching to short positions during the rally; by the low near noon today, long positions had climbed to 68.6%, and open interest had rebounded from approximately 179 million contracts after the peak to 236 million contracts. This drop from the bottom wasn't a clearing; it was retail investors catching the falling knife. During the hourly rally at 1 PM, open interest only dropped to 228 million, and rebounded to 233 million when the upper shadow failed at 2 PM. Large investors' long positions even increased from approximately 56% to 57.9%. The leverage was barely unloaded during the price surge.
The mechanism is simple: whoever adds to their long positions at the bottom will be trapped first during the rebound. Any slight pullback will put pressure on these newly added retail long positions, amplifying volatility further.
Yesterday, I said to treat the sharp peak at 0.226 as a short squeeze high and not add to my positions. Later, it broke through to 0.047, proving my direction correct. Today's rebound structure is the opposite: retail investors accumulated long positions at low levels, not short sellers.
Technical analysis: 1-hour RSI around 39, KDJ J around 51, EMA12 around 0.058, lower Bollinger Band around 0.045, ATR around 22%. The price is still below the 12-day moving average. It's neither a new consolidation platform nor a clear bottom; it looks more like a rebound stalled halfway through after incomplete deleveraging.
I treated the upper shadow at 2 PM as a dead cat bounce and didn't open any positions on either side. Retail long accounts should first reduce their positions to below 60% and hold until the total holdings drop back to around 220 million tokens. The area above the 0.058 moving average should be considered a passing price for now. I have no position in Q.
$Q #合约 #Holdings
From 13:00 to 14:08, the price of contract $Q 18 rose from a low of 0.0476 to 0.0748, with a single-hour trading volume of approximately $50.8 million. It looked like a V-shaped reversal about to hold; however, the same hourly candle left a long upper shadow, indicating a pullback to the 0.055-0.058 range. The 24-hour contract fell by approximately 60%, with a trading volume of about $610 million, a high of 0.157 and a low of 0.0476. After such a drop, a further rebound would easily be interpreted by the market as a complete clearing and the start of a reversal.
The position distribution is completely reversed. Near yesterday's peak, only about 30% of retail investors remained long, with over 60% switching to short positions during the rally; by the low near noon today, long positions had climbed to 68.6%, and open interest had rebounded from approximately 179 million contracts after the peak to 236 million contracts. This drop from the bottom wasn't a clearing; it was retail investors catching the falling knife. During the hourly rally at 1 PM, open interest only dropped to 228 million, and rebounded to 233 million when the upper shadow failed at 2 PM. Large investors' long positions even increased from approximately 56% to 57.9%. The leverage was barely unloaded during the price surge.
The mechanism is simple: whoever adds to their long positions at the bottom will be trapped first during the rebound. Any slight pullback will put pressure on these newly added retail long positions, amplifying volatility further.
Yesterday, I said to treat the sharp peak at 0.226 as a short squeeze high and not add to my positions. Later, it broke through to 0.047, proving my direction correct. Today's rebound structure is the opposite: retail investors accumulated long positions at low levels, not short sellers.
Technical analysis: 1-hour RSI around 39, KDJ J around 51, EMA12 around 0.058, lower Bollinger Band around 0.045, ATR around 22%. The price is still below the 12-day moving average. It's neither a new consolidation platform nor a clear bottom; it looks more like a rebound stalled halfway through after incomplete deleveraging.
I treated the upper shadow at 2 PM as a dead cat bounce and didn't open any positions on either side. Retail long accounts should first reduce their positions to below 60% and hold until the total holdings drop back to around 220 million tokens. The area above the 0.058 moving average should be considered a passing price for now. I have no position in Q.
$Q #合约 #Holdings
The position distribution is completely reversed. Near yesterday's peak, only about 30% of retail investors remained long, with over 60% switching to short positions during the rally; by the low near noon today, long positions had climbed to 68.6%, and open interest had rebounded from approximately 179 million contracts after the peak to 236 million contracts. This drop from the bottom wasn't a clearing; it was retail investors catching the falling knife. During the hourly rally at 1 PM, open interest only dropped to 228 million, and rebounded to 233 million when the upper shadow failed at 2 PM. Large investors' long positions even increased from approximately 56% to 57.9%. The leverage was barely unloaded during the price surge.
The mechanism is simple: whoever adds to their long positions at the bottom will be trapped first during the rebound. Any slight pullback will put pressure on these newly added retail long positions, amplifying volatility further.
Yesterday, I said to treat the sharp peak at 0.226 as a short squeeze high and not add to my positions. Later, it broke through to 0.047, proving my direction correct. Today's rebound structure is the opposite: retail investors accumulated long positions at low levels, not short sellers.
Technical analysis: 1-hour RSI around 39, KDJ J around 51, EMA12 around 0.058, lower Bollinger Band around 0.045, ATR around 22%. The price is still below the 12-day moving average. It's neither a new consolidation platform nor a clear bottom; it looks more like a rebound stalled halfway through after incomplete deleveraging.
I treated the upper shadow at 2 PM as a dead cat bounce and didn't open any positions on either side. Retail long accounts should first reduce their positions to below 60% and hold until the total holdings drop back to around 220 million tokens. The area above the 0.058 moving average should be considered a passing price for now. I have no position in Q.
$Q #合约 #Holdings
261
·
--
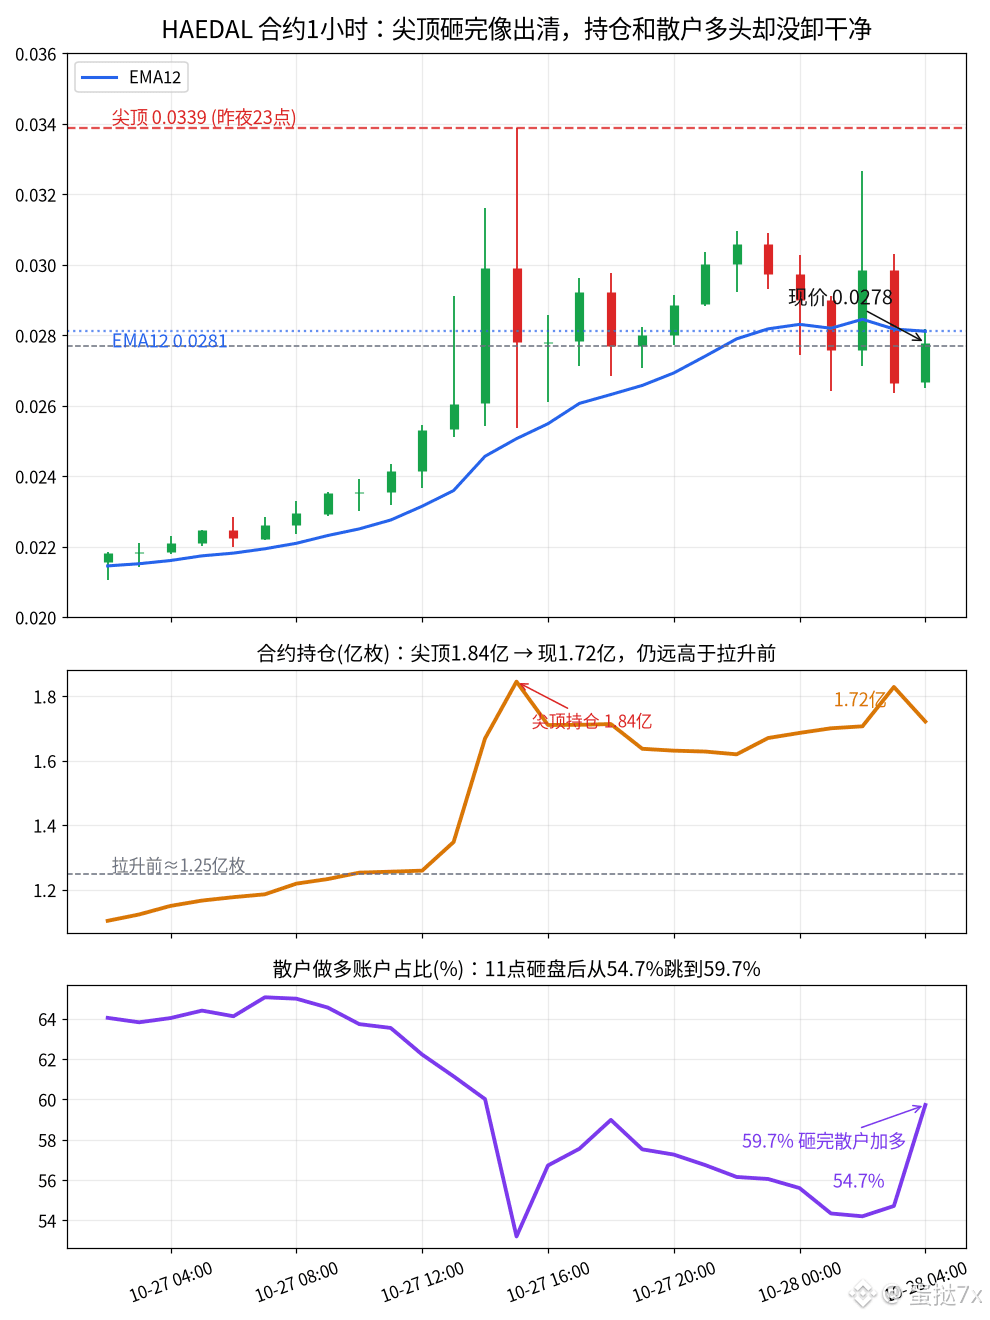
$HAEDAL Perpetuals are still up about 25% over the past 24 hours, with roughly $104 million in trading volume. Intraday, the price climbed from a low of 0.0219 to a peak of 0.0339. The sharp spike on last night’s 23:00 hourly candle touched 0.0339 before getting slammed back down to close at 0.0278, which on the surface looks like a round of liquidations has already happened. But the position data doesn’t support the idea that the market has been “cleared out.”
Open interest hit roughly 184 million tokens during that spike, nearly 50% above the approximately 125 million before yesterday afternoon’s rally. After the drop, it’s still around 172 million, down only about 6%. When traders are forced to close positions, the price tends to move further in the direction that hurts them—here, it looks more like some of the spike’s long positions were swept out, while leverage overall has barely been unwound. More puzzling is today’s 11:00 hourly candle: the price plunged from 0.030 to 0.026, while open interest actually climbed from 171 million to 183 million. Then the percentage of retail accounts holding longs jumped from 54.7% to 59.7%, while large traders’ long positions stayed almost unchanged at 54%. After the drop, it was retail traders—not large traders—who bought the dip and added to their longs. Funding is still negative at around -0.017%, meaning shorts are paying longs, but the account mix is already shifting toward crowded longs. As open interest and retail longs both rise during a decline, these newly added leveraged long positions will come under pressure if the price rebounds even slightly.
Technically, the 1-hour RSI is about 54, the KDJ J-line is around 10, EMA12 is at 0.0281, EMA26 at 0.0267, the MACD histogram remains negative, and ATR is about 8.4%. The price is stuck below the 12-period moving average and within the spike’s retracement range. This is neither a new base nor a fully flushed-out bottom; it looks more like an unfinished round of deleveraging that has stalled halfway through.
I see this move as retail buying the dip while deleveraging remains incomplete, so I’m not adding to my position. Until open interest falls back below 140 million tokens and the share of accounts holding longs drops below 50% again, I’ll watch the moving average at 0.0281 on any rebound; if the price can’t hold above it, I’ll treat it as a pass-through price. If the price gets back above 0.030 while open interest continues building toward 180 million tokens, that would suggest the leverage from the spike hasn’t been fully unwound, and volatility will only increase from here. I have no position in this part of HAEDAL’s move.
$HAEDAL #合约 #OpenInterest
$HAEDAL Perpetuals are still up about 25% over the past 24 hours, with roughly $104 million in trading volume. Intraday, the price climbed from a low of 0.0219 to a peak of 0.0339. The sharp spike on last night’s 23:00 hourly candle touched 0.0339 before getting slammed back down to close at 0.0278, which on the surface looks like a round of liquidations has already happened. But the position data doesn’t support the idea that the market has been “cleared out.”
Open interest hit roughly 184 million tokens during that spike, nearly 50% above the approximately 125 million before yesterday afternoon’s rally. After the drop, it’s still around 172 million, down only about 6%. When traders are forced to close positions, the price tends to move further in the direction that hurts them—here, it looks more like some of the spike’s long positions were swept out, while leverage overall has barely been unwound. More puzzling is today’s 11:00 hourly candle: the price plunged from 0.030 to 0.026, while open interest actually climbed from 171 million to 183 million. Then the percentage of retail accounts holding longs jumped from 54.7% to 59.7%, while large traders’ long positions stayed almost unchanged at 54%. After the drop, it was retail traders—not large traders—who bought the dip and added to their longs. Funding is still negative at around -0.017%, meaning shorts are paying longs, but the account mix is already shifting toward crowded longs. As open interest and retail longs both rise during a decline, these newly added leveraged long positions will come under pressure if the price rebounds even slightly.
Technically, the 1-hour RSI is about 54, the KDJ J-line is around 10, EMA12 is at 0.0281, EMA26 at 0.0267, the MACD histogram remains negative, and ATR is about 8.4%. The price is stuck below the 12-period moving average and within the spike’s retracement range. This is neither a new base nor a fully flushed-out bottom; it looks more like an unfinished round of deleveraging that has stalled halfway through.
I see this move as retail buying the dip while deleveraging remains incomplete, so I’m not adding to my position. Until open interest falls back below 140 million tokens and the share of accounts holding longs drops below 50% again, I’ll watch the moving average at 0.0281 on any rebound; if the price can’t hold above it, I’ll treat it as a pass-through price. If the price gets back above 0.030 while open interest continues building toward 180 million tokens, that would suggest the leverage from the spike hasn’t been fully unwound, and volatility will only increase from here. I have no position in this part of HAEDAL’s move.
$HAEDAL #合约 #OpenInterest
Open interest hit roughly 184 million tokens during that spike, nearly 50% above the approximately 125 million before yesterday afternoon’s rally. After the drop, it’s still around 172 million, down only about 6%. When traders are forced to close positions, the price tends to move further in the direction that hurts them—here, it looks more like some of the spike’s long positions were swept out, while leverage overall has barely been unwound. More puzzling is today’s 11:00 hourly candle: the price plunged from 0.030 to 0.026, while open interest actually climbed from 171 million to 183 million. Then the percentage of retail accounts holding longs jumped from 54.7% to 59.7%, while large traders’ long positions stayed almost unchanged at 54%. After the drop, it was retail traders—not large traders—who bought the dip and added to their longs. Funding is still negative at around -0.017%, meaning shorts are paying longs, but the account mix is already shifting toward crowded longs. As open interest and retail longs both rise during a decline, these newly added leveraged long positions will come under pressure if the price rebounds even slightly.
Technically, the 1-hour RSI is about 54, the KDJ J-line is around 10, EMA12 is at 0.0281, EMA26 at 0.0267, the MACD histogram remains negative, and ATR is about 8.4%. The price is stuck below the 12-period moving average and within the spike’s retracement range. This is neither a new base nor a fully flushed-out bottom; it looks more like an unfinished round of deleveraging that has stalled halfway through.
I see this move as retail buying the dip while deleveraging remains incomplete, so I’m not adding to my position. Until open interest falls back below 140 million tokens and the share of accounts holding longs drops below 50% again, I’ll watch the moving average at 0.0281 on any rebound; if the price can’t hold above it, I’ll treat it as a pass-through price. If the price gets back above 0.030 while open interest continues building toward 180 million tokens, that would suggest the leverage from the spike hasn’t been fully unwound, and volatility will only increase from here. I have no position in this part of HAEDAL’s move.
$HAEDAL #合约 #OpenInterest
132
·
--
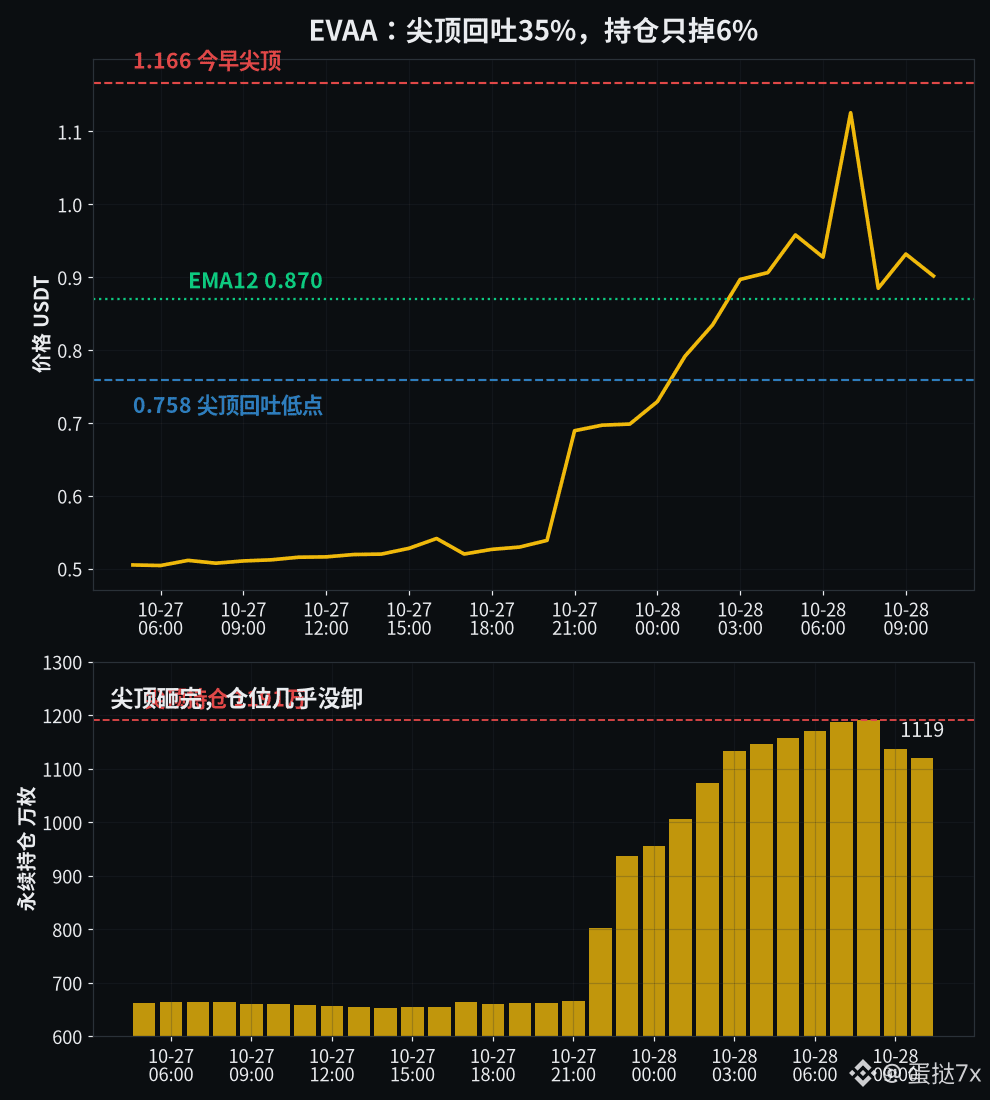
$EVAA Over the past 24 hours, the contract has risen about 78%, climbing from a low of 0.51 to a high of 1.166, with roughly $195 million in trading volume. During the hour of the spike, it plunged from 1.166 to 0.758, giving back nearly 35% in a single candle. The price looks like it’s already been through a round of flushing, but positioning just doesn’t line up with the idea that “it’s all over.”
Open interest peaked at around 11.91 million tokens at 8 o’clock, almost double the roughly 6.5 million-token base from yesterday afternoon. After the crash, it’s still around 11.19 million, down just 6%. When traders are forced to close positions, the price tends to move further in the direction that hurts them—the move here looks more like some of the longs from the spike were liquidated, while the leveraged positions themselves have barely been unwound. Retail long accounts fell from nearly 80% before the rally to around 55% at the spike, and are now at 56%; that round of short-side fuel has already burned. Large traders’ long positions are still around 59%. The funding rate touched about 0.08% in the early morning, so longs are still paying shorts. The 7 a.m. Beijing-time hourly candle opened at 0.928, hit 1.166, and closed at 1.126. The next candle plunged straight to a low of 0.758 and closed at 0.885. Hourly trading volume was roughly $26 million and $37 million, respectively—the real break came across those two candles.
Technically, the 1-hour RSI has fallen from 92 near the spike to around 61, and the KDJ J-line has dropped from 94 to 24. The MACD histogram is still positive, EMA12 is at 0.870, and ATR is around 11%. Price is stuck above the moving average, within the spike’s retracement range. This is neither a new base nor a fully flushed-out bottom; it looks more like an unfinished deleveraging move that has stalled halfway through.
I’m treating the move up to 1.166 as a short-squeeze spike and won’t add to my position. Until open interest falls back below 10 million tokens and long accounts drop below 50% again, I’ll watch the moving average at 0.870 on any rebound; if it breaks, the next level to watch is 0.76. If price gets back above 1.00 while open interest keeps building toward 12 million tokens, that would mean the longs from the spike haven’t been fully unwound, and volatility will only get higher. I have no position in this move on EVAA. These are my personal views.
$EVAA #合约 #Open Interest
$EVAA Over the past 24 hours, the contract has risen about 78%, climbing from a low of 0.51 to a high of 1.166, with roughly $195 million in trading volume. During the hour of the spike, it plunged from 1.166 to 0.758, giving back nearly 35% in a single candle. The price looks like it’s already been through a round of flushing, but positioning just doesn’t line up with the idea that “it’s all over.”
Open interest peaked at around 11.91 million tokens at 8 o’clock, almost double the roughly 6.5 million-token base from yesterday afternoon. After the crash, it’s still around 11.19 million, down just 6%. When traders are forced to close positions, the price tends to move further in the direction that hurts them—the move here looks more like some of the longs from the spike were liquidated, while the leveraged positions themselves have barely been unwound. Retail long accounts fell from nearly 80% before the rally to around 55% at the spike, and are now at 56%; that round of short-side fuel has already burned. Large traders’ long positions are still around 59%. The funding rate touched about 0.08% in the early morning, so longs are still paying shorts. The 7 a.m. Beijing-time hourly candle opened at 0.928, hit 1.166, and closed at 1.126. The next candle plunged straight to a low of 0.758 and closed at 0.885. Hourly trading volume was roughly $26 million and $37 million, respectively—the real break came across those two candles.
Technically, the 1-hour RSI has fallen from 92 near the spike to around 61, and the KDJ J-line has dropped from 94 to 24. The MACD histogram is still positive, EMA12 is at 0.870, and ATR is around 11%. Price is stuck above the moving average, within the spike’s retracement range. This is neither a new base nor a fully flushed-out bottom; it looks more like an unfinished deleveraging move that has stalled halfway through.
I’m treating the move up to 1.166 as a short-squeeze spike and won’t add to my position. Until open interest falls back below 10 million tokens and long accounts drop below 50% again, I’ll watch the moving average at 0.870 on any rebound; if it breaks, the next level to watch is 0.76. If price gets back above 1.00 while open interest keeps building toward 12 million tokens, that would mean the longs from the spike haven’t been fully unwound, and volatility will only get higher. I have no position in this move on EVAA. These are my personal views.
$EVAA #合约 #Open Interest
Open interest peaked at around 11.91 million tokens at 8 o’clock, almost double the roughly 6.5 million-token base from yesterday afternoon. After the crash, it’s still around 11.19 million, down just 6%. When traders are forced to close positions, the price tends to move further in the direction that hurts them—the move here looks more like some of the longs from the spike were liquidated, while the leveraged positions themselves have barely been unwound. Retail long accounts fell from nearly 80% before the rally to around 55% at the spike, and are now at 56%; that round of short-side fuel has already burned. Large traders’ long positions are still around 59%. The funding rate touched about 0.08% in the early morning, so longs are still paying shorts. The 7 a.m. Beijing-time hourly candle opened at 0.928, hit 1.166, and closed at 1.126. The next candle plunged straight to a low of 0.758 and closed at 0.885. Hourly trading volume was roughly $26 million and $37 million, respectively—the real break came across those two candles.
Technically, the 1-hour RSI has fallen from 92 near the spike to around 61, and the KDJ J-line has dropped from 94 to 24. The MACD histogram is still positive, EMA12 is at 0.870, and ATR is around 11%. Price is stuck above the moving average, within the spike’s retracement range. This is neither a new base nor a fully flushed-out bottom; it looks more like an unfinished deleveraging move that has stalled halfway through.
I’m treating the move up to 1.166 as a short-squeeze spike and won’t add to my position. Until open interest falls back below 10 million tokens and long accounts drop below 50% again, I’ll watch the moving average at 0.870 on any rebound; if it breaks, the next level to watch is 0.76. If price gets back above 1.00 while open interest keeps building toward 12 million tokens, that would mean the longs from the spike haven’t been fully unwound, and volatility will only get higher. I have no position in this move on EVAA. These are my personal views.
$EVAA #合约 #Open Interest
193
·
--
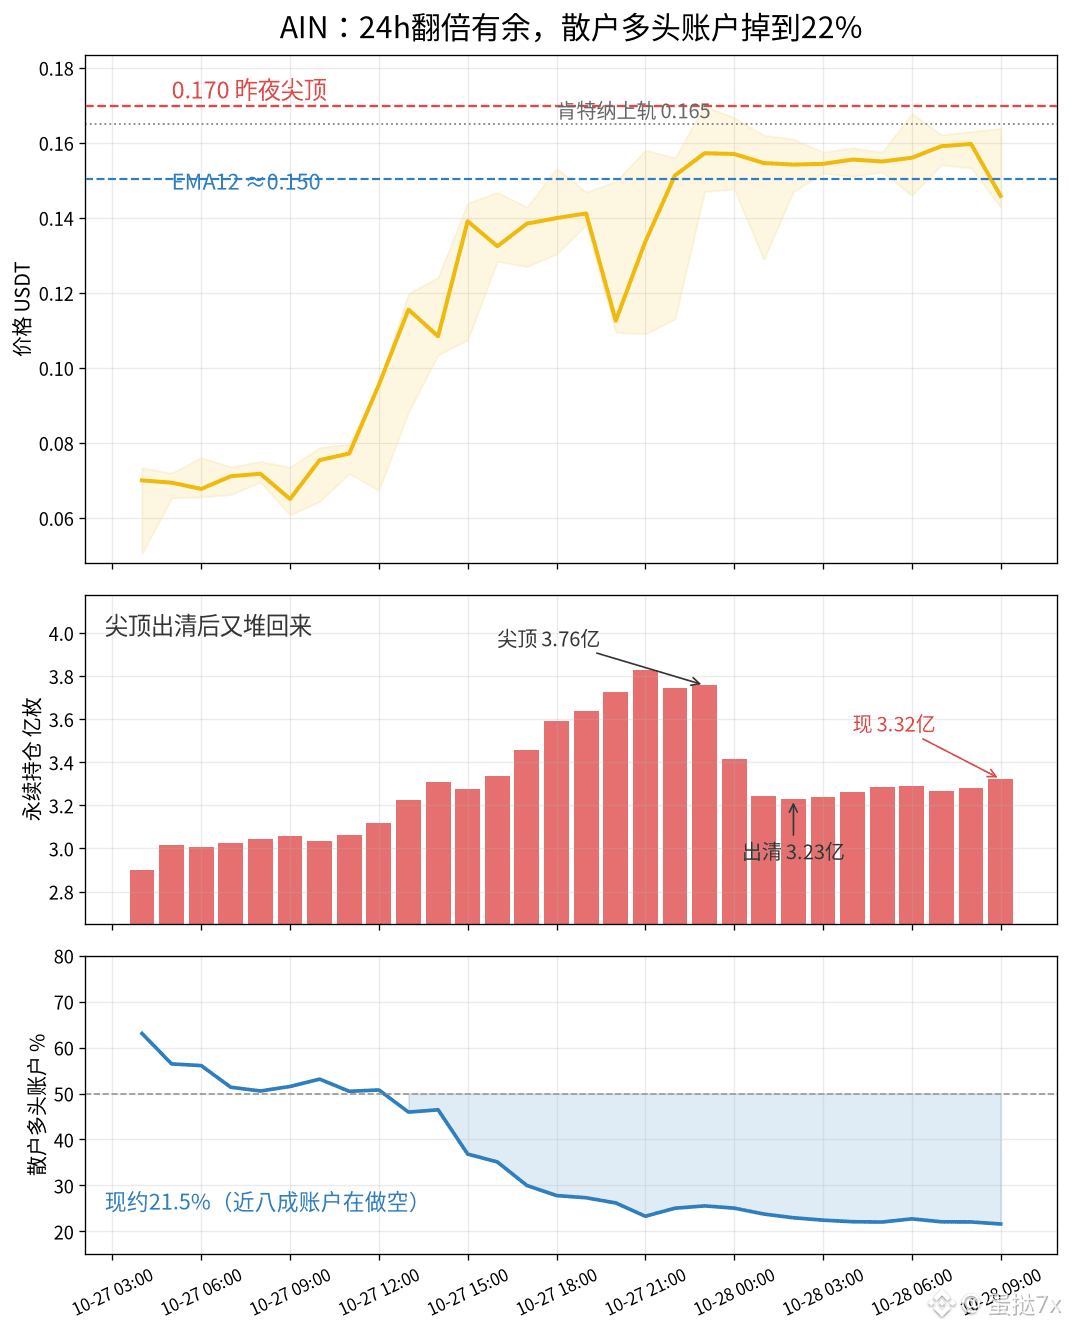
$AIN Over the past 24 hours, the contract surged from a low of 0.064 to 0.170, up about 125%, with roughly $740 million in trading volume, putting it firmly at the top of Binance’s contract gainers. A move that more than doubles is easy to read as retail traders piling into longs across the board, with sentiment already overheated.
But the account structure is moving in exactly the opposite direction. Around noon yesterday, long accounts were still near 50%; by 9 a.m. today, they had fallen to about 21.5%—meaning nearly 80% of accounts were short. Large traders’ long positions stayed around 60%, barely moving. When traders are forced to close positions, the price can move further in the direction that hurts them. Short accounts kept increasing as the price rose, adding fuel for a short squeeze—not confirming a top driven by a rush of longs. Open interest tells the same story: near last night’s 11 p.m. spike, it was about 376 million coins; by 2 a.m., it had been cleared down to around 323 million, a drop of more than 50 million. It then built back up to about 336 million. During the 9 a.m. hour this morning, the price plunged from 0.164 to 0.143, while open interest rose instead of falling. That suggests shorts were adding positions during the sell-off, rather than longs actively deleveraging. The funding rate was still positive at about 0.07% this morning, so longs were still paying shorts.
Yesterday at noon, I wrote that 0.070 wasn’t a new floor, and that unless open interest fell back below 300 million coins, the price would remain a temporary stop. It never did fall back below that level; instead, it went straight to 0.170. Short accounts have continued to pile in while large traders haven’t exited their longs. The structure is the same as yesterday at noon, just more extreme: the more the price rises, the more willing retail traders are to short, replenishing the fuel for a squeeze. Technically: 1-hour RSI is around 65, KDJ J is around 62, the upper Bollinger Band is 0.174, the upper Keltner Channel is 0.165, EMA12 is at 0.150, and ATR is about 11%. I see 0.170 as a sentiment spike, not a new base. Until retail long accounts climb back above 40% and open interest drops clearly below 320 million coins, the first pullback target is the moving average at 0.150; if it can’t hold, this is still just a temporary stop. I’m not holding a position in AIN.
$AIN #合约 #Open Interest
$AIN Over the past 24 hours, the contract surged from a low of 0.064 to 0.170, up about 125%, with roughly $740 million in trading volume, putting it firmly at the top of Binance’s contract gainers. A move that more than doubles is easy to read as retail traders piling into longs across the board, with sentiment already overheated.
But the account structure is moving in exactly the opposite direction. Around noon yesterday, long accounts were still near 50%; by 9 a.m. today, they had fallen to about 21.5%—meaning nearly 80% of accounts were short. Large traders’ long positions stayed around 60%, barely moving. When traders are forced to close positions, the price can move further in the direction that hurts them. Short accounts kept increasing as the price rose, adding fuel for a short squeeze—not confirming a top driven by a rush of longs. Open interest tells the same story: near last night’s 11 p.m. spike, it was about 376 million coins; by 2 a.m., it had been cleared down to around 323 million, a drop of more than 50 million. It then built back up to about 336 million. During the 9 a.m. hour this morning, the price plunged from 0.164 to 0.143, while open interest rose instead of falling. That suggests shorts were adding positions during the sell-off, rather than longs actively deleveraging. The funding rate was still positive at about 0.07% this morning, so longs were still paying shorts.
Yesterday at noon, I wrote that 0.070 wasn’t a new floor, and that unless open interest fell back below 300 million coins, the price would remain a temporary stop. It never did fall back below that level; instead, it went straight to 0.170. Short accounts have continued to pile in while large traders haven’t exited their longs. The structure is the same as yesterday at noon, just more extreme: the more the price rises, the more willing retail traders are to short, replenishing the fuel for a squeeze. Technically: 1-hour RSI is around 65, KDJ J is around 62, the upper Bollinger Band is 0.174, the upper Keltner Channel is 0.165, EMA12 is at 0.150, and ATR is about 11%. I see 0.170 as a sentiment spike, not a new base. Until retail long accounts climb back above 40% and open interest drops clearly below 320 million coins, the first pullback target is the moving average at 0.150; if it can’t hold, this is still just a temporary stop. I’m not holding a position in AIN.
$AIN #合约 #Open Interest
But the account structure is moving in exactly the opposite direction. Around noon yesterday, long accounts were still near 50%; by 9 a.m. today, they had fallen to about 21.5%—meaning nearly 80% of accounts were short. Large traders’ long positions stayed around 60%, barely moving. When traders are forced to close positions, the price can move further in the direction that hurts them. Short accounts kept increasing as the price rose, adding fuel for a short squeeze—not confirming a top driven by a rush of longs. Open interest tells the same story: near last night’s 11 p.m. spike, it was about 376 million coins; by 2 a.m., it had been cleared down to around 323 million, a drop of more than 50 million. It then built back up to about 336 million. During the 9 a.m. hour this morning, the price plunged from 0.164 to 0.143, while open interest rose instead of falling. That suggests shorts were adding positions during the sell-off, rather than longs actively deleveraging. The funding rate was still positive at about 0.07% this morning, so longs were still paying shorts.
Yesterday at noon, I wrote that 0.070 wasn’t a new floor, and that unless open interest fell back below 300 million coins, the price would remain a temporary stop. It never did fall back below that level; instead, it went straight to 0.170. Short accounts have continued to pile in while large traders haven’t exited their longs. The structure is the same as yesterday at noon, just more extreme: the more the price rises, the more willing retail traders are to short, replenishing the fuel for a squeeze. Technically: 1-hour RSI is around 65, KDJ J is around 62, the upper Bollinger Band is 0.174, the upper Keltner Channel is 0.165, EMA12 is at 0.150, and ATR is about 11%. I see 0.170 as a sentiment spike, not a new base. Until retail long accounts climb back above 40% and open interest drops clearly below 320 million coins, the first pullback target is the moving average at 0.150; if it can’t hold, this is still just a temporary stop. I’m not holding a position in AIN.
$AIN #合约 #Open Interest
331
·
--
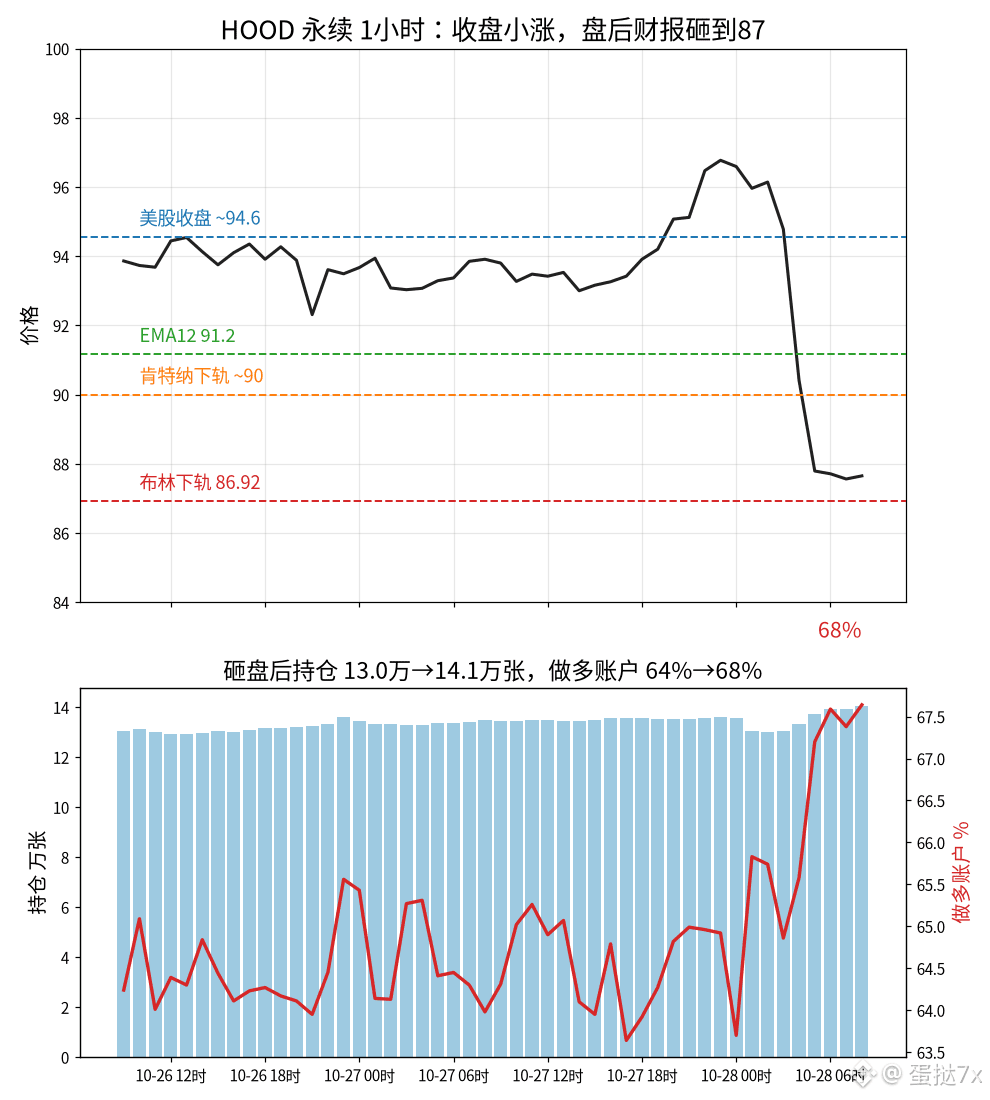
$HOOD U.S. stocks closed up about 1.9%, still near 94.5. After the quarterly results came out after hours, Binance futures plunged from around 94.8 to 87.6, giving back about 7%. They were down about 6.7% over 24 hours, with roughly $65 million in trading volume and an intraday low of 86.9. Revenue was $1.42 billion, still up 12% year over year but slightly below Wall Street’s expectations of around $1.43–$1.44 billion. Crypto trading revenue was slashed 55% to $120 million, while prediction market revenue came in at around $173 million, several times higher. On the surface, the disappointing results triggered a flush-out.
But the positioning data doesn’t support the idea that the market has been “cleaned out.” Around 1 a.m. Beijing time, open interest first fell from about 136,000 contracts to 130,000, suggesting a wave of liquidations. Yet in the hours when price kept sliding to a new low of 86.9, open interest rebounded from 130,000 to 141,000 contracts. The share of retail accounts holding longs climbed from around 64% to 68%, while large traders’ long positions rose from 63% to around 66%. Funding rates also remained slightly positive, near zero. When traders are forced to close positions, price tends to move further in the direction that hurts them. This latest leg down looks more like traders buying the dip and adding longs at new lows—not short fuel running out. Long accounts kept increasing as the price fell, so if there’s even a modest rebound, these leveraged longs will be the first under pressure.
Technically, price is hugging the lower boundary: the 1-hour RSI is around 23, the KDJ J-line is at -13, and the Bollinger lower band at 86.92 is almost right at the current price. The Keltner lower band, around 90, has been breached; EMA12 is at 91.2, and ATR is about 1.8%. Before the close, price had been grinding between 94 and 96; the real move came in two big red candles between 4 and 5 a.m. I’m not treating 86.9 as a floor. Until open interest falls back below 132,000 contracts and the share of retail long accounts drops below 60% again, any rebound first faces the Keltner lower band around 90. If price can’t hold above it, that’s still just a passing price level. The invalidation condition is also clear: if price gets back above the 91.2 moving average while open interest continues to expand, it means the dip-buyers haven’t cleared out, and volatility will only get worse. I have no position in this move in HOOD.
$HOOD #美股 #Earnings
$HOOD U.S. stocks closed up about 1.9%, still near 94.5. After the quarterly results came out after hours, Binance futures plunged from around 94.8 to 87.6, giving back about 7%. They were down about 6.7% over 24 hours, with roughly $65 million in trading volume and an intraday low of 86.9. Revenue was $1.42 billion, still up 12% year over year but slightly below Wall Street’s expectations of around $1.43–$1.44 billion. Crypto trading revenue was slashed 55% to $120 million, while prediction market revenue came in at around $173 million, several times higher. On the surface, the disappointing results triggered a flush-out.
But the positioning data doesn’t support the idea that the market has been “cleaned out.” Around 1 a.m. Beijing time, open interest first fell from about 136,000 contracts to 130,000, suggesting a wave of liquidations. Yet in the hours when price kept sliding to a new low of 86.9, open interest rebounded from 130,000 to 141,000 contracts. The share of retail accounts holding longs climbed from around 64% to 68%, while large traders’ long positions rose from 63% to around 66%. Funding rates also remained slightly positive, near zero. When traders are forced to close positions, price tends to move further in the direction that hurts them. This latest leg down looks more like traders buying the dip and adding longs at new lows—not short fuel running out. Long accounts kept increasing as the price fell, so if there’s even a modest rebound, these leveraged longs will be the first under pressure.
Technically, price is hugging the lower boundary: the 1-hour RSI is around 23, the KDJ J-line is at -13, and the Bollinger lower band at 86.92 is almost right at the current price. The Keltner lower band, around 90, has been breached; EMA12 is at 91.2, and ATR is about 1.8%. Before the close, price had been grinding between 94 and 96; the real move came in two big red candles between 4 and 5 a.m. I’m not treating 86.9 as a floor. Until open interest falls back below 132,000 contracts and the share of retail long accounts drops below 60% again, any rebound first faces the Keltner lower band around 90. If price can’t hold above it, that’s still just a passing price level. The invalidation condition is also clear: if price gets back above the 91.2 moving average while open interest continues to expand, it means the dip-buyers haven’t cleared out, and volatility will only get worse. I have no position in this move in HOOD.
$HOOD #美股 #Earnings
But the positioning data doesn’t support the idea that the market has been “cleaned out.” Around 1 a.m. Beijing time, open interest first fell from about 136,000 contracts to 130,000, suggesting a wave of liquidations. Yet in the hours when price kept sliding to a new low of 86.9, open interest rebounded from 130,000 to 141,000 contracts. The share of retail accounts holding longs climbed from around 64% to 68%, while large traders’ long positions rose from 63% to around 66%. Funding rates also remained slightly positive, near zero. When traders are forced to close positions, price tends to move further in the direction that hurts them. This latest leg down looks more like traders buying the dip and adding longs at new lows—not short fuel running out. Long accounts kept increasing as the price fell, so if there’s even a modest rebound, these leveraged longs will be the first under pressure.
Technically, price is hugging the lower boundary: the 1-hour RSI is around 23, the KDJ J-line is at -13, and the Bollinger lower band at 86.92 is almost right at the current price. The Keltner lower band, around 90, has been breached; EMA12 is at 91.2, and ATR is about 1.8%. Before the close, price had been grinding between 94 and 96; the real move came in two big red candles between 4 and 5 a.m. I’m not treating 86.9 as a floor. Until open interest falls back below 132,000 contracts and the share of retail long accounts drops below 60% again, any rebound first faces the Keltner lower band around 90. If price can’t hold above it, that’s still just a passing price level. The invalidation condition is also clear: if price gets back above the 91.2 moving average while open interest continues to expand, it means the dip-buyers haven’t cleared out, and volatility will only get worse. I have no position in this move in HOOD.
$HOOD #美股 #Earnings
197
·
--
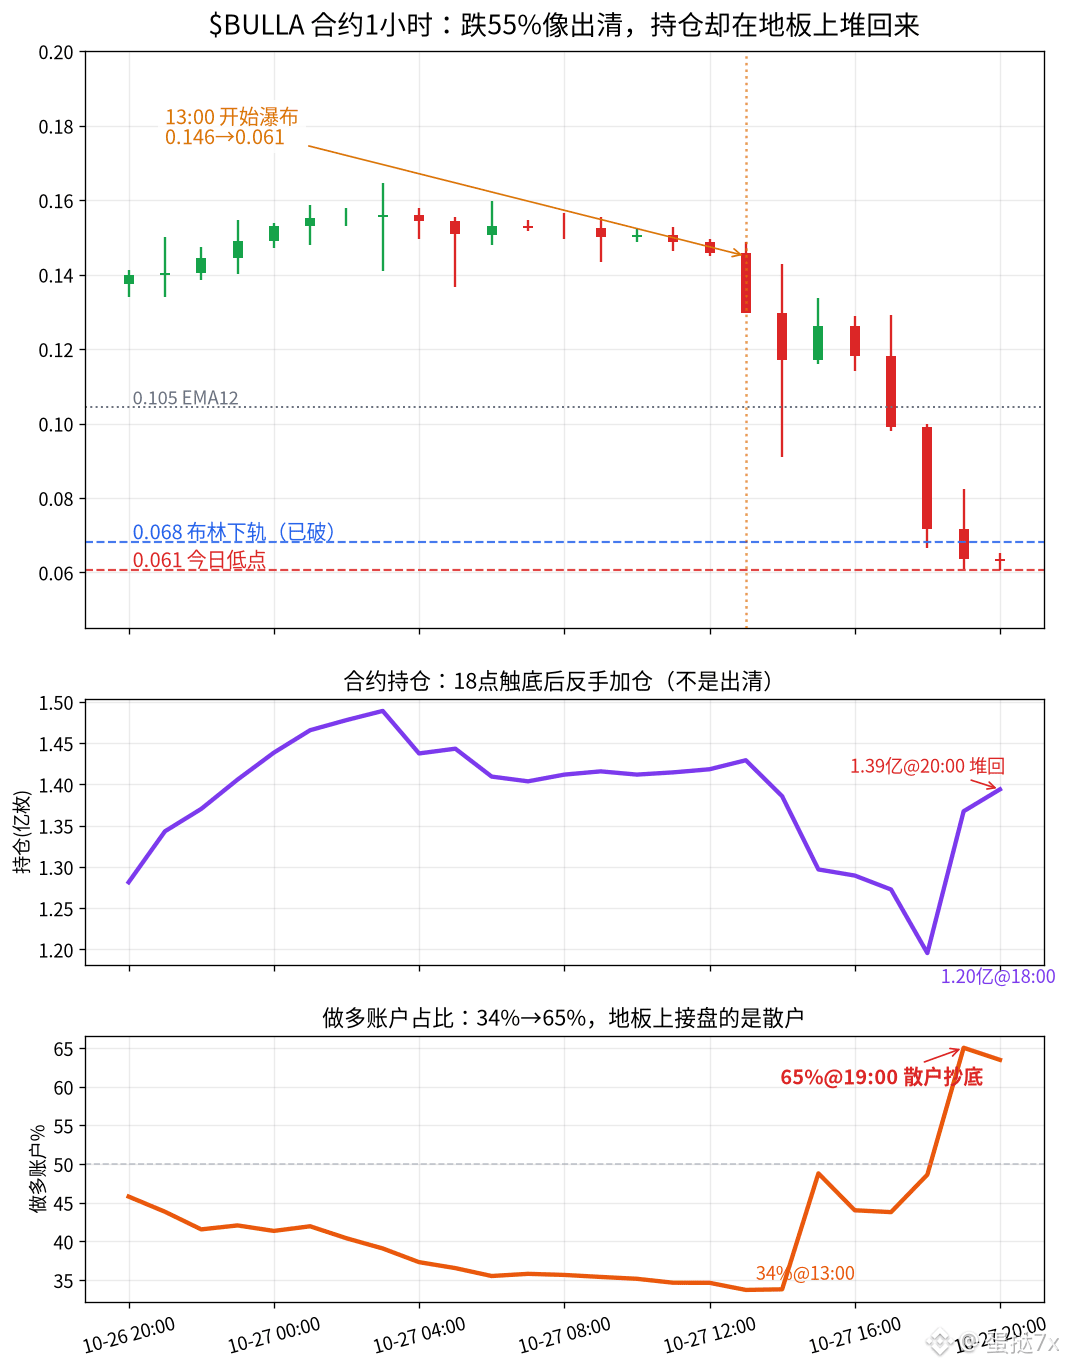
$BULLA collapsed from the intraday high of 0.165 to 0.061, with the 24-hour perpetual contract down about 55% and trading volume around $310 million. When it crashes this hard, it usually means positions have already been washed out. But from 18:00 to 20:00, while price kept making new lows, open interest actually climbed back from 120 million contracts to 139 million contracts, an increase of nearly 19 million — meaning that the bottoming zone was not a forced liquidation phase, but a phase where new players were stepping in to take the other side.
The same period looks even more striking: the share of long accounts jumped from 34% at 13:00 to 65% at 19:00. Large-player long positioning stayed around 46% and barely moved, and funding at 20:00 only just printed -0.89%. The positions being built up were mainly retail dip-buying, while the major players' position structure did not flip long with it.
Looking a bit further back makes it even clearer. This morning, when price was still around 0.15, long accounts were only about 35%, with shorts dominating; overnight open interest piled up to about 149 million contracts, with a notional value of roughly $23 million. The waterfall started at 13:00, with a steady dump from 0.146. At 14:00, hourly trading volume was about $36 million, and price plunged from 0.130 through 0.091 before rebounding to 0.117; at 18:00 it broke down through 0.067, and at 19:00 it touched 0.061. Now the notional value is only about $9 million, but the number of contracts has almost climbed back to the highs. During the price halving process, retail went from short to long and even added on near the lows. Liquidations did not clear the book; they just replaced one group of holders with another. If it dumps again next time, this group of 65% long accounts will be the first to get swept, and the orders forced out will themselves become fresh sell pressure.
Technically, everything is pinned near the lower boundary: 1-hour RSI is around 19, KDJ J is at -9, the Bollinger lower band at 0.068 has already been broken by about 8%, EMA12 is at 0.105, and ATR is roughly 24%. I do not treat 0.061 as a bottom. Until open interest falls back below 120 million contracts and long accounts drop under 45%, I would treat any rebound as short covering first. If price cannot reclaim the Bollinger lower band at 0.068, I would not add here myself. BULLA has no position in this stretch; first watch whether open interest and retail longs can truly cool off. Personal observation record.
$BULLA #合约数据 #positions
$BULLA collapsed from the intraday high of 0.165 to 0.061, with the 24-hour perpetual contract down about 55% and trading volume around $310 million. When it crashes this hard, it usually means positions have already been washed out. But from 18:00 to 20:00, while price kept making new lows, open interest actually climbed back from 120 million contracts to 139 million contracts, an increase of nearly 19 million — meaning that the bottoming zone was not a forced liquidation phase, but a phase where new players were stepping in to take the other side.
The same period looks even more striking: the share of long accounts jumped from 34% at 13:00 to 65% at 19:00. Large-player long positioning stayed around 46% and barely moved, and funding at 20:00 only just printed -0.89%. The positions being built up were mainly retail dip-buying, while the major players' position structure did not flip long with it.
Looking a bit further back makes it even clearer. This morning, when price was still around 0.15, long accounts were only about 35%, with shorts dominating; overnight open interest piled up to about 149 million contracts, with a notional value of roughly $23 million. The waterfall started at 13:00, with a steady dump from 0.146. At 14:00, hourly trading volume was about $36 million, and price plunged from 0.130 through 0.091 before rebounding to 0.117; at 18:00 it broke down through 0.067, and at 19:00 it touched 0.061. Now the notional value is only about $9 million, but the number of contracts has almost climbed back to the highs. During the price halving process, retail went from short to long and even added on near the lows. Liquidations did not clear the book; they just replaced one group of holders with another. If it dumps again next time, this group of 65% long accounts will be the first to get swept, and the orders forced out will themselves become fresh sell pressure.
Technically, everything is pinned near the lower boundary: 1-hour RSI is around 19, KDJ J is at -9, the Bollinger lower band at 0.068 has already been broken by about 8%, EMA12 is at 0.105, and ATR is roughly 24%. I do not treat 0.061 as a bottom. Until open interest falls back below 120 million contracts and long accounts drop under 45%, I would treat any rebound as short covering first. If price cannot reclaim the Bollinger lower band at 0.068, I would not add here myself. BULLA has no position in this stretch; first watch whether open interest and retail longs can truly cool off. Personal observation record.
$BULLA #合约数据 #positions
The same period looks even more striking: the share of long accounts jumped from 34% at 13:00 to 65% at 19:00. Large-player long positioning stayed around 46% and barely moved, and funding at 20:00 only just printed -0.89%. The positions being built up were mainly retail dip-buying, while the major players' position structure did not flip long with it.
Looking a bit further back makes it even clearer. This morning, when price was still around 0.15, long accounts were only about 35%, with shorts dominating; overnight open interest piled up to about 149 million contracts, with a notional value of roughly $23 million. The waterfall started at 13:00, with a steady dump from 0.146. At 14:00, hourly trading volume was about $36 million, and price plunged from 0.130 through 0.091 before rebounding to 0.117; at 18:00 it broke down through 0.067, and at 19:00 it touched 0.061. Now the notional value is only about $9 million, but the number of contracts has almost climbed back to the highs. During the price halving process, retail went from short to long and even added on near the lows. Liquidations did not clear the book; they just replaced one group of holders with another. If it dumps again next time, this group of 65% long accounts will be the first to get swept, and the orders forced out will themselves become fresh sell pressure.
Technically, everything is pinned near the lower boundary: 1-hour RSI is around 19, KDJ J is at -9, the Bollinger lower band at 0.068 has already been broken by about 8%, EMA12 is at 0.105, and ATR is roughly 24%. I do not treat 0.061 as a bottom. Until open interest falls back below 120 million contracts and long accounts drop under 45%, I would treat any rebound as short covering first. If price cannot reclaim the Bollinger lower band at 0.068, I would not add here myself. BULLA has no position in this stretch; first watch whether open interest and retail longs can truly cool off. Personal observation record.
$BULLA #合约数据 #positions
163
·
--
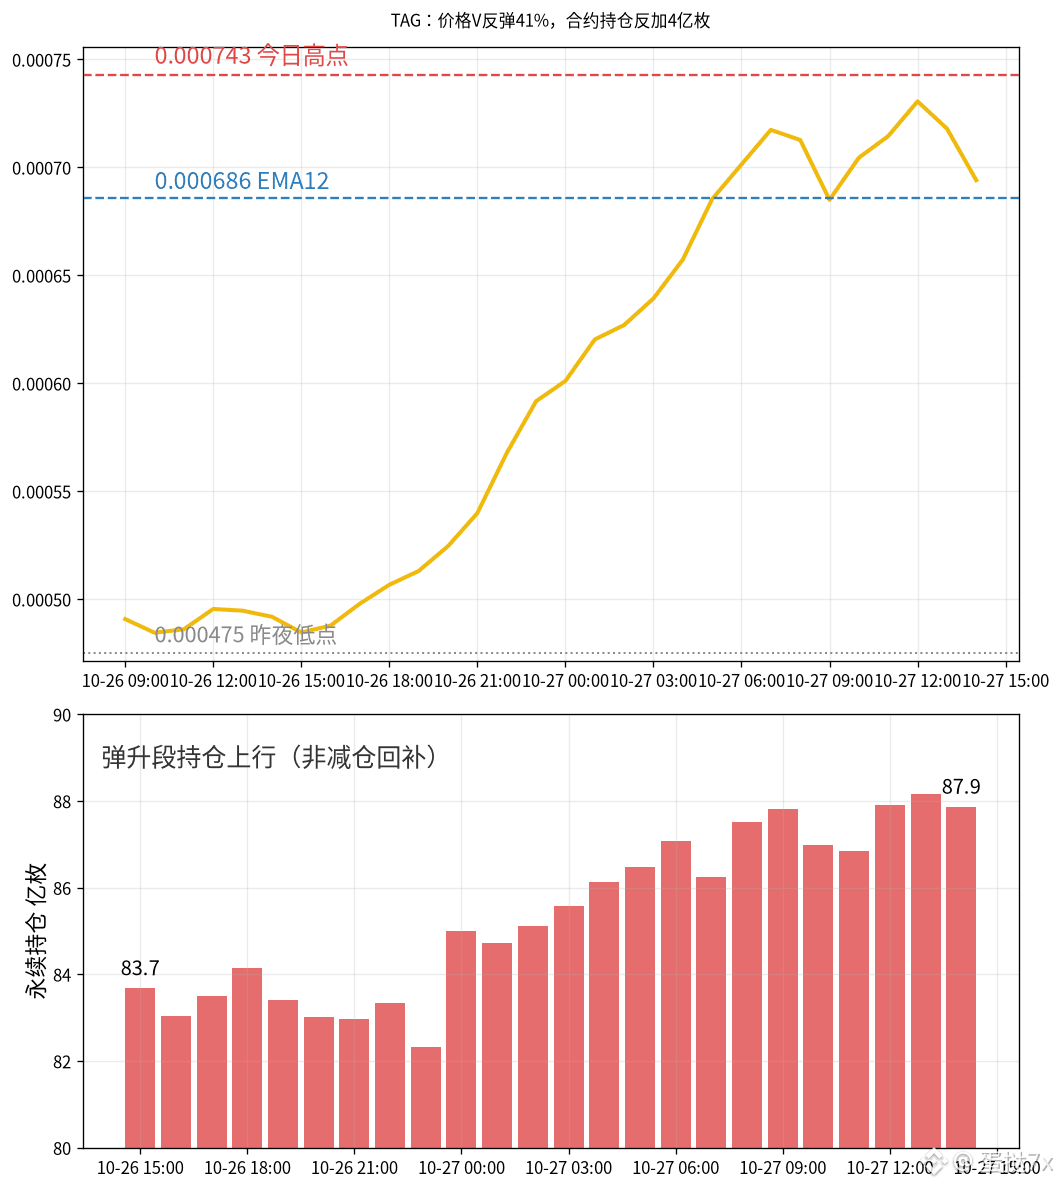
It bounced from last night’s low of 0.000475 to an intraday high of 0.000743, a roughly 56% V-shaped move. $TAG 24-hour contracts are still up about 41%, with roughly $42 million in trading volume. After a flush is complete, open interest usually drops first; yet Binance futures open interest has climbed from 8.35 billion tokens yesterday afternoon to nearly 8.79 billion now—the rally came with positions being added, not cut.
Who’s getting in? The share of retail accounts going long fell from 71% to 62%, while large traders’ long positions have stayed pinned near 52%, barely moving. The funding rate has sat at the 0.0005 floor continuously since yesterday, and the mark price has tracked the index closely. Price is rising and open interest is increasing, but there’s no long-side crowding premium in the funding rate—this doesn’t look like shorts getting squeezed out; it looks more like fresh longs being built at lower levels.
Yesterday at 16:38, I wrote: 0.000475 wasn’t a proper floor, and with open interest holding above 8 billion, there was still fuel for a sell-off. I was wrong about the floor—it V-rebounded more than 40% right after. But the point about positions not being fully unwound still stands: token open interest hasn’t fallen; it’s actually added about 400 million tokens during the rebound. After touching 0.000743 at 13:00 today, this 14:00 hourly candle has already closed at 0.000694, and the upper end is starting to give way.
Technicals: The 1-hour EMA12 is at 0.000686, and the EMA26 at 0.000635; the Bollinger midline is 0.000647 and the upper band 0.000785; price just touched the Keltner upper band at 0.000711 and then slipped back. The MACD histogram is still positive, but momentum is not as clean as in those surge candles around dawn. The key levels are these: if 0.000686 doesn’t hold, the next level to watch is the Bollinger midline; only a move back above the Keltner upper band at 0.000711 would support further upside.
The mechanics are simple: short covering causes open interest to contract; rising open interest means new positions are being opened during the rebound, not old shorts being closed. The trapped-position structure hasn’t been cleared out—its overall cost basis has just moved up a notch.
I see the area around 0.00074 as a high for the rebound, not a new platform. Until open interest falls below 8.4 billion tokens, watch the moving average at 0.000686 first on a pullback; if that breaks, the next level is the Bollinger midline at 0.000647. I have no position in this leg of TAG.
#TAG #合约持仓 #Rebound
It bounced from last night’s low of 0.000475 to an intraday high of 0.000743, a roughly 56% V-shaped move. $TAG 24-hour contracts are still up about 41%, with roughly $42 million in trading volume. After a flush is complete, open interest usually drops first; yet Binance futures open interest has climbed from 8.35 billion tokens yesterday afternoon to nearly 8.79 billion now—the rally came with positions being added, not cut.
Who’s getting in? The share of retail accounts going long fell from 71% to 62%, while large traders’ long positions have stayed pinned near 52%, barely moving. The funding rate has sat at the 0.0005 floor continuously since yesterday, and the mark price has tracked the index closely. Price is rising and open interest is increasing, but there’s no long-side crowding premium in the funding rate—this doesn’t look like shorts getting squeezed out; it looks more like fresh longs being built at lower levels.
Yesterday at 16:38, I wrote: 0.000475 wasn’t a proper floor, and with open interest holding above 8 billion, there was still fuel for a sell-off. I was wrong about the floor—it V-rebounded more than 40% right after. But the point about positions not being fully unwound still stands: token open interest hasn’t fallen; it’s actually added about 400 million tokens during the rebound. After touching 0.000743 at 13:00 today, this 14:00 hourly candle has already closed at 0.000694, and the upper end is starting to give way.
Technicals: The 1-hour EMA12 is at 0.000686, and the EMA26 at 0.000635; the Bollinger midline is 0.000647 and the upper band 0.000785; price just touched the Keltner upper band at 0.000711 and then slipped back. The MACD histogram is still positive, but momentum is not as clean as in those surge candles around dawn. The key levels are these: if 0.000686 doesn’t hold, the next level to watch is the Bollinger midline; only a move back above the Keltner upper band at 0.000711 would support further upside.
The mechanics are simple: short covering causes open interest to contract; rising open interest means new positions are being opened during the rebound, not old shorts being closed. The trapped-position structure hasn’t been cleared out—its overall cost basis has just moved up a notch.
I see the area around 0.00074 as a high for the rebound, not a new platform. Until open interest falls below 8.4 billion tokens, watch the moving average at 0.000686 first on a pullback; if that breaks, the next level is the Bollinger midline at 0.000647. I have no position in this leg of TAG.
#TAG #合约持仓 #Rebound
Who’s getting in? The share of retail accounts going long fell from 71% to 62%, while large traders’ long positions have stayed pinned near 52%, barely moving. The funding rate has sat at the 0.0005 floor continuously since yesterday, and the mark price has tracked the index closely. Price is rising and open interest is increasing, but there’s no long-side crowding premium in the funding rate—this doesn’t look like shorts getting squeezed out; it looks more like fresh longs being built at lower levels.
Yesterday at 16:38, I wrote: 0.000475 wasn’t a proper floor, and with open interest holding above 8 billion, there was still fuel for a sell-off. I was wrong about the floor—it V-rebounded more than 40% right after. But the point about positions not being fully unwound still stands: token open interest hasn’t fallen; it’s actually added about 400 million tokens during the rebound. After touching 0.000743 at 13:00 today, this 14:00 hourly candle has already closed at 0.000694, and the upper end is starting to give way.
Technicals: The 1-hour EMA12 is at 0.000686, and the EMA26 at 0.000635; the Bollinger midline is 0.000647 and the upper band 0.000785; price just touched the Keltner upper band at 0.000711 and then slipped back. The MACD histogram is still positive, but momentum is not as clean as in those surge candles around dawn. The key levels are these: if 0.000686 doesn’t hold, the next level to watch is the Bollinger midline; only a move back above the Keltner upper band at 0.000711 would support further upside.
The mechanics are simple: short covering causes open interest to contract; rising open interest means new positions are being opened during the rebound, not old shorts being closed. The trapped-position structure hasn’t been cleared out—its overall cost basis has just moved up a notch.
I see the area around 0.00074 as a high for the rebound, not a new platform. Until open interest falls below 8.4 billion tokens, watch the moving average at 0.000686 first on a pullback; if that breaks, the next level is the Bollinger midline at 0.000647. I have no position in this leg of TAG.
#TAG #合约持仓 #Rebound
114
·
--
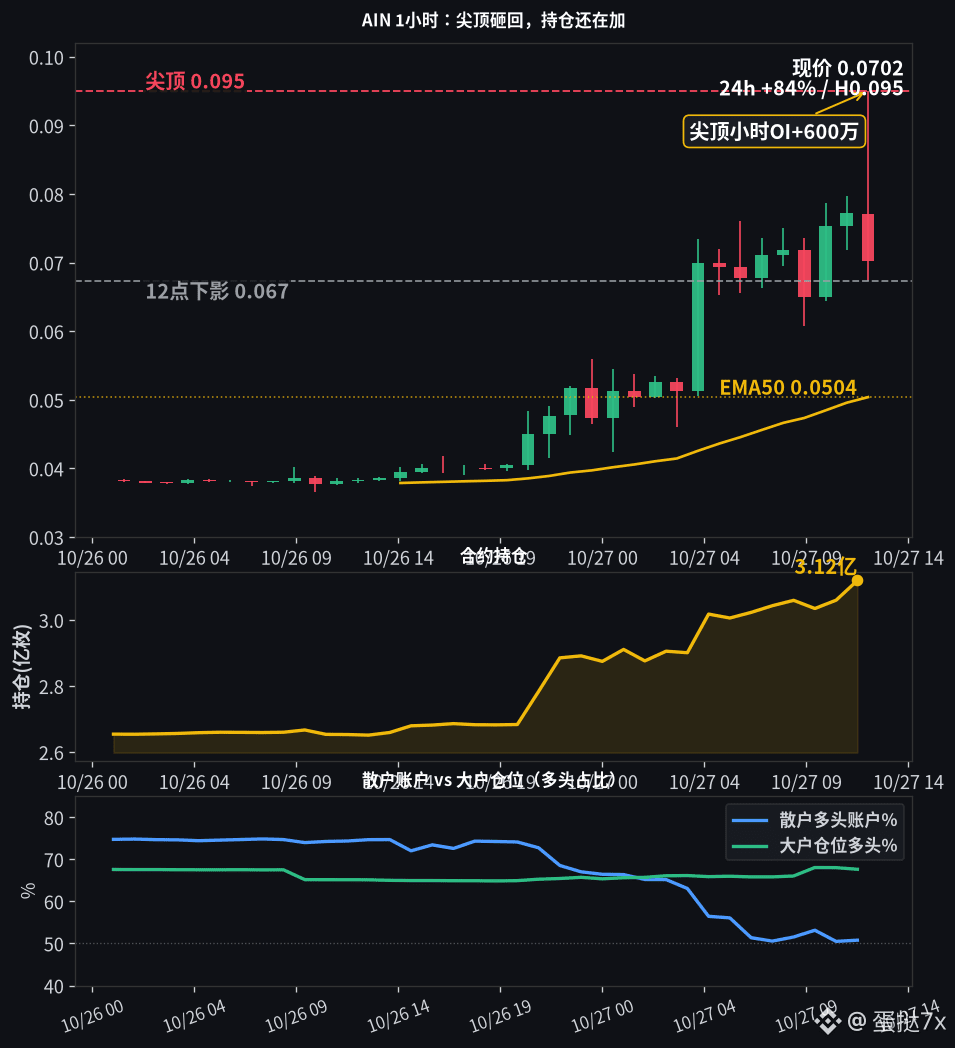
At noon, it touched 0.095 then got slammed back to 0.070, giving back about 26% from the spike high in a single candle. Open interest actually increased by 6 million tokens over that hour—$AIN . This wasn’t a flush-out; someone kept adding to their position near the spike high.
24-hour futures are still up about 84%, with a low of 0.0381 and an intraday high of 0.095, on roughly $132 million in volume. The price still looks like it’s in a short squeeze, but the share of retail accounts going long has already fallen from 74.7% before the pump to 50.8%. Meanwhile, large traders’ long positions, measured by position size, are holding at 67.6%. Retail traders have flipped short or reduced their longs as the price rose, while large traders have barely loosened their positions—the headcount and the money are moving in different directions.
Open interest tells it more plainly than the candlesticks. Before the move started at 8 p.m. last night, open interest was about 268 million tokens; now it’s 312 million, up roughly 44 million, or 16%. The noon hourly candle opened at 0.077, reached a high of 0.095 and a low of 0.067, then closed at 0.070. Over that same hour, open interest climbed from 306 million to 312 million. The funding rate settled at +0.138% at 8 a.m.; at noon it was still +0.059%, so longs are still paying. The mark price and index price are almost aligned, with no significant premium to exploit.
A different technical angle, not repeating the earlier points from today: the 1-hour EMA50 is at 0.0504, with the current price still about 39% above it; ATR is around 12%, widened by that spike candle; CCI is around 110, down from about 220 earlier; and the Williams indicator has fallen back to -47. Momentum has eased from extreme levels, but the moving average is still far below, suggesting this drop took out the spike—not the broader trend.
The mechanics are straightforward: most of the early shorts that were truly squeezed have already exited. The positions still hanging around 0.09 are late long entries; when the price gets slammed, they’re the first to be liquidated, and those liquidations themselves add selling pressure. Open interest is still rising, which means this batch hasn’t fully exited, so selling pressure can keep surfacing.
I see this leg as a spike-top washout that isn’t finished yet. If open interest doesn’t contract back below 300 million tokens, 0.070 is still just a passing price—not a new floor or a new base. On a rebound, first watch the lower wick around 0.067; if that breaks, the next level to watch is the moving average around 0.050. I have no position in AIN. These are my personal views.
#AIN #合约持仓 #SpikeTop
At noon, it touched 0.095 then got slammed back to 0.070, giving back about 26% from the spike high in a single candle. Open interest actually increased by 6 million tokens over that hour—$AIN . This wasn’t a flush-out; someone kept adding to their position near the spike high.
24-hour futures are still up about 84%, with a low of 0.0381 and an intraday high of 0.095, on roughly $132 million in volume. The price still looks like it’s in a short squeeze, but the share of retail accounts going long has already fallen from 74.7% before the pump to 50.8%. Meanwhile, large traders’ long positions, measured by position size, are holding at 67.6%. Retail traders have flipped short or reduced their longs as the price rose, while large traders have barely loosened their positions—the headcount and the money are moving in different directions.
Open interest tells it more plainly than the candlesticks. Before the move started at 8 p.m. last night, open interest was about 268 million tokens; now it’s 312 million, up roughly 44 million, or 16%. The noon hourly candle opened at 0.077, reached a high of 0.095 and a low of 0.067, then closed at 0.070. Over that same hour, open interest climbed from 306 million to 312 million. The funding rate settled at +0.138% at 8 a.m.; at noon it was still +0.059%, so longs are still paying. The mark price and index price are almost aligned, with no significant premium to exploit.
A different technical angle, not repeating the earlier points from today: the 1-hour EMA50 is at 0.0504, with the current price still about 39% above it; ATR is around 12%, widened by that spike candle; CCI is around 110, down from about 220 earlier; and the Williams indicator has fallen back to -47. Momentum has eased from extreme levels, but the moving average is still far below, suggesting this drop took out the spike—not the broader trend.
The mechanics are straightforward: most of the early shorts that were truly squeezed have already exited. The positions still hanging around 0.09 are late long entries; when the price gets slammed, they’re the first to be liquidated, and those liquidations themselves add selling pressure. Open interest is still rising, which means this batch hasn’t fully exited, so selling pressure can keep surfacing.
I see this leg as a spike-top washout that isn’t finished yet. If open interest doesn’t contract back below 300 million tokens, 0.070 is still just a passing price—not a new floor or a new base. On a rebound, first watch the lower wick around 0.067; if that breaks, the next level to watch is the moving average around 0.050. I have no position in AIN. These are my personal views.
#AIN #合约持仓 #SpikeTop
24-hour futures are still up about 84%, with a low of 0.0381 and an intraday high of 0.095, on roughly $132 million in volume. The price still looks like it’s in a short squeeze, but the share of retail accounts going long has already fallen from 74.7% before the pump to 50.8%. Meanwhile, large traders’ long positions, measured by position size, are holding at 67.6%. Retail traders have flipped short or reduced their longs as the price rose, while large traders have barely loosened their positions—the headcount and the money are moving in different directions.
Open interest tells it more plainly than the candlesticks. Before the move started at 8 p.m. last night, open interest was about 268 million tokens; now it’s 312 million, up roughly 44 million, or 16%. The noon hourly candle opened at 0.077, reached a high of 0.095 and a low of 0.067, then closed at 0.070. Over that same hour, open interest climbed from 306 million to 312 million. The funding rate settled at +0.138% at 8 a.m.; at noon it was still +0.059%, so longs are still paying. The mark price and index price are almost aligned, with no significant premium to exploit.
A different technical angle, not repeating the earlier points from today: the 1-hour EMA50 is at 0.0504, with the current price still about 39% above it; ATR is around 12%, widened by that spike candle; CCI is around 110, down from about 220 earlier; and the Williams indicator has fallen back to -47. Momentum has eased from extreme levels, but the moving average is still far below, suggesting this drop took out the spike—not the broader trend.
The mechanics are straightforward: most of the early shorts that were truly squeezed have already exited. The positions still hanging around 0.09 are late long entries; when the price gets slammed, they’re the first to be liquidated, and those liquidations themselves add selling pressure. Open interest is still rising, which means this batch hasn’t fully exited, so selling pressure can keep surfacing.
I see this leg as a spike-top washout that isn’t finished yet. If open interest doesn’t contract back below 300 million tokens, 0.070 is still just a passing price—not a new floor or a new base. On a rebound, first watch the lower wick around 0.067; if that breaks, the next level to watch is the moving average around 0.050. I have no position in AIN. These are my personal views.
#AIN #合约持仓 #SpikeTop
240
·
--
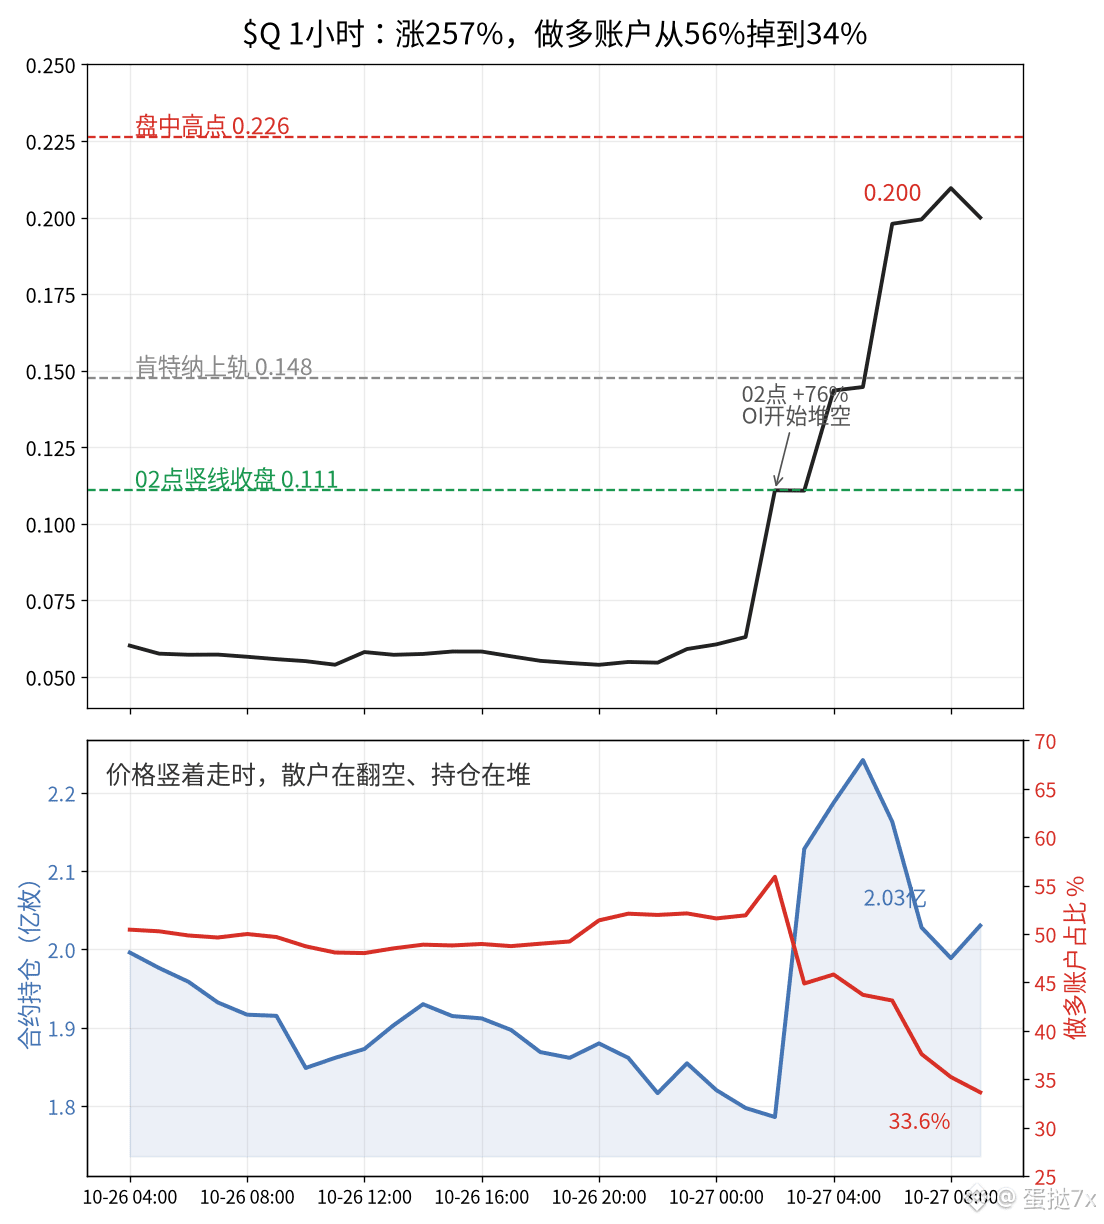
$Q surged from 0.055 to 0.226 overnight, up about 257% on 24-hour futures volume of roughly $640 million. The price nearly quadrupled, but the share of accounts going long on Binance futures fell from 56% at 2 a.m. to 34% now—over 60% of retail traders flipped short during the rally, leaving positioning completely at odds with the price.
The real twist is in positioning. Open interest was around 179 million coins before the 2 a.m. vertical move, then climbed to 224 million by 5 a.m.—up 45 million in three hours. Over the same period, large traders’ long positions, measured by position size, fell from 51% to 46%. This leg up was driven mainly by shorts adding to their positions, not by retail traders piling into longs. The 2 a.m. hourly candle surged 76%, and another candle at 6 a.m. gained 37%; those two green candles delivered most of the rally.
I wrote about this setup at 12:30 last night: when it plunged to 0.052, I said open interest was holding above 180 million and that I wouldn’t treat it as a new floor. I stayed out of both sides. I got the direction right, but didn’t expect shorts to pile up enough fuel between 0.06 and 0.20 to double down and drive the price straight through to 0.226.
Technicals are already at extremes: the 1-hour RSI is at 88, the KDJ J-line is at 93, and the current price is nearly 35% above the upper Keltner band at 0.148, while the EMA12 is still at 0.146. Hourly ATR is around 11%, so volatility hasn’t contracted at all. Funding briefly settled at positive 0.09% at 4 a.m., then flipped to negative 0.05% at 8 a.m.—during the short squeeze, both longs and shorts have been forced to pay.
The mechanism is simple: retail and large traders are both opening shorts near new highs. When shorts are forced to cover, that gives the price another push up; until the fuel runs out, people will keep buying the pullbacks too.
I see the spike to 0.226 as a high created by a short squeeze, and I won’t add to this move. Open interest needs to fall back below 190 million coins, and the share of accounts going long needs to reclaim 50% before the short fuel is gone. For a pullback, watch the Keltner band at 0.148. To change my view, I’d need to see open interest fall noticeably while the share of long accounts climbs back above half. Q I have no position.
#Q #合约持仓 #ShortSqueeze
$Q surged from 0.055 to 0.226 overnight, up about 257% on 24-hour futures volume of roughly $640 million. The price nearly quadrupled, but the share of accounts going long on Binance futures fell from 56% at 2 a.m. to 34% now—over 60% of retail traders flipped short during the rally, leaving positioning completely at odds with the price.
The real twist is in positioning. Open interest was around 179 million coins before the 2 a.m. vertical move, then climbed to 224 million by 5 a.m.—up 45 million in three hours. Over the same period, large traders’ long positions, measured by position size, fell from 51% to 46%. This leg up was driven mainly by shorts adding to their positions, not by retail traders piling into longs. The 2 a.m. hourly candle surged 76%, and another candle at 6 a.m. gained 37%; those two green candles delivered most of the rally.
I wrote about this setup at 12:30 last night: when it plunged to 0.052, I said open interest was holding above 180 million and that I wouldn’t treat it as a new floor. I stayed out of both sides. I got the direction right, but didn’t expect shorts to pile up enough fuel between 0.06 and 0.20 to double down and drive the price straight through to 0.226.
Technicals are already at extremes: the 1-hour RSI is at 88, the KDJ J-line is at 93, and the current price is nearly 35% above the upper Keltner band at 0.148, while the EMA12 is still at 0.146. Hourly ATR is around 11%, so volatility hasn’t contracted at all. Funding briefly settled at positive 0.09% at 4 a.m., then flipped to negative 0.05% at 8 a.m.—during the short squeeze, both longs and shorts have been forced to pay.
The mechanism is simple: retail and large traders are both opening shorts near new highs. When shorts are forced to cover, that gives the price another push up; until the fuel runs out, people will keep buying the pullbacks too.
I see the spike to 0.226 as a high created by a short squeeze, and I won’t add to this move. Open interest needs to fall back below 190 million coins, and the share of accounts going long needs to reclaim 50% before the short fuel is gone. For a pullback, watch the Keltner band at 0.148. To change my view, I’d need to see open interest fall noticeably while the share of long accounts climbs back above half. Q I have no position.
#Q #合约持仓 #ShortSqueeze
The real twist is in positioning. Open interest was around 179 million coins before the 2 a.m. vertical move, then climbed to 224 million by 5 a.m.—up 45 million in three hours. Over the same period, large traders’ long positions, measured by position size, fell from 51% to 46%. This leg up was driven mainly by shorts adding to their positions, not by retail traders piling into longs. The 2 a.m. hourly candle surged 76%, and another candle at 6 a.m. gained 37%; those two green candles delivered most of the rally.
I wrote about this setup at 12:30 last night: when it plunged to 0.052, I said open interest was holding above 180 million and that I wouldn’t treat it as a new floor. I stayed out of both sides. I got the direction right, but didn’t expect shorts to pile up enough fuel between 0.06 and 0.20 to double down and drive the price straight through to 0.226.
Technicals are already at extremes: the 1-hour RSI is at 88, the KDJ J-line is at 93, and the current price is nearly 35% above the upper Keltner band at 0.148, while the EMA12 is still at 0.146. Hourly ATR is around 11%, so volatility hasn’t contracted at all. Funding briefly settled at positive 0.09% at 4 a.m., then flipped to negative 0.05% at 8 a.m.—during the short squeeze, both longs and shorts have been forced to pay.
The mechanism is simple: retail and large traders are both opening shorts near new highs. When shorts are forced to cover, that gives the price another push up; until the fuel runs out, people will keep buying the pullbacks too.
I see the spike to 0.226 as a high created by a short squeeze, and I won’t add to this move. Open interest needs to fall back below 190 million coins, and the share of accounts going long needs to reclaim 50% before the short fuel is gone. For a pullback, watch the Keltner band at 0.148. To change my view, I’d need to see open interest fall noticeably while the share of long accounts climbs back above half. Q I have no position.
#Q #合约持仓 #ShortSqueeze
373
·
--
$LITE rose 8.2% to become the S&P’s top gainer, while spot trading looked like the whole optical-module chain was moving in sync; on Binance futures, open interest fell nearly 15% during the same green candle.
The stock closed Monday at 818.1 after touching 840.5 intraday, with volume of about 6 million shares—roughly 1.5 times the average of recent days. Sector peer $COHR also gained about 5.8%. The catalyst was StoneX initiating coverage with a Buy rating and a $1,200 price target, citing AI optical components selling out through 2029; Jefferies had also raised its target to $1,250 the week before last. Spot buyers are buying the “sold out through 2029” narrative.
The futures ledger tells a different story. Binance $LITEUSDT open interest was about 19,100 contracts when the U.S. market opened, then fell to around 16,300 near the close. The share of long accounts dropped from 79.8% to 60%; among large traders, the long share by position size fell from 80.4% to about 67%. Price surged while positions were unwound—that’s positions being closed for a profit, not leveraged longs piling in. The funding rate only reached 0.04% in the morning, and no one was paying up to chase longs.
The mechanics are straightforward: spot is using analyst coverage and the sellout narrative to push valuations higher, while futures traders are using this green candle to exit. If the price pulls back later, there will be less long-position fuel lined up to be liquidated. Whoever was squeezed out on this green candle can no longer provide liquidity for the next leg down.
The 1-hour RSI is at 71.4, and the price has already moved above the Keltner upper band at 827. The EMA12 is at 821, while the Bollinger upper band is around 866 and hasn’t been touched. The daily RSI is only 44, the EMA12 is near 831, and the MACD histogram is still negative at about -5.6. Short-term conditions are hot, but the medium-term picture hasn’t overheated along with them. The price is still a way off the October 8 high of 1,143; this rally looks more like a recovery from last week’s low near 756 than a breakout to new highs.
I see the intraday high of 840 as an emotional spike, not the start of a new base. Only if futures open interest builds back above 18,000 contracts and the daily close holds above 818 will it make sense to talk about whether the price can reach higher. On a pullback, the first level to watch is the hourly moving average at 821. I’m not holding a position in LITE here.
#美股 #光模块 #LITE
$LITE rose 8.2% to become the S&P’s top gainer, while spot trading looked like the whole optical-module chain was moving in sync; on Binance futures, open interest fell nearly 15% during the same green candle.
The stock closed Monday at 818.1 after touching 840.5 intraday, with volume of about 6 million shares—roughly 1.5 times the average of recent days. Sector peer $COHR also gained about 5.8%. The catalyst was StoneX initiating coverage with a Buy rating and a $1,200 price target, citing AI optical components selling out through 2029; Jefferies had also raised its target to $1,250 the week before last. Spot buyers are buying the “sold out through 2029” narrative.
The futures ledger tells a different story. Binance $LITEUSDT open interest was about 19,100 contracts when the U.S. market opened, then fell to around 16,300 near the close. The share of long accounts dropped from 79.8% to 60%; among large traders, the long share by position size fell from 80.4% to about 67%. Price surged while positions were unwound—that’s positions being closed for a profit, not leveraged longs piling in. The funding rate only reached 0.04% in the morning, and no one was paying up to chase longs.
The mechanics are straightforward: spot is using analyst coverage and the sellout narrative to push valuations higher, while futures traders are using this green candle to exit. If the price pulls back later, there will be less long-position fuel lined up to be liquidated. Whoever was squeezed out on this green candle can no longer provide liquidity for the next leg down.
The 1-hour RSI is at 71.4, and the price has already moved above the Keltner upper band at 827. The EMA12 is at 821, while the Bollinger upper band is around 866 and hasn’t been touched. The daily RSI is only 44, the EMA12 is near 831, and the MACD histogram is still negative at about -5.6. Short-term conditions are hot, but the medium-term picture hasn’t overheated along with them. The price is still a way off the October 8 high of 1,143; this rally looks more like a recovery from last week’s low near 756 than a breakout to new highs.
I see the intraday high of 840 as an emotional spike, not the start of a new base. Only if futures open interest builds back above 18,000 contracts and the daily close holds above 818 will it make sense to talk about whether the price can reach higher. On a pullback, the first level to watch is the hourly moving average at 821. I’m not holding a position in LITE here.
#美股 #光模块 #LITE
The stock closed Monday at 818.1 after touching 840.5 intraday, with volume of about 6 million shares—roughly 1.5 times the average of recent days. Sector peer $COHR also gained about 5.8%. The catalyst was StoneX initiating coverage with a Buy rating and a $1,200 price target, citing AI optical components selling out through 2029; Jefferies had also raised its target to $1,250 the week before last. Spot buyers are buying the “sold out through 2029” narrative.
The futures ledger tells a different story. Binance $LITEUSDT open interest was about 19,100 contracts when the U.S. market opened, then fell to around 16,300 near the close. The share of long accounts dropped from 79.8% to 60%; among large traders, the long share by position size fell from 80.4% to about 67%. Price surged while positions were unwound—that’s positions being closed for a profit, not leveraged longs piling in. The funding rate only reached 0.04% in the morning, and no one was paying up to chase longs.
The mechanics are straightforward: spot is using analyst coverage and the sellout narrative to push valuations higher, while futures traders are using this green candle to exit. If the price pulls back later, there will be less long-position fuel lined up to be liquidated. Whoever was squeezed out on this green candle can no longer provide liquidity for the next leg down.
The 1-hour RSI is at 71.4, and the price has already moved above the Keltner upper band at 827. The EMA12 is at 821, while the Bollinger upper band is around 866 and hasn’t been touched. The daily RSI is only 44, the EMA12 is near 831, and the MACD histogram is still negative at about -5.6. Short-term conditions are hot, but the medium-term picture hasn’t overheated along with them. The price is still a way off the October 8 high of 1,143; this rally looks more like a recovery from last week’s low near 756 than a breakout to new highs.
I see the intraday high of 840 as an emotional spike, not the start of a new base. Only if futures open interest builds back above 18,000 contracts and the daily close holds above 818 will it make sense to talk about whether the price can reach higher. On a pullback, the first level to watch is the hourly moving average at 821. I’m not holding a position in LITE here.
#美股 #光模块 #LITE
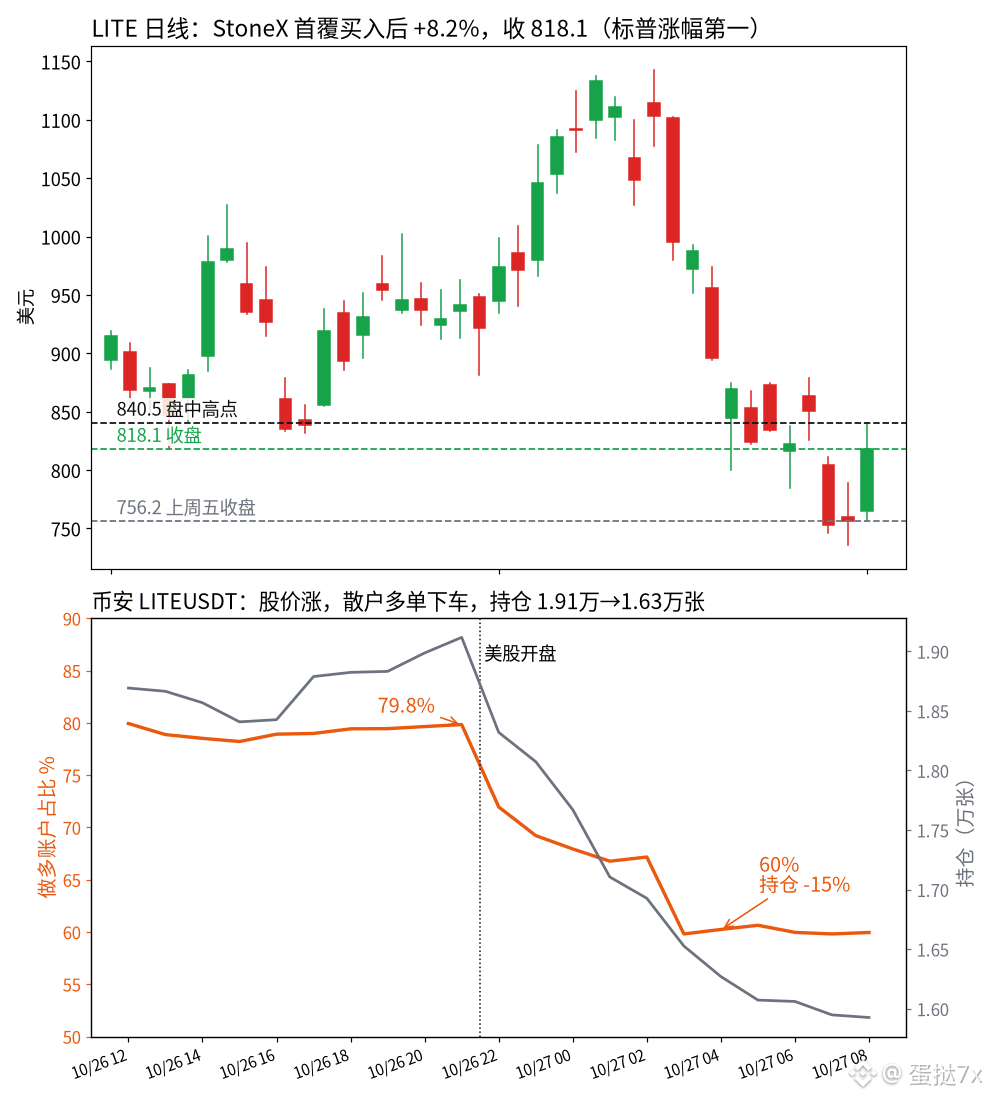
333
·
--
Partly True
$TSLA Tesla opened up 6% in the first hour, and TSLA futures open interest on Binance increased by 16% in the same hour, but the share of long positions held by large accounts actually fell from 61% to 55% — a lot of the new money in this bullish candle was actually betting short.
The trigger was Barclays raising Tesla to overweight, with the target price lifted from 370 to 450, mainly based on expectations around a merger with SpaceX. In the U.S. stock market, the price rose from Friday’s close of 372.2 to around 395, with volume already reaching 22 million shares.
The derivatives data is even more interesting. The 21:00 hourly candle pushed straight from 381.3 to 395.5, with nearly $80 million traded in one hour, about nine times the largest hourly volume during the daytime. Before the open, open interest was 134,000 contracts; after the open it briefly surged to 159,000, and now it’s 156,000. Over the same period, the long position share of large accounts kept dropping from 61.0% to 54.7%, and the long account ratio among retail traders also fell from 72% to 68%. Funding was flat at 0 the whole time. Price moved up, open interest exploded, and the long share among large accounts declined — the most reasonable explanation is that a group of accounts was shorting this rating upgrade against the trend around 395.
On the technical side, the daily EMA200 is at 386.2, which is the first time it has been reclaimed since July; the daily Bollinger upper band is at 394, and price is sitting just outside it; daily RSI is 61, not yet overbought. Daily ATR is about 11.7, and today’s range was 12.8, meaning the day played out within a normal volatility range.
The mechanics are simple: most of these new short positions have cost bases between 390 and 397. As long as price holds the EMA200 at 386, every extra day they endure becomes ready-made buy-side stop-loss liquidity. On the other hand, if the merger narrative cools off and daily price closes back below 386, those shorts are right, and a move back toward 380 would not be surprising.
My view is bullish. Today’s move is not about the rating itself, but about the fact that price reclaimed EMA200 while someone was adding the other way. If 386 holds, the short squeeze likely isn’t over yet. I don’t hold a TSLA position myself; I’m just watching where the daily candle closes tonight.
#特斯拉 #USStocks
$TSLA Tesla opened up 6% in the first hour, and TSLA futures open interest on Binance increased by 16% in the same hour, but the share of long positions held by large accounts actually fell from 61% to 55% — a lot of the new money in this bullish candle was actually betting short.
The trigger was Barclays raising Tesla to overweight, with the target price lifted from 370 to 450, mainly based on expectations around a merger with SpaceX. In the U.S. stock market, the price rose from Friday’s close of 372.2 to around 395, with volume already reaching 22 million shares.
The derivatives data is even more interesting. The 21:00 hourly candle pushed straight from 381.3 to 395.5, with nearly $80 million traded in one hour, about nine times the largest hourly volume during the daytime. Before the open, open interest was 134,000 contracts; after the open it briefly surged to 159,000, and now it’s 156,000. Over the same period, the long position share of large accounts kept dropping from 61.0% to 54.7%, and the long account ratio among retail traders also fell from 72% to 68%. Funding was flat at 0 the whole time. Price moved up, open interest exploded, and the long share among large accounts declined — the most reasonable explanation is that a group of accounts was shorting this rating upgrade against the trend around 395.
On the technical side, the daily EMA200 is at 386.2, which is the first time it has been reclaimed since July; the daily Bollinger upper band is at 394, and price is sitting just outside it; daily RSI is 61, not yet overbought. Daily ATR is about 11.7, and today’s range was 12.8, meaning the day played out within a normal volatility range.
The mechanics are simple: most of these new short positions have cost bases between 390 and 397. As long as price holds the EMA200 at 386, every extra day they endure becomes ready-made buy-side stop-loss liquidity. On the other hand, if the merger narrative cools off and daily price closes back below 386, those shorts are right, and a move back toward 380 would not be surprising.
My view is bullish. Today’s move is not about the rating itself, but about the fact that price reclaimed EMA200 while someone was adding the other way. If 386 holds, the short squeeze likely isn’t over yet. I don’t hold a TSLA position myself; I’m just watching where the daily candle closes tonight.
#特斯拉 #USStocks
The trigger was Barclays raising Tesla to overweight, with the target price lifted from 370 to 450, mainly based on expectations around a merger with SpaceX. In the U.S. stock market, the price rose from Friday’s close of 372.2 to around 395, with volume already reaching 22 million shares.
The derivatives data is even more interesting. The 21:00 hourly candle pushed straight from 381.3 to 395.5, with nearly $80 million traded in one hour, about nine times the largest hourly volume during the daytime. Before the open, open interest was 134,000 contracts; after the open it briefly surged to 159,000, and now it’s 156,000. Over the same period, the long position share of large accounts kept dropping from 61.0% to 54.7%, and the long account ratio among retail traders also fell from 72% to 68%. Funding was flat at 0 the whole time. Price moved up, open interest exploded, and the long share among large accounts declined — the most reasonable explanation is that a group of accounts was shorting this rating upgrade against the trend around 395.
On the technical side, the daily EMA200 is at 386.2, which is the first time it has been reclaimed since July; the daily Bollinger upper band is at 394, and price is sitting just outside it; daily RSI is 61, not yet overbought. Daily ATR is about 11.7, and today’s range was 12.8, meaning the day played out within a normal volatility range.
The mechanics are simple: most of these new short positions have cost bases between 390 and 397. As long as price holds the EMA200 at 386, every extra day they endure becomes ready-made buy-side stop-loss liquidity. On the other hand, if the merger narrative cools off and daily price closes back below 386, those shorts are right, and a move back toward 380 would not be surprising.
My view is bullish. Today’s move is not about the rating itself, but about the fact that price reclaimed EMA200 while someone was adding the other way. If 386 holds, the short squeeze likely isn’t over yet. I don’t hold a TSLA position myself; I’m just watching where the daily candle closes tonight.
#特斯拉 #USStocks
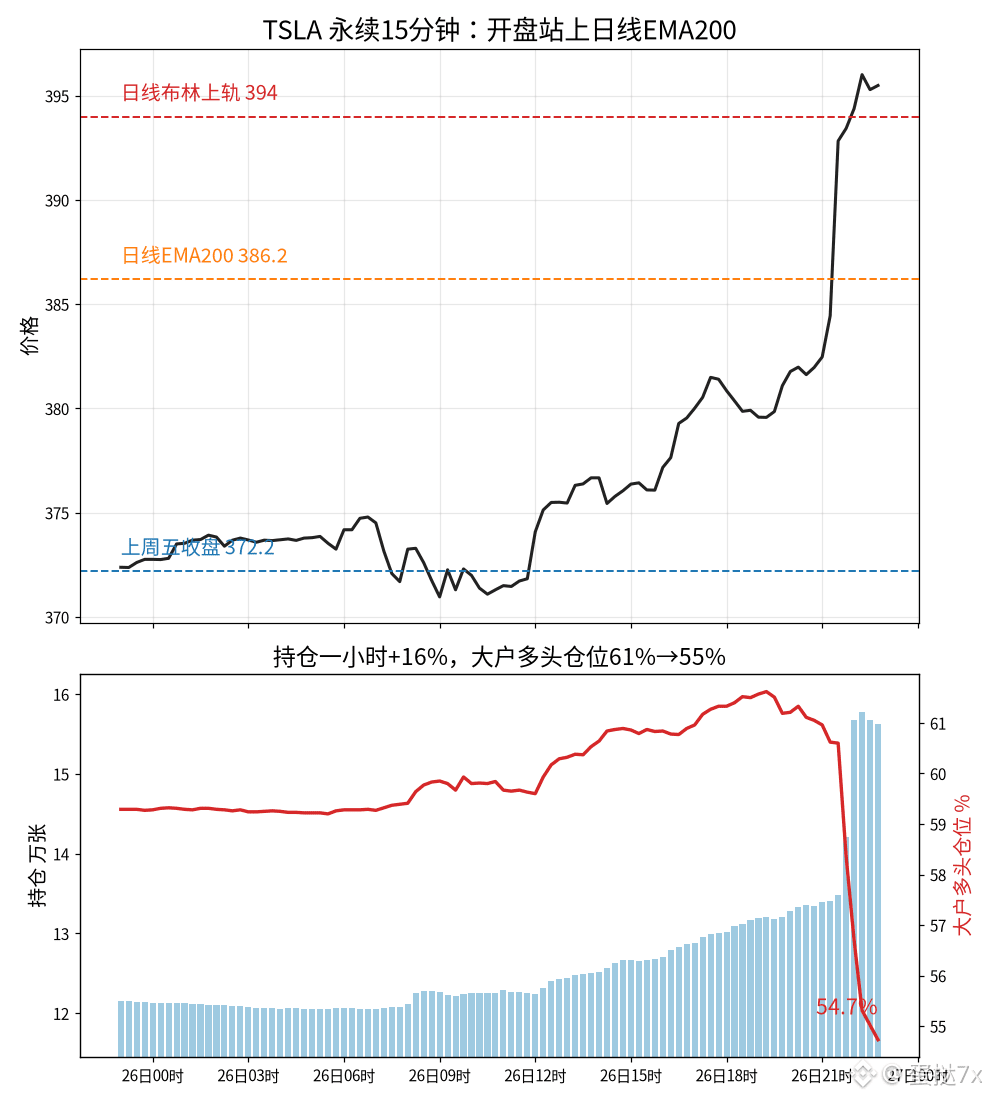
342
·
--
$EWZ At the open, it plunged 24%, falling from 42.59 last Friday to 32.43, on track for its biggest single-day drop in 26 years. Yet at the same time, the share of accounts going long on Binance futures climbed from 47% to 72%.
The trigger was the second round of Brazil’s presidential election on Sunday, when Lula unexpectedly won reelection. After the first round, the market had bet on Flávio Bolsonaro taking office and tightening fiscal policy. Brazilian stocks and the real had already rallied sharply in anticipation; once the result came in, those positions all had to be unwound in a single day. Bank stocks such as Itaú, Bradesco, and Nu fell 20–30%, $XP nearly halved, and the real weakened by around 10%.
What I’m watching is positioning in the futures market. Open interest was around 42,000 contracts on Sunday night; now it’s close to 200,000, nearly five times higher. The share of accounts going long rose from 46.7% to 72%, while the share of large traders’ positions that were long actually fell from 58.7% to 55.5%. Most of the roughly 100,000-plus new contracts were opened between 31 and 37. The dip buyers are mainly retail traders, while large traders are reducing their positions. At 8 a.m., the funding rate briefly hit -1.52%—shorts were extremely crowded then. It’s now back around 0.04%. The rate has turned positive, meaning longs are now paying to hold their positions; most of the fuel for a short squeeze has burned off.
Technically: the daily RSI is 27, the lower Bollinger Band is 35.1, and the 200-day EMA is at 36.4. Price has broken below both. The one-hour ATR is about 4%. Less than half an hour after the U.S. market opened, more than 74 million shares of EWZ had already traded. The nearest reference below is 29.98, the level futures hit in the afternoon, followed by the low from a year ago, around 30.44.
Retail traders are using leverage to buy around 32. If the price returns to 30, these long positions will be liquidated first, and those liquidations will themselves create fresh selling pressure. Until price gets back above the lower Bollinger Band at 35.1, I won’t treat any intraday bounce as a bottom—just a technical rebound after an oversold selloff.
I haven’t touched EWZ myself. With a gap move driven by election pricing like this, I’m just watching to see when leveraged longs have finished unwinding.
#美股 #Brazil
Personal opinion
$EWZ At the open, it plunged 24%, falling from 42.59 last Friday to 32.43, on track for its biggest single-day drop in 26 years. Yet at the same time, the share of accounts going long on Binance futures climbed from 47% to 72%.
The trigger was the second round of Brazil’s presidential election on Sunday, when Lula unexpectedly won reelection. After the first round, the market had bet on Flávio Bolsonaro taking office and tightening fiscal policy. Brazilian stocks and the real had already rallied sharply in anticipation; once the result came in, those positions all had to be unwound in a single day. Bank stocks such as Itaú, Bradesco, and Nu fell 20–30%, $XP nearly halved, and the real weakened by around 10%.
What I’m watching is positioning in the futures market. Open interest was around 42,000 contracts on Sunday night; now it’s close to 200,000, nearly five times higher. The share of accounts going long rose from 46.7% to 72%, while the share of large traders’ positions that were long actually fell from 58.7% to 55.5%. Most of the roughly 100,000-plus new contracts were opened between 31 and 37. The dip buyers are mainly retail traders, while large traders are reducing their positions. At 8 a.m., the funding rate briefly hit -1.52%—shorts were extremely crowded then. It’s now back around 0.04%. The rate has turned positive, meaning longs are now paying to hold their positions; most of the fuel for a short squeeze has burned off.
Technically: the daily RSI is 27, the lower Bollinger Band is 35.1, and the 200-day EMA is at 36.4. Price has broken below both. The one-hour ATR is about 4%. Less than half an hour after the U.S. market opened, more than 74 million shares of EWZ had already traded. The nearest reference below is 29.98, the level futures hit in the afternoon, followed by the low from a year ago, around 30.44.
Retail traders are using leverage to buy around 32. If the price returns to 30, these long positions will be liquidated first, and those liquidations will themselves create fresh selling pressure. Until price gets back above the lower Bollinger Band at 35.1, I won’t treat any intraday bounce as a bottom—just a technical rebound after an oversold selloff.
I haven’t touched EWZ myself. With a gap move driven by election pricing like this, I’m just watching to see when leveraged longs have finished unwinding.
#美股 #Brazil
Personal opinion
The trigger was the second round of Brazil’s presidential election on Sunday, when Lula unexpectedly won reelection. After the first round, the market had bet on Flávio Bolsonaro taking office and tightening fiscal policy. Brazilian stocks and the real had already rallied sharply in anticipation; once the result came in, those positions all had to be unwound in a single day. Bank stocks such as Itaú, Bradesco, and Nu fell 20–30%, $XP nearly halved, and the real weakened by around 10%.
What I’m watching is positioning in the futures market. Open interest was around 42,000 contracts on Sunday night; now it’s close to 200,000, nearly five times higher. The share of accounts going long rose from 46.7% to 72%, while the share of large traders’ positions that were long actually fell from 58.7% to 55.5%. Most of the roughly 100,000-plus new contracts were opened between 31 and 37. The dip buyers are mainly retail traders, while large traders are reducing their positions. At 8 a.m., the funding rate briefly hit -1.52%—shorts were extremely crowded then. It’s now back around 0.04%. The rate has turned positive, meaning longs are now paying to hold their positions; most of the fuel for a short squeeze has burned off.
Technically: the daily RSI is 27, the lower Bollinger Band is 35.1, and the 200-day EMA is at 36.4. Price has broken below both. The one-hour ATR is about 4%. Less than half an hour after the U.S. market opened, more than 74 million shares of EWZ had already traded. The nearest reference below is 29.98, the level futures hit in the afternoon, followed by the low from a year ago, around 30.44.
Retail traders are using leverage to buy around 32. If the price returns to 30, these long positions will be liquidated first, and those liquidations will themselves create fresh selling pressure. Until price gets back above the lower Bollinger Band at 35.1, I won’t treat any intraday bounce as a bottom—just a technical rebound after an oversold selloff.
I haven’t touched EWZ myself. With a gap move driven by election pricing like this, I’m just watching to see when leveraged longs have finished unwinding.
#美股 #Brazil
Personal opinion
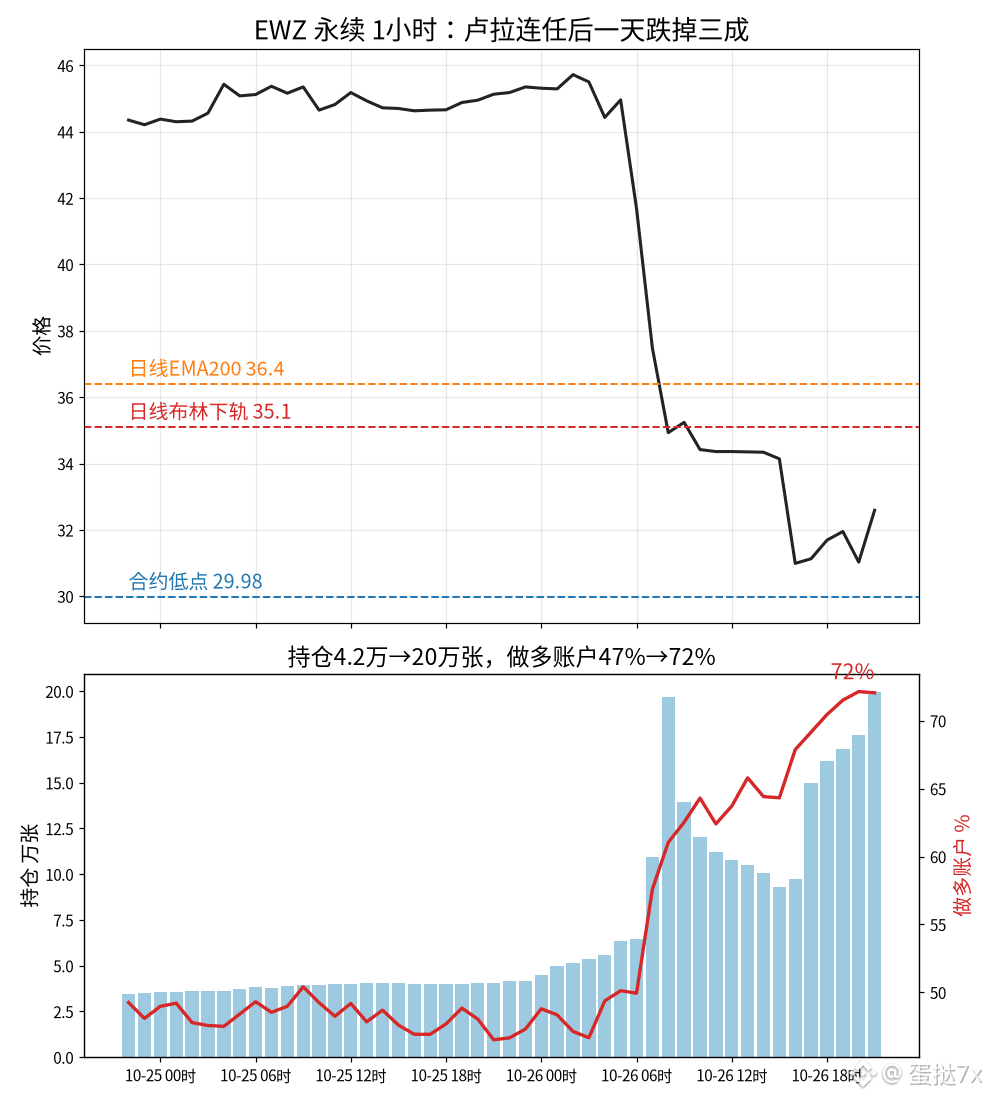
350
·
--
Large traders’ long positions fell from 62.8% to 58.2%, while $QNT just touched 223.8—the 24-hour futures contract is up about 19%, with roughly $200 million in trading volume. A move like this is usually read as shorts getting squeezed and longs taking over. But at the same time, the share of retail accounts going long rose from 54.6% to 56.6%, and open interest climbed from the morning low of 135,400 contracts back to 153,400. During this leg to a new high, large traders were reducing longs while retail traders chased the move, and positions were being rebuilt—not a vacuum left behind after shorts were completely liquidated.
Who’s paying for it? The real vertical move came between 17:00 and 20:00: the 17:00 hourly candle rose from 198 to 209; at 19:00, one-hour volume reached about $37 million and price touched a high of 221.8; at 20:00, it touched 223.8 before pulling back to around 218. Open interest surged from 138,100 contracts at 17:00 to 149,300 at 20:00, and now stands at 153,400—already above yesterday’s daytime peak of roughly 149,500. Funding rates are still near zero, even slightly negative, and the mark price is almost level with the index price—the squeeze isn’t particularly extreme. This looks more like retail traders buying from large traders as they reduce positions at the highs. The morning move, when open interest fell from around 146,000 to 135,000, was where leverage was first flushed out; the evening rally has since rebuilt those positions. The taker buy/sell ratio hovered around 1.0 for most of the rally, with no one-sided wave of aggressive long buying. That suggests that unless new shorts are forced to close, this spike could easily turn into a one-day chase by momentum buyers.
Technically, price is stretched beyond the upper bands: the 1-hour RSI is around 85, the KDJ J-line is at 92, the Bollinger upper band at 214 has been left behind, and the Keltner upper band at 210 is also in the rearview mirror. EMA12 is at 203, and ATR is about 2.6%. I’m not adding to my position at this 223 spike. A pullback would first target the Bollinger upper band at 214. If open interest remains above 145,000 and retail longs stay around 55%, then this leg is still being driven by buyers chasing the move. To change my view, I’d need to see open interest fall back below 140,000 and large traders’ long positions recover above 62%. I’m staying out of both sides of this QNT move.
#QNT #合约持仓 #Crypto
Large traders’ long positions fell from 62.8% to 58.2%, while $QNT just touched 223.8—the 24-hour futures contract is up about 19%, with roughly $200 million in trading volume. A move like this is usually read as shorts getting squeezed and longs taking over. But at the same time, the share of retail accounts going long rose from 54.6% to 56.6%, and open interest climbed from the morning low of 135,400 contracts back to 153,400. During this leg to a new high, large traders were reducing longs while retail traders chased the move, and positions were being rebuilt—not a vacuum left behind after shorts were completely liquidated.
Who’s paying for it? The real vertical move came between 17:00 and 20:00: the 17:00 hourly candle rose from 198 to 209; at 19:00, one-hour volume reached about $37 million and price touched a high of 221.8; at 20:00, it touched 223.8 before pulling back to around 218. Open interest surged from 138,100 contracts at 17:00 to 149,300 at 20:00, and now stands at 153,400—already above yesterday’s daytime peak of roughly 149,500. Funding rates are still near zero, even slightly negative, and the mark price is almost level with the index price—the squeeze isn’t particularly extreme. This looks more like retail traders buying from large traders as they reduce positions at the highs. The morning move, when open interest fell from around 146,000 to 135,000, was where leverage was first flushed out; the evening rally has since rebuilt those positions. The taker buy/sell ratio hovered around 1.0 for most of the rally, with no one-sided wave of aggressive long buying. That suggests that unless new shorts are forced to close, this spike could easily turn into a one-day chase by momentum buyers.
Technically, price is stretched beyond the upper bands: the 1-hour RSI is around 85, the KDJ J-line is at 92, the Bollinger upper band at 214 has been left behind, and the Keltner upper band at 210 is also in the rearview mirror. EMA12 is at 203, and ATR is about 2.6%. I’m not adding to my position at this 223 spike. A pullback would first target the Bollinger upper band at 214. If open interest remains above 145,000 and retail longs stay around 55%, then this leg is still being driven by buyers chasing the move. To change my view, I’d need to see open interest fall back below 140,000 and large traders’ long positions recover above 62%. I’m staying out of both sides of this QNT move.
#QNT #合约持仓 #Crypto
Who’s paying for it? The real vertical move came between 17:00 and 20:00: the 17:00 hourly candle rose from 198 to 209; at 19:00, one-hour volume reached about $37 million and price touched a high of 221.8; at 20:00, it touched 223.8 before pulling back to around 218. Open interest surged from 138,100 contracts at 17:00 to 149,300 at 20:00, and now stands at 153,400—already above yesterday’s daytime peak of roughly 149,500. Funding rates are still near zero, even slightly negative, and the mark price is almost level with the index price—the squeeze isn’t particularly extreme. This looks more like retail traders buying from large traders as they reduce positions at the highs. The morning move, when open interest fell from around 146,000 to 135,000, was where leverage was first flushed out; the evening rally has since rebuilt those positions. The taker buy/sell ratio hovered around 1.0 for most of the rally, with no one-sided wave of aggressive long buying. That suggests that unless new shorts are forced to close, this spike could easily turn into a one-day chase by momentum buyers.
Technically, price is stretched beyond the upper bands: the 1-hour RSI is around 85, the KDJ J-line is at 92, the Bollinger upper band at 214 has been left behind, and the Keltner upper band at 210 is also in the rearview mirror. EMA12 is at 203, and ATR is about 2.6%. I’m not adding to my position at this 223 spike. A pullback would first target the Bollinger upper band at 214. If open interest remains above 145,000 and retail longs stay around 55%, then this leg is still being driven by buyers chasing the move. To change my view, I’d need to see open interest fall back below 140,000 and large traders’ long positions recover above 62%. I’m staying out of both sides of this QNT move.
#QNT #合约持仓 #Crypto
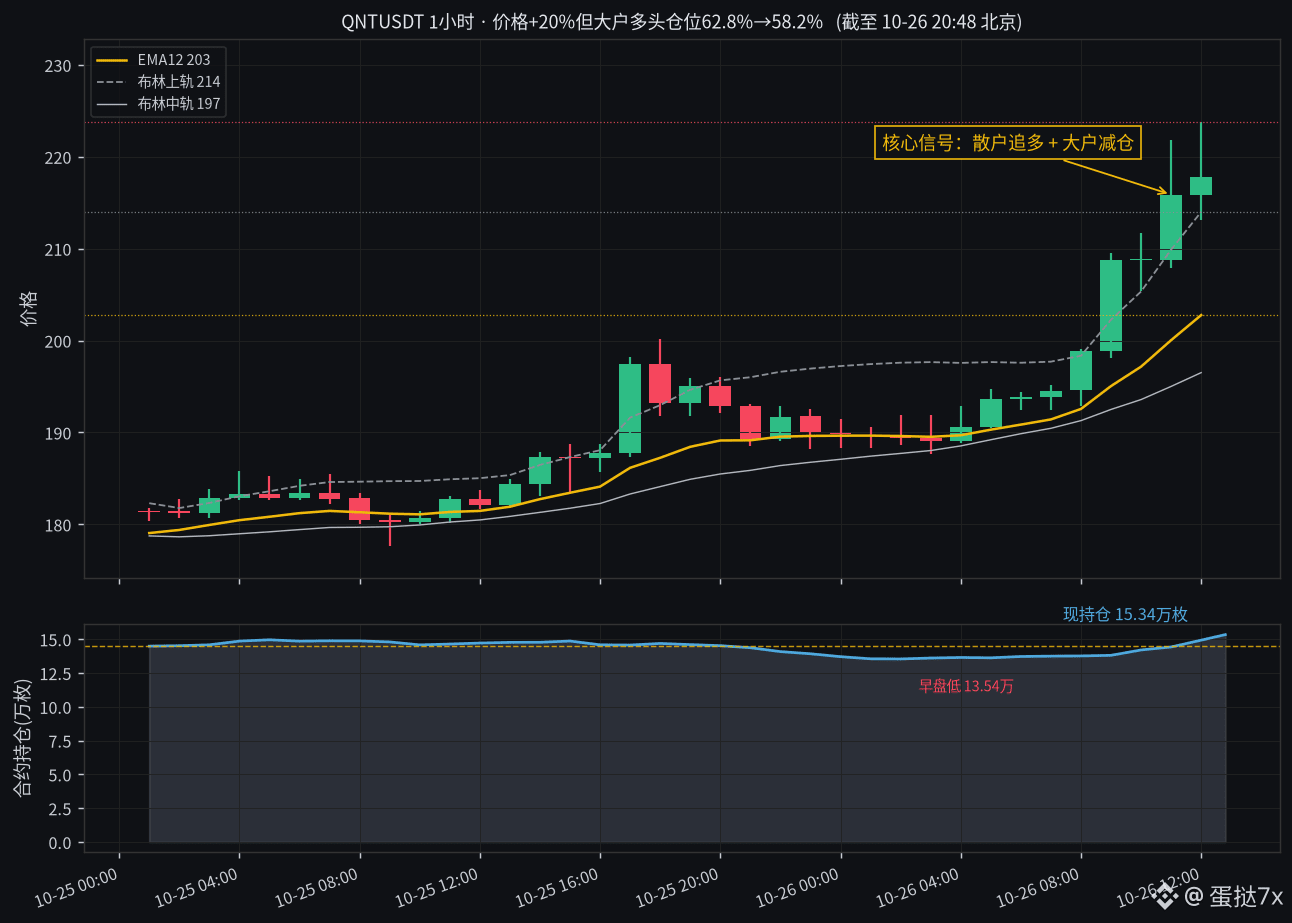
171
·
--
The $ARIA 24-hour contract rose about 26%, with a low of 0.0705 and an intraday high of 0.0953, on roughly $50 million in volume. A rally like this is usually seen as retail piling into longs and shorts getting squeezed. But on Binance, the share of accounts net long fell from 65.6% overnight to 61.7% now, while open interest only rose from about 120 million to 124 million tokens—a 3% increase in positions versus a 25% price jump. The main force behind the move wasn’t longs chasing the rally and building positions; it looks more like shorts covering and traders trying to short the move being forced to buy.
Who’s paying for the move? From overnight into early morning, price climbed from 0.073 to 0.084 while open interest barely budged—a classic short-covering rally. The only meaningful increase in positions came with the 16:00 spike: the price briefly hit 0.0953, with about $6.78 million in volume, and open interest rose from 123 million to 124.5 million. It then fell back to 0.087 at the close, before the 17:00 candle pushed it back to 0.091. Large traders’ long-position share eased from about 65% to 63.5%, moving in the same direction as retail traders. That’s not large traders stepping in to keep buying at the highs. Funding rates fluctuated between 0.05% and 0.03% during the day, settling at around 0.013% at 16:00. The mark price was only about 0.3% above the index, so the squeeze hasn’t reached an extreme—but the move is already being driven by shorts covering. The taker buy/sell ratio spent most of the afternoon hovering near 1.0, with no one-sided wave of long buying. That suggests the chase is on shaky footing; without fresh forced short liquidations, this spike could easily turn into a one-day wonder.
Technically, price is pressing against the upper end of the range: the 1-hour RSI is about 70.6, the KDJ J-line is at 78, and price has just touched the Bollinger upper band at 0.091. It has already moved past the Keltner upper band at 0.089. The EMA12 is at 0.084, and ATR is about 5%. I wouldn’t add to a position at the 0.095 spike. On a pullback, the first level to watch is the moving average around 0.084. If open interest stays above 122 million and the share of long accounts keeps falling, the squeeze could continue a bit further. To change my view, I’d need to see open interest break below 118 million and the long-account share climb back above 65%. I’m staying out of both sides of this ARIA move.
#ARIA #合约持仓 #Cryptocurrency
The $ARIA 24-hour contract rose about 26%, with a low of 0.0705 and an intraday high of 0.0953, on roughly $50 million in volume. A rally like this is usually seen as retail piling into longs and shorts getting squeezed. But on Binance, the share of accounts net long fell from 65.6% overnight to 61.7% now, while open interest only rose from about 120 million to 124 million tokens—a 3% increase in positions versus a 25% price jump. The main force behind the move wasn’t longs chasing the rally and building positions; it looks more like shorts covering and traders trying to short the move being forced to buy.
Who’s paying for the move? From overnight into early morning, price climbed from 0.073 to 0.084 while open interest barely budged—a classic short-covering rally. The only meaningful increase in positions came with the 16:00 spike: the price briefly hit 0.0953, with about $6.78 million in volume, and open interest rose from 123 million to 124.5 million. It then fell back to 0.087 at the close, before the 17:00 candle pushed it back to 0.091. Large traders’ long-position share eased from about 65% to 63.5%, moving in the same direction as retail traders. That’s not large traders stepping in to keep buying at the highs. Funding rates fluctuated between 0.05% and 0.03% during the day, settling at around 0.013% at 16:00. The mark price was only about 0.3% above the index, so the squeeze hasn’t reached an extreme—but the move is already being driven by shorts covering. The taker buy/sell ratio spent most of the afternoon hovering near 1.0, with no one-sided wave of long buying. That suggests the chase is on shaky footing; without fresh forced short liquidations, this spike could easily turn into a one-day wonder.
Technically, price is pressing against the upper end of the range: the 1-hour RSI is about 70.6, the KDJ J-line is at 78, and price has just touched the Bollinger upper band at 0.091. It has already moved past the Keltner upper band at 0.089. The EMA12 is at 0.084, and ATR is about 5%. I wouldn’t add to a position at the 0.095 spike. On a pullback, the first level to watch is the moving average around 0.084. If open interest stays above 122 million and the share of long accounts keeps falling, the squeeze could continue a bit further. To change my view, I’d need to see open interest break below 118 million and the long-account share climb back above 65%. I’m staying out of both sides of this ARIA move.
#ARIA #合约持仓 #Cryptocurrency
Who’s paying for the move? From overnight into early morning, price climbed from 0.073 to 0.084 while open interest barely budged—a classic short-covering rally. The only meaningful increase in positions came with the 16:00 spike: the price briefly hit 0.0953, with about $6.78 million in volume, and open interest rose from 123 million to 124.5 million. It then fell back to 0.087 at the close, before the 17:00 candle pushed it back to 0.091. Large traders’ long-position share eased from about 65% to 63.5%, moving in the same direction as retail traders. That’s not large traders stepping in to keep buying at the highs. Funding rates fluctuated between 0.05% and 0.03% during the day, settling at around 0.013% at 16:00. The mark price was only about 0.3% above the index, so the squeeze hasn’t reached an extreme—but the move is already being driven by shorts covering. The taker buy/sell ratio spent most of the afternoon hovering near 1.0, with no one-sided wave of long buying. That suggests the chase is on shaky footing; without fresh forced short liquidations, this spike could easily turn into a one-day wonder.
Technically, price is pressing against the upper end of the range: the 1-hour RSI is about 70.6, the KDJ J-line is at 78, and price has just touched the Bollinger upper band at 0.091. It has already moved past the Keltner upper band at 0.089. The EMA12 is at 0.084, and ATR is about 5%. I wouldn’t add to a position at the 0.095 spike. On a pullback, the first level to watch is the moving average around 0.084. If open interest stays above 122 million and the share of long accounts keeps falling, the squeeze could continue a bit further. To change my view, I’d need to see open interest break below 118 million and the long-account share climb back above 65%. I’m staying out of both sides of this ARIA move.
#ARIA #合约持仓 #Cryptocurrency
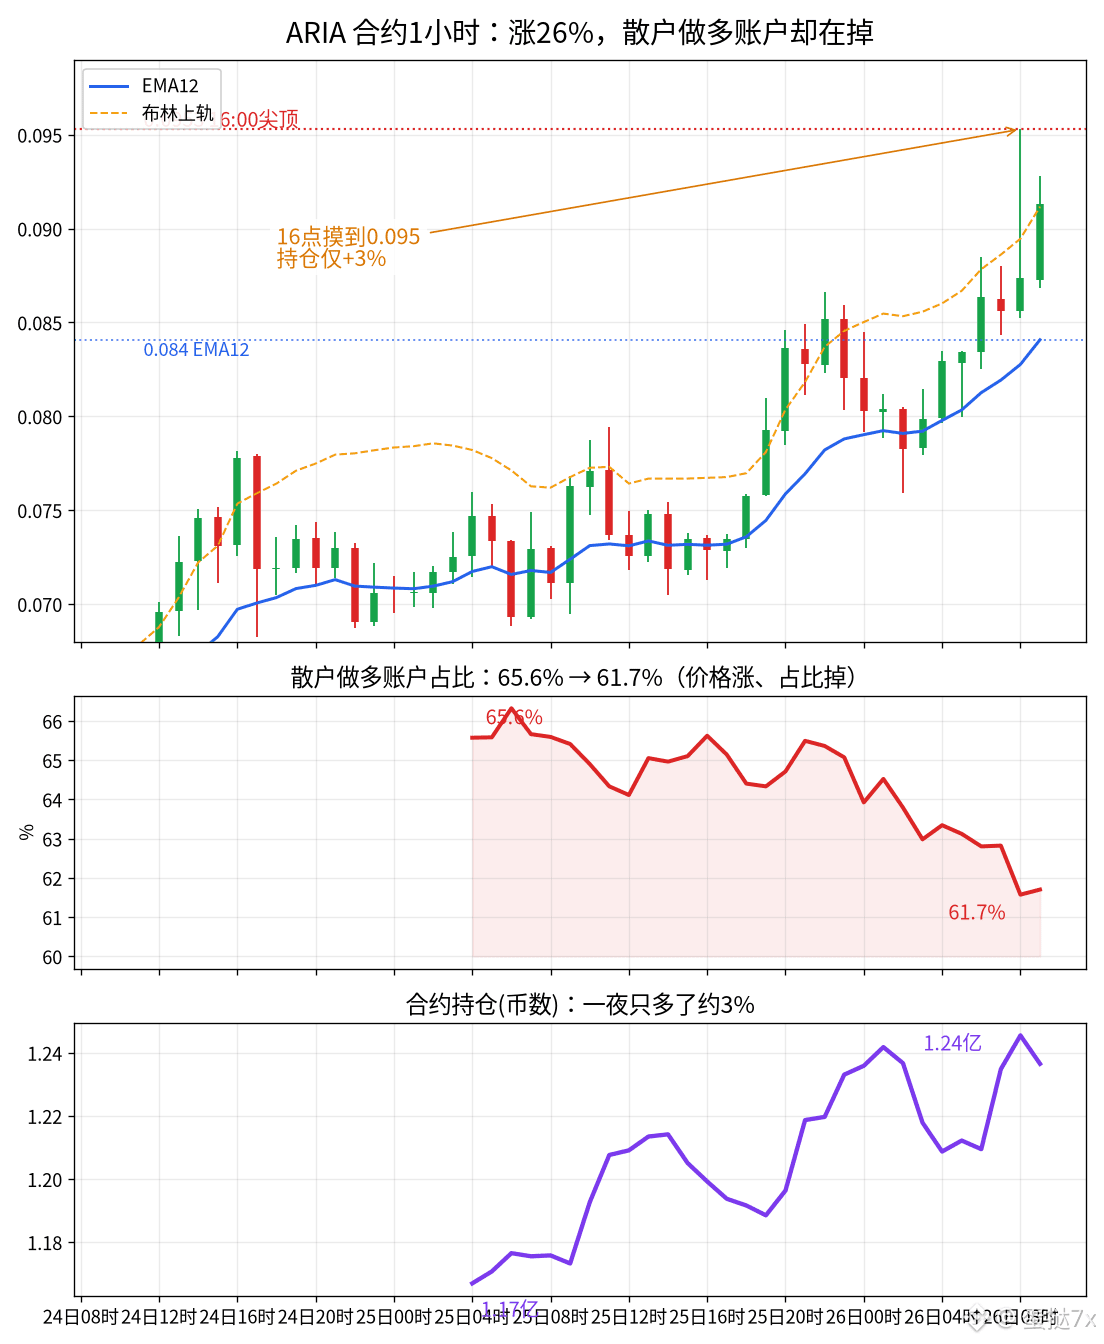
159
·
--
$DOOD 14 This hourly candle surged from 0.00151 to 0.00194, up 28% in a single candle. The 24-hour contract price rose about 29%, with roughly $35.3 million in volume, and the intraday high touched 0.001968. The short squeeze looks like it has already won. But at the same time, Binance’s mark price was still about 2.6% below the index, and the next funding rate was stuck at -0.35%—shorts were still paying by the hour, spot and the index were leading the move up, and the contract price hadn’t fully caught up.
Who’s being forced to buy? Around 10 a.m., the price was still hovering near 0.00138, with contract open interest at about 2.82 billion tokens. After the vertical candle, open interest climbed to around 3.41 billion—those extra 600 million tokens in positions were added as the green candle rose, not old positions that had been sitting there before the squeeze. The share of retail accounts net long rose from around 65% in the morning to 66%, while large traders’ long positions stayed almost unchanged at around 54%—retail traders are chasing harder than the whales. The taker buy/sell ratio flipped from 0.8 to 1.2 between 1 and 2 p.m.; buyers really were lifting the price, but open interest was expanding at the same time. The 1 p.m. candle first lifted the price from 0.00143 to 0.00151 on about $1.98 million in volume—it was just a warm-up. The real fuel came in the 2 p.m. candle, with about $21 million in volume in a single hour. In the October 22 evening report, I said the 0.00208 level wouldn’t hold this week—it later touched 0.00137, so the price direction was right. But the washout signal I mentioned at the time (the share of long accounts falling back to 50%) never appeared. It bounced straight back without shaking out the weak hands, so the people chasing now are still the same crowded longs.
Technically, price is stretched beyond the upper band: 1-hour RSI is 85, the KDJ J-line is at 104, and price is about 13% above the Bollinger upper band at 0.00168. EMA12 is at 0.00151, the MACD histogram is still expanding, and ATR is about 4%. I see the 0.00197 area as an emotional spike, not a new base. The first pullback level to watch is the Bollinger upper band at 0.00168; if price can’t hold there, the next level is the moving average at 0.00151. Until the funding rate gets back near zero and the mark price moves back in line with the index, I won’t add to this move. I’m personally flat DOOD.
#DOOD #合约持仓 #Cryptocurrency
$DOOD 14 This hourly candle surged from 0.00151 to 0.00194, up 28% in a single candle. The 24-hour contract price rose about 29%, with roughly $35.3 million in volume, and the intraday high touched 0.001968. The short squeeze looks like it has already won. But at the same time, Binance’s mark price was still about 2.6% below the index, and the next funding rate was stuck at -0.35%—shorts were still paying by the hour, spot and the index were leading the move up, and the contract price hadn’t fully caught up.
Who’s being forced to buy? Around 10 a.m., the price was still hovering near 0.00138, with contract open interest at about 2.82 billion tokens. After the vertical candle, open interest climbed to around 3.41 billion—those extra 600 million tokens in positions were added as the green candle rose, not old positions that had been sitting there before the squeeze. The share of retail accounts net long rose from around 65% in the morning to 66%, while large traders’ long positions stayed almost unchanged at around 54%—retail traders are chasing harder than the whales. The taker buy/sell ratio flipped from 0.8 to 1.2 between 1 and 2 p.m.; buyers really were lifting the price, but open interest was expanding at the same time. The 1 p.m. candle first lifted the price from 0.00143 to 0.00151 on about $1.98 million in volume—it was just a warm-up. The real fuel came in the 2 p.m. candle, with about $21 million in volume in a single hour. In the October 22 evening report, I said the 0.00208 level wouldn’t hold this week—it later touched 0.00137, so the price direction was right. But the washout signal I mentioned at the time (the share of long accounts falling back to 50%) never appeared. It bounced straight back without shaking out the weak hands, so the people chasing now are still the same crowded longs.
Technically, price is stretched beyond the upper band: 1-hour RSI is 85, the KDJ J-line is at 104, and price is about 13% above the Bollinger upper band at 0.00168. EMA12 is at 0.00151, the MACD histogram is still expanding, and ATR is about 4%. I see the 0.00197 area as an emotional spike, not a new base. The first pullback level to watch is the Bollinger upper band at 0.00168; if price can’t hold there, the next level is the moving average at 0.00151. Until the funding rate gets back near zero and the mark price moves back in line with the index, I won’t add to this move. I’m personally flat DOOD.
#DOOD #合约持仓 #Cryptocurrency
Who’s being forced to buy? Around 10 a.m., the price was still hovering near 0.00138, with contract open interest at about 2.82 billion tokens. After the vertical candle, open interest climbed to around 3.41 billion—those extra 600 million tokens in positions were added as the green candle rose, not old positions that had been sitting there before the squeeze. The share of retail accounts net long rose from around 65% in the morning to 66%, while large traders’ long positions stayed almost unchanged at around 54%—retail traders are chasing harder than the whales. The taker buy/sell ratio flipped from 0.8 to 1.2 between 1 and 2 p.m.; buyers really were lifting the price, but open interest was expanding at the same time. The 1 p.m. candle first lifted the price from 0.00143 to 0.00151 on about $1.98 million in volume—it was just a warm-up. The real fuel came in the 2 p.m. candle, with about $21 million in volume in a single hour. In the October 22 evening report, I said the 0.00208 level wouldn’t hold this week—it later touched 0.00137, so the price direction was right. But the washout signal I mentioned at the time (the share of long accounts falling back to 50%) never appeared. It bounced straight back without shaking out the weak hands, so the people chasing now are still the same crowded longs.
Technically, price is stretched beyond the upper band: 1-hour RSI is 85, the KDJ J-line is at 104, and price is about 13% above the Bollinger upper band at 0.00168. EMA12 is at 0.00151, the MACD histogram is still expanding, and ATR is about 4%. I see the 0.00197 area as an emotional spike, not a new base. The first pullback level to watch is the Bollinger upper band at 0.00168; if price can’t hold there, the next level is the moving average at 0.00151. Until the funding rate gets back near zero and the mark price moves back in line with the index, I won’t add to this move. I’m personally flat DOOD.
#DOOD #合约持仓 #Cryptocurrency
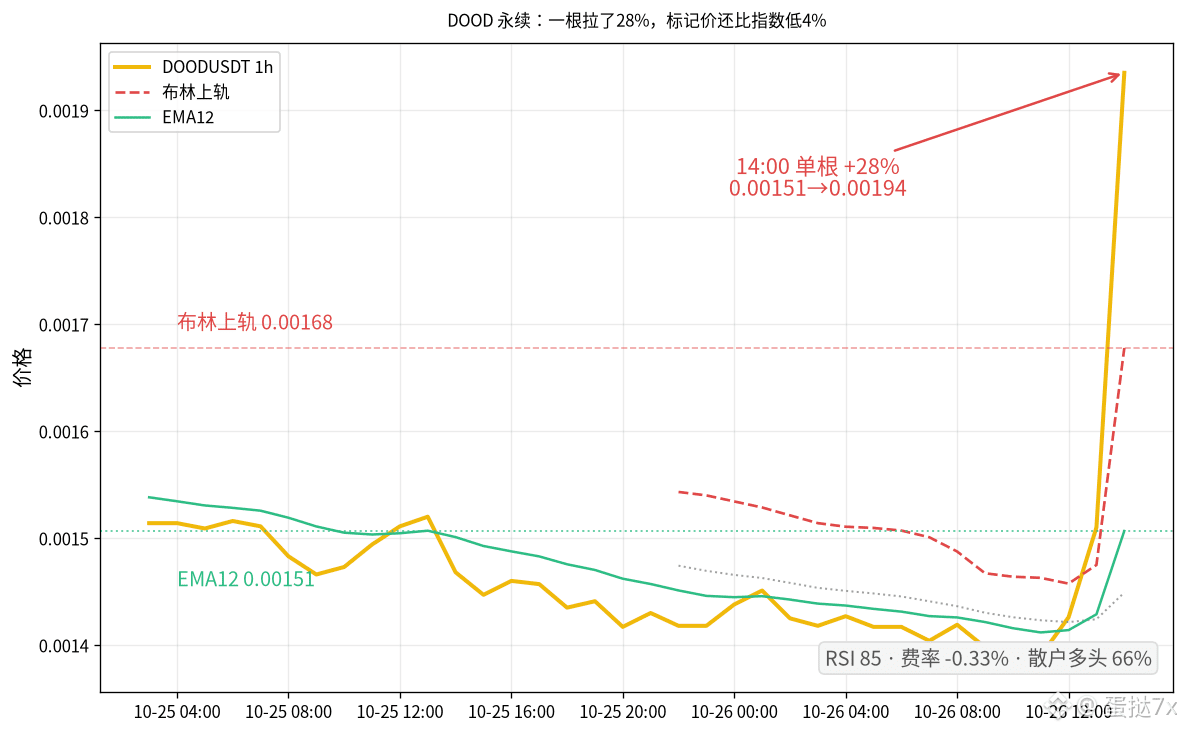
214
·
--
$CAP Last night I said 0.0999 was the peak of the chase; this morning it touched 0.115—I got the direction wrong here. The 24-hour contract is up 41%, with about $215 million in volume and an intraday high of 0.11526. But the order-book story has already flipped: at 9 p.m. yesterday, retail long accounts were still at 58.4%, with 215 million tokens in open interest; by 9 a.m. today, long accounts had fallen to 47.7%, short accounts were over half, and open interest had instead piled up to 253 million tokens. During the twelve hours in which the price climbed from 0.100 to fresh highs, the new entrants were short sellers—not the kind of momentum-chasing longs we saw yesterday.
Who’s being forced to pay? Whales’ long positions are still stuck at 64.5%. Funding hit 0.092% at the 4 a.m. settlement and was still at 0.075% at 8 a.m.—longs pay an extra amount every eight hours. Retail has flipped short while whales remain tilted long, and open interest added 38 million tokens overnight: that’s the fuel structure keeping a short squeeze alive. Short accounts are being carried higher, and positions haven’t been cleared out. The midnight hourly candle plunged from 0.108 to 0.094, then bounced back to 0.103; volume on that single candle was 222 million tokens, while open interest barely fell—the leverage was flushed, not the positions. Last night I wrote that rising prices were being driven by momentum-chasing longs piling in. Looking at it this morning, long accounts are decreasing and short accounts are increasing—the mechanism has changed. Every time shorts get squeezed, the next round of covering pushes the price up another leg, and the fuel keeps burning. From 9 p.m. to this morning, funding stayed above 0.07% for three consecutive settlements, keeping pressure on long-side costs.
Technicals are stretched at the highs: 1-hour RSI is 76.9, KDJ’s J is at 92.5, price has just touched the Keltner upper band at 0.113, EMA12 is at 0.107, the Bollinger upper band at 0.119 hasn’t been touched, and ATR is around 6%. I’m not adding at 0.115. The short squeeze could run further, but chasing above 0.07% funding is like carrying short accounts higher. First, watch the moving average around 0.107 on a pullback. To change my view, I’d need to see open interest fall back below 230 million and long accounts reclaim 55%. I’m still flat on CAP; with this setup, for now I’m watching, not chasing. Personal opinion for the record.
#CAP #合约持仓 #Cryptocurrency
$CAP Last night I said 0.0999 was the peak of the chase; this morning it touched 0.115—I got the direction wrong here. The 24-hour contract is up 41%, with about $215 million in volume and an intraday high of 0.11526. But the order-book story has already flipped: at 9 p.m. yesterday, retail long accounts were still at 58.4%, with 215 million tokens in open interest; by 9 a.m. today, long accounts had fallen to 47.7%, short accounts were over half, and open interest had instead piled up to 253 million tokens. During the twelve hours in which the price climbed from 0.100 to fresh highs, the new entrants were short sellers—not the kind of momentum-chasing longs we saw yesterday.
Who’s being forced to pay? Whales’ long positions are still stuck at 64.5%. Funding hit 0.092% at the 4 a.m. settlement and was still at 0.075% at 8 a.m.—longs pay an extra amount every eight hours. Retail has flipped short while whales remain tilted long, and open interest added 38 million tokens overnight: that’s the fuel structure keeping a short squeeze alive. Short accounts are being carried higher, and positions haven’t been cleared out. The midnight hourly candle plunged from 0.108 to 0.094, then bounced back to 0.103; volume on that single candle was 222 million tokens, while open interest barely fell—the leverage was flushed, not the positions. Last night I wrote that rising prices were being driven by momentum-chasing longs piling in. Looking at it this morning, long accounts are decreasing and short accounts are increasing—the mechanism has changed. Every time shorts get squeezed, the next round of covering pushes the price up another leg, and the fuel keeps burning. From 9 p.m. to this morning, funding stayed above 0.07% for three consecutive settlements, keeping pressure on long-side costs.
Technicals are stretched at the highs: 1-hour RSI is 76.9, KDJ’s J is at 92.5, price has just touched the Keltner upper band at 0.113, EMA12 is at 0.107, the Bollinger upper band at 0.119 hasn’t been touched, and ATR is around 6%. I’m not adding at 0.115. The short squeeze could run further, but chasing above 0.07% funding is like carrying short accounts higher. First, watch the moving average around 0.107 on a pullback. To change my view, I’d need to see open interest fall back below 230 million and long accounts reclaim 55%. I’m still flat on CAP; with this setup, for now I’m watching, not chasing. Personal opinion for the record.
#CAP #合约持仓 #Cryptocurrency
Who’s being forced to pay? Whales’ long positions are still stuck at 64.5%. Funding hit 0.092% at the 4 a.m. settlement and was still at 0.075% at 8 a.m.—longs pay an extra amount every eight hours. Retail has flipped short while whales remain tilted long, and open interest added 38 million tokens overnight: that’s the fuel structure keeping a short squeeze alive. Short accounts are being carried higher, and positions haven’t been cleared out. The midnight hourly candle plunged from 0.108 to 0.094, then bounced back to 0.103; volume on that single candle was 222 million tokens, while open interest barely fell—the leverage was flushed, not the positions. Last night I wrote that rising prices were being driven by momentum-chasing longs piling in. Looking at it this morning, long accounts are decreasing and short accounts are increasing—the mechanism has changed. Every time shorts get squeezed, the next round of covering pushes the price up another leg, and the fuel keeps burning. From 9 p.m. to this morning, funding stayed above 0.07% for three consecutive settlements, keeping pressure on long-side costs.
Technicals are stretched at the highs: 1-hour RSI is 76.9, KDJ’s J is at 92.5, price has just touched the Keltner upper band at 0.113, EMA12 is at 0.107, the Bollinger upper band at 0.119 hasn’t been touched, and ATR is around 6%. I’m not adding at 0.115. The short squeeze could run further, but chasing above 0.07% funding is like carrying short accounts higher. First, watch the moving average around 0.107 on a pullback. To change my view, I’d need to see open interest fall back below 230 million and long accounts reclaim 55%. I’m still flat on CAP; with this setup, for now I’m watching, not chasing. Personal opinion for the record.
#CAP #合约持仓 #Cryptocurrency
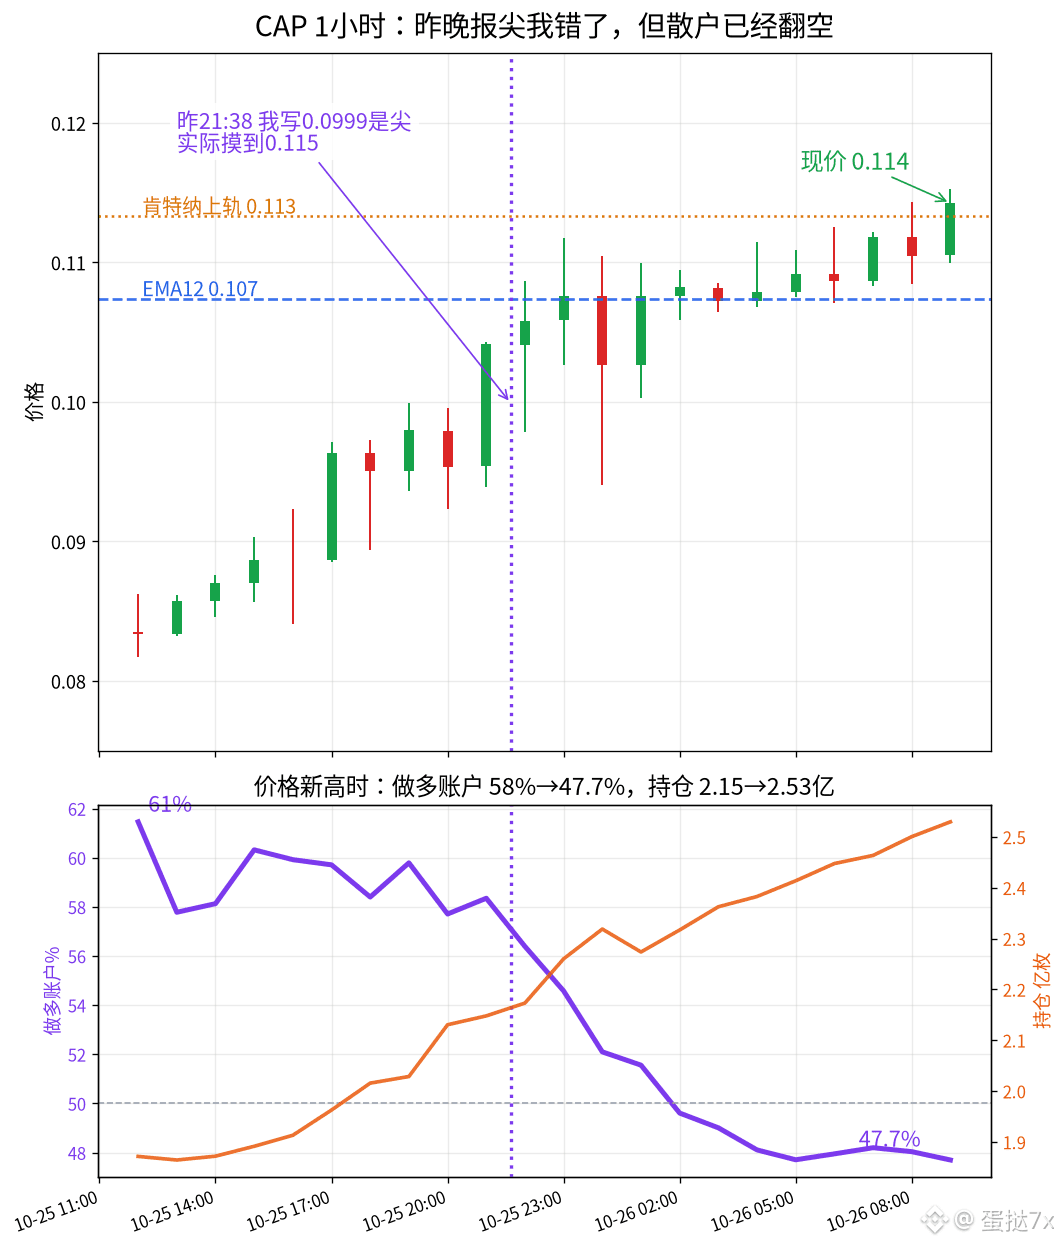
121
·
--
$CRWD On Friday, CRWD closed at 257.57, up 8.3% for the day, on volume of 13.37 million shares—about 1.6 times its 20-day average. The S&P 500 fell 0.5% over the same period, while peers in the sector, $PANW and $ZS, each gained around 7%. On the spot market, it looked like the entire cybersecurity sector was moving in sync. But on Binance, CRWD futures open interest fell from 5,857 contracts to 5,355 in the hour after the U.S. market opened, a drop of nearly 10%.
The catalysts themselves aren’t complicated. Evercore’s channel checks suggest security budgets are firming up toward year-end, naming CrowdStrike and Palo Alto as major beneficiaries of AI security spending. The two high-severity PHP2Shell vulnerabilities brought patching demand to the fore, and Mizuho also raised its price target to 275. Spot buyers are trading on that narrative.
The futures ledger tells a different story. The share of accounts holding long positions stayed around 56% before and after the open, with almost nobody adding to their positions. Among large traders, the long-position share by position size fell from 54.9% at the open to 52.3% overnight. Price surged while positions were being cut—that’s traders closing out, not leveraged longs driving the move. Funding rates have been pinned at zero for several days, too; nobody seems willing to pay a premium to get long. The mechanics are straightforward: spot traders are using the survey and vulnerability news to re-rate the stock, while futures traders are using this rally to take profits. That leaves less fuel in the form of queued-up long positions waiting to be liquidated if prices pull back. Over the weekend, open interest continued to grind down to about 5,020 contracts, while the share of accounts holding longs slipped to around 51%—a sign that nobody in futures was in a hurry to follow through after this rally.
The daily RSI(14) has just reached 56.1; the 12-day EMA is at 246.3; and the close is only slightly above the Bollinger midline at 255.7. The MACD histogram is still negative at -3.2. The stock is still about 7.6% below its October 6 high of 278.9. The rally has been sharp, but momentum indicators haven’t turned overbought along with it.
I see the intraday high of 257.91 as a sentiment spike, not the starting point of a new trading range. Only if futures open interest builds back above 6,000 contracts and the daily chart holds above 257 would it make sense to talk about a possible move toward 278. On a pullback, I’d first look to the 12-day EMA around 246. I’m not holding a position here.
#美股 #网络安全 #CRWD
$CRWD On Friday, CRWD closed at 257.57, up 8.3% for the day, on volume of 13.37 million shares—about 1.6 times its 20-day average. The S&P 500 fell 0.5% over the same period, while peers in the sector, $PANW and $ZS , each gained around 7%. On the spot market, it looked like the entire cybersecurity sector was moving in sync. But on Binance, CRWD futures open interest fell from 5,857 contracts to 5,355 in the hour after the U.S. market opened, a drop of nearly 10%.
The catalysts themselves aren’t complicated. Evercore’s channel checks suggest security budgets are firming up toward year-end, naming CrowdStrike and Palo Alto as major beneficiaries of AI security spending. The two high-severity PHP2Shell vulnerabilities brought patching demand to the fore, and Mizuho also raised its price target to 275. Spot buyers are trading on that narrative.
The futures ledger tells a different story. The share of accounts holding long positions stayed around 56% before and after the open, with almost nobody adding to their positions. Among large traders, the long-position share by position size fell from 54.9% at the open to 52.3% overnight. Price surged while positions were being cut—that’s traders closing out, not leveraged longs driving the move. Funding rates have been pinned at zero for several days, too; nobody seems willing to pay a premium to get long. The mechanics are straightforward: spot traders are using the survey and vulnerability news to re-rate the stock, while futures traders are using this rally to take profits. That leaves less fuel in the form of queued-up long positions waiting to be liquidated if prices pull back. Over the weekend, open interest continued to grind down to about 5,020 contracts, while the share of accounts holding longs slipped to around 51%—a sign that nobody in futures was in a hurry to follow through after this rally.
The daily RSI(14) has just reached 56.1; the 12-day EMA is at 246.3; and the close is only slightly above the Bollinger midline at 255.7. The MACD histogram is still negative at -3.2. The stock is still about 7.6% below its October 6 high of 278.9. The rally has been sharp, but momentum indicators haven’t turned overbought along with it.
I see the intraday high of 257.91 as a sentiment spike, not the starting point of a new trading range. Only if futures open interest builds back above 6,000 contracts and the daily chart holds above 257 would it make sense to talk about a possible move toward 278. On a pullback, I’d first look to the 12-day EMA around 246. I’m not holding a position here.
#美股 #网络安全 #CRWD
The catalysts themselves aren’t complicated. Evercore’s channel checks suggest security budgets are firming up toward year-end, naming CrowdStrike and Palo Alto as major beneficiaries of AI security spending. The two high-severity PHP2Shell vulnerabilities brought patching demand to the fore, and Mizuho also raised its price target to 275. Spot buyers are trading on that narrative.
The futures ledger tells a different story. The share of accounts holding long positions stayed around 56% before and after the open, with almost nobody adding to their positions. Among large traders, the long-position share by position size fell from 54.9% at the open to 52.3% overnight. Price surged while positions were being cut—that’s traders closing out, not leveraged longs driving the move. Funding rates have been pinned at zero for several days, too; nobody seems willing to pay a premium to get long. The mechanics are straightforward: spot traders are using the survey and vulnerability news to re-rate the stock, while futures traders are using this rally to take profits. That leaves less fuel in the form of queued-up long positions waiting to be liquidated if prices pull back. Over the weekend, open interest continued to grind down to about 5,020 contracts, while the share of accounts holding longs slipped to around 51%—a sign that nobody in futures was in a hurry to follow through after this rally.
The daily RSI(14) has just reached 56.1; the 12-day EMA is at 246.3; and the close is only slightly above the Bollinger midline at 255.7. The MACD histogram is still negative at -3.2. The stock is still about 7.6% below its October 6 high of 278.9. The rally has been sharp, but momentum indicators haven’t turned overbought along with it.
I see the intraday high of 257.91 as a sentiment spike, not the starting point of a new trading range. Only if futures open interest builds back above 6,000 contracts and the daily chart holds above 257 would it make sense to talk about a possible move toward 278. On a pullback, I’d first look to the 12-day EMA around 246. I’m not holding a position here.
#美股 #网络安全 #CRWD
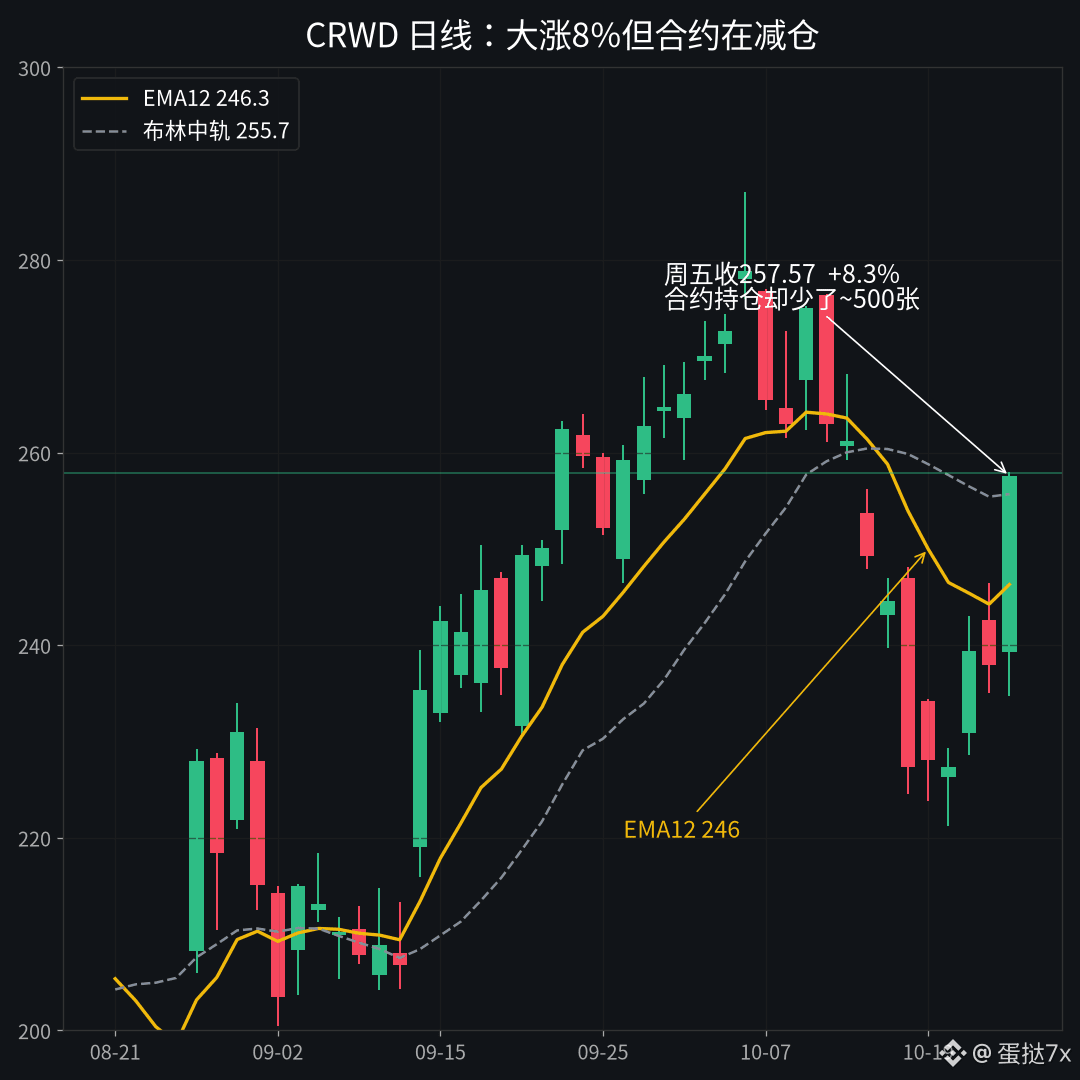
179
·
--
$BMT 24 hours later, it had plunged nearly 26%, falling from a high of 0.0408 to 0.0293, with about $147 million in futures trading volume. A drop like this would usually be seen as long positions getting liquidated and flushed out, but Binance whales’ long-position share has actually risen from 51% in the morning to 55% now.
Open interest has fallen from its 1 a.m. peak of 247 million tokens to 214 million, down about 13%, but it’s still roughly around the same baseline as the night before last. Retail accounts’ long share stayed around 52% all day, with no sign of large-scale long liquidations. The real activity is among the whales: during those two candles from 20:00 to 22:00, when the price made new lows, their long-position share climbed again from 53.6% to 54.9%. Funding is still negative: it briefly hit negative 17 ten-thousandths at noon, and was around negative 25 ten-thousandths at the 22:00 settlement, meaning shorts are paying. Who’s being forced out? Shorts sitting in negative funding, paying longs every eight hours. As the price falls further, whales take over some of those positions. It looks like a flush, but structurally, the market hasn’t fully cleared. During the sharp drop at 9 a.m., open interest fell from 232 million to 223 million, as if some positions had been cut. But when the price continued drifting down in the afternoon, open interest built back and forth between 225 million and 233 million, suggesting new positions were coming in rather than one-sided position-closing.
In yesterday’s post at 10:38, I wrote that 0.0418 was a liquidation-driven spike and that I wouldn’t add to my position. The price later peaked at 0.049 before crashing all the way back to where it is now. I got the direction right; the rebound in between was just stronger than I expected. Technically, the 1-hour MACD histogram is still deepening, the 21:00 candle pierced the Keltner lower band at 0.0288, and the current price is hovering right along the lower band. EMA12 at 0.031 is capping the rebound, and ATR is about 7.9%. I see the 0.0288 lower band as temporary support, not as confirmation that the flush is complete. If open interest stays above 210 million and whales’ long-position share can’t fall back below 52%, the first rebound target is the moving average at 0.031. To change my view, I’d need to see open interest drop below 200 million while funding rates approach positive territory. I have no position in BMT; with this kind of structure, I’m not adding.
#BMT #合约持仓 #Crypto
$BMT 24 hours later, it had plunged nearly 26%, falling from a high of 0.0408 to 0.0293, with about $147 million in futures trading volume. A drop like this would usually be seen as long positions getting liquidated and flushed out, but Binance whales’ long-position share has actually risen from 51% in the morning to 55% now.
Open interest has fallen from its 1 a.m. peak of 247 million tokens to 214 million, down about 13%, but it’s still roughly around the same baseline as the night before last. Retail accounts’ long share stayed around 52% all day, with no sign of large-scale long liquidations. The real activity is among the whales: during those two candles from 20:00 to 22:00, when the price made new lows, their long-position share climbed again from 53.6% to 54.9%. Funding is still negative: it briefly hit negative 17 ten-thousandths at noon, and was around negative 25 ten-thousandths at the 22:00 settlement, meaning shorts are paying. Who’s being forced out? Shorts sitting in negative funding, paying longs every eight hours. As the price falls further, whales take over some of those positions. It looks like a flush, but structurally, the market hasn’t fully cleared. During the sharp drop at 9 a.m., open interest fell from 232 million to 223 million, as if some positions had been cut. But when the price continued drifting down in the afternoon, open interest built back and forth between 225 million and 233 million, suggesting new positions were coming in rather than one-sided position-closing.
In yesterday’s post at 10:38, I wrote that 0.0418 was a liquidation-driven spike and that I wouldn’t add to my position. The price later peaked at 0.049 before crashing all the way back to where it is now. I got the direction right; the rebound in between was just stronger than I expected. Technically, the 1-hour MACD histogram is still deepening, the 21:00 candle pierced the Keltner lower band at 0.0288, and the current price is hovering right along the lower band. EMA12 at 0.031 is capping the rebound, and ATR is about 7.9%. I see the 0.0288 lower band as temporary support, not as confirmation that the flush is complete. If open interest stays above 210 million and whales’ long-position share can’t fall back below 52%, the first rebound target is the moving average at 0.031. To change my view, I’d need to see open interest drop below 200 million while funding rates approach positive territory. I have no position in BMT; with this kind of structure, I’m not adding.
#BMT #合约持仓 #Crypto
Open interest has fallen from its 1 a.m. peak of 247 million tokens to 214 million, down about 13%, but it’s still roughly around the same baseline as the night before last. Retail accounts’ long share stayed around 52% all day, with no sign of large-scale long liquidations. The real activity is among the whales: during those two candles from 20:00 to 22:00, when the price made new lows, their long-position share climbed again from 53.6% to 54.9%. Funding is still negative: it briefly hit negative 17 ten-thousandths at noon, and was around negative 25 ten-thousandths at the 22:00 settlement, meaning shorts are paying. Who’s being forced out? Shorts sitting in negative funding, paying longs every eight hours. As the price falls further, whales take over some of those positions. It looks like a flush, but structurally, the market hasn’t fully cleared. During the sharp drop at 9 a.m., open interest fell from 232 million to 223 million, as if some positions had been cut. But when the price continued drifting down in the afternoon, open interest built back and forth between 225 million and 233 million, suggesting new positions were coming in rather than one-sided position-closing.
In yesterday’s post at 10:38, I wrote that 0.0418 was a liquidation-driven spike and that I wouldn’t add to my position. The price later peaked at 0.049 before crashing all the way back to where it is now. I got the direction right; the rebound in between was just stronger than I expected. Technically, the 1-hour MACD histogram is still deepening, the 21:00 candle pierced the Keltner lower band at 0.0288, and the current price is hovering right along the lower band. EMA12 at 0.031 is capping the rebound, and ATR is about 7.9%. I see the 0.0288 lower band as temporary support, not as confirmation that the flush is complete. If open interest stays above 210 million and whales’ long-position share can’t fall back below 52%, the first rebound target is the moving average at 0.031. To change my view, I’d need to see open interest drop below 200 million while funding rates approach positive territory. I have no position in BMT; with this kind of structure, I’m not adding.
#BMT #合约持仓 #Crypto
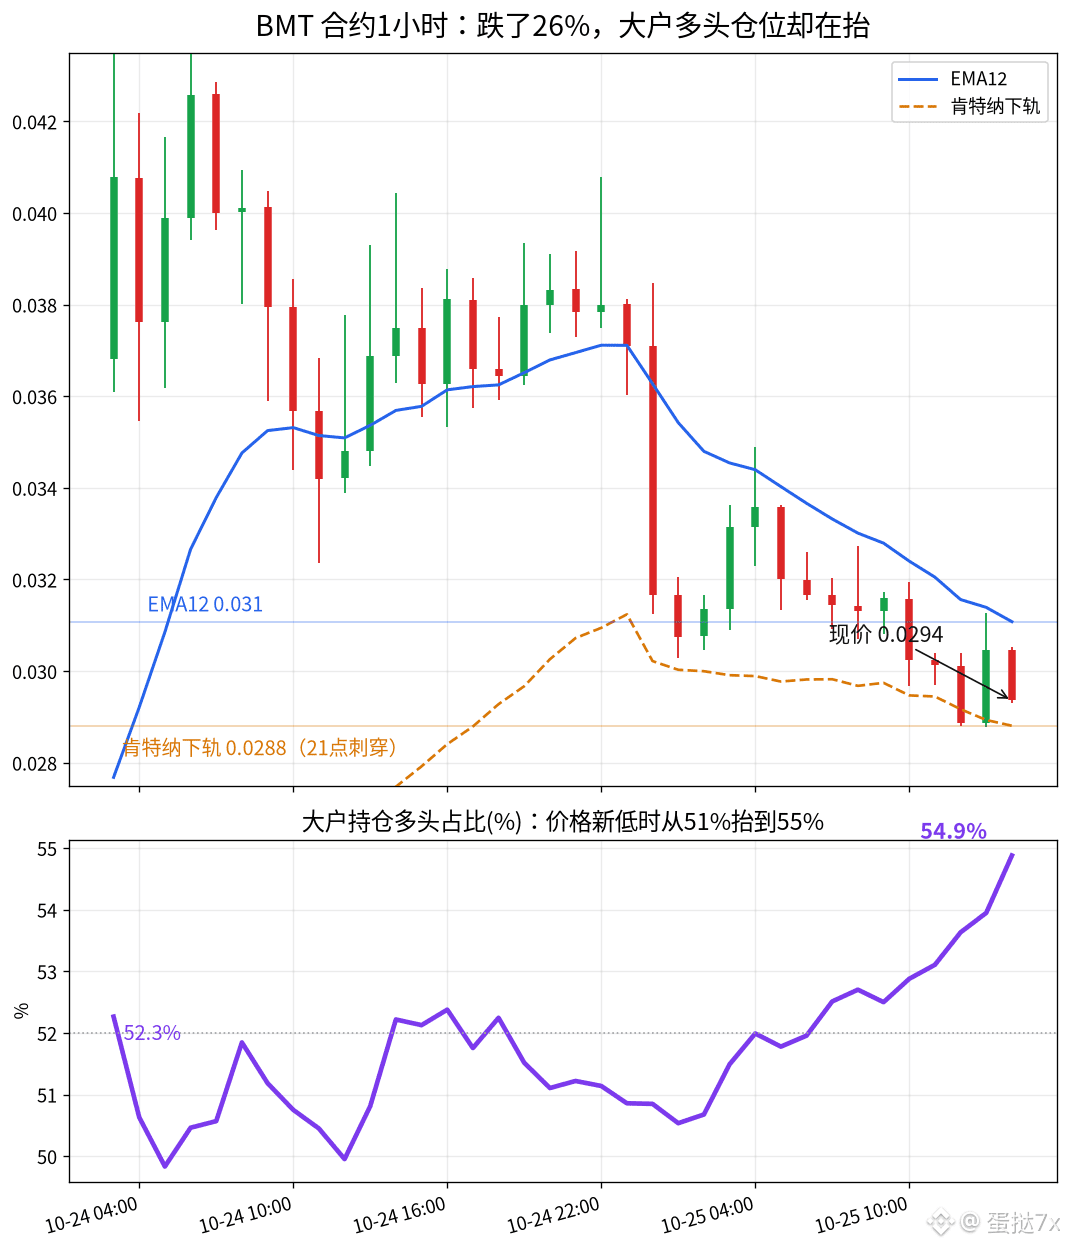
154
·
--
$CAP rose from last night’s low of 0.073 to 0.100, with its 24-hour gain nearing 30% and futures trading volume at about $90 million. The breakout looks pretty clean, but Binance futures open interest climbed from 184 million coins in the morning to 215 million by evening—nearly 17 million of those were added just between 17:00 and 20:00. Open interest rose along with the price, and the funding rate also moved up from 0.02% during the day to 0.038% at 20:00. This wasn’t a spike caused by shorts capitulating and getting squeezed; it was longs chasing the price and adding positions. The mark price was still slightly above the index, and the basis gave no sign of shorts being forced to cover.
Now look at the positioning. The share of retail accounts going long gradually fell from 64% early in the session to 58% now, while large traders’ long positions eased from 67% to 64%. Neither side showed the kind of short-side capitulation you’d expect in a squeeze. Open interest actually increased by 31 million coins, which suggests the new positions were longs chasing the rally, not shorts covering. The 17:00 hourly candle climbed from 0.089 to 0.096 on about $9.3 million in volume, while open interest jumped from 191 million to 196 million. By the time price touched 0.0999 at 19:00, open interest had already topped 203 million. Who’s being forced to pay? With the funding rate rising, late-arriving longs pay a little more every eight hours; if the price pulls back, those added positions will be the first to let go. From last night until this morning, open interest hovered around 182 million for more than ten hours. The real window for adding positions came during this evening’s rally.
Technically, it’s still stretched: the 1-hour RSI is 77.7, the 19:00 candle touched the upper Bollinger Band at 0.0995, and price had already cleared the Keltner upper band at 0.0947. The current price remains above the 0.091 EMA12. The MACD histogram is still positive, and ATR is about 4.6%—the swings in those peak candles were already large enough. I see the move up to 0.0999 as a chasing spike, not the start of a new range. If open interest stays above 210 million and the funding rate doesn’t fall back below 0.02%, the first pullback target is the EMA12 around 0.091. To change my view, I’d need to see open interest shrink back below 190 million while the funding rate drops close to the floor. I’m not holding CAP, and I’m not adding to a rally driven by this kind of position buildup.
#CAP #合约持仓 #加密货币
$CAP rose from last night’s low of 0.073 to 0.100, with its 24-hour gain nearing 30% and futures trading volume at about $90 million. The breakout looks pretty clean, but Binance futures open interest climbed from 184 million coins in the morning to 215 million by evening—nearly 17 million of those were added just between 17:00 and 20:00. Open interest rose along with the price, and the funding rate also moved up from 0.02% during the day to 0.038% at 20:00. This wasn’t a spike caused by shorts capitulating and getting squeezed; it was longs chasing the price and adding positions. The mark price was still slightly above the index, and the basis gave no sign of shorts being forced to cover.
Now look at the positioning. The share of retail accounts going long gradually fell from 64% early in the session to 58% now, while large traders’ long positions eased from 67% to 64%. Neither side showed the kind of short-side capitulation you’d expect in a squeeze. Open interest actually increased by 31 million coins, which suggests the new positions were longs chasing the rally, not shorts covering. The 17:00 hourly candle climbed from 0.089 to 0.096 on about $9.3 million in volume, while open interest jumped from 191 million to 196 million. By the time price touched 0.0999 at 19:00, open interest had already topped 203 million. Who’s being forced to pay? With the funding rate rising, late-arriving longs pay a little more every eight hours; if the price pulls back, those added positions will be the first to let go. From last night until this morning, open interest hovered around 182 million for more than ten hours. The real window for adding positions came during this evening’s rally.
Technically, it’s still stretched: the 1-hour RSI is 77.7, the 19:00 candle touched the upper Bollinger Band at 0.0995, and price had already cleared the Keltner upper band at 0.0947. The current price remains above the 0.091 EMA12. The MACD histogram is still positive, and ATR is about 4.6%—the swings in those peak candles were already large enough. I see the move up to 0.0999 as a chasing spike, not the start of a new range. If open interest stays above 210 million and the funding rate doesn’t fall back below 0.02%, the first pullback target is the EMA12 around 0.091. To change my view, I’d need to see open interest shrink back below 190 million while the funding rate drops close to the floor. I’m not holding CAP, and I’m not adding to a rally driven by this kind of position buildup.
#CAP #合约持仓 #加密货币
Now look at the positioning. The share of retail accounts going long gradually fell from 64% early in the session to 58% now, while large traders’ long positions eased from 67% to 64%. Neither side showed the kind of short-side capitulation you’d expect in a squeeze. Open interest actually increased by 31 million coins, which suggests the new positions were longs chasing the rally, not shorts covering. The 17:00 hourly candle climbed from 0.089 to 0.096 on about $9.3 million in volume, while open interest jumped from 191 million to 196 million. By the time price touched 0.0999 at 19:00, open interest had already topped 203 million. Who’s being forced to pay? With the funding rate rising, late-arriving longs pay a little more every eight hours; if the price pulls back, those added positions will be the first to let go. From last night until this morning, open interest hovered around 182 million for more than ten hours. The real window for adding positions came during this evening’s rally.
Technically, it’s still stretched: the 1-hour RSI is 77.7, the 19:00 candle touched the upper Bollinger Band at 0.0995, and price had already cleared the Keltner upper band at 0.0947. The current price remains above the 0.091 EMA12. The MACD histogram is still positive, and ATR is about 4.6%—the swings in those peak candles were already large enough. I see the move up to 0.0999 as a chasing spike, not the start of a new range. If open interest stays above 210 million and the funding rate doesn’t fall back below 0.02%, the first pullback target is the EMA12 around 0.091. To change my view, I’d need to see open interest shrink back below 190 million while the funding rate drops close to the floor. I’m not holding CAP, and I’m not adding to a rally driven by this kind of position buildup.
#CAP #合约持仓 #加密货币
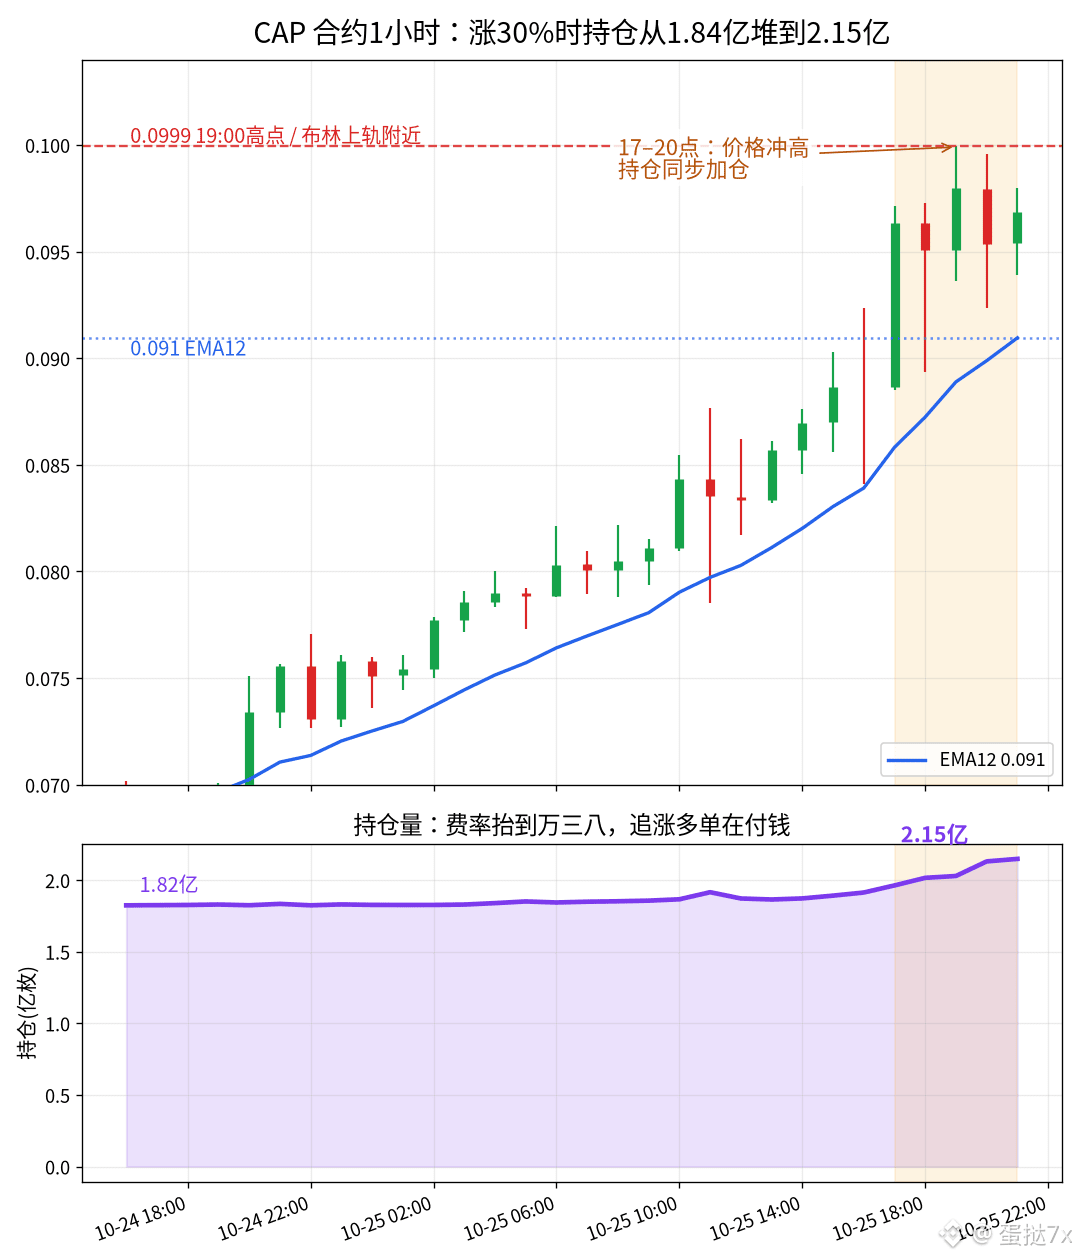
238
Log in to explore more content
Join global crypto users on Binance Square
⚡️ Get latest and useful information about crypto.
💬 Trusted by the world’s largest crypto exchange.
👍 Discover real insights from verified creators.
Email / Phone number
Trending Topics
BinanceReopensWithdrawalsForMoreAssets
61,264 views
1,201 Discussing
Security Incident | Recovery Update #6: Withdrawals Reopen for More Assets (2026-11-03)
Binance Announcement
·180 Likes
·498.8k views
BinanceHourlyDepositsExceedWithdrawals
22,542 views
469 Discussing
AnthropicIPOPricedDownasInvestorsEye$1.5T
150 views
20 Discussing