
蛋挞7x
360 Posts

蛋挞7x
Report
Block User
21 Following
44 Followers
31 Liked
Posts
·
--
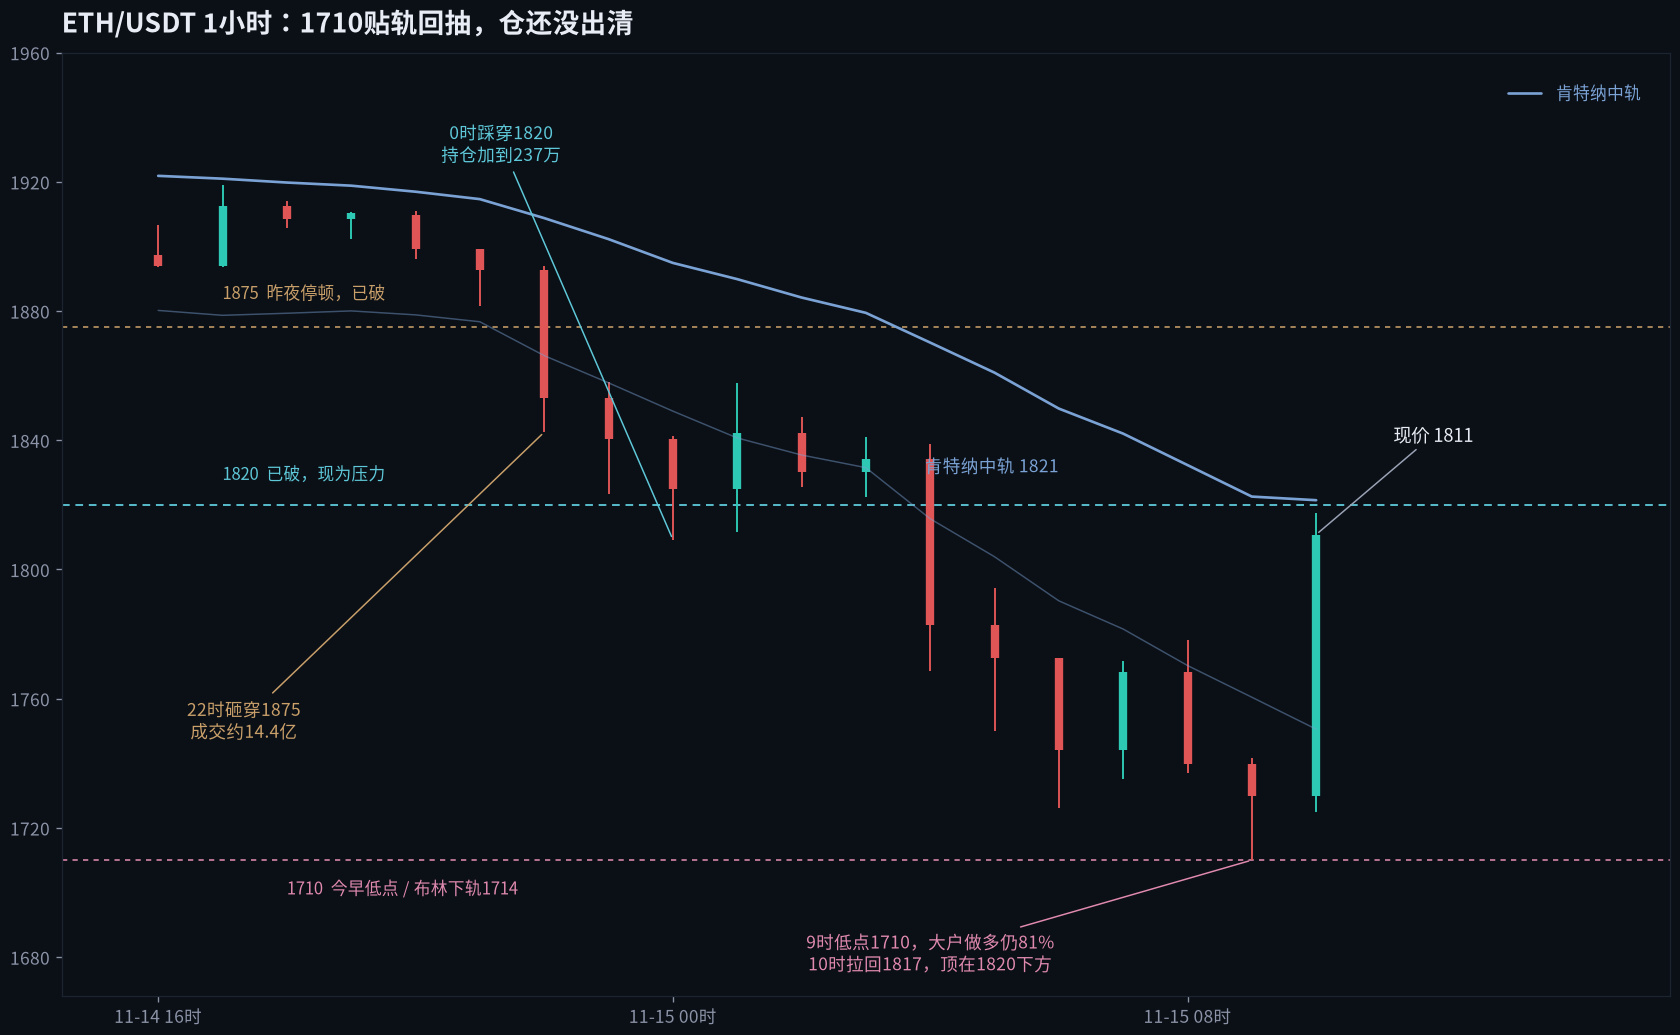
When the two levels converged at 1710, top-trader long accounts were still at 81% — $ETH plunged from 1740 to 1710 at 9 a.m., with about $1.25 billion in hourly volume. The low touched the lower Bollinger Band at 1714 and nearly coincided with 1713 from June 4. The current price is around 1811, down about 5.1% over the past day, with about $15.2 billion in futures volume. The 10 a.m. candle rallied from 1725 to 1817 on about $1.22 billion in hourly volume; in its first 15 minutes, the buy/sell ratio reached 1.49.
Last night, I treated 1875 as a pause in the downtrend, with 1820 from August 1 as the next level if it fell further. The 10 p.m. candle, with about $1.44 billion in volume, slammed down to 1842, breaking below 1875. At midnight, it tested 1809, breaking 1820 too. Instead of reducing positions, traders added to them: about 2.343 million contracts at 10 p.m., 2.37 million at midnight, and a high of 2.386 million at 4:45 a.m. Top-trader long accounts rose to 81.8% as 1820 gave way, and were still at 81% at the 9 a.m. low. The 4:50 five-minute candle had about $634 million in volume, with the buy/sell ratio falling to 0.49. Open interest dropped by about 57,000 contracts over 15 minutes, from 2.386 million to 2.329 million, but then climbed back. It is now around 2.328 million, almost exactly where it was last night. Retail long accounts fell from 78% to 73%, easing only slightly.
The one-hour RSI rebounded from 23 at the 9 a.m. close to around 45, while the KDJ J-line rose from 11 to 59. The 10 a.m. high of 1817 stalled below the Keltner Channel midline at 1822, right around the already-broken 1820 level.
I don't consider this touch of 1710 a floor after a full flush. With top-trader long accounts still near 80% and open interest not yet falling below 2.3 million, this rebound first faces resistance at 1820–1822. If 1710 gives way again, the next level is 1670, from the June 18 candle.
#ETH #合约 #OpenInterest
When the two levels converged at 1710, top-trader long accounts were still at 81% — $ETH plunged from 1740 to 1710 at 9 a.m., with about $1.25 billion in hourly volume. The low touched the lower Bollinger Band at 1714 and nearly coincided with 1713 from June 4. The current price is around 1811, down about 5.1% over the past day, with about $15.2 billion in futures volume. The 10 a.m. candle rallied from 1725 to 1817 on about $1.22 billion in hourly volume; in its first 15 minutes, the buy/sell ratio reached 1.49.
Last night, I treated 1875 as a pause in the downtrend, with 1820 from August 1 as the next level if it fell further. The 10 p.m. candle, with about $1.44 billion in volume, slammed down to 1842, breaking below 1875. At midnight, it tested 1809, breaking 1820 too. Instead of reducing positions, traders added to them: about 2.343 million contracts at 10 p.m., 2.37 million at midnight, and a high of 2.386 million at 4:45 a.m. Top-trader long accounts rose to 81.8% as 1820 gave way, and were still at 81% at the 9 a.m. low. The 4:50 five-minute candle had about $634 million in volume, with the buy/sell ratio falling to 0.49. Open interest dropped by about 57,000 contracts over 15 minutes, from 2.386 million to 2.329 million, but then climbed back. It is now around 2.328 million, almost exactly where it was last night. Retail long accounts fell from 78% to 73%, easing only slightly.
The one-hour RSI rebounded from 23 at the 9 a.m. close to around 45, while the KDJ J-line rose from 11 to 59. The 10 a.m. high of 1817 stalled below the Keltner Channel midline at 1822, right around the already-broken 1820 level.
I don't consider this touch of 1710 a floor after a full flush. With top-trader long accounts still near 80% and open interest not yet falling below 2.3 million, this rebound first faces resistance at 1820–1822. If 1710 gives way again, the next level is 1670, from the June 18 candle.
#ETH #合约 #OpenInterest
Last night, I treated 1875 as a pause in the downtrend, with 1820 from August 1 as the next level if it fell further. The 10 p.m. candle, with about $1.44 billion in volume, slammed down to 1842, breaking below 1875. At midnight, it tested 1809, breaking 1820 too. Instead of reducing positions, traders added to them: about 2.343 million contracts at 10 p.m., 2.37 million at midnight, and a high of 2.386 million at 4:45 a.m. Top-trader long accounts rose to 81.8% as 1820 gave way, and were still at 81% at the 9 a.m. low. The 4:50 five-minute candle had about $634 million in volume, with the buy/sell ratio falling to 0.49. Open interest dropped by about 57,000 contracts over 15 minutes, from 2.386 million to 2.329 million, but then climbed back. It is now around 2.328 million, almost exactly where it was last night. Retail long accounts fell from 78% to 73%, easing only slightly.
The one-hour RSI rebounded from 23 at the 9 a.m. close to around 45, while the KDJ J-line rose from 11 to 59. The 10 a.m. high of 1817 stalled below the Keltner Channel midline at 1822, right around the already-broken 1820 level.
I don't consider this touch of 1710 a floor after a full flush. With top-trader long accounts still near 80% and open interest not yet falling below 2.3 million, this rebound first faces resistance at 1820–1822. If 1710 gives way again, the next level is 1670, from the June 18 candle.
#ETH #合约 #OpenInterest
1
158
·
--
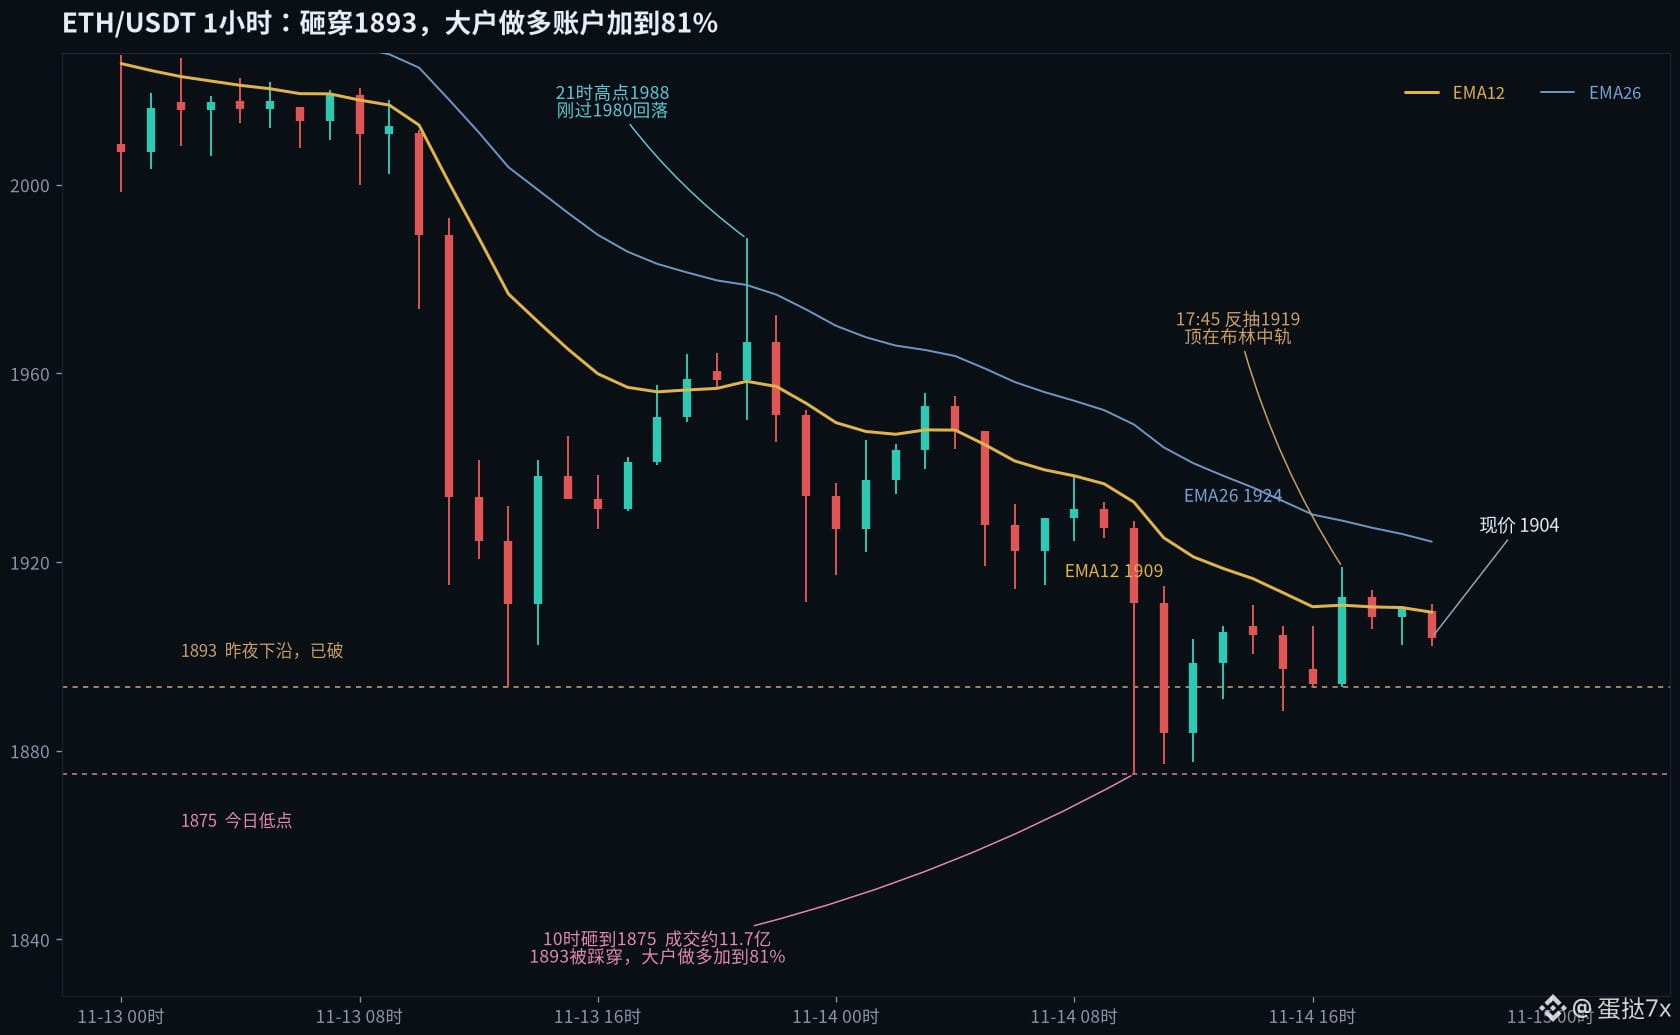
At the 1875 low, large traders’ long-account share rose to 81% — at 10:00, $ETH plunged from 1927 to 1875, with about $1.17 billion in volume for the hour. 1893 was decisively breached. The price is now around 1904, down about 3.0% over the past day, with about $8.4 billion in futures volume. The 10:25 five-minute candle saw about $463 million in volume, with a low of exactly 1875; the two candles from 10:00 to 11:00 totaled about $1.86 billion.
Last night, I treated 1893 as a level that hadn’t been decisively cleared yet, and said any rebound would first run into the 26-period moving average at 1980; if 1893 gave way again, the next level would be 1820, from August 1. At 21:00, a candle saw about $883 million in volume and reached a high of 1988, but pulled back as soon as it moved above 1980. Another candle at 23:00 saw about $1.04 billion in volume, with a low of 1911. The upper end of the range was basically on target, and the lower end played out this morning too. Open interest was 2.35 million last night, dipped to a low of 2.30 million at 10:30, then climbed back up within minutes; it’s now around 2.33 million. Retail long positions fell from 78.8% to 77.8%, while large traders’ long-account share rose to 81% at the low and is still at 80% now.
The one-hour RSI is around 40. The 12-period moving average is at 1909, and price has just slipped below it. This morning’s low also broke below the lower Bollinger Band at 1880. At 17:45, the rebound reached a high of 1919, right around the Bollinger middle band at 1918, then pulled back to 1904.
Open interest couldn’t hold at 2.30 million. For now, I see 1875 as a pause in the downtrend, not a point to turn bullish. Large traders’ long-account share is still around 80%. Any rebound will first run into the 12-period moving average at 1909, then the middle band at 1918. If 1875 gives way again, the next level is 1820, from the August 1 candle.
#ETH #合约 #OpenInterest
At the 1875 low, large traders’ long-account share rose to 81% — at 10:00, $ETH plunged from 1927 to 1875, with about $1.17 billion in volume for the hour. 1893 was decisively breached. The price is now around 1904, down about 3.0% over the past day, with about $8.4 billion in futures volume. The 10:25 five-minute candle saw about $463 million in volume, with a low of exactly 1875; the two candles from 10:00 to 11:00 totaled about $1.86 billion.
Last night, I treated 1893 as a level that hadn’t been decisively cleared yet, and said any rebound would first run into the 26-period moving average at 1980; if 1893 gave way again, the next level would be 1820, from August 1. At 21:00, a candle saw about $883 million in volume and reached a high of 1988, but pulled back as soon as it moved above 1980. Another candle at 23:00 saw about $1.04 billion in volume, with a low of 1911. The upper end of the range was basically on target, and the lower end played out this morning too. Open interest was 2.35 million last night, dipped to a low of 2.30 million at 10:30, then climbed back up within minutes; it’s now around 2.33 million. Retail long positions fell from 78.8% to 77.8%, while large traders’ long-account share rose to 81% at the low and is still at 80% now.
The one-hour RSI is around 40. The 12-period moving average is at 1909, and price has just slipped below it. This morning’s low also broke below the lower Bollinger Band at 1880. At 17:45, the rebound reached a high of 1919, right around the Bollinger middle band at 1918, then pulled back to 1904.
Open interest couldn’t hold at 2.30 million. For now, I see 1875 as a pause in the downtrend, not a point to turn bullish. Large traders’ long-account share is still around 80%. Any rebound will first run into the 12-period moving average at 1909, then the middle band at 1918. If 1875 gives way again, the next level is 1820, from the August 1 candle.
#ETH #合约 #OpenInterest
Last night, I treated 1893 as a level that hadn’t been decisively cleared yet, and said any rebound would first run into the 26-period moving average at 1980; if 1893 gave way again, the next level would be 1820, from August 1. At 21:00, a candle saw about $883 million in volume and reached a high of 1988, but pulled back as soon as it moved above 1980. Another candle at 23:00 saw about $1.04 billion in volume, with a low of 1911. The upper end of the range was basically on target, and the lower end played out this morning too. Open interest was 2.35 million last night, dipped to a low of 2.30 million at 10:30, then climbed back up within minutes; it’s now around 2.33 million. Retail long positions fell from 78.8% to 77.8%, while large traders’ long-account share rose to 81% at the low and is still at 80% now.
The one-hour RSI is around 40. The 12-period moving average is at 1909, and price has just slipped below it. This morning’s low also broke below the lower Bollinger Band at 1880. At 17:45, the rebound reached a high of 1919, right around the Bollinger middle band at 1918, then pulled back to 1904.
Open interest couldn’t hold at 2.30 million. For now, I see 1875 as a pause in the downtrend, not a point to turn bullish. Large traders’ long-account share is still around 80%. Any rebound will first run into the 12-period moving average at 1909, then the middle band at 1918. If 1875 gives way again, the next level is 1820, from the August 1 candle.
#ETH #合约 #OpenInterest
1
131
·
--
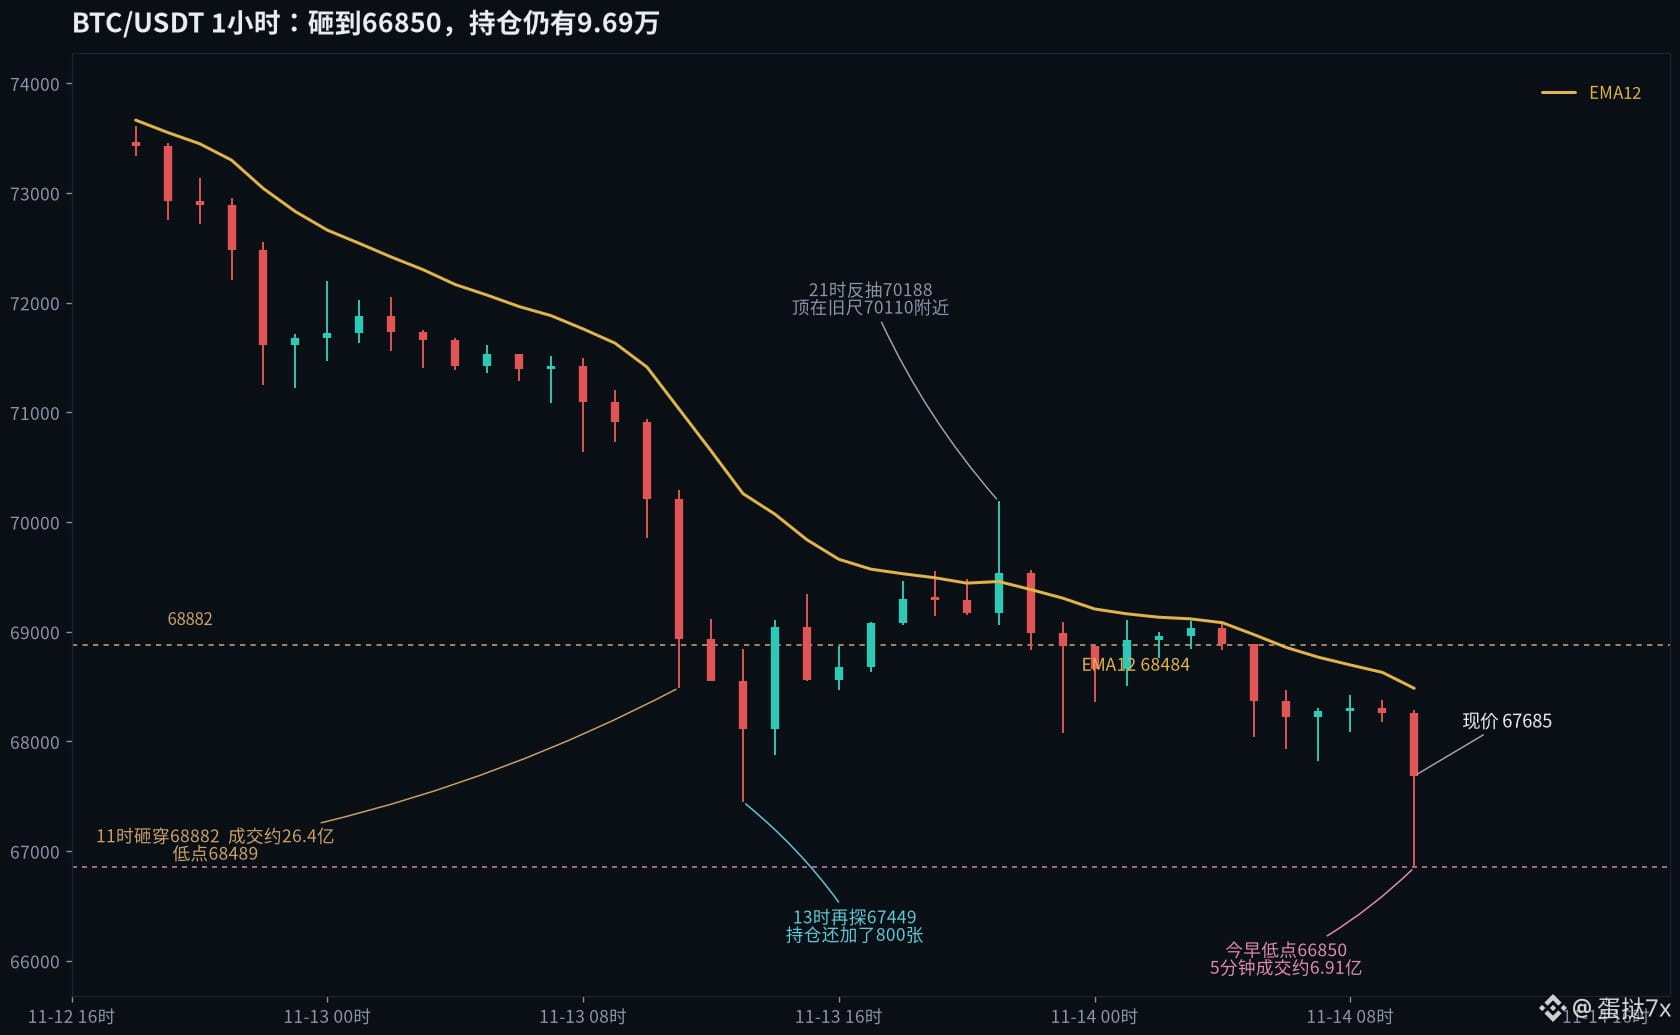
At 10:25, the long/short account ratio fell to 0.48, but long accounts were still at 76%—not down at all. $BTC plunged from 67,772 to 66,850, with about $691 million traded in a single five-minute candle. The current price is around 67,685, down about 3.6% over the past day, with about $19.3 billion in futures volume. The 10 o’clock hourly candle hasn’t closed yet, but volume is already around $1.71 billion.
Yesterday morning, I treated 70,000 as the midpoint of a squeeze lower. I noted that long accounts were still at 76% and open interest remained above 100,000 contracts, and said that if 70,110 gave way, the next level to watch would be 68,882, the August 20 low. At 11 o’clock, a candle with about $2.64 billion in volume plunged from 70,210 to 68,489, decisively breaking below 68,882. At 13:00, it tested 67,449, with about $1.90 billion in volume; open interest also increased by about 800 contracts that hour. At 21:00, it rebounded to 70,188, right around 70,110, then pulled back again.
This week’s open-interest peak is still yesterday at midnight, at 102,100 contracts. It’s now around 96,900, down by only about 5,000. Retail long accounts are still at 76.4% after the sell-off, while large-trader long accounts rose from 78.5% to 78.9%. The share of large-trader positions that are long did fall from 67.8% to 66.6%—it’s positions being reduced, not people leaving. The one-hour RSI is around 26.3, the 12-period moving average is at 68,484, and the Keltner midline at 68,859 is almost right on top of the old level that was just broken.
Both levels have given way, but the people haven’t all left yet. For now, I’m treating 66,850 as part of an ongoing grind lower. With retail long accounts still at 76% and open interest not yet back below 95,000 contracts, I expect any rebound to run into resistance first at the 12-period moving average, 68,484. If 66,850 gives way, the next level is 64,131, the low from August 19. These are my personal views.
#BTC #合约
At 10:25, the long/short account ratio fell to 0.48, but long accounts were still at 76%—not down at all. $BTC plunged from 67,772 to 66,850, with about $691 million traded in a single five-minute candle. The current price is around 67,685, down about 3.6% over the past day, with about $19.3 billion in futures volume. The 10 o’clock hourly candle hasn’t closed yet, but volume is already around $1.71 billion.
Yesterday morning, I treated 70,000 as the midpoint of a squeeze lower. I noted that long accounts were still at 76% and open interest remained above 100,000 contracts, and said that if 70,110 gave way, the next level to watch would be 68,882, the August 20 low. At 11 o’clock, a candle with about $2.64 billion in volume plunged from 70,210 to 68,489, decisively breaking below 68,882. At 13:00, it tested 67,449, with about $1.90 billion in volume; open interest also increased by about 800 contracts that hour. At 21:00, it rebounded to 70,188, right around 70,110, then pulled back again.
This week’s open-interest peak is still yesterday at midnight, at 102,100 contracts. It’s now around 96,900, down by only about 5,000. Retail long accounts are still at 76.4% after the sell-off, while large-trader long accounts rose from 78.5% to 78.9%. The share of large-trader positions that are long did fall from 67.8% to 66.6%—it’s positions being reduced, not people leaving. The one-hour RSI is around 26.3, the 12-period moving average is at 68,484, and the Keltner midline at 68,859 is almost right on top of the old level that was just broken.
Both levels have given way, but the people haven’t all left yet. For now, I’m treating 66,850 as part of an ongoing grind lower. With retail long accounts still at 76% and open interest not yet back below 95,000 contracts, I expect any rebound to run into resistance first at the 12-period moving average, 68,484. If 66,850 gives way, the next level is 64,131, the low from August 19. These are my personal views.
#BTC #合约
Yesterday morning, I treated 70,000 as the midpoint of a squeeze lower. I noted that long accounts were still at 76% and open interest remained above 100,000 contracts, and said that if 70,110 gave way, the next level to watch would be 68,882, the August 20 low. At 11 o’clock, a candle with about $2.64 billion in volume plunged from 70,210 to 68,489, decisively breaking below 68,882. At 13:00, it tested 67,449, with about $1.90 billion in volume; open interest also increased by about 800 contracts that hour. At 21:00, it rebounded to 70,188, right around 70,110, then pulled back again.
This week’s open-interest peak is still yesterday at midnight, at 102,100 contracts. It’s now around 96,900, down by only about 5,000. Retail long accounts are still at 76.4% after the sell-off, while large-trader long accounts rose from 78.5% to 78.9%. The share of large-trader positions that are long did fall from 67.8% to 66.6%—it’s positions being reduced, not people leaving. The one-hour RSI is around 26.3, the 12-period moving average is at 68,484, and the Keltner midline at 68,859 is almost right on top of the old level that was just broken.
Both levels have given way, but the people haven’t all left yet. For now, I’m treating 66,850 as part of an ongoing grind lower. With retail long accounts still at 76% and open interest not yet back below 95,000 contracts, I expect any rebound to run into resistance first at the 12-period moving average, 68,484. If 66,850 gives way, the next level is 64,131, the low from August 19. These are my personal views.
#BTC #合约
96
·
--
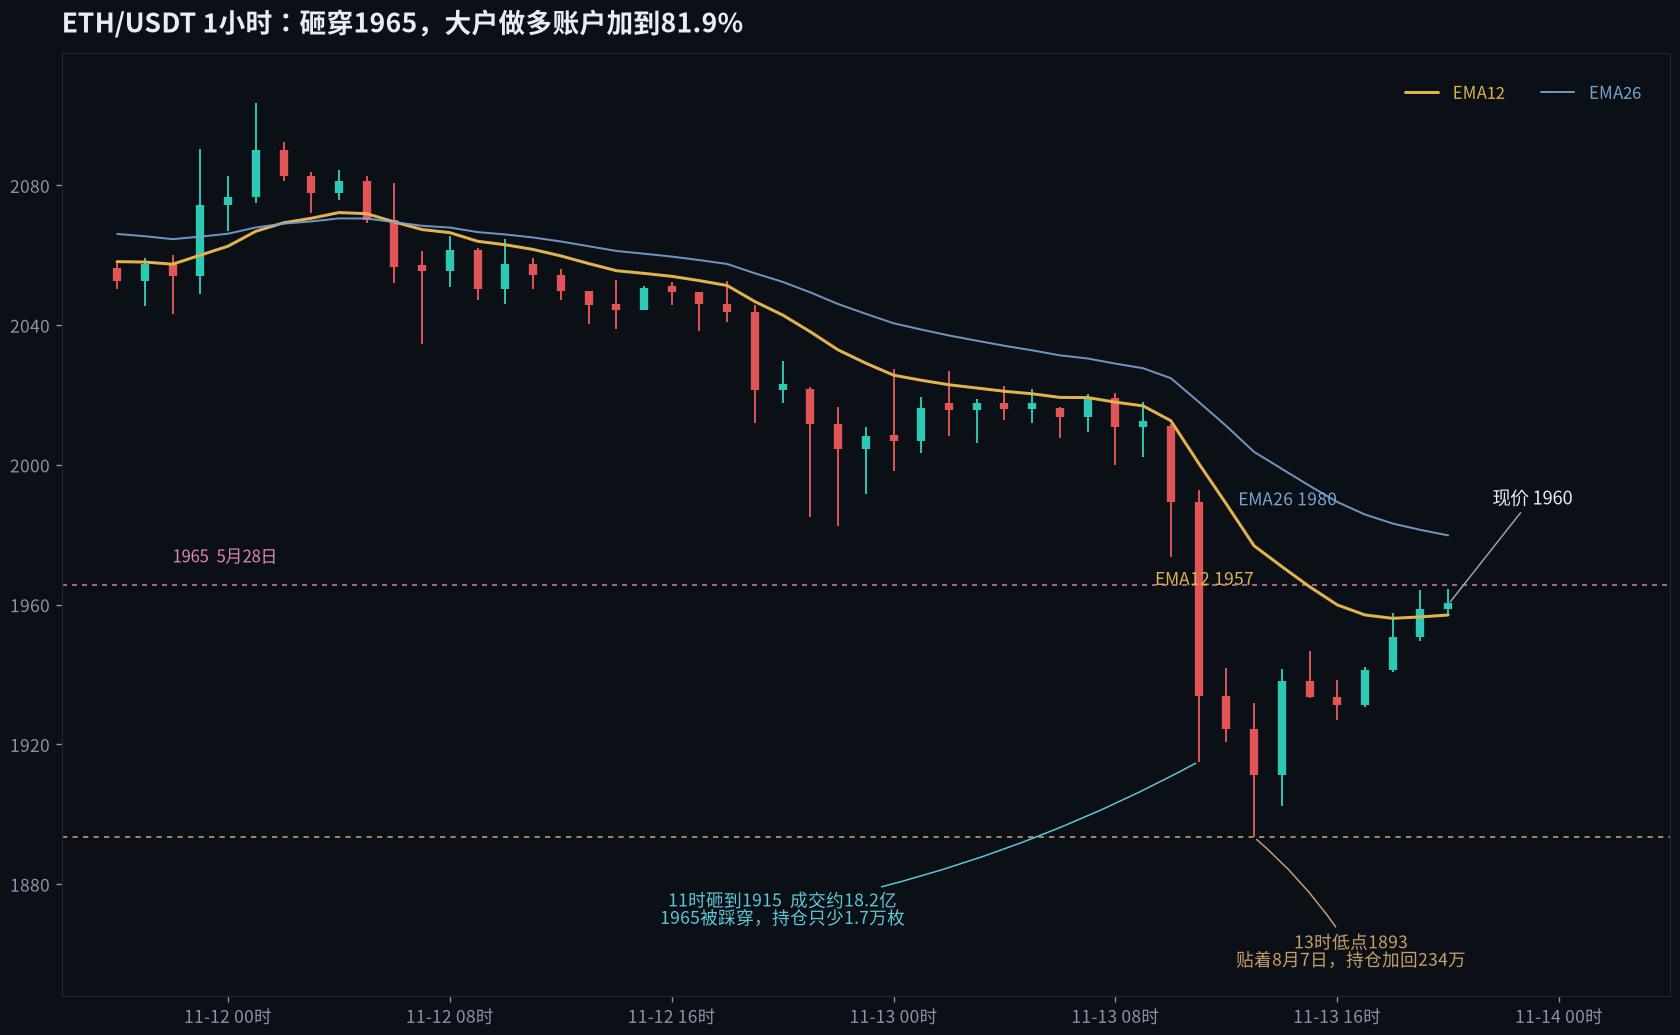
$1.8 billion smashed through 1965, then top traders’ long-account ratio climbed to 82%—$ETH plunged from 1989 to 1915 at 11:00 a.m., with about $1.82 billion in hourly trading volume, breaking straight through the May 28 level of 1965; at 1:00 p.m. it tested 1893, almost touching the August 7 low. The current price is around 1960, down about 3.0% over the past day, with about $11.6 billion in futures trading volume.
Last night, I treated the drop through 2012 as part of the downward move, and noted that long accounts were still stuck at 76% and open interest remained near 2.32 million, with 1965 the next level to watch if 2003 gave way. The 9:00 p.m. and 10:00 p.m. candles traded about $2.42 billion combined, with a low of 1982; 2003 went first. The midnight rebound reached 2027, but still didn’t get back above last night’s 12-period moving average. This morning’s huge 11:00 a.m. candle saw open interest fall by only about 17,000 ETH; by 1:00 p.m., when the price touched 1893, the total had actually climbed back to 2.34 million. At 3:00 p.m., top traders’ long-account ratio reached 81.9%, while retail traders’ long-account ratio hit 79.4%—more crowded than last night’s 76.7% and 76.8%. Open interest is now around 2.35 million, still above last night’s level. The J value on the one-hour KDJ has surged to 96, and the price has just returned to around the 12-period moving average at 1957, while the 26-period moving average at 1980 is still acting as resistance. As selling pressure drove prices down, some traders added longs at lower levels; this rebound is being lifted by new positions.
I don’t see this retest of 1893 as a floor formed after a complete flush-out. Long accounts are still around 80%, and open interest remains above 2.35 million; the rebound first ran into resistance at the 26-period moving average at 1980. If 1893 gives way again, the next level to watch is 1820, around the August 1 candle.
#ETH #合约 #OpenInterest
$1.8 billion smashed through 1965, then top traders’ long-account ratio climbed to 82%—$ETH plunged from 1989 to 1915 at 11:00 a.m., with about $1.82 billion in hourly trading volume, breaking straight through the May 28 level of 1965; at 1:00 p.m. it tested 1893, almost touching the August 7 low. The current price is around 1960, down about 3.0% over the past day, with about $11.6 billion in futures trading volume.
Last night, I treated the drop through 2012 as part of the downward move, and noted that long accounts were still stuck at 76% and open interest remained near 2.32 million, with 1965 the next level to watch if 2003 gave way. The 9:00 p.m. and 10:00 p.m. candles traded about $2.42 billion combined, with a low of 1982; 2003 went first. The midnight rebound reached 2027, but still didn’t get back above last night’s 12-period moving average. This morning’s huge 11:00 a.m. candle saw open interest fall by only about 17,000 ETH; by 1:00 p.m., when the price touched 1893, the total had actually climbed back to 2.34 million. At 3:00 p.m., top traders’ long-account ratio reached 81.9%, while retail traders’ long-account ratio hit 79.4%—more crowded than last night’s 76.7% and 76.8%. Open interest is now around 2.35 million, still above last night’s level. The J value on the one-hour KDJ has surged to 96, and the price has just returned to around the 12-period moving average at 1957, while the 26-period moving average at 1980 is still acting as resistance. As selling pressure drove prices down, some traders added longs at lower levels; this rebound is being lifted by new positions.
I don’t see this retest of 1893 as a floor formed after a complete flush-out. Long accounts are still around 80%, and open interest remains above 2.35 million; the rebound first ran into resistance at the 26-period moving average at 1980. If 1893 gives way again, the next level to watch is 1820, around the August 1 candle.
#ETH #合约 #OpenInterest
Last night, I treated the drop through 2012 as part of the downward move, and noted that long accounts were still stuck at 76% and open interest remained near 2.32 million, with 1965 the next level to watch if 2003 gave way. The 9:00 p.m. and 10:00 p.m. candles traded about $2.42 billion combined, with a low of 1982; 2003 went first. The midnight rebound reached 2027, but still didn’t get back above last night’s 12-period moving average. This morning’s huge 11:00 a.m. candle saw open interest fall by only about 17,000 ETH; by 1:00 p.m., when the price touched 1893, the total had actually climbed back to 2.34 million. At 3:00 p.m., top traders’ long-account ratio reached 81.9%, while retail traders’ long-account ratio hit 79.4%—more crowded than last night’s 76.7% and 76.8%. Open interest is now around 2.35 million, still above last night’s level. The J value on the one-hour KDJ has surged to 96, and the price has just returned to around the 12-period moving average at 1957, while the 26-period moving average at 1980 is still acting as resistance. As selling pressure drove prices down, some traders added longs at lower levels; this rebound is being lifted by new positions.
I don’t see this retest of 1893 as a floor formed after a complete flush-out. Long accounts are still around 80%, and open interest remains above 2.35 million; the rebound first ran into resistance at the 26-period moving average at 1980. If 1893 gives way again, the next level to watch is 1820, around the August 1 candle.
#ETH #合约 #OpenInterest
284
·
--
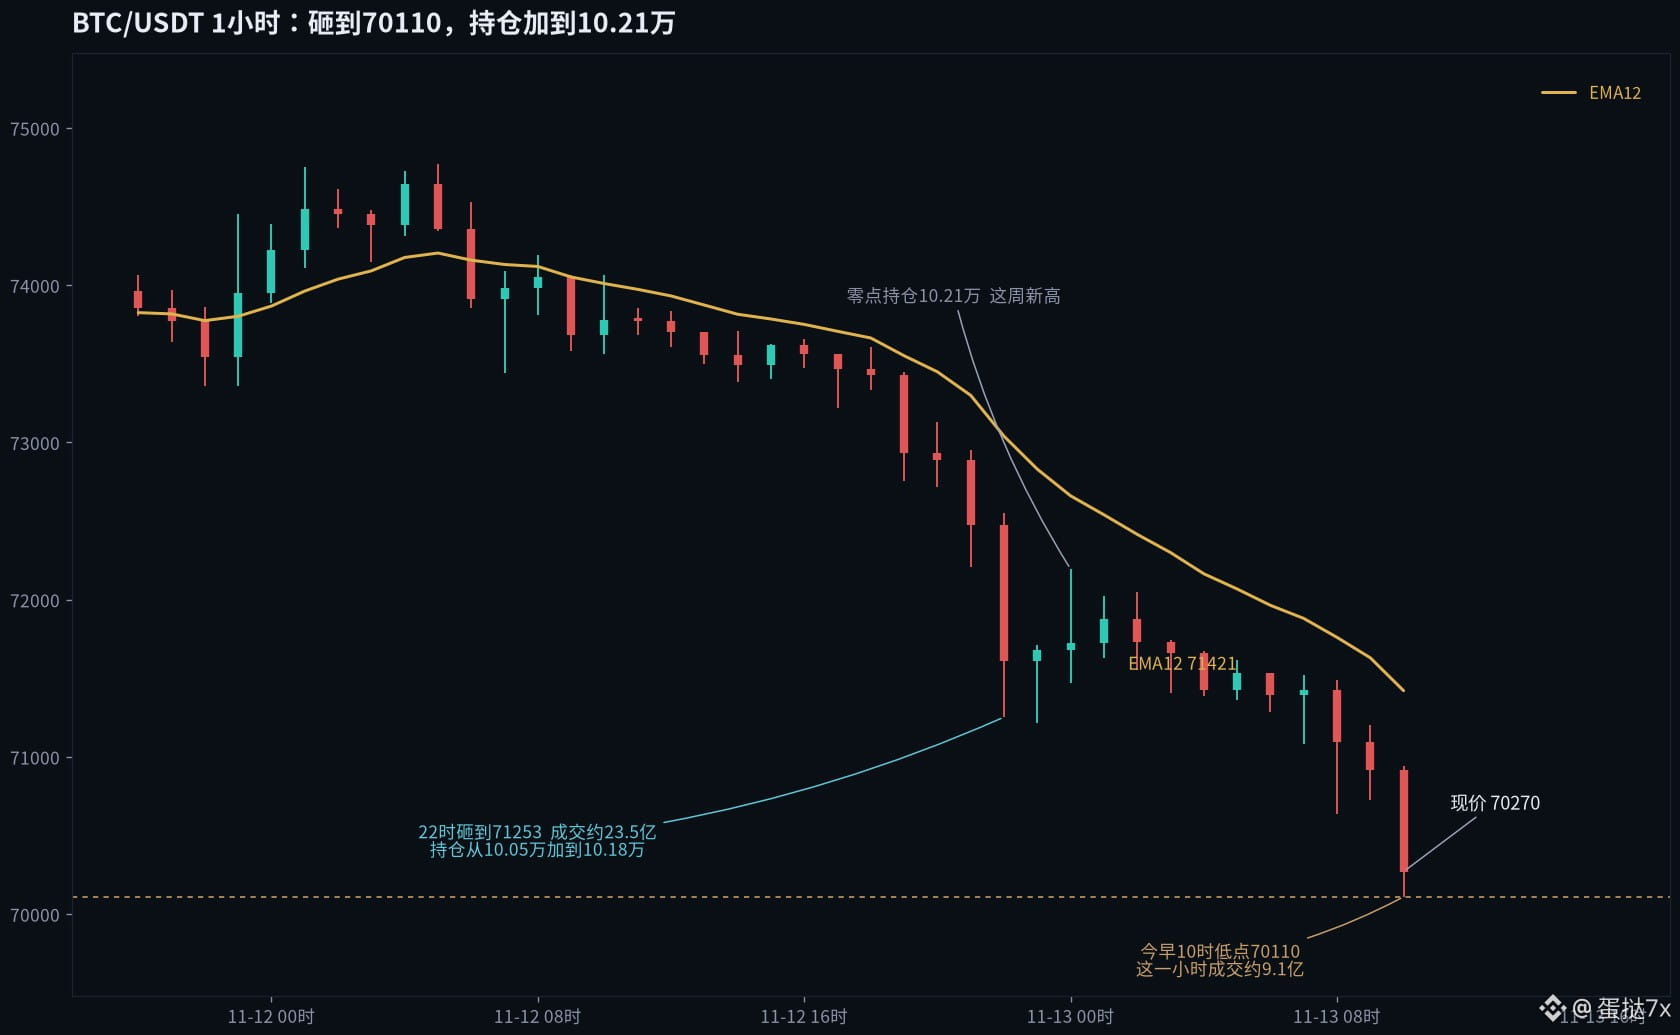
When positioning climbed to a new weekly high, price touched 70,000—the $BTC futures contract count peaked at 102.1K. Last night at 22:00, price plunged from 72,476 to 71,253, with about $2.35B in hourly trading volume, while open interest rose from roughly 100.5K to 101.8K by 23:00. This morning’s 10:00 candle dipped from 70,915 to 70,110, with about $910M traded in that hour. The current price is around 70,280, down about 4.8% over the past day, with roughly $12.6B in futures trading volume.
On November 6, I treated 76,190 as a falling-knife-catching phase: the selloff was over, but positions were still being added. I said that until retail long accounts eased back to 65% and open interest fell to 92K coins, losing 75,158 would put deeper levels back in view. That 75,158 mark has long since been lost. Over the past seven days, price has fallen another roughly 6,000, while the share of retail accounts going long has barely budged—from about 76% at the time to 76.2% at 7:00 this morning, and now still stuck at 75.7%. Open interest has risen from about 95.5K to around 101K, hitting a new weekly high at midnight. At this morning’s 08:00 funding settlement, the rate was still +0.01%: longs are still paying shorts after being hammered. The share of large traders’ positions that are long fell from 69.9% to 68.3% this morning, while retail positioning barely moved. The one-hour RSI dropped to 16. Price has already fallen below the Keltner lower band at 70,886 and is hugging the Bollinger lower band at 70,145; the 12-period moving average is at 71,421.
For now, I’m marking 70,000 as a halfway point in a crowded move downward; the washout hasn’t happened yet. Long accounts are still at 76%, and open interest remains above 100K coins. Any rebound will first run into resistance at the 12-period moving average, 71,421. If 70,110 gives way again, the next level is 68,882, at the August 20 candle.
#BTC #合约 #Positions
When positioning climbed to a new weekly high, price touched 70,000—the $BTC futures contract count peaked at 102.1K. Last night at 22:00, price plunged from 72,476 to 71,253, with about $2.35B in hourly trading volume, while open interest rose from roughly 100.5K to 101.8K by 23:00. This morning’s 10:00 candle dipped from 70,915 to 70,110, with about $910M traded in that hour. The current price is around 70,280, down about 4.8% over the past day, with roughly $12.6B in futures trading volume.
On November 6, I treated 76,190 as a falling-knife-catching phase: the selloff was over, but positions were still being added. I said that until retail long accounts eased back to 65% and open interest fell to 92K coins, losing 75,158 would put deeper levels back in view. That 75,158 mark has long since been lost. Over the past seven days, price has fallen another roughly 6,000, while the share of retail accounts going long has barely budged—from about 76% at the time to 76.2% at 7:00 this morning, and now still stuck at 75.7%. Open interest has risen from about 95.5K to around 101K, hitting a new weekly high at midnight. At this morning’s 08:00 funding settlement, the rate was still +0.01%: longs are still paying shorts after being hammered. The share of large traders’ positions that are long fell from 69.9% to 68.3% this morning, while retail positioning barely moved. The one-hour RSI dropped to 16. Price has already fallen below the Keltner lower band at 70,886 and is hugging the Bollinger lower band at 70,145; the 12-period moving average is at 71,421.
For now, I’m marking 70,000 as a halfway point in a crowded move downward; the washout hasn’t happened yet. Long accounts are still at 76%, and open interest remains above 100K coins. Any rebound will first run into resistance at the 12-period moving average, 71,421. If 70,110 gives way again, the next level is 68,882, at the August 20 candle.
#BTC #合约 #Positions
On November 6, I treated 76,190 as a falling-knife-catching phase: the selloff was over, but positions were still being added. I said that until retail long accounts eased back to 65% and open interest fell to 92K coins, losing 75,158 would put deeper levels back in view. That 75,158 mark has long since been lost. Over the past seven days, price has fallen another roughly 6,000, while the share of retail accounts going long has barely budged—from about 76% at the time to 76.2% at 7:00 this morning, and now still stuck at 75.7%. Open interest has risen from about 95.5K to around 101K, hitting a new weekly high at midnight. At this morning’s 08:00 funding settlement, the rate was still +0.01%: longs are still paying shorts after being hammered. The share of large traders’ positions that are long fell from 69.9% to 68.3% this morning, while retail positioning barely moved. The one-hour RSI dropped to 16. Price has already fallen below the Keltner lower band at 70,886 and is hugging the Bollinger lower band at 70,145; the 12-period moving average is at 71,421.
For now, I’m marking 70,000 as a halfway point in a crowded move downward; the washout hasn’t happened yet. Long accounts are still at 76%, and open interest remains above 100K coins. Any rebound will first run into resistance at the 12-period moving average, 71,421. If 70,110 gives way again, the next level is 68,882, at the August 20 candle.
#BTC #合约 #Positions
310
·
--
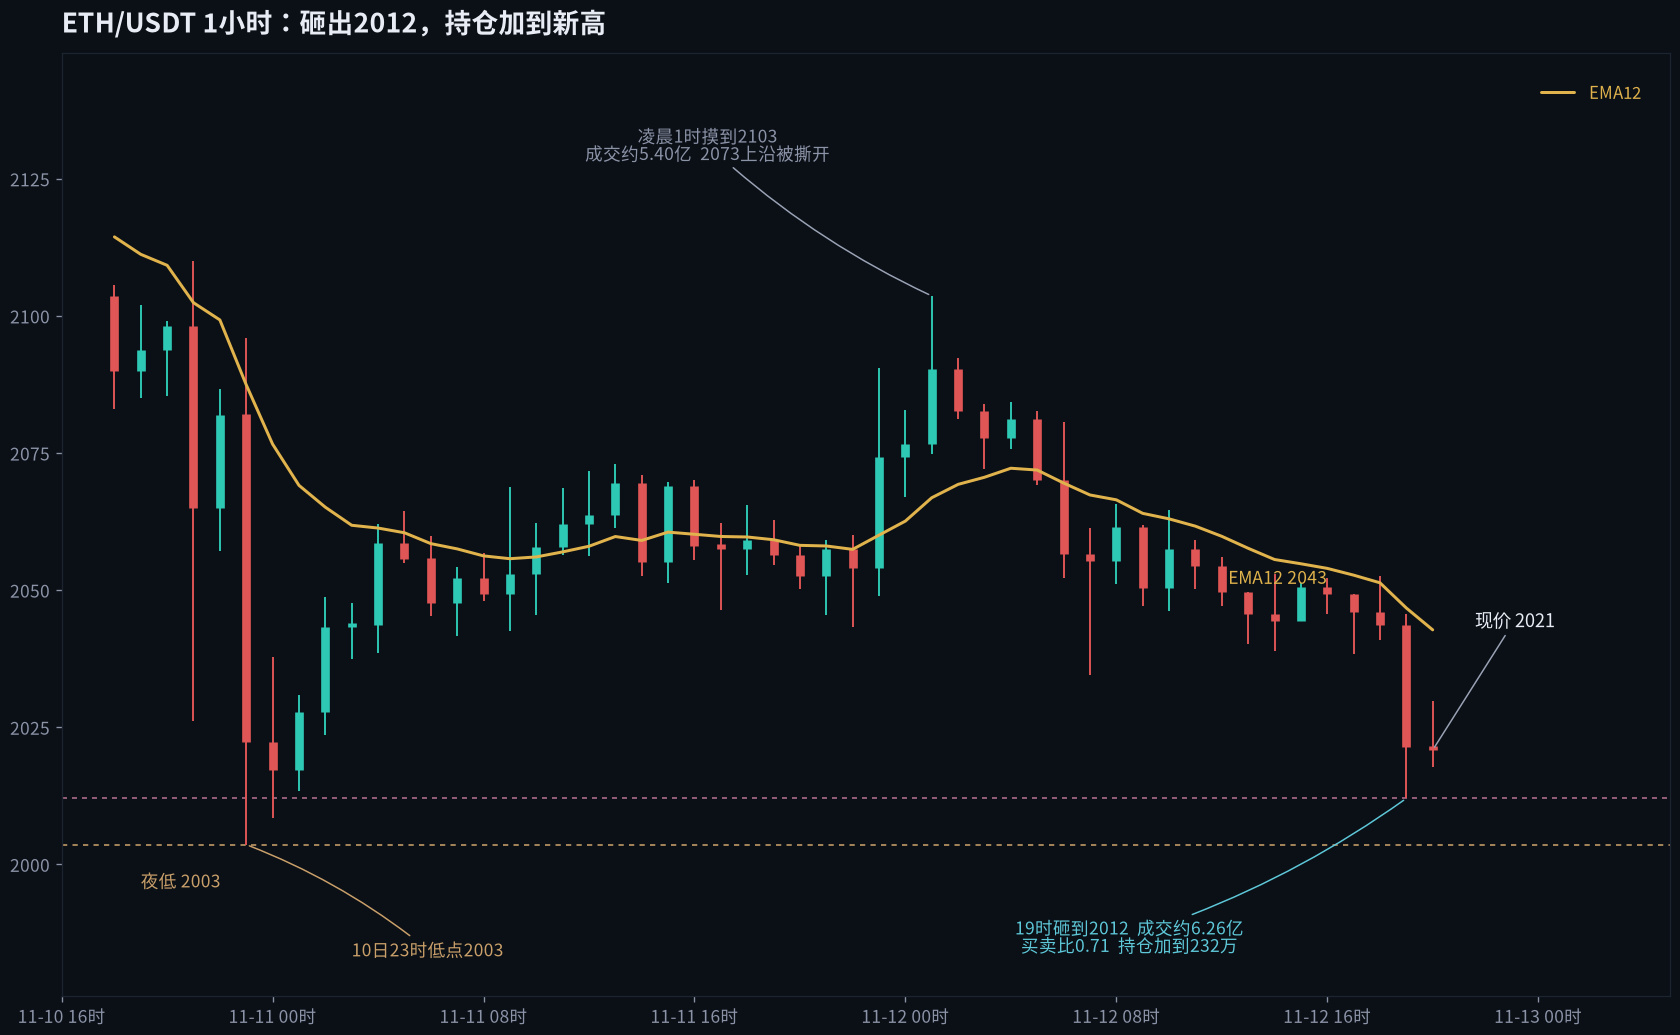
In the hour the buy/sell ratio fell to 0.71, open interest climbed to a three-day high. At 19:00, $ETH plunged from 2044 to 2012, with roughly $626 million in hourly volume; the contract count rose from about 2.3 million coins last night to 2.32 million at 19:00. The current price is around 2021, down about 1.6% over the past day, with roughly $6.4 billion in contract volume.
Last night, I treated 2055 as a retest and said I wouldn’t look for a bullish reversal until the long-account ratio moved down from 76% and open interest fell below 2.23 million coins. The first level above was the 12-period moving average at 2059, followed by the daytime high at 2073. The 1 a.m. candle had roughly $540 million in volume and reached a high of 2103, breaking through both of those upper levels. I drew the upper boundary too conservatively, but I haven’t changed the bullish-reversal trigger. The long-account ratio barely moved, from 76.3% to a morning low of 75.8%, and has now climbed back to 76.8%. Open interest never fell below 2.23 million; instead, the 19:00 candle set a three-day high, and at 20:00 it had only eased back to around 2.31 million. There was no position flush. The 19:30 five-minute candle had roughly $156 million in volume and plunged to 2027; at 19:50, another candle came in at roughly $176 million, with a low of 2012—just nine dollars above the 2003 low from the night of the 10th. The hourly RSI fell to 31. Price has already broken below the Keltner lower band at 2018 and is hugging the Bollinger lower band at 2020; the 12-period moving average is at 2043. The longs added during the sell-off are still hanging on above the 2003 level.
Open interest rose as price fell, so I don’t see 2012 as a position flush. The long-account ratio is still pinned at 76%, and open interest remains around 2.32 million. The 12-period moving average at 2043 is the first resistance on a rebound; if 2003 gives way, the next level down is 1965, the low from May 28.
#ETH #合约 #Position
In the hour the buy/sell ratio fell to 0.71, open interest climbed to a three-day high. At 19:00, $ETH plunged from 2044 to 2012, with roughly $626 million in hourly volume; the contract count rose from about 2.3 million coins last night to 2.32 million at 19:00. The current price is around 2021, down about 1.6% over the past day, with roughly $6.4 billion in contract volume.
Last night, I treated 2055 as a retest and said I wouldn’t look for a bullish reversal until the long-account ratio moved down from 76% and open interest fell below 2.23 million coins. The first level above was the 12-period moving average at 2059, followed by the daytime high at 2073. The 1 a.m. candle had roughly $540 million in volume and reached a high of 2103, breaking through both of those upper levels. I drew the upper boundary too conservatively, but I haven’t changed the bullish-reversal trigger. The long-account ratio barely moved, from 76.3% to a morning low of 75.8%, and has now climbed back to 76.8%. Open interest never fell below 2.23 million; instead, the 19:00 candle set a three-day high, and at 20:00 it had only eased back to around 2.31 million. There was no position flush. The 19:30 five-minute candle had roughly $156 million in volume and plunged to 2027; at 19:50, another candle came in at roughly $176 million, with a low of 2012—just nine dollars above the 2003 low from the night of the 10th. The hourly RSI fell to 31. Price has already broken below the Keltner lower band at 2018 and is hugging the Bollinger lower band at 2020; the 12-period moving average is at 2043. The longs added during the sell-off are still hanging on above the 2003 level.
Open interest rose as price fell, so I don’t see 2012 as a position flush. The long-account ratio is still pinned at 76%, and open interest remains around 2.32 million. The 12-period moving average at 2043 is the first resistance on a rebound; if 2003 gives way, the next level down is 1965, the low from May 28.
#ETH #合约 #Position
Last night, I treated 2055 as a retest and said I wouldn’t look for a bullish reversal until the long-account ratio moved down from 76% and open interest fell below 2.23 million coins. The first level above was the 12-period moving average at 2059, followed by the daytime high at 2073. The 1 a.m. candle had roughly $540 million in volume and reached a high of 2103, breaking through both of those upper levels. I drew the upper boundary too conservatively, but I haven’t changed the bullish-reversal trigger. The long-account ratio barely moved, from 76.3% to a morning low of 75.8%, and has now climbed back to 76.8%. Open interest never fell below 2.23 million; instead, the 19:00 candle set a three-day high, and at 20:00 it had only eased back to around 2.31 million. There was no position flush. The 19:30 five-minute candle had roughly $156 million in volume and plunged to 2027; at 19:50, another candle came in at roughly $176 million, with a low of 2012—just nine dollars above the 2003 low from the night of the 10th. The hourly RSI fell to 31. Price has already broken below the Keltner lower band at 2018 and is hugging the Bollinger lower band at 2020; the 12-period moving average is at 2043. The longs added during the sell-off are still hanging on above the 2003 level.
Open interest rose as price fell, so I don’t see 2012 as a position flush. The long-account ratio is still pinned at 76%, and open interest remains around 2.32 million. The 12-period moving average at 2043 is the first resistance on a rebound; if 2003 gives way, the next level down is 1965, the low from May 28.
#ETH #合约 #Position
212
·
--
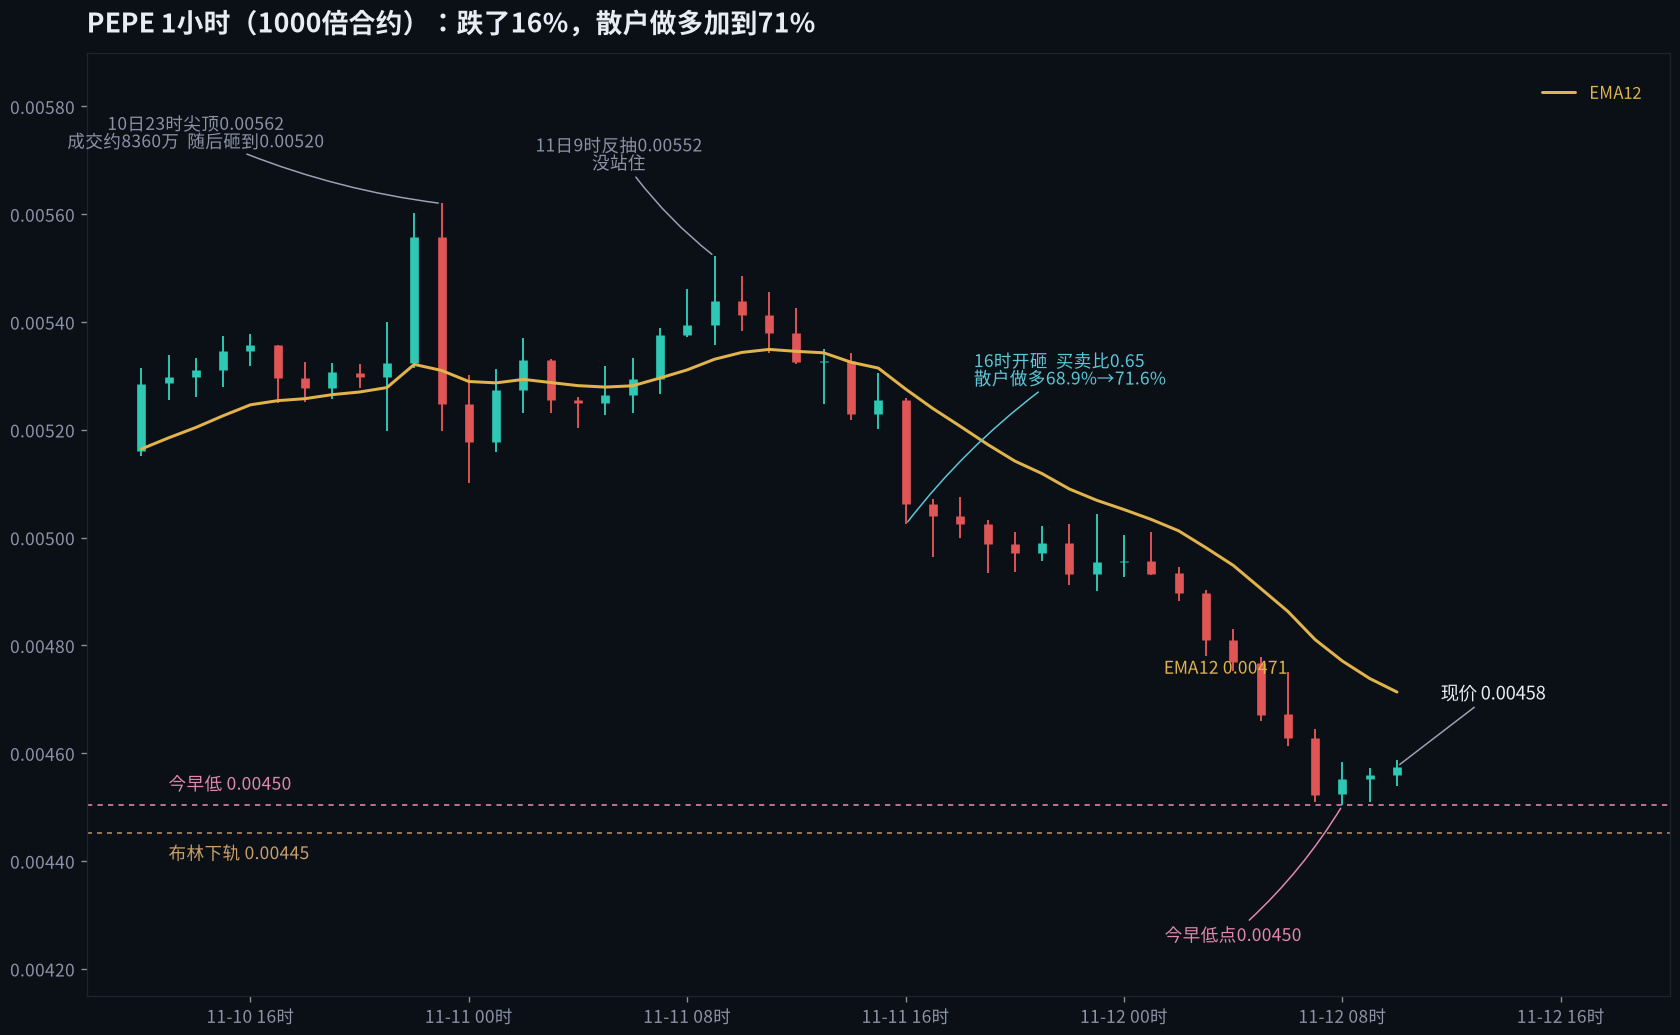
As selling pressure overwhelmed buyers, retail accounts going long climbed to 72%—in $PEPE 1000x perpetuals, a rebound at 9 a.m. on the 11th touched 0.00552 but failed to hold. At 4 p.m., the price plunged from 0.00526 to 0.00502, with about $45.8 million in hourly volume and the taker buy/sell ratio dropping to 0.65. At 5 p.m., another roughly $45 million candle sent the price to a low of 0.00496. In just those two hours, retail longs rose from 68.9% to 70.9%, reaching 71.6% by 8 p.m. The decline continued from 4 p.m. through 8 a.m. this morning, with total volume around $431 million and a low of 0.00450. The current price is around 0.00458, down about 16% over the past day, with about $535 million in futures volume.
Since the peak of 0.00562 late on the 10th, the price has fallen nearly 20%. When the sell-off began at 4 p.m., open interest was around 22.26 billion tokens and barely budged; it even recovered to 22.33 billion at 5 a.m. this morning. It now stands at about 21.53 billion, just 10% below the 24 billion at the peak. Meanwhile, the share of large traders’ positions that are long fell from 66% to 61%. The one-hour RSI dropped to 23, the price has broken below the Keltner lower band at 0.00462, and the 12-period moving average is at 0.00471.
Who’s adding longs into the sell-off? If 0.00450 breaks again, they’ll be the first to get liquidated. I’ll make a note of this rebound, but I’m not treating it as a bottom. Retail longs are still at 67%, and positions haven’t been cleared out. For now, watch the 12-period moving average at 0.00471 above; if 0.00450 gives way again, the next level is the lower Bollinger Band at 0.00445, followed by 0.00441 from October 29.
#PEPE #Futures
As selling pressure overwhelmed buyers, retail accounts going long climbed to 72%—in $PEPE 1000x perpetuals, a rebound at 9 a.m. on the 11th touched 0.00552 but failed to hold. At 4 p.m., the price plunged from 0.00526 to 0.00502, with about $45.8 million in hourly volume and the taker buy/sell ratio dropping to 0.65. At 5 p.m., another roughly $45 million candle sent the price to a low of 0.00496. In just those two hours, retail longs rose from 68.9% to 70.9%, reaching 71.6% by 8 p.m. The decline continued from 4 p.m. through 8 a.m. this morning, with total volume around $431 million and a low of 0.00450. The current price is around 0.00458, down about 16% over the past day, with about $535 million in futures volume.
Since the peak of 0.00562 late on the 10th, the price has fallen nearly 20%. When the sell-off began at 4 p.m., open interest was around 22.26 billion tokens and barely budged; it even recovered to 22.33 billion at 5 a.m. this morning. It now stands at about 21.53 billion, just 10% below the 24 billion at the peak. Meanwhile, the share of large traders’ positions that are long fell from 66% to 61%. The one-hour RSI dropped to 23, the price has broken below the Keltner lower band at 0.00462, and the 12-period moving average is at 0.00471.
Who’s adding longs into the sell-off? If 0.00450 breaks again, they’ll be the first to get liquidated. I’ll make a note of this rebound, but I’m not treating it as a bottom. Retail longs are still at 67%, and positions haven’t been cleared out. For now, watch the 12-period moving average at 0.00471 above; if 0.00450 gives way again, the next level is the lower Bollinger Band at 0.00445, followed by 0.00441 from October 29.
#PEPE #Futures
Since the peak of 0.00562 late on the 10th, the price has fallen nearly 20%. When the sell-off began at 4 p.m., open interest was around 22.26 billion tokens and barely budged; it even recovered to 22.33 billion at 5 a.m. this morning. It now stands at about 21.53 billion, just 10% below the 24 billion at the peak. Meanwhile, the share of large traders’ positions that are long fell from 66% to 61%. The one-hour RSI dropped to 23, the price has broken below the Keltner lower band at 0.00462, and the 12-period moving average is at 0.00471.
Who’s adding longs into the sell-off? If 0.00450 breaks again, they’ll be the first to get liquidated. I’ll make a note of this rebound, but I’m not treating it as a bottom. Retail longs are still at 67%, and positions haven’t been cleared out. For now, watch the 12-period moving average at 0.00471 above; if 0.00450 gives way again, the next level is the lower Bollinger Band at 0.00445, followed by 0.00441 from October 29.
#PEPE #Futures
235
·
--
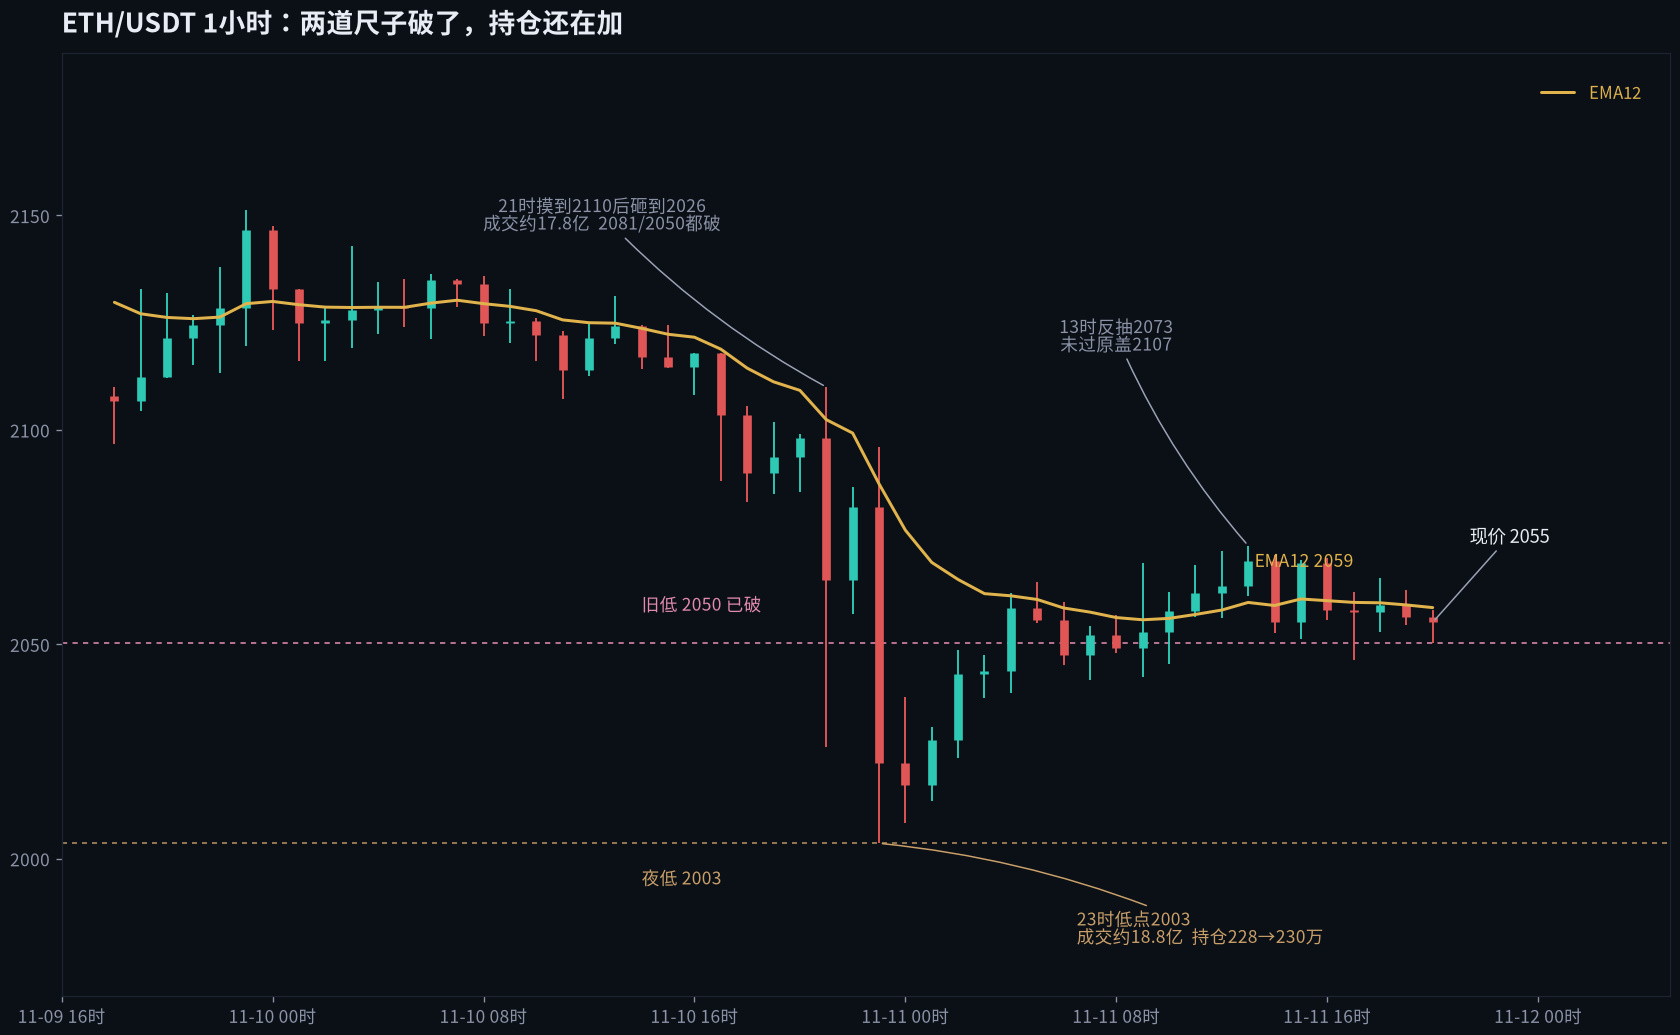
Both of my key levels broke overnight, while open interest climbed by about 18,000 ETH. $ETH futures first touched 2,110 at 21:00 last night, right at the 12-period moving average I drew at 2,107. Then a single candle with about $1.78 billion in trading volume plunged to 2,026, breaking through both 2,081 and 2,050; at 23:00, another candle with about $1.88 billion in volume drove the low down to 2,003. The two candles totaled about $3.65 billion in volume. The current price is around 2,055, down about 1.6% over the past 24 hours, with futures trading volume around $9 billion.
Last night, I treated 2,083 as a failed recovery and said that any rebound would first meet resistance at 2,107, and if 2,081 broke, the next level to watch would be 2,050. Price has played out, but open interest hasn't. During the hours of selling, open interest rose from about 2.28 million ETH to about 2.30 million. Even at 5:00 this morning, it had only eased to 2.27 million—not back to the previous 2.23 million. Retail accounts' long positions only slipped from 80% to 76%, while large traders' long accounts fell from 81% to 76%. Someone was buying into the sell-off, with the newly added long positions clustered just above 2,003. This afternoon, the rebound only reached a high of 2,073, never even touching 2,107. The RSI recovered from 30 to 44, and the MACD histogram has turned positive, making the chart look a bit warmer—but this 20:00 candle touched 2,050 again.
Open interest is still climbing, so for now I’m treating this as a rebound, not waiting for a bullish reversal. Until the percentage of long accounts moves above 76% and open interest falls back below 2.23 million ETH, I’ll first be watching the 12-period moving average at 2,059, then the daytime high of 2,073. Only if 2,003 breaks again will 1,965—the low of the May 28 candle—come into play, along with the liquidation of these newly added long positions. These are my personal views.
#ETH #合约 #OpenInterest
Both of my key levels broke overnight, while open interest climbed by about 18,000 ETH. $ETH futures first touched 2,110 at 21:00 last night, right at the 12-period moving average I drew at 2,107. Then a single candle with about $1.78 billion in trading volume plunged to 2,026, breaking through both 2,081 and 2,050; at 23:00, another candle with about $1.88 billion in volume drove the low down to 2,003. The two candles totaled about $3.65 billion in volume. The current price is around 2,055, down about 1.6% over the past 24 hours, with futures trading volume around $9 billion.
Last night, I treated 2,083 as a failed recovery and said that any rebound would first meet resistance at 2,107, and if 2,081 broke, the next level to watch would be 2,050. Price has played out, but open interest hasn't. During the hours of selling, open interest rose from about 2.28 million ETH to about 2.30 million. Even at 5:00 this morning, it had only eased to 2.27 million—not back to the previous 2.23 million. Retail accounts' long positions only slipped from 80% to 76%, while large traders' long accounts fell from 81% to 76%. Someone was buying into the sell-off, with the newly added long positions clustered just above 2,003. This afternoon, the rebound only reached a high of 2,073, never even touching 2,107. The RSI recovered from 30 to 44, and the MACD histogram has turned positive, making the chart look a bit warmer—but this 20:00 candle touched 2,050 again.
Open interest is still climbing, so for now I’m treating this as a rebound, not waiting for a bullish reversal. Until the percentage of long accounts moves above 76% and open interest falls back below 2.23 million ETH, I’ll first be watching the 12-period moving average at 2,059, then the daytime high of 2,073. Only if 2,003 breaks again will 1,965—the low of the May 28 candle—come into play, along with the liquidation of these newly added long positions. These are my personal views.
#ETH #合约 #OpenInterest
Last night, I treated 2,083 as a failed recovery and said that any rebound would first meet resistance at 2,107, and if 2,081 broke, the next level to watch would be 2,050. Price has played out, but open interest hasn't. During the hours of selling, open interest rose from about 2.28 million ETH to about 2.30 million. Even at 5:00 this morning, it had only eased to 2.27 million—not back to the previous 2.23 million. Retail accounts' long positions only slipped from 80% to 76%, while large traders' long accounts fell from 81% to 76%. Someone was buying into the sell-off, with the newly added long positions clustered just above 2,003. This afternoon, the rebound only reached a high of 2,073, never even touching 2,107. The RSI recovered from 30 to 44, and the MACD histogram has turned positive, making the chart look a bit warmer—but this 20:00 candle touched 2,050 again.
Open interest is still climbing, so for now I’m treating this as a rebound, not waiting for a bullish reversal. Until the percentage of long accounts moves above 76% and open interest falls back below 2.23 million ETH, I’ll first be watching the 12-period moving average at 2,059, then the daytime high of 2,073. Only if 2,003 breaks again will 1,965—the low of the May 28 candle—come into play, along with the liquidation of these newly added long positions. These are my personal views.
#ETH #合约 #OpenInterest
209
·
--
$940 million was dumped, but open interest fell by only 12,000 contracts. $ZEC dropped from last night's spike at 1,199 to 993; it's now around 1,029, down about 11% over the past day, with roughly $2.64 billion in contract volume. Yesterday morning, I treated 1,141 as a level tracking the move, not as confirmation that the washout was complete. I said that until open interest was pushed below 420,000 contracts and the retail long ratio eased back from 54%, any rebound would first run into resistance at 1,176; if 1,141 broke again, the next level was 1,120, from November 3. The 4 p.m. candle yesterday had already dipped to 1,134. From 9 to 10 p.m., price bounced from 1,130 to 1,188. After touching 1,199 at 11 p.m., a candle with roughly $451 million in volume slammed it down to 1,073, taking out 1,120 on the spot; at midnight, another candle with around $490 million in volume drove the low to 993.
Both levels broke, but open interest wasn't fully flushed out. At 11 p.m., open interest was around 455,300 contracts; by midnight, it had only fallen to about 443,000. Now it's back to roughly 448,400—still higher than yesterday morning's roughly 440,000. The retail long ratio was around 54% yesterday morning and is now about 56%; the top-trader long account ratio has risen from around 54% to around 58%. The mechanism is simple: the waterfall wiped out price, but liquidations didn't take the contract count with them, and accounts are leaning even further long. So a rebound just means catching the falling knife again.
The 1-hour RSI is around 32. The 12-period moving average is about 1,053, the 26-period about 1,091, and the 50-period about 1,135—all three are overhead. The current price is just hugging the lower Keltner band at around 1,018; the lower Bollinger band, around 968, is further below.
At 1,029, I treat this as price having been dumped but open interest not having been flushed—catching a falling knife, not a floor. Until open interest falls below 440,000 contracts and the retail long ratio eases from 56%, any rebound will first run into resistance at the 12-period moving average at 1,053; if 993 breaks again, the next level below is 932, the September 4 candle.
$ZEC #合约数据 #Open interest
$940 million was dumped, but open interest fell by only 12,000 contracts. $ZEC dropped from last night's spike at 1,199 to 993; it's now around 1,029, down about 11% over the past day, with roughly $2.64 billion in contract volume. Yesterday morning, I treated 1,141 as a level tracking the move, not as confirmation that the washout was complete. I said that until open interest was pushed below 420,000 contracts and the retail long ratio eased back from 54%, any rebound would first run into resistance at 1,176; if 1,141 broke again, the next level was 1,120, from November 3. The 4 p.m. candle yesterday had already dipped to 1,134. From 9 to 10 p.m., price bounced from 1,130 to 1,188. After touching 1,199 at 11 p.m., a candle with roughly $451 million in volume slammed it down to 1,073, taking out 1,120 on the spot; at midnight, another candle with around $490 million in volume drove the low to 993.
Both levels broke, but open interest wasn't fully flushed out. At 11 p.m., open interest was around 455,300 contracts; by midnight, it had only fallen to about 443,000. Now it's back to roughly 448,400—still higher than yesterday morning's roughly 440,000. The retail long ratio was around 54% yesterday morning and is now about 56%; the top-trader long account ratio has risen from around 54% to around 58%. The mechanism is simple: the waterfall wiped out price, but liquidations didn't take the contract count with them, and accounts are leaning even further long. So a rebound just means catching the falling knife again.
The 1-hour RSI is around 32. The 12-period moving average is about 1,053, the 26-period about 1,091, and the 50-period about 1,135—all three are overhead. The current price is just hugging the lower Keltner band at around 1,018; the lower Bollinger band, around 968, is further below.
At 1,029, I treat this as price having been dumped but open interest not having been flushed—catching a falling knife, not a floor. Until open interest falls below 440,000 contracts and the retail long ratio eases from 56%, any rebound will first run into resistance at the 12-period moving average at 1,053; if 993 breaks again, the next level below is 932, the September 4 candle.
$ZEC #合约数据 #Open interest
Both levels broke, but open interest wasn't fully flushed out. At 11 p.m., open interest was around 455,300 contracts; by midnight, it had only fallen to about 443,000. Now it's back to roughly 448,400—still higher than yesterday morning's roughly 440,000. The retail long ratio was around 54% yesterday morning and is now about 56%; the top-trader long account ratio has risen from around 54% to around 58%. The mechanism is simple: the waterfall wiped out price, but liquidations didn't take the contract count with them, and accounts are leaning even further long. So a rebound just means catching the falling knife again.
The 1-hour RSI is around 32. The 12-period moving average is about 1,053, the 26-period about 1,091, and the 50-period about 1,135—all three are overhead. The current price is just hugging the lower Keltner band at around 1,018; the lower Bollinger band, around 968, is further below.
At 1,029, I treat this as price having been dumped but open interest not having been flushed—catching a falling knife, not a floor. Until open interest falls below 440,000 contracts and the retail long ratio eases from 56%, any rebound will first run into resistance at the 12-period moving average at 1,053; if 993 breaks again, the next level below is 932, the September 4 candle.
$ZEC #合约数据 #Open interest
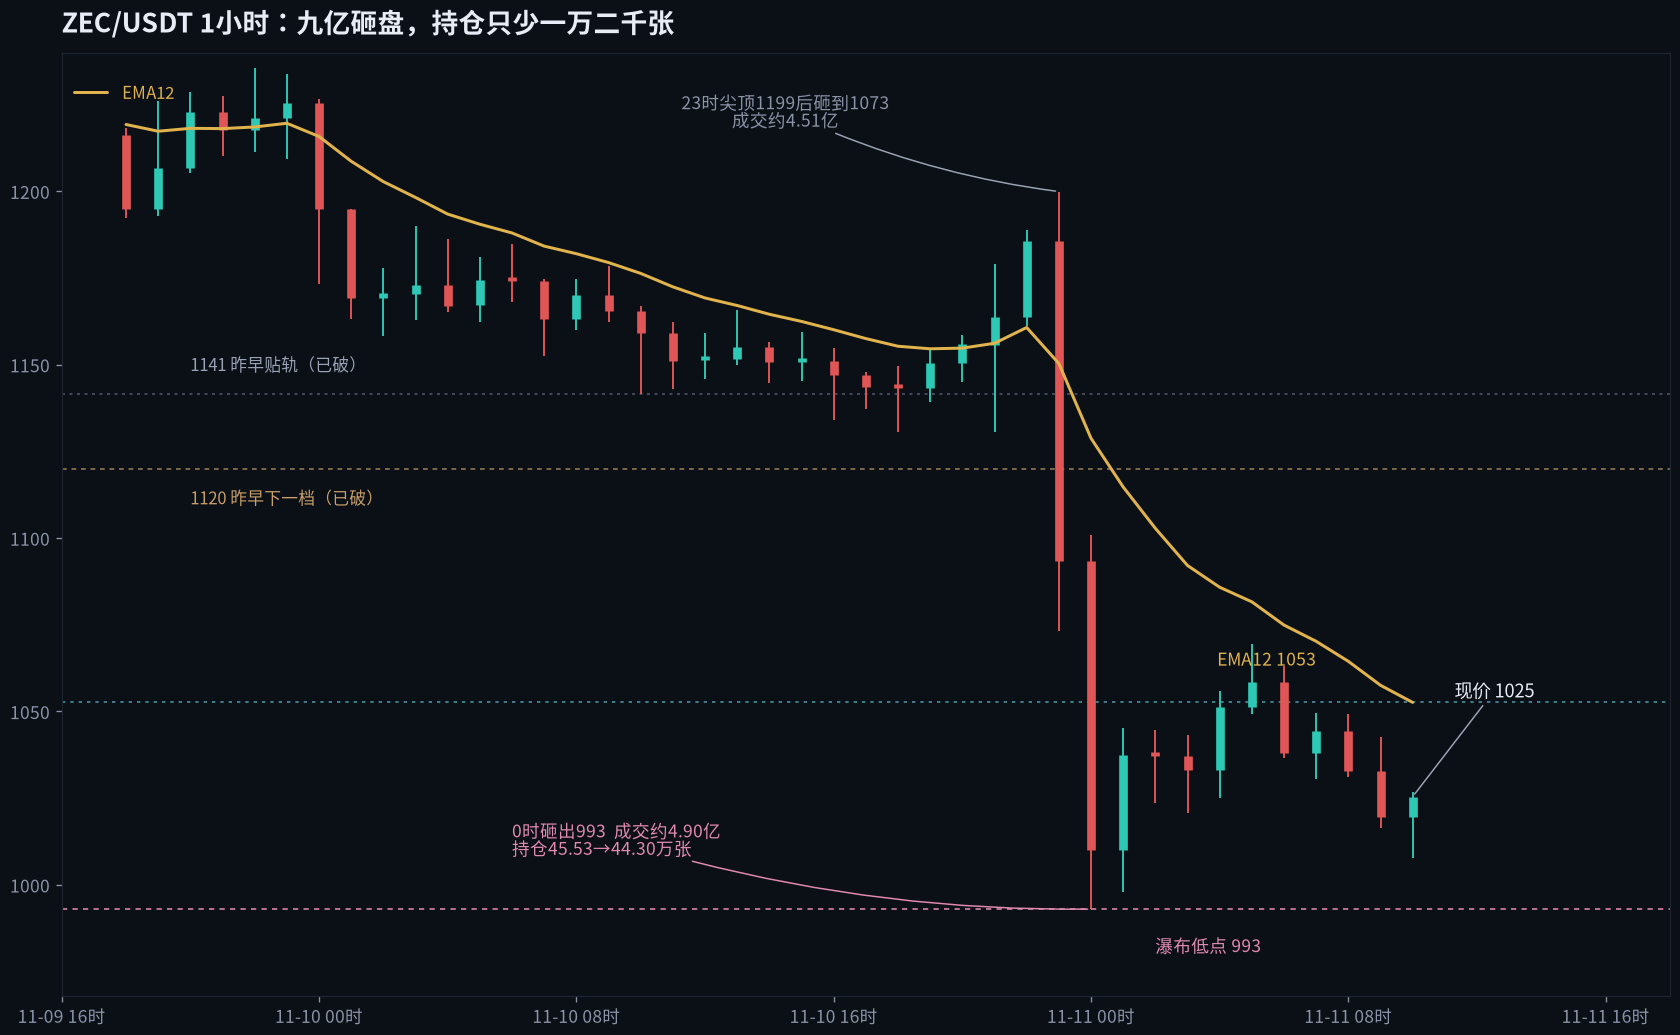
301
·
--
The rebound high only reached 2151, while whale long accounts actually climbed to 81% — $ETH is currently around 2087, down about 1.7% over the past day, with roughly $6.1 billion in contract trading volume. After a plunge from 2226 to 2050 at 5 a.m. on the 9th, I treated 2148 at the time as a post-liquidation recovery level and said the first hurdle was the 12-period moving average at 2173. Until long accounts were still stuck at 79% and open interest had swelled back to 2.35 million, this move wouldn't go far. At 3 p.m. that day, a candle with about $976 million in volume plunged to 2081; at 11 p.m., the rebound high only reached 2151, with about $707 million in volume, and it never touched 2173. At 5 p.m. today, another candle with about $707 million in volume sent the price from 2118 down to 2088; the taker buy/sell ratio was 0.77, and at 6:40 the low hit 2083.
Positioning hasn't turned around. After liquidations, open interest fell from about 2.38 million to around 2.28 million; it briefly dipped to about 2.23 million at noon today, but is still around 2.28 million now. It never returned to 2.35 million. Retail long accounts were about 79% yesterday morning and are still around 80%; whale long accounts have climbed from about 80% to around 81%. The 4 p.m. funding rate flipped from -0.008% yesterday morning to +0.003%, with the latest reading around +0.004%. The mechanics can be summed up in one sentence: leveraged positions were flushed out, but the remaining accounts are leaning even further long; the recovery can't get past the moving average, so the price can only keep grinding lower against the longs that haven't been cleared out.
On the one-hour chart, the KDJ J value is around 5; the 12-period moving average is around 2107, the 26-period around 2120, and the 50-period around 2143 — all three are pressing down on price. The current price has just slipped below the lower Bollinger Band, around 2091, with the lower Keltner Channel band at around 2081 right underfoot.
The recovery has already failed, and I don't consider 2083 a bottom that signals a reversal to bullish. Long accounts are still stuck at 80%, and open interest remains around 2.28 million. Any rebound will first run into resistance at the 12-period moving average at 2107; if 2081 breaks, the next level is the liquidation low at 2050.
$ETH #合约数据 #Open Interest
The rebound high only reached 2151, while whale long accounts actually climbed to 81% — $ETH is currently around 2087, down about 1.7% over the past day, with roughly $6.1 billion in contract trading volume. After a plunge from 2226 to 2050 at 5 a.m. on the 9th, I treated 2148 at the time as a post-liquidation recovery level and said the first hurdle was the 12-period moving average at 2173. Until long accounts were still stuck at 79% and open interest had swelled back to 2.35 million, this move wouldn't go far. At 3 p.m. that day, a candle with about $976 million in volume plunged to 2081; at 11 p.m., the rebound high only reached 2151, with about $707 million in volume, and it never touched 2173. At 5 p.m. today, another candle with about $707 million in volume sent the price from 2118 down to 2088; the taker buy/sell ratio was 0.77, and at 6:40 the low hit 2083.
Positioning hasn't turned around. After liquidations, open interest fell from about 2.38 million to around 2.28 million; it briefly dipped to about 2.23 million at noon today, but is still around 2.28 million now. It never returned to 2.35 million. Retail long accounts were about 79% yesterday morning and are still around 80%; whale long accounts have climbed from about 80% to around 81%. The 4 p.m. funding rate flipped from -0.008% yesterday morning to +0.003%, with the latest reading around +0.004%. The mechanics can be summed up in one sentence: leveraged positions were flushed out, but the remaining accounts are leaning even further long; the recovery can't get past the moving average, so the price can only keep grinding lower against the longs that haven't been cleared out.
On the one-hour chart, the KDJ J value is around 5; the 12-period moving average is around 2107, the 26-period around 2120, and the 50-period around 2143 — all three are pressing down on price. The current price has just slipped below the lower Bollinger Band, around 2091, with the lower Keltner Channel band at around 2081 right underfoot.
The recovery has already failed, and I don't consider 2083 a bottom that signals a reversal to bullish. Long accounts are still stuck at 80%, and open interest remains around 2.28 million. Any rebound will first run into resistance at the 12-period moving average at 2107; if 2081 breaks, the next level is the liquidation low at 2050.
$ETH #合约数据 #Open Interest
Positioning hasn't turned around. After liquidations, open interest fell from about 2.38 million to around 2.28 million; it briefly dipped to about 2.23 million at noon today, but is still around 2.28 million now. It never returned to 2.35 million. Retail long accounts were about 79% yesterday morning and are still around 80%; whale long accounts have climbed from about 80% to around 81%. The 4 p.m. funding rate flipped from -0.008% yesterday morning to +0.003%, with the latest reading around +0.004%. The mechanics can be summed up in one sentence: leveraged positions were flushed out, but the remaining accounts are leaning even further long; the recovery can't get past the moving average, so the price can only keep grinding lower against the longs that haven't been cleared out.
On the one-hour chart, the KDJ J value is around 5; the 12-period moving average is around 2107, the 26-period around 2120, and the 50-period around 2143 — all three are pressing down on price. The current price has just slipped below the lower Bollinger Band, around 2091, with the lower Keltner Channel band at around 2081 right underfoot.
The recovery has already failed, and I don't consider 2083 a bottom that signals a reversal to bullish. Long accounts are still stuck at 80%, and open interest remains around 2.28 million. Any rebound will first run into resistance at the 12-period moving average at 2107; if 2081 breaks, the next level is the liquidation low at 2050.
$ETH #合约数据 #Open Interest
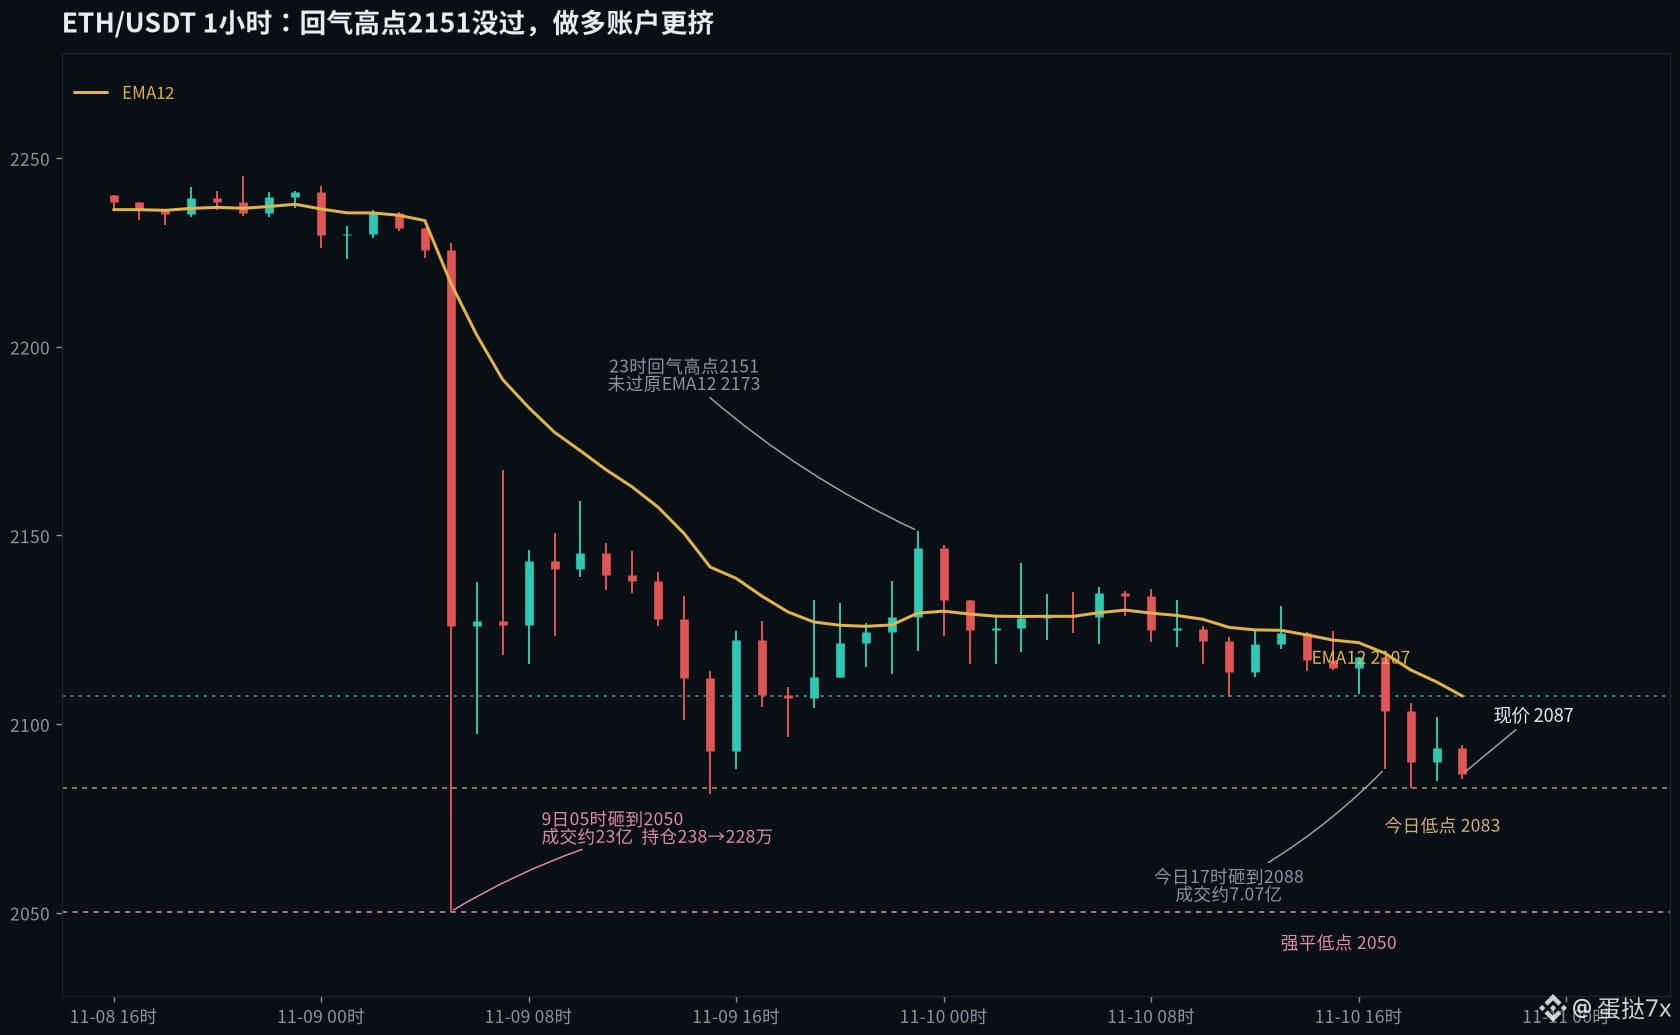
394
·
--
Price has been knocked down another 80 from 1240, but open interest has returned to the same level—$ZEC is now around 1160, down about 6.4% over the past day, with roughly $1.78 billion in contract volume. On the morning of the 8th, I treated 1240 as part of a decline that still had room to run. I said that until open interest fell back below 425,000 contracts and retail longs eased off, any rebound would run into resistance at 1259; lose 1235 again, and there would be more room below. That evening, a bounce reached 1293, breaking through the 1259 level I’d marked. But at 5 a.m. on the 9th, a candle with about $199 million in volume slammed the price from 1243 to 1177, taking out the 1235 floor. At midnight today, another candle worth about $200 million drove the price from 1225 to 1173. The taker buy/sell ratio dropped to 0.77 at 1 a.m., and the sell-off continued to 1163; the 10 a.m. hourly candle then carved out a new low of 1141. The direction was right, but I set the rebound level too shallow.
But the positioning hasn’t unwound. Open interest was around 439,000 contracts on the morning of the 8th, briefly fell to about 422,000 at 9 a.m. on the 9th, then climbed back; it’s now around 440,000. The share of retail accounts holding longs rose from about 50% to 53.8%; large traders’ long-position share climbed from about 59% to 61%; and the share of large-trader accounts holding longs rose from about 49% to 54%. This morning at 8 a.m., the funding rate was still +0.01%. The mechanism is simple: during the second leg down, shorts are closing while new longs are stepping in. Positions are changing hands, not being flushed out.
The one-hour RSI is around 34; KDJ’s K is around 25 and D around 24; the 12-period moving average is around 1176. The current price is sitting right on the lower Bollinger Band at about 1142 and the lower Keltner Channel at about 1141.
I don’t take this touch of 1141 as proof that the flush is complete. Until open interest stabilizes back below 420,000 contracts and retail longs ease off from 54%, any rebound will first run into the 12-period moving average at 1176; if 1141 breaks again, the next level to watch is 1120, where the November 3 candle sits.
$ZEC #合约数据 #OpenInterest
Price has been knocked down another 80 from 1240, but open interest has returned to the same level—$ZEC is now around 1160, down about 6.4% over the past day, with roughly $1.78 billion in contract volume. On the morning of the 8th, I treated 1240 as part of a decline that still had room to run. I said that until open interest fell back below 425,000 contracts and retail longs eased off, any rebound would run into resistance at 1259; lose 1235 again, and there would be more room below. That evening, a bounce reached 1293, breaking through the 1259 level I’d marked. But at 5 a.m. on the 9th, a candle with about $199 million in volume slammed the price from 1243 to 1177, taking out the 1235 floor. At midnight today, another candle worth about $200 million drove the price from 1225 to 1173. The taker buy/sell ratio dropped to 0.77 at 1 a.m., and the sell-off continued to 1163; the 10 a.m. hourly candle then carved out a new low of 1141. The direction was right, but I set the rebound level too shallow.
But the positioning hasn’t unwound. Open interest was around 439,000 contracts on the morning of the 8th, briefly fell to about 422,000 at 9 a.m. on the 9th, then climbed back; it’s now around 440,000. The share of retail accounts holding longs rose from about 50% to 53.8%; large traders’ long-position share climbed from about 59% to 61%; and the share of large-trader accounts holding longs rose from about 49% to 54%. This morning at 8 a.m., the funding rate was still +0.01%. The mechanism is simple: during the second leg down, shorts are closing while new longs are stepping in. Positions are changing hands, not being flushed out.
The one-hour RSI is around 34; KDJ’s K is around 25 and D around 24; the 12-period moving average is around 1176. The current price is sitting right on the lower Bollinger Band at about 1142 and the lower Keltner Channel at about 1141.
I don’t take this touch of 1141 as proof that the flush is complete. Until open interest stabilizes back below 420,000 contracts and retail longs ease off from 54%, any rebound will first run into the 12-period moving average at 1176; if 1141 breaks again, the next level to watch is 1120, where the November 3 candle sits.
$ZEC #合约数据 #OpenInterest
But the positioning hasn’t unwound. Open interest was around 439,000 contracts on the morning of the 8th, briefly fell to about 422,000 at 9 a.m. on the 9th, then climbed back; it’s now around 440,000. The share of retail accounts holding longs rose from about 50% to 53.8%; large traders’ long-position share climbed from about 59% to 61%; and the share of large-trader accounts holding longs rose from about 49% to 54%. This morning at 8 a.m., the funding rate was still +0.01%. The mechanism is simple: during the second leg down, shorts are closing while new longs are stepping in. Positions are changing hands, not being flushed out.
The one-hour RSI is around 34; KDJ’s K is around 25 and D around 24; the 12-period moving average is around 1176. The current price is sitting right on the lower Bollinger Band at about 1142 and the lower Keltner Channel at about 1141.
I don’t take this touch of 1141 as proof that the flush is complete. Until open interest stabilizes back below 420,000 contracts and retail longs ease off from 54%, any rebound will first run into the 12-period moving average at 1176; if 1141 breaks again, the next level to watch is 1120, where the November 3 candle sits.
$ZEC #合约数据 #OpenInterest
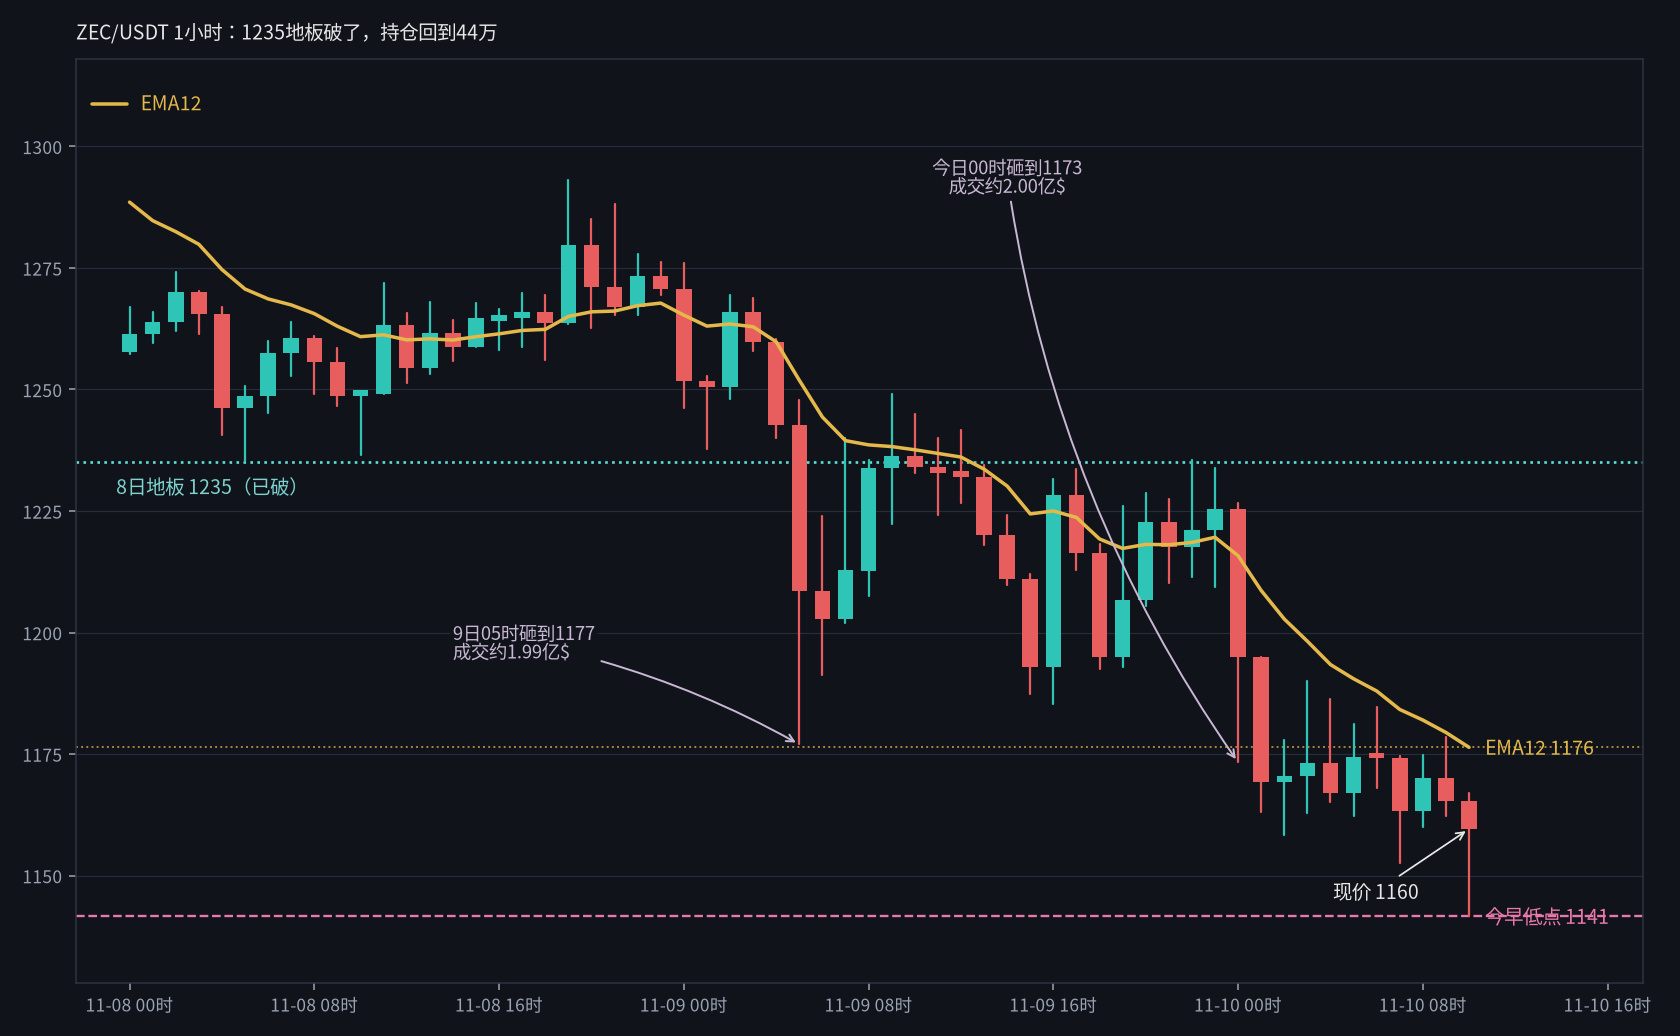
154
·
--
Both pullback levels were breached, while open interest shed only 300 million tokens—$JCT plunged from last night’s spike at 0.0149 to this morning’s low of 0.00737. It’s now around 0.0090, down about 32% over the past day, with roughly $1.92 billion in contract volume. The 9:00 candle broke below 0.0098 and closed at 0.00945; at 15:00, it dipped to 0.00737, with about $90.5 million in hourly volume. Both levels called out last night—the first pullback target at 0.0098, then 0.007—were hit. The direction was right.
The wrinkle is the fake spike and positioning. The 4:00 hourly candle reached a high of 0.0213 on about $249 million in volume, then closed at 0.0118—a wick even higher than last night’s spike, followed by a steady decline. Open interest fell from last night’s peak of about 4.80 billion tokens to around 4.47 billion now. It touched the 4.8-billion mark, but only a little over 300 million tokens were flushed out. Retail accounts’ long ratio peaked at about 34%, dropped to around 29% at 4:00, and is now gradually climbing back to about 41%; it has never returned to 50%. Large holders’ long positions stayed pinned at about 59% throughout, while the share of large-holder accounts going long rose from about 31% at the peak to around 39%. The funding rate hit +0.53% at the 8:00 settlement and was still around +0.13% at 20:00, so longs are still paying shorts handsomely. The taker buy/sell ratio hovered near 1.0 for most of the day, then fell to 0.95 at 19:00. The mechanism in a nutshell: price followed the post-short-squeeze pullback script, but leverage positions only shrank a little, while traders are still on the short side and slowly covering—anyone treating 0.009 as a floor after only a partial flush is just fueling the next leg down.
The 1-hour RSI is around 51, the 12-period moving average at about 0.00919 is hugging the current price, the Bollinger midline is around 0.0104, the lower band around 0.0063, and ATR is about 18%. Price is grinding back and forth around 0.009, right near last night’s first target. Short-term indicators aren’t signaling oversold conditions, and the positioning gauges haven’t turned around either.
With only a partial flush in the order book, I don’t consider 0.009 a new floor. Until open interest drops below 4 billion tokens and the share of accounts going long gets back above 50%, any rebound is likely to run into resistance at the 0.0104 Bollinger midline. If 0.00737 breaks again, this pullback isn’t over.
$JCT #合约数据 #Recap
Both pullback levels were breached, while open interest shed only 300 million tokens—$JCT plunged from last night’s spike at 0.0149 to this morning’s low of 0.00737. It’s now around 0.0090, down about 32% over the past day, with roughly $1.92 billion in contract volume. The 9:00 candle broke below 0.0098 and closed at 0.00945; at 15:00, it dipped to 0.00737, with about $90.5 million in hourly volume. Both levels called out last night—the first pullback target at 0.0098, then 0.007—were hit. The direction was right.
The wrinkle is the fake spike and positioning. The 4:00 hourly candle reached a high of 0.0213 on about $249 million in volume, then closed at 0.0118—a wick even higher than last night’s spike, followed by a steady decline. Open interest fell from last night’s peak of about 4.80 billion tokens to around 4.47 billion now. It touched the 4.8-billion mark, but only a little over 300 million tokens were flushed out. Retail accounts’ long ratio peaked at about 34%, dropped to around 29% at 4:00, and is now gradually climbing back to about 41%; it has never returned to 50%. Large holders’ long positions stayed pinned at about 59% throughout, while the share of large-holder accounts going long rose from about 31% at the peak to around 39%. The funding rate hit +0.53% at the 8:00 settlement and was still around +0.13% at 20:00, so longs are still paying shorts handsomely. The taker buy/sell ratio hovered near 1.0 for most of the day, then fell to 0.95 at 19:00. The mechanism in a nutshell: price followed the post-short-squeeze pullback script, but leverage positions only shrank a little, while traders are still on the short side and slowly covering—anyone treating 0.009 as a floor after only a partial flush is just fueling the next leg down.
The 1-hour RSI is around 51, the 12-period moving average at about 0.00919 is hugging the current price, the Bollinger midline is around 0.0104, the lower band around 0.0063, and ATR is about 18%. Price is grinding back and forth around 0.009, right near last night’s first target. Short-term indicators aren’t signaling oversold conditions, and the positioning gauges haven’t turned around either.
With only a partial flush in the order book, I don’t consider 0.009 a new floor. Until open interest drops below 4 billion tokens and the share of accounts going long gets back above 50%, any rebound is likely to run into resistance at the 0.0104 Bollinger midline. If 0.00737 breaks again, this pullback isn’t over.
$JCT #合约数据 #Recap
The wrinkle is the fake spike and positioning. The 4:00 hourly candle reached a high of 0.0213 on about $249 million in volume, then closed at 0.0118—a wick even higher than last night’s spike, followed by a steady decline. Open interest fell from last night’s peak of about 4.80 billion tokens to around 4.47 billion now. It touched the 4.8-billion mark, but only a little over 300 million tokens were flushed out. Retail accounts’ long ratio peaked at about 34%, dropped to around 29% at 4:00, and is now gradually climbing back to about 41%; it has never returned to 50%. Large holders’ long positions stayed pinned at about 59% throughout, while the share of large-holder accounts going long rose from about 31% at the peak to around 39%. The funding rate hit +0.53% at the 8:00 settlement and was still around +0.13% at 20:00, so longs are still paying shorts handsomely. The taker buy/sell ratio hovered near 1.0 for most of the day, then fell to 0.95 at 19:00. The mechanism in a nutshell: price followed the post-short-squeeze pullback script, but leverage positions only shrank a little, while traders are still on the short side and slowly covering—anyone treating 0.009 as a floor after only a partial flush is just fueling the next leg down.
The 1-hour RSI is around 51, the 12-period moving average at about 0.00919 is hugging the current price, the Bollinger midline is around 0.0104, the lower band around 0.0063, and ATR is about 18%. Price is grinding back and forth around 0.009, right near last night’s first target. Short-term indicators aren’t signaling oversold conditions, and the positioning gauges haven’t turned around either.
With only a partial flush in the order book, I don’t consider 0.009 a new floor. Until open interest drops below 4 billion tokens and the share of accounts going long gets back above 50%, any rebound is likely to run into resistance at the 0.0104 Bollinger midline. If 0.00737 breaks again, this pullback isn’t over.
$JCT #合约数据 #Recap
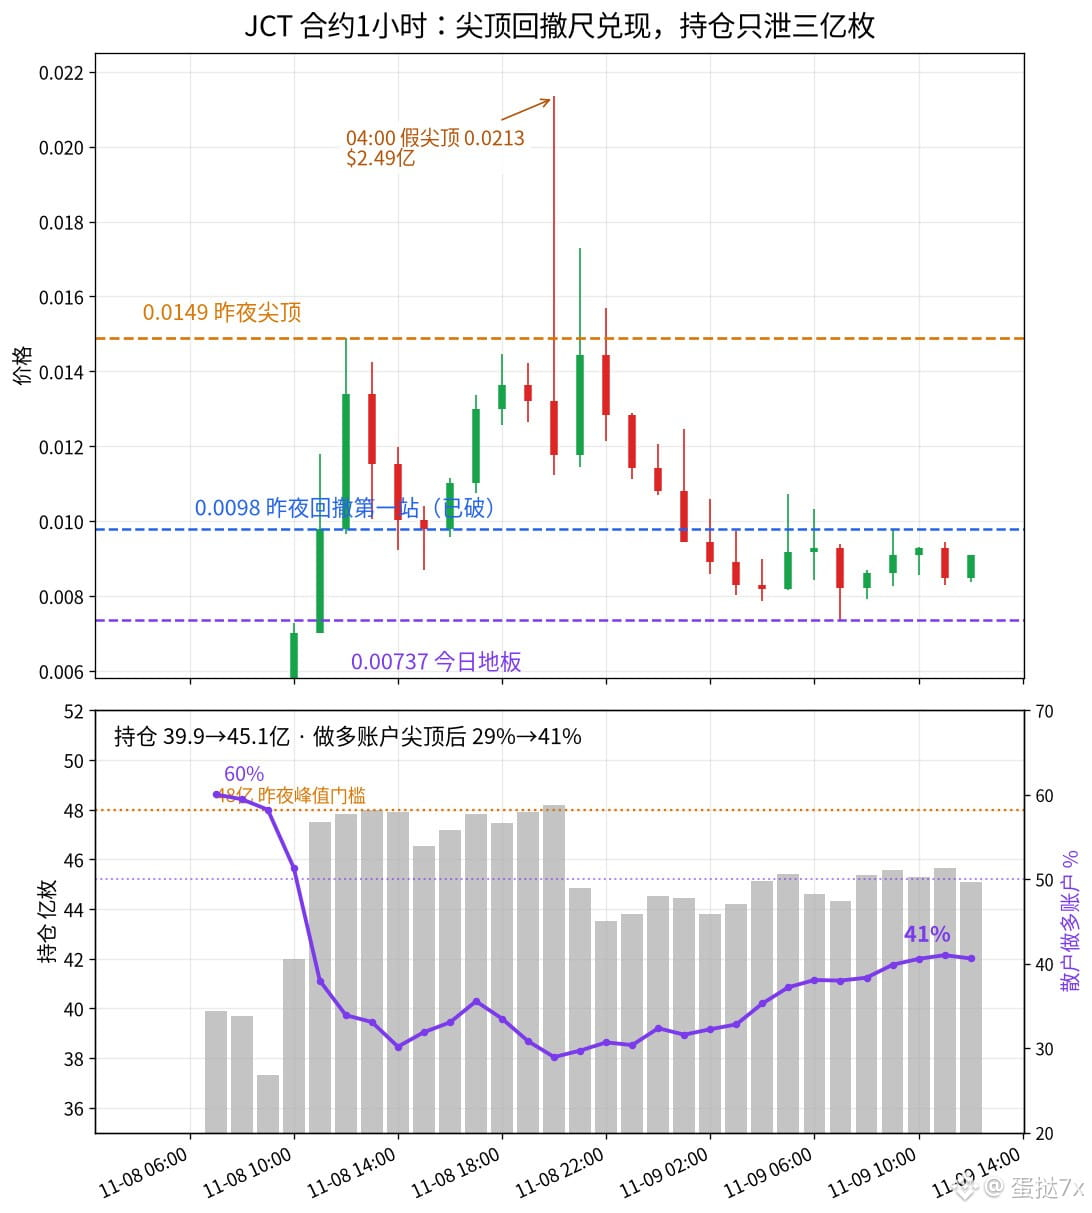
25
·
--
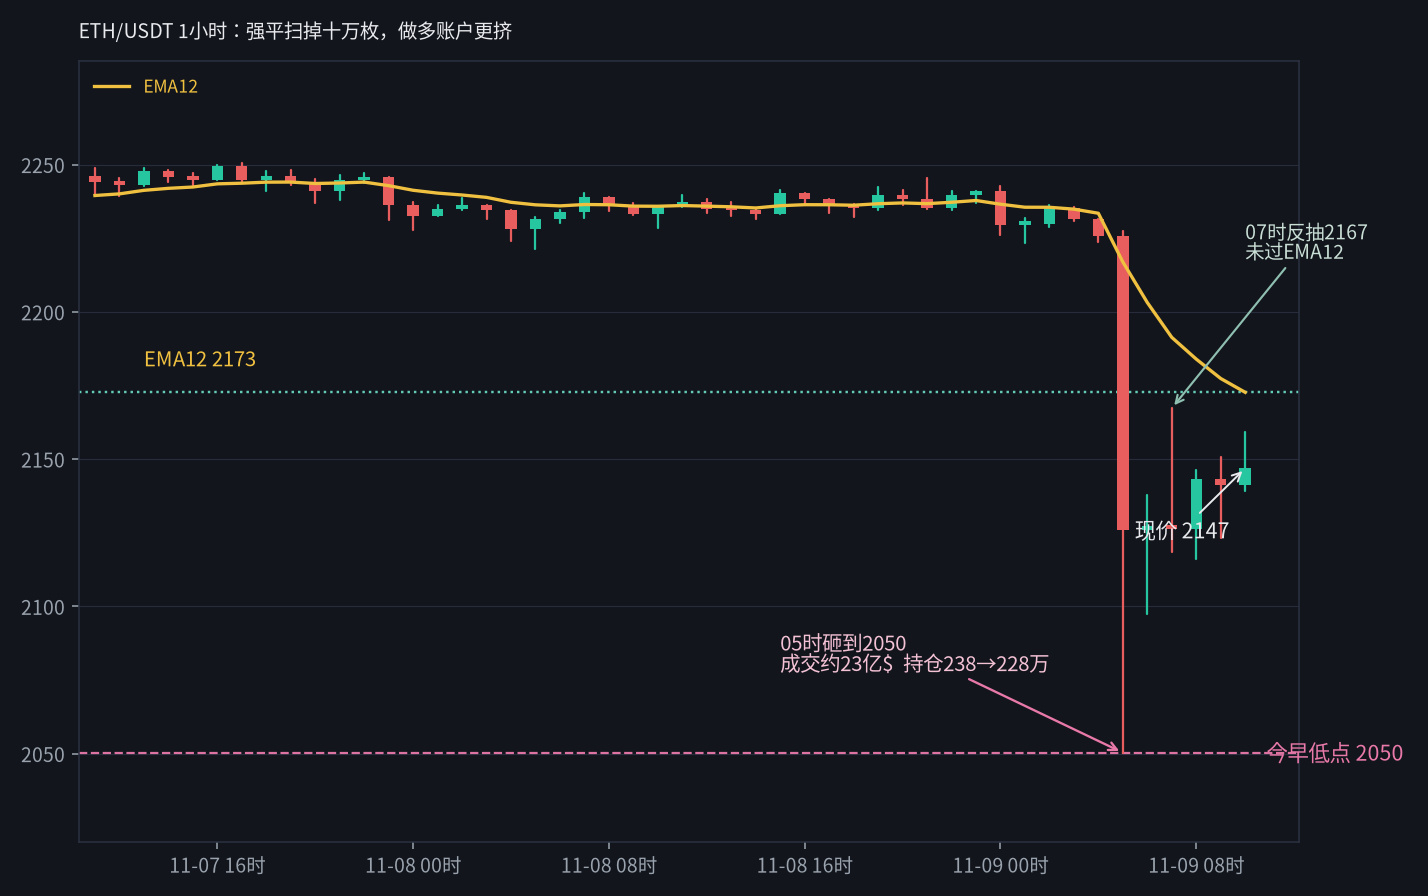
Liquidations wiped out 100,000 ETH, but long accounts are even more crowded—$ETH plunged from 2,226 to 2,050 at 5 a.m. Hourly trading volume was about $2.3 billion, while open interest fell from roughly 2.38 million ETH to 2.28 million. The current price is around 2,148, down about 3.7% over the past day, with roughly $7 billion in futures trading volume. Last night, it was hovering around 2,240, with a high of 2,245. The amount wiped out hasn’t been recovered in the five hours since; open interest is still around 2.28 million ETH.
The 6 a.m. and 7 a.m. hourly candles saw another roughly $2.1 billion in volume. The rebound reached 2,167 before pulling back to the current level. But account ratios moved in the opposite direction. Retail long accounts fell to about 78% after the plunge and are now around 79%; large-trader long accounts rose from about 78% to around 81%. At 8 a.m., the funding rate flipped to -0.008%; the latest reading is around -0.007%. The mechanics are simple: liquidations wipe out leveraged positions, while the accounts left behind and new entrants crowd further to the long side. The rebound is a breather after forced selling eases.
The one-hour RSI is around 27, the 12-period moving average is around 2,173, and the Keltner lower band is around 2,143. The current price is hugging the lower band on its way back up, and the high of 2,167 on the 7 a.m. candle didn’t clear the moving average. The RSI shows short-term oversold conditions, but long accounts haven’t backed off.
Position size is down, but accounts are more crowded. I’m treating 2,148 as a breather after the liquidations, not the start of a trend reversal. The first hurdle for the rebound is the 12-period moving average at 2,173. As long accounts remain pinned at 79% and open interest hasn’t swollen back to 2.35 million, this move probably won’t get far. If the rebound can’t even clear this moving average, there’s even less reason to expect a move higher. If 2,050 breaks again, there’s more room to fall.
$ETH #合约数据 #OpenInterest
Liquidations wiped out 100,000 ETH, but long accounts are even more crowded—$ETH plunged from 2,226 to 2,050 at 5 a.m. Hourly trading volume was about $2.3 billion, while open interest fell from roughly 2.38 million ETH to 2.28 million. The current price is around 2,148, down about 3.7% over the past day, with roughly $7 billion in futures trading volume. Last night, it was hovering around 2,240, with a high of 2,245. The amount wiped out hasn’t been recovered in the five hours since; open interest is still around 2.28 million ETH.
The 6 a.m. and 7 a.m. hourly candles saw another roughly $2.1 billion in volume. The rebound reached 2,167 before pulling back to the current level. But account ratios moved in the opposite direction. Retail long accounts fell to about 78% after the plunge and are now around 79%; large-trader long accounts rose from about 78% to around 81%. At 8 a.m., the funding rate flipped to -0.008%; the latest reading is around -0.007%. The mechanics are simple: liquidations wipe out leveraged positions, while the accounts left behind and new entrants crowd further to the long side. The rebound is a breather after forced selling eases.
The one-hour RSI is around 27, the 12-period moving average is around 2,173, and the Keltner lower band is around 2,143. The current price is hugging the lower band on its way back up, and the high of 2,167 on the 7 a.m. candle didn’t clear the moving average. The RSI shows short-term oversold conditions, but long accounts haven’t backed off.
Position size is down, but accounts are more crowded. I’m treating 2,148 as a breather after the liquidations, not the start of a trend reversal. The first hurdle for the rebound is the 12-period moving average at 2,173. As long accounts remain pinned at 79% and open interest hasn’t swollen back to 2.35 million, this move probably won’t get far. If the rebound can’t even clear this moving average, there’s even less reason to expect a move higher. If 2,050 breaks again, there’s more room to fall.
$ETH #合约数据 #OpenInterest
The 6 a.m. and 7 a.m. hourly candles saw another roughly $2.1 billion in volume. The rebound reached 2,167 before pulling back to the current level. But account ratios moved in the opposite direction. Retail long accounts fell to about 78% after the plunge and are now around 79%; large-trader long accounts rose from about 78% to around 81%. At 8 a.m., the funding rate flipped to -0.008%; the latest reading is around -0.007%. The mechanics are simple: liquidations wipe out leveraged positions, while the accounts left behind and new entrants crowd further to the long side. The rebound is a breather after forced selling eases.
The one-hour RSI is around 27, the 12-period moving average is around 2,173, and the Keltner lower band is around 2,143. The current price is hugging the lower band on its way back up, and the high of 2,167 on the 7 a.m. candle didn’t clear the moving average. The RSI shows short-term oversold conditions, but long accounts haven’t backed off.
Position size is down, but accounts are more crowded. I’m treating 2,148 as a breather after the liquidations, not the start of a trend reversal. The first hurdle for the rebound is the 12-period moving average at 2,173. As long accounts remain pinned at 79% and open interest hasn’t swollen back to 2.35 million, this move probably won’t get far. If the rebound can’t even clear this moving average, there’s even less reason to expect a move higher. If 2,050 breaks again, there’s more room to fall.
$ETH #合约数据 #OpenInterest
224
·
--
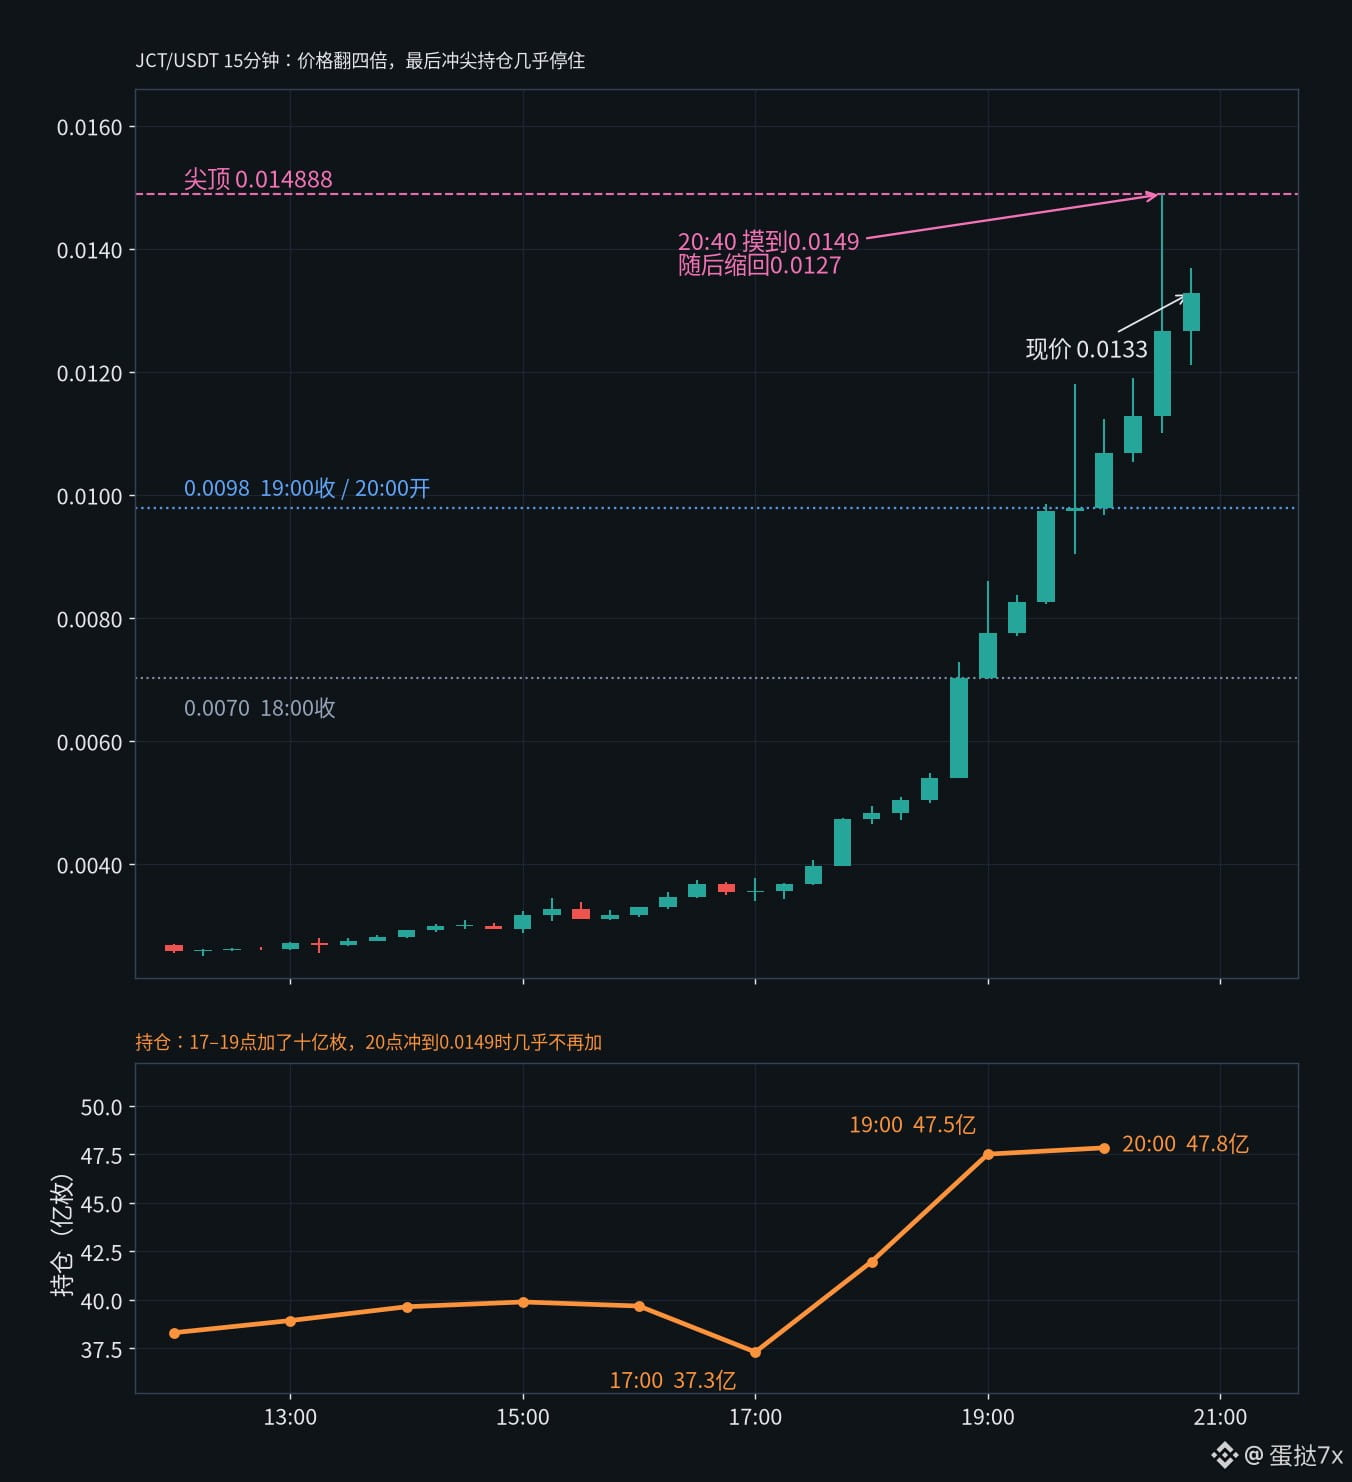
Up fourfold, but positions didn’t follow the final spike—$JCT rallied from its 12:00 low of 0.002512 to a peak of 0.014888, and is now around 0.0133, up about 401% over the past day, with roughly $647 million in contract volume. The 17:00 candle closed at 0.004728, up from 0.00354, on about $40 million in volume; at 18:00 it shot up to 0.007021 on about $89.4 million; at 19:00, a candle with about $206 million in volume reached a high of 0.011798 and closed at 0.009794. It kept climbing at 20:00. The five-minute candle at 20:40 touched 0.014888 on about $39.2 million in volume, then pulled back to around 0.0127.
Positions don’t line up with that final move. Open interest was about 3.73 billion tokens at 17:00, rose to about 4.75 billion at 19:00, reached only about 4.78 billion at 20:00, and is now around 4.77 billion—there was almost no new positioning during that final push to 0.0149. The share of retail accounts long fell from about 62.8% last night to around 33.9% now; the share of large accounts long fell from about 66.1% in the afternoon to around 30.9%, while large-trader long positions remain pinned at about 55.9%. The funding rate hit +0.354% at the 20:00 settlement; the latest rate is about +0.486%. The mechanics in a nutshell: from 17:00 to 19:00, new shorts were piling in as the price was squeezed; the spike at 20:00 was shorts already in the market getting squeezed out, not new longs building a staircase.
The one-hour RSI is about 95.5, the KDJ J value is about 96, and the 12-period moving average is still around 0.00607—just over half the current price.
It touched 0.0149 at 20:40 and then pulled back to 0.0127. For now, I’m treating the move near 0.013 as a spike after the short squeeze, not a new step up. Retail longs haven’t recovered to 50%, and open interest is still below 4.8 billion. The first pullback level is 0.0098; if this candle also gives up 0.0097, the next level down is 0.007, where the 18:00 candle closed.
$JCT #合约数据 #Open interest
Up fourfold, but positions didn’t follow the final spike—$JCT rallied from its 12:00 low of 0.002512 to a peak of 0.014888, and is now around 0.0133, up about 401% over the past day, with roughly $647 million in contract volume. The 17:00 candle closed at 0.004728, up from 0.00354, on about $40 million in volume; at 18:00 it shot up to 0.007021 on about $89.4 million; at 19:00, a candle with about $206 million in volume reached a high of 0.011798 and closed at 0.009794. It kept climbing at 20:00. The five-minute candle at 20:40 touched 0.014888 on about $39.2 million in volume, then pulled back to around 0.0127.
Positions don’t line up with that final move. Open interest was about 3.73 billion tokens at 17:00, rose to about 4.75 billion at 19:00, reached only about 4.78 billion at 20:00, and is now around 4.77 billion—there was almost no new positioning during that final push to 0.0149. The share of retail accounts long fell from about 62.8% last night to around 33.9% now; the share of large accounts long fell from about 66.1% in the afternoon to around 30.9%, while large-trader long positions remain pinned at about 55.9%. The funding rate hit +0.354% at the 20:00 settlement; the latest rate is about +0.486%. The mechanics in a nutshell: from 17:00 to 19:00, new shorts were piling in as the price was squeezed; the spike at 20:00 was shorts already in the market getting squeezed out, not new longs building a staircase.
The one-hour RSI is about 95.5, the KDJ J value is about 96, and the 12-period moving average is still around 0.00607—just over half the current price.
It touched 0.0149 at 20:40 and then pulled back to 0.0127. For now, I’m treating the move near 0.013 as a spike after the short squeeze, not a new step up. Retail longs haven’t recovered to 50%, and open interest is still below 4.8 billion. The first pullback level is 0.0098; if this candle also gives up 0.0097, the next level down is 0.007, where the 18:00 candle closed.
$JCT #合约数据 #Open interest
Positions don’t line up with that final move. Open interest was about 3.73 billion tokens at 17:00, rose to about 4.75 billion at 19:00, reached only about 4.78 billion at 20:00, and is now around 4.77 billion—there was almost no new positioning during that final push to 0.0149. The share of retail accounts long fell from about 62.8% last night to around 33.9% now; the share of large accounts long fell from about 66.1% in the afternoon to around 30.9%, while large-trader long positions remain pinned at about 55.9%. The funding rate hit +0.354% at the 20:00 settlement; the latest rate is about +0.486%. The mechanics in a nutshell: from 17:00 to 19:00, new shorts were piling in as the price was squeezed; the spike at 20:00 was shorts already in the market getting squeezed out, not new longs building a staircase.
The one-hour RSI is about 95.5, the KDJ J value is about 96, and the 12-period moving average is still around 0.00607—just over half the current price.
It touched 0.0149 at 20:40 and then pulled back to 0.0127. For now, I’m treating the move near 0.013 as a spike after the short squeeze, not a new step up. Retail longs haven’t recovered to 50%, and open interest is still below 4.8 billion. The first pullback level is 0.0098; if this candle also gives up 0.0097, the next level down is 0.007, where the 18:00 candle closed.
$JCT #合约数据 #Open interest
586
·
--
Price shed 110, while open interest barely budged overnight — $ZEC plunged from around 1355 yesterday morning to a low of 1235 this morning, and is now around 1240, down about 8.3% over the past day, with roughly $1.35 billion in futures volume. Yesterday morning, I treated 1355 as a pullback after a short squeeze, not as a new base for longs. I said that if it lost the 12-period moving average at 1336, I’d look back to the Keltner midline at 1327. The 11:00 candle closed at 1328 after opening at 1347, with a low of 1319; at 12:00, it closed at 1316. Both levels were broken, and price never reclaimed 1327 afterward: at 18:00, a candle with about $124 million in volume plunged to 1284, then at 23:00 it sank to a new low of 1250 on about $133 million in volume; at 04:00, it fell from 1266 to 1241, and at 05:00 it touched a new floor at 1235. The direction was right, but 1327 was too shallow as a level to watch.
But positions haven’t been cleared out. Open interest was around 438,000 contracts yesterday morning, hit a low of about 428,000 at 19:00, then swelled back to around 445,000 at midnight; it’s now about 439,000. Open interest in dollar terms fell from around $591 million to about $548 million — what declined was the price, not the contract count. The share of retail accounts net long rose from around 40% to about 50.8% in the early morning, and is still around 49.8% now: those who were crowded on the short side yesterday morning flipped around and caught the falling knife all the way down. Whales’ long share of positions has stayed pinned around 59%, while the share of whale accounts net long rose from about 40% to around 49%. At 04:00, the taker buy/sell ratio fell to 0.67, showing heavier selling; but when the rebound at 02:00 touched 1274, the ratio reached 1.53, meaning dip buyers were stepping in too. The funding rate hit +0.019% at midnight, above its usual level of around +0.01%. The mechanics in a nutshell: during this slow bleed, shorts are closing and new longs are entering; positions are changing hands, not being flushed out.
The 1-hour RSI is around 33. The 12-period moving average is around 1259, the 26-period around 1276, and the 50-period around 1285; all three are stacked overhead. The lower Keltner Channel is around 1245, with the current price just below it, while the lower Bollinger Band is still some distance below at around 1223.
I’m treating 1240 as the middle of an ongoing slow bleed, not a floor. Until open interest falls back below 425,000 contracts and retail longs ease off a bit, any rebound runs into the 12-period moving average at 1259. If it loses this morning’s floor at 1235, there’s more room to fall. These are my personal views.
$ZEC #合约数据 #OpenInterest
Price shed 110, while open interest barely budged overnight — $ZEC plunged from around 1355 yesterday morning to a low of 1235 this morning, and is now around 1240, down about 8.3% over the past day, with roughly $1.35 billion in futures volume. Yesterday morning, I treated 1355 as a pullback after a short squeeze, not as a new base for longs. I said that if it lost the 12-period moving average at 1336, I’d look back to the Keltner midline at 1327. The 11:00 candle closed at 1328 after opening at 1347, with a low of 1319; at 12:00, it closed at 1316. Both levels were broken, and price never reclaimed 1327 afterward: at 18:00, a candle with about $124 million in volume plunged to 1284, then at 23:00 it sank to a new low of 1250 on about $133 million in volume; at 04:00, it fell from 1266 to 1241, and at 05:00 it touched a new floor at 1235. The direction was right, but 1327 was too shallow as a level to watch.
But positions haven’t been cleared out. Open interest was around 438,000 contracts yesterday morning, hit a low of about 428,000 at 19:00, then swelled back to around 445,000 at midnight; it’s now about 439,000. Open interest in dollar terms fell from around $591 million to about $548 million — what declined was the price, not the contract count. The share of retail accounts net long rose from around 40% to about 50.8% in the early morning, and is still around 49.8% now: those who were crowded on the short side yesterday morning flipped around and caught the falling knife all the way down. Whales’ long share of positions has stayed pinned around 59%, while the share of whale accounts net long rose from about 40% to around 49%. At 04:00, the taker buy/sell ratio fell to 0.67, showing heavier selling; but when the rebound at 02:00 touched 1274, the ratio reached 1.53, meaning dip buyers were stepping in too. The funding rate hit +0.019% at midnight, above its usual level of around +0.01%. The mechanics in a nutshell: during this slow bleed, shorts are closing and new longs are entering; positions are changing hands, not being flushed out.
The 1-hour RSI is around 33. The 12-period moving average is around 1259, the 26-period around 1276, and the 50-period around 1285; all three are stacked overhead. The lower Keltner Channel is around 1245, with the current price just below it, while the lower Bollinger Band is still some distance below at around 1223.
I’m treating 1240 as the middle of an ongoing slow bleed, not a floor. Until open interest falls back below 425,000 contracts and retail longs ease off a bit, any rebound runs into the 12-period moving average at 1259. If it loses this morning’s floor at 1235, there’s more room to fall. These are my personal views.
$ZEC #合约数据 #OpenInterest
But positions haven’t been cleared out. Open interest was around 438,000 contracts yesterday morning, hit a low of about 428,000 at 19:00, then swelled back to around 445,000 at midnight; it’s now about 439,000. Open interest in dollar terms fell from around $591 million to about $548 million — what declined was the price, not the contract count. The share of retail accounts net long rose from around 40% to about 50.8% in the early morning, and is still around 49.8% now: those who were crowded on the short side yesterday morning flipped around and caught the falling knife all the way down. Whales’ long share of positions has stayed pinned around 59%, while the share of whale accounts net long rose from about 40% to around 49%. At 04:00, the taker buy/sell ratio fell to 0.67, showing heavier selling; but when the rebound at 02:00 touched 1274, the ratio reached 1.53, meaning dip buyers were stepping in too. The funding rate hit +0.019% at midnight, above its usual level of around +0.01%. The mechanics in a nutshell: during this slow bleed, shorts are closing and new longs are entering; positions are changing hands, not being flushed out.
The 1-hour RSI is around 33. The 12-period moving average is around 1259, the 26-period around 1276, and the 50-period around 1285; all three are stacked overhead. The lower Keltner Channel is around 1245, with the current price just below it, while the lower Bollinger Band is still some distance below at around 1223.
I’m treating 1240 as the middle of an ongoing slow bleed, not a floor. Until open interest falls back below 425,000 contracts and retail longs ease off a bit, any rebound runs into the 12-period moving average at 1259. If it loses this morning’s floor at 1235, there’s more room to fall. These are my personal views.
$ZEC #合约数据 #OpenInterest
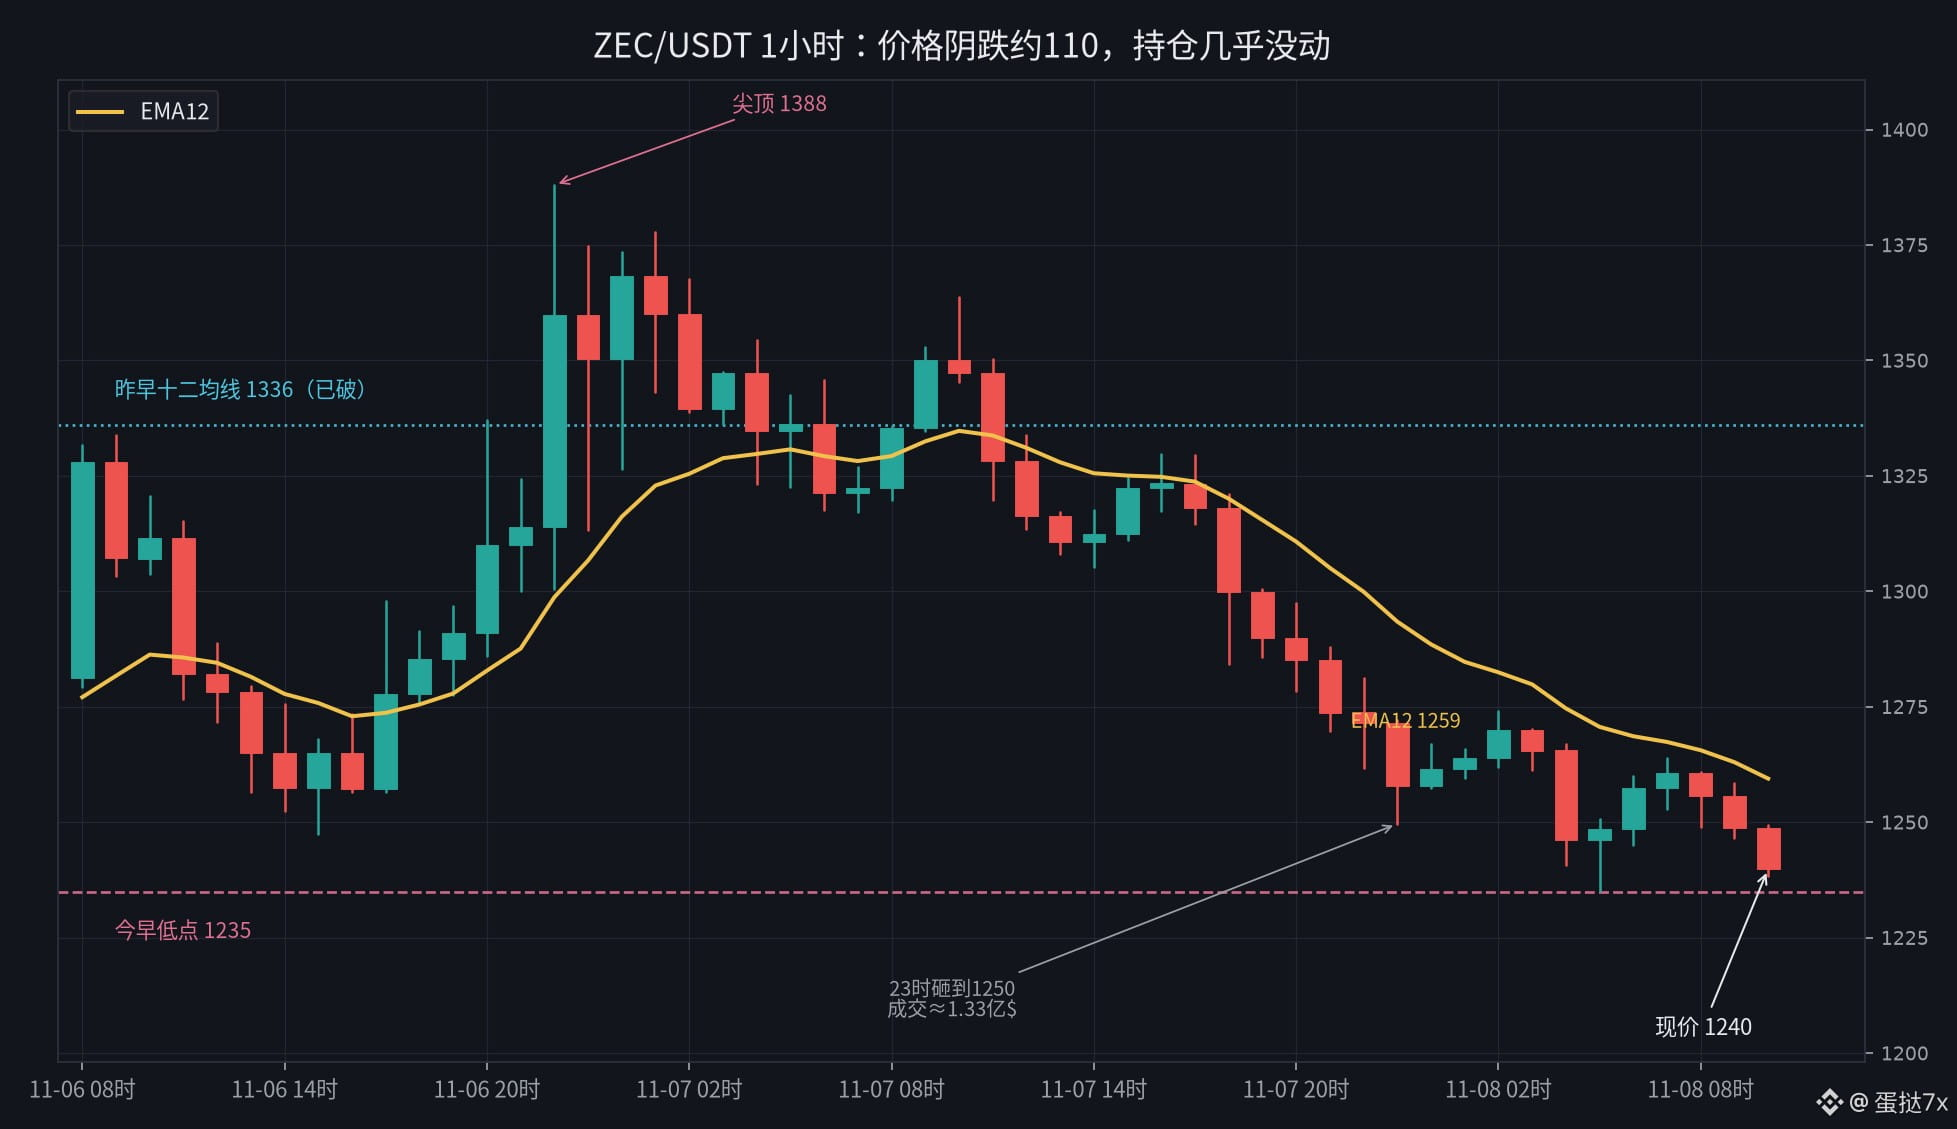
480
·
--
The 64-million-dollar bearish candle that slammed the price to 1.1509 at 11:00 barely shook open interest—$XRP futures open interest has only slipped from a peak of about 335 million contracts yesterday morning to around 335 million now. The current price is about 1.159, down roughly 3.0% over the past day, with futures volume at about 690 million dollars. At 10:00, price plunged from 1.178 to 1.162 on about 45 million in volume; at 11:00, it tested the daily low again. In the afternoon, it bounced to a high of 1.1817 at 16:00, then fell back from 1.173 to 1.159 at 20:00 on a single candle worth about 19 million dollars, wiping out most of the rebound.
Positioning is stubborn. The share of retail accounts long rose to about 77% at yesterday morning’s peak and eased only to around 73.8% during the sell-off—after a day and a half, it’s still stuck near 74%. Whales’ long positions are about 68%, and whale accounts are about 76% long; both remain tilted to the long side. The latest funding rate is about +0.01%, so longs are still paying shorts a small amount. After the 11:00 plunge, open interest actually swelled from about 334 million back to around 339 million by 13:00, with positions added again during the rebound. The mechanism is simple: prices are grinding lower, but traders aren’t letting go of their positions, and dip-buyers are still sitting on the floor trying to catch the falling knife.
The one-hour RSI is about 34; the 12-period moving average is around 1.170, the 26-period moving average around 1.180, and the lower Keltner band at about 1.159 is right alongside the current price. The lower Bollinger Band is around 1.156, and the KDJ J value is about 45. The moving averages are bearishly aligned; price is grinding along the lower Keltner band. The short-term market is oversold, but positioning measures haven’t eased.
For now, I’m treating the action around 1.159 as a weekend drift lower with the dip-buying not yet finished—not as a capitulation flush marking a bottom. Until retail longs ease back to 65% and open interest falls below 320 million contracts, any rebound is likely to run into resistance at the 12-period moving average around 1.170. If the daily low of 1.1509 breaks, look for a deeper decline.
$XRP #合约数据 #OpenInterest
The 64-million-dollar bearish candle that slammed the price to 1.1509 at 11:00 barely shook open interest—$XRP futures open interest has only slipped from a peak of about 335 million contracts yesterday morning to around 335 million now. The current price is about 1.159, down roughly 3.0% over the past day, with futures volume at about 690 million dollars. At 10:00, price plunged from 1.178 to 1.162 on about 45 million in volume; at 11:00, it tested the daily low again. In the afternoon, it bounced to a high of 1.1817 at 16:00, then fell back from 1.173 to 1.159 at 20:00 on a single candle worth about 19 million dollars, wiping out most of the rebound.
Positioning is stubborn. The share of retail accounts long rose to about 77% at yesterday morning’s peak and eased only to around 73.8% during the sell-off—after a day and a half, it’s still stuck near 74%. Whales’ long positions are about 68%, and whale accounts are about 76% long; both remain tilted to the long side. The latest funding rate is about +0.01%, so longs are still paying shorts a small amount. After the 11:00 plunge, open interest actually swelled from about 334 million back to around 339 million by 13:00, with positions added again during the rebound. The mechanism is simple: prices are grinding lower, but traders aren’t letting go of their positions, and dip-buyers are still sitting on the floor trying to catch the falling knife.
The one-hour RSI is about 34; the 12-period moving average is around 1.170, the 26-period moving average around 1.180, and the lower Keltner band at about 1.159 is right alongside the current price. The lower Bollinger Band is around 1.156, and the KDJ J value is about 45. The moving averages are bearishly aligned; price is grinding along the lower Keltner band. The short-term market is oversold, but positioning measures haven’t eased.
For now, I’m treating the action around 1.159 as a weekend drift lower with the dip-buying not yet finished—not as a capitulation flush marking a bottom. Until retail longs ease back to 65% and open interest falls below 320 million contracts, any rebound is likely to run into resistance at the 12-period moving average around 1.170. If the daily low of 1.1509 breaks, look for a deeper decline.
$XRP #合约数据 #OpenInterest
Positioning is stubborn. The share of retail accounts long rose to about 77% at yesterday morning’s peak and eased only to around 73.8% during the sell-off—after a day and a half, it’s still stuck near 74%. Whales’ long positions are about 68%, and whale accounts are about 76% long; both remain tilted to the long side. The latest funding rate is about +0.01%, so longs are still paying shorts a small amount. After the 11:00 plunge, open interest actually swelled from about 334 million back to around 339 million by 13:00, with positions added again during the rebound. The mechanism is simple: prices are grinding lower, but traders aren’t letting go of their positions, and dip-buyers are still sitting on the floor trying to catch the falling knife.
The one-hour RSI is about 34; the 12-period moving average is around 1.170, the 26-period moving average around 1.180, and the lower Keltner band at about 1.159 is right alongside the current price. The lower Bollinger Band is around 1.156, and the KDJ J value is about 45. The moving averages are bearishly aligned; price is grinding along the lower Keltner band. The short-term market is oversold, but positioning measures haven’t eased.
For now, I’m treating the action around 1.159 as a weekend drift lower with the dip-buying not yet finished—not as a capitulation flush marking a bottom. Until retail longs ease back to 65% and open interest falls below 320 million contracts, any rebound is likely to run into resistance at the 12-period moving average around 1.170. If the daily low of 1.1509 breaks, look for a deeper decline.
$XRP #合约数据 #OpenInterest
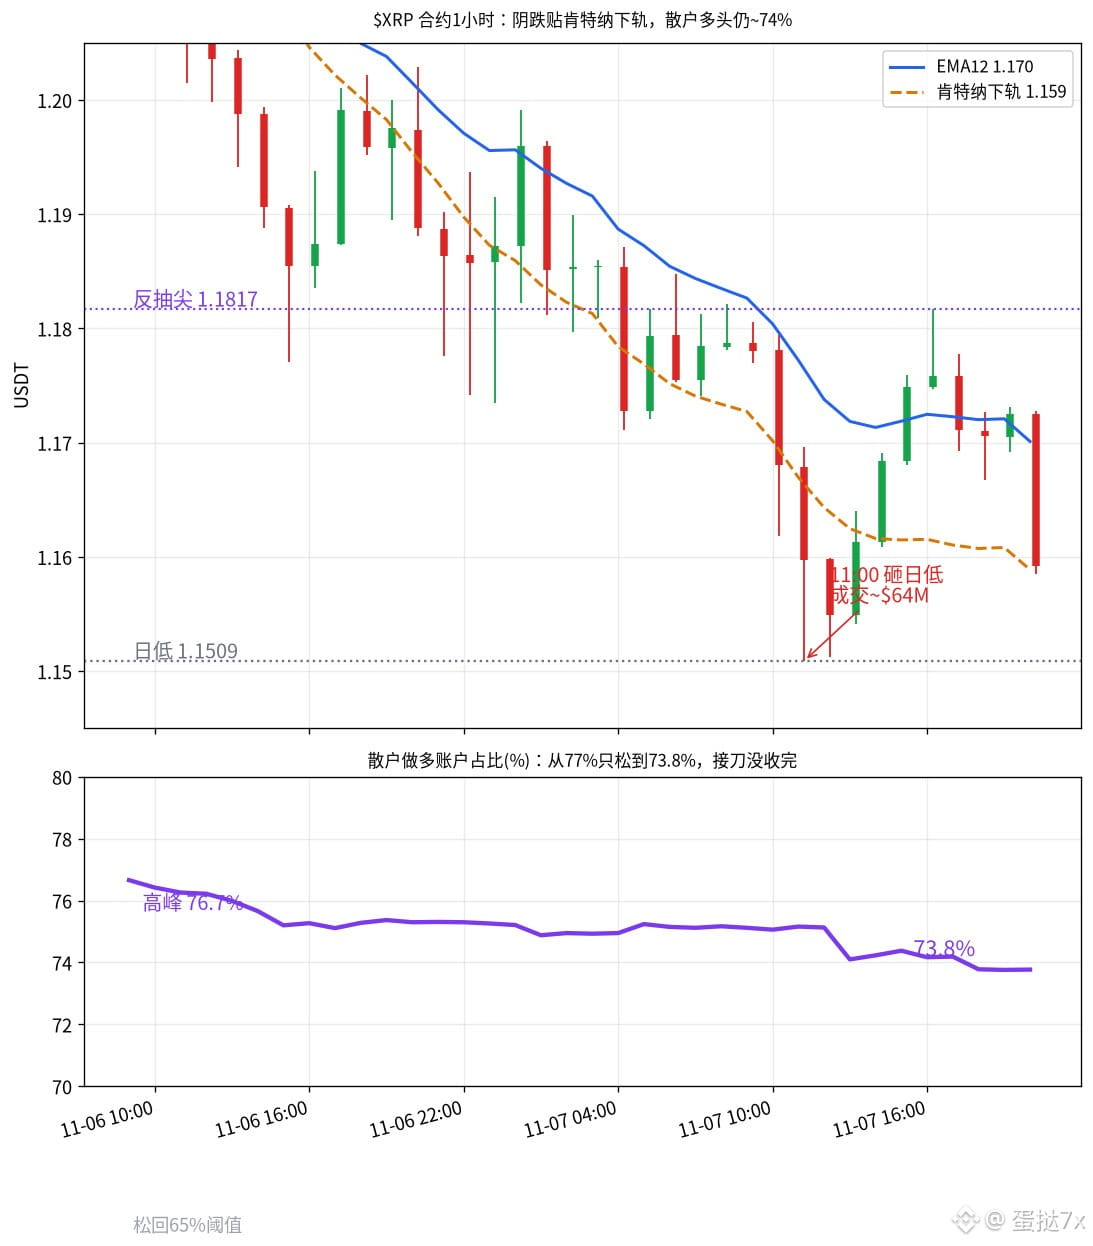
1
858
·
--
When the retail long-account ratio fell to 38%, $ZEC shot straight up to 1,388—the 22:00 hourly candle climbed from 1,314 to a peak of 1,388, with about $351 million in volume. At 23:00, it plunged from 1,360 back to 1,313 before recovering, with about $300 million in volume. The current price is around 1,355, up about 3.2% over the past day, with roughly $2.34 billion in futures volume. Open interest rose from about 437,000 contracts at 21:00 to a peak of about 453,000 at 23:00, then dropped back to about 441,000 at midnight and is now around 438,000—the new positions added during that spike didn't hold.
The key is the positioning structure. The retail long-account ratio slid from about 43.9% at 20:00 to about 38.6% at 23:00. Even as the short squeeze unfolded, traders crowded further onto the short side; the ratio is still pinned around 40%. Yet large traders' long positions remain at about 58%, while long accounts among large traders are around 40%—the two measures point in opposite directions. Funding stayed capped at the settlement limit of +0.01% all day, with longs continuously paying shorts a small amount. The taker buy/sell ratio only reached 1.04 on the 22:00 squeeze candle, which looks more like short covering than retail chasing longs; by 2:00 a.m., it had fallen to 0.76. The mechanism in a nutshell: traders are positioned short while the price is rising. This leg was driven by short covering, not by a buildup of new longs.
The 1-hour RSI is around 60; the 12-period moving average is about 1,336, the 26-period moving average about 1,321, and the Keltner Channel's upper band is around 1,370 with its middle band around 1,327. The Bollinger upper band at about 1,389 sits right at the peak, and the KDJ J value is around 60. The price is consolidating above the 12-period moving average; after pulling back from the peak, it hasn't broken out to a new high.
I interpret this move around 1,355 as a pullback after crowded shorts were squeezed, not as a new long base. Until open interest expands back above 450,000 contracts and the retail long-account ratio climbs back to 50%, the upside is capped first by the 1,388 peak. If it loses the 1,336 12-period moving average, watch the Keltner middle band at 1,327.
$ZEC #合约数据 #Open Interest
When the retail long-account ratio fell to 38%, $ZEC shot straight up to 1,388—the 22:00 hourly candle climbed from 1,314 to a peak of 1,388, with about $351 million in volume. At 23:00, it plunged from 1,360 back to 1,313 before recovering, with about $300 million in volume. The current price is around 1,355, up about 3.2% over the past day, with roughly $2.34 billion in futures volume. Open interest rose from about 437,000 contracts at 21:00 to a peak of about 453,000 at 23:00, then dropped back to about 441,000 at midnight and is now around 438,000—the new positions added during that spike didn't hold.
The key is the positioning structure. The retail long-account ratio slid from about 43.9% at 20:00 to about 38.6% at 23:00. Even as the short squeeze unfolded, traders crowded further onto the short side; the ratio is still pinned around 40%. Yet large traders' long positions remain at about 58%, while long accounts among large traders are around 40%—the two measures point in opposite directions. Funding stayed capped at the settlement limit of +0.01% all day, with longs continuously paying shorts a small amount. The taker buy/sell ratio only reached 1.04 on the 22:00 squeeze candle, which looks more like short covering than retail chasing longs; by 2:00 a.m., it had fallen to 0.76. The mechanism in a nutshell: traders are positioned short while the price is rising. This leg was driven by short covering, not by a buildup of new longs.
The 1-hour RSI is around 60; the 12-period moving average is about 1,336, the 26-period moving average about 1,321, and the Keltner Channel's upper band is around 1,370 with its middle band around 1,327. The Bollinger upper band at about 1,389 sits right at the peak, and the KDJ J value is around 60. The price is consolidating above the 12-period moving average; after pulling back from the peak, it hasn't broken out to a new high.
I interpret this move around 1,355 as a pullback after crowded shorts were squeezed, not as a new long base. Until open interest expands back above 450,000 contracts and the retail long-account ratio climbs back to 50%, the upside is capped first by the 1,388 peak. If it loses the 1,336 12-period moving average, watch the Keltner middle band at 1,327.
$ZEC #合约数据 #Open Interest
The key is the positioning structure. The retail long-account ratio slid from about 43.9% at 20:00 to about 38.6% at 23:00. Even as the short squeeze unfolded, traders crowded further onto the short side; the ratio is still pinned around 40%. Yet large traders' long positions remain at about 58%, while long accounts among large traders are around 40%—the two measures point in opposite directions. Funding stayed capped at the settlement limit of +0.01% all day, with longs continuously paying shorts a small amount. The taker buy/sell ratio only reached 1.04 on the 22:00 squeeze candle, which looks more like short covering than retail chasing longs; by 2:00 a.m., it had fallen to 0.76. The mechanism in a nutshell: traders are positioned short while the price is rising. This leg was driven by short covering, not by a buildup of new longs.
The 1-hour RSI is around 60; the 12-period moving average is about 1,336, the 26-period moving average about 1,321, and the Keltner Channel's upper band is around 1,370 with its middle band around 1,327. The Bollinger upper band at about 1,389 sits right at the peak, and the KDJ J value is around 60. The price is consolidating above the 12-period moving average; after pulling back from the peak, it hasn't broken out to a new high.
I interpret this move around 1,355 as a pullback after crowded shorts were squeezed, not as a new long base. Until open interest expands back above 450,000 contracts and the retail long-account ratio climbs back to 50%, the upside is capped first by the 1,388 peak. If it loses the 1,336 12-period moving average, watch the Keltner middle band at 1,327.
$ZEC #合约数据 #Open Interest
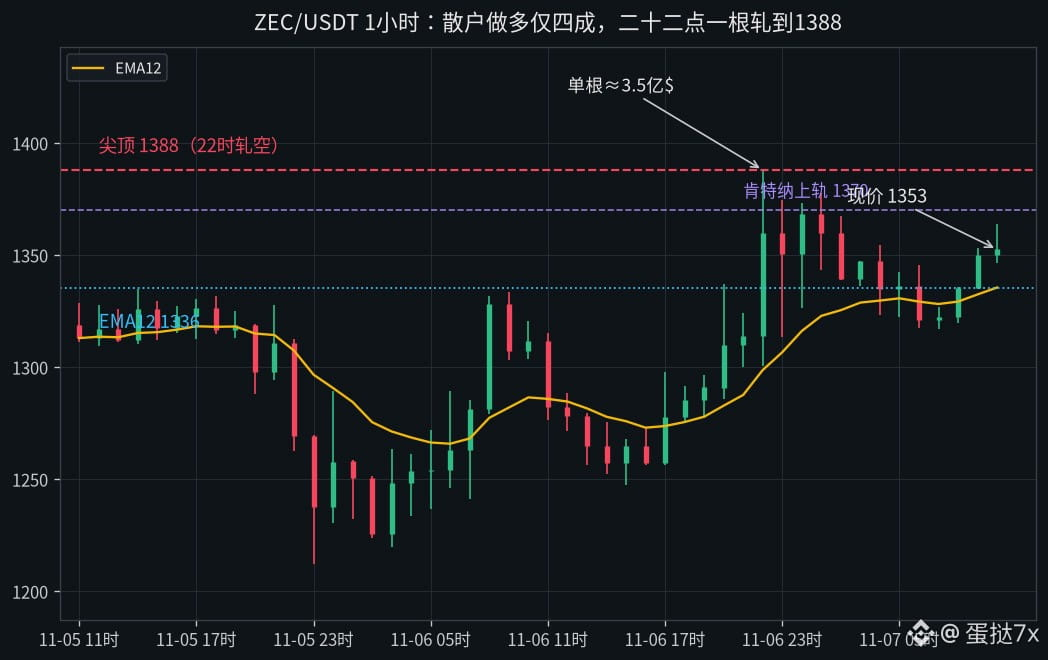
322
·
--
The 79,464 retest level was lost and never reclaimed—$BTC futures plunged from 79,646 to 78,262 at 22:00, with about $2.28 billion in volume; at 23:00, they broke down through 76,007 from 78,262, reaching a low of 75,525 on about $5.98 billion in volume for that candle. At 07:00, the price probed a new intraday low of 75,158. It’s now around 76,190, down about 4.4% over the past day, with about $21.6 billion in futures volume. Last night, I treated the move to 79,720 as noise from short-covering and not a new waterfall—but the waterfall narrative was right on the price action. I was too conservative.
The tension is in positioning. As the waterfall hit, open interest fell from about 95,900 BTC to around 91,600 BTC by midnight—some positions were flushed out. Then it rebuilt steadily to around 95,500 BTC now, almost back to last night’s level. Retail accounts’ long ratio was about 58.6% last night, around 63% at 23:00, then jumped straight to about 70% at midnight; it’s now pinned near 76%—the deeper the drop, the more people try to catch the falling knife. Large traders’ long positions are still around 68%, and their accounts’ long ratio is about 77%. The funding rate at the 16:00 settlement was still +0.0055%, so longs continue to pay shorts a small amount. The setup in one sentence: price has completed part of a waterfall, while positions are getting increasingly crowded at the bottom.
The one-hour RSI is around 41; the 12-period moving average, at about 76,068, is right by the current price; the 26-period moving average is around 76,663; the lower Keltner band is around 75,640; the lower Bollinger band is around 75,500; and the KDJ J-line has risen to about 97. Price is grinding along the upper edge of the post-waterfall range. Short-term indicators are warning that the rebound is overbought, while neither of the two gauges—open interest and retail longs—has eased.
I’m treating this area around 76,190 as a falling-knife-catching zone where positions are still being added after the selloff, not as a completed capitulation. Until retail longs ease back to 65% and open interest falls below 92,000 BTC, any rebound is likely to run into resistance at the 26-period moving average at 76,663. If 75,158 gives way, look for a deeper retest.
$BTC #合约数据 #Open interest
The 79,464 retest level was lost and never reclaimed—$BTC futures plunged from 79,646 to 78,262 at 22:00, with about $2.28 billion in volume; at 23:00, they broke down through 76,007 from 78,262, reaching a low of 75,525 on about $5.98 billion in volume for that candle. At 07:00, the price probed a new intraday low of 75,158. It’s now around 76,190, down about 4.4% over the past day, with about $21.6 billion in futures volume. Last night, I treated the move to 79,720 as noise from short-covering and not a new waterfall—but the waterfall narrative was right on the price action. I was too conservative.
The tension is in positioning. As the waterfall hit, open interest fell from about 95,900 BTC to around 91,600 BTC by midnight—some positions were flushed out. Then it rebuilt steadily to around 95,500 BTC now, almost back to last night’s level. Retail accounts’ long ratio was about 58.6% last night, around 63% at 23:00, then jumped straight to about 70% at midnight; it’s now pinned near 76%—the deeper the drop, the more people try to catch the falling knife. Large traders’ long positions are still around 68%, and their accounts’ long ratio is about 77%. The funding rate at the 16:00 settlement was still +0.0055%, so longs continue to pay shorts a small amount. The setup in one sentence: price has completed part of a waterfall, while positions are getting increasingly crowded at the bottom.
The one-hour RSI is around 41; the 12-period moving average, at about 76,068, is right by the current price; the 26-period moving average is around 76,663; the lower Keltner band is around 75,640; the lower Bollinger band is around 75,500; and the KDJ J-line has risen to about 97. Price is grinding along the upper edge of the post-waterfall range. Short-term indicators are warning that the rebound is overbought, while neither of the two gauges—open interest and retail longs—has eased.
I’m treating this area around 76,190 as a falling-knife-catching zone where positions are still being added after the selloff, not as a completed capitulation. Until retail longs ease back to 65% and open interest falls below 92,000 BTC, any rebound is likely to run into resistance at the 26-period moving average at 76,663. If 75,158 gives way, look for a deeper retest.
$BTC #合约数据 #Open interest
The tension is in positioning. As the waterfall hit, open interest fell from about 95,900 BTC to around 91,600 BTC by midnight—some positions were flushed out. Then it rebuilt steadily to around 95,500 BTC now, almost back to last night’s level. Retail accounts’ long ratio was about 58.6% last night, around 63% at 23:00, then jumped straight to about 70% at midnight; it’s now pinned near 76%—the deeper the drop, the more people try to catch the falling knife. Large traders’ long positions are still around 68%, and their accounts’ long ratio is about 77%. The funding rate at the 16:00 settlement was still +0.0055%, so longs continue to pay shorts a small amount. The setup in one sentence: price has completed part of a waterfall, while positions are getting increasingly crowded at the bottom.
The one-hour RSI is around 41; the 12-period moving average, at about 76,068, is right by the current price; the 26-period moving average is around 76,663; the lower Keltner band is around 75,640; the lower Bollinger band is around 75,500; and the KDJ J-line has risen to about 97. Price is grinding along the upper edge of the post-waterfall range. Short-term indicators are warning that the rebound is overbought, while neither of the two gauges—open interest and retail longs—has eased.
I’m treating this area around 76,190 as a falling-knife-catching zone where positions are still being added after the selloff, not as a completed capitulation. Until retail longs ease back to 65% and open interest falls below 92,000 BTC, any rebound is likely to run into resistance at the 26-period moving average at 76,663. If 75,158 gives way, look for a deeper retest.
$BTC #合约数据 #Open interest
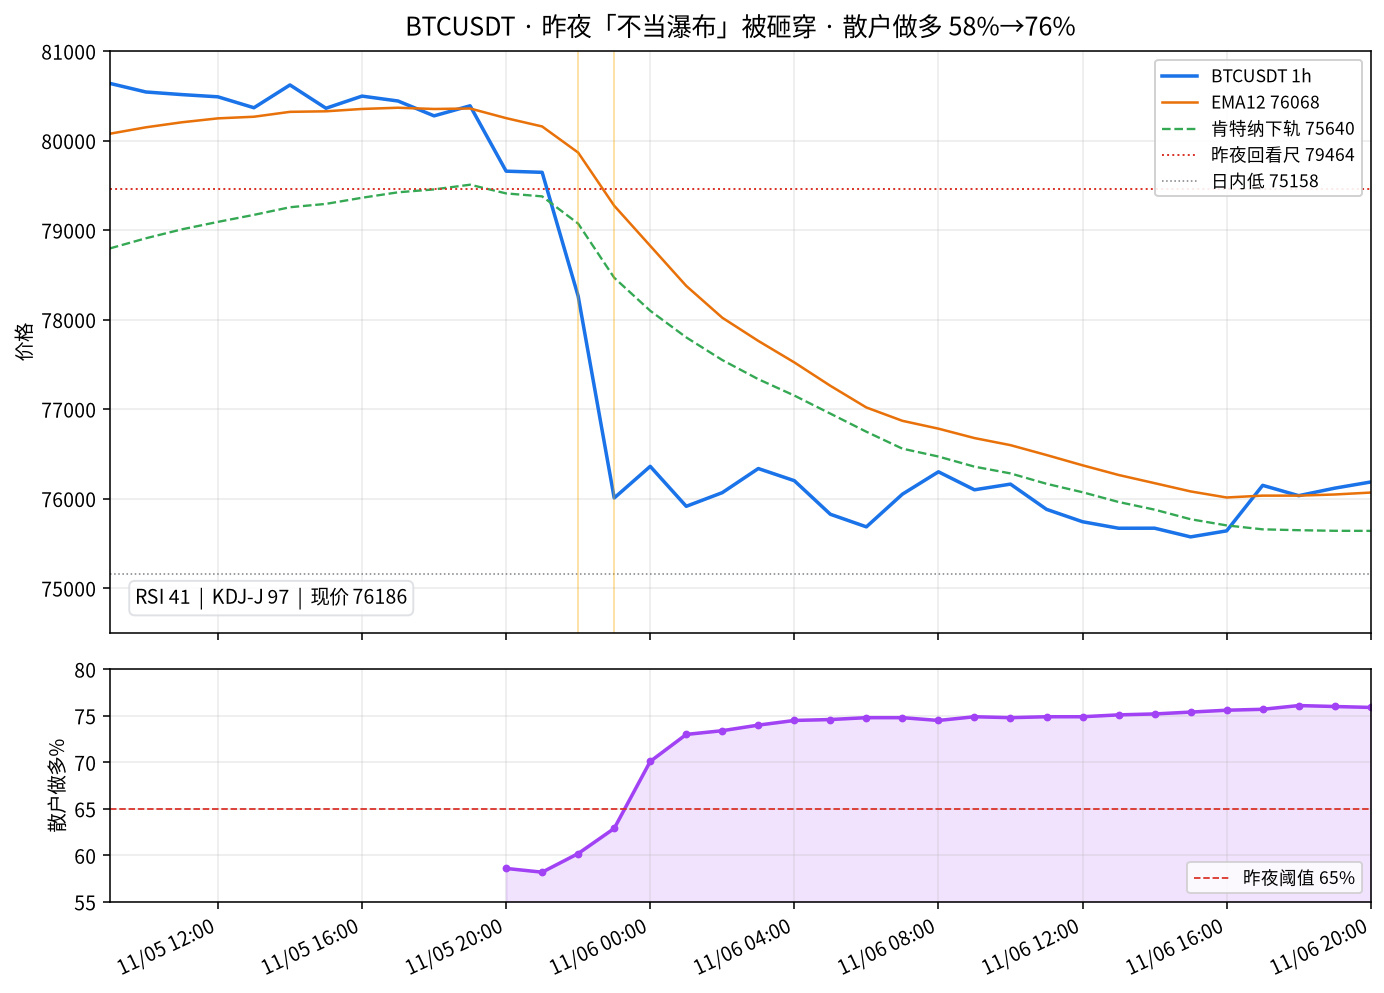
213
·
--
Last night, I treated $ETH at 2,430 as spike noise after a short squeeze and covering—not as a new base. Twelve hours later, price smashed straight through that level. The 20:00 candle first lost 2,410, with about $830 million in volume; at 21:00, price ground along near 2,385; at 22:00, a candle with about $1.65 billion in volume dumped price to 2,333; at 23:00, price plunged from 2,343 to 2,252, with about $3.93 billion in volume on that candle alone. At 7:00, price touched the intraday low of 2,205 again. It’s now around 2,240, down about 7.8% over the past day, with about $13.8 billion in futures volume. Both reference levels, 2,410 and 2,385, have been lost. I got this part of the price action right.
The sticking point is positioning. During those few hours of waterfall selling, open interest only fell from about 2.376 million coins to around 2.314 million—a reduction of less than 70,000 coins. It then swelled back to around 2.36 million overnight and is now still hovering near 2.33 million. Only a small portion of positions were flushed out. Retail long accounts were about 65% yesterday morning, around 69% at 23:00, jumped straight to around 76% at midnight, and are now pinned near 80%—the deeper the drop, the more people try to catch the falling knife. Large traders’ long positions rose from around 59% to around 68%, while the share of large traders’ accounts holding longs climbed to around 79%. Both groups added longs during the waterfall. Funding flipped from near zero to +0.01% at settlement, so longs are once again paying shorts a small amount. The taker buy/sell ratio leaned toward selling from 20:00 to 23:00; only during the rebound from midnight to 4:00 did it climb back above 1.1, before falling below 1.0 again. The mechanism is simple: some positions were flushed out, but long positioning kept piling up and getting more crowded during the waterfall. The floor hasn’t been thoroughly washed out.
The one-hour RSI is around 30; the 12-period moving average is around 2,264; the 26-period moving average is around 2,303; the lower Keltner band is around 2,242; the Bollinger midline is around 2,309; and the MACD histogram continues to deepen in negative territory, at around -6.4. Price is grinding just outside the lower Keltner band, with all the short-term moving averages overhead.
I’m treating this move around 2,240 as rebound noise after crowded dip-buying, not as confirmation that the floor has been flushed out. Until open interest falls back below 2.25 million coins and retail longs ease back to 65%, any rebound runs into resistance first at the 12-period moving average around 2,264. If 2,205 gives way, look for a deeper move down.
$ETH #合约数据 #OpenInterest
Last night, I treated $ETH at 2,430 as spike noise after a short squeeze and covering—not as a new base. Twelve hours later, price smashed straight through that level. The 20:00 candle first lost 2,410, with about $830 million in volume; at 21:00, price ground along near 2,385; at 22:00, a candle with about $1.65 billion in volume dumped price to 2,333; at 23:00, price plunged from 2,343 to 2,252, with about $3.93 billion in volume on that candle alone. At 7:00, price touched the intraday low of 2,205 again. It’s now around 2,240, down about 7.8% over the past day, with about $13.8 billion in futures volume. Both reference levels, 2,410 and 2,385, have been lost. I got this part of the price action right.
The sticking point is positioning. During those few hours of waterfall selling, open interest only fell from about 2.376 million coins to around 2.314 million—a reduction of less than 70,000 coins. It then swelled back to around 2.36 million overnight and is now still hovering near 2.33 million. Only a small portion of positions were flushed out. Retail long accounts were about 65% yesterday morning, around 69% at 23:00, jumped straight to around 76% at midnight, and are now pinned near 80%—the deeper the drop, the more people try to catch the falling knife. Large traders’ long positions rose from around 59% to around 68%, while the share of large traders’ accounts holding longs climbed to around 79%. Both groups added longs during the waterfall. Funding flipped from near zero to +0.01% at settlement, so longs are once again paying shorts a small amount. The taker buy/sell ratio leaned toward selling from 20:00 to 23:00; only during the rebound from midnight to 4:00 did it climb back above 1.1, before falling below 1.0 again. The mechanism is simple: some positions were flushed out, but long positioning kept piling up and getting more crowded during the waterfall. The floor hasn’t been thoroughly washed out.
The one-hour RSI is around 30; the 12-period moving average is around 2,264; the 26-period moving average is around 2,303; the lower Keltner band is around 2,242; the Bollinger midline is around 2,309; and the MACD histogram continues to deepen in negative territory, at around -6.4. Price is grinding just outside the lower Keltner band, with all the short-term moving averages overhead.
I’m treating this move around 2,240 as rebound noise after crowded dip-buying, not as confirmation that the floor has been flushed out. Until open interest falls back below 2.25 million coins and retail longs ease back to 65%, any rebound runs into resistance first at the 12-period moving average around 2,264. If 2,205 gives way, look for a deeper move down.
$ETH #合约数据 #OpenInterest
The sticking point is positioning. During those few hours of waterfall selling, open interest only fell from about 2.376 million coins to around 2.314 million—a reduction of less than 70,000 coins. It then swelled back to around 2.36 million overnight and is now still hovering near 2.33 million. Only a small portion of positions were flushed out. Retail long accounts were about 65% yesterday morning, around 69% at 23:00, jumped straight to around 76% at midnight, and are now pinned near 80%—the deeper the drop, the more people try to catch the falling knife. Large traders’ long positions rose from around 59% to around 68%, while the share of large traders’ accounts holding longs climbed to around 79%. Both groups added longs during the waterfall. Funding flipped from near zero to +0.01% at settlement, so longs are once again paying shorts a small amount. The taker buy/sell ratio leaned toward selling from 20:00 to 23:00; only during the rebound from midnight to 4:00 did it climb back above 1.1, before falling below 1.0 again. The mechanism is simple: some positions were flushed out, but long positioning kept piling up and getting more crowded during the waterfall. The floor hasn’t been thoroughly washed out.
The one-hour RSI is around 30; the 12-period moving average is around 2,264; the 26-period moving average is around 2,303; the lower Keltner band is around 2,242; the Bollinger midline is around 2,309; and the MACD histogram continues to deepen in negative territory, at around -6.4. Price is grinding just outside the lower Keltner band, with all the short-term moving averages overhead.
I’m treating this move around 2,240 as rebound noise after crowded dip-buying, not as confirmation that the floor has been flushed out. Until open interest falls back below 2.25 million coins and retail longs ease back to 65%, any rebound runs into resistance first at the 12-period moving average around 2,264. If 2,205 gives way, look for a deeper move down.
$ETH #合约数据 #OpenInterest
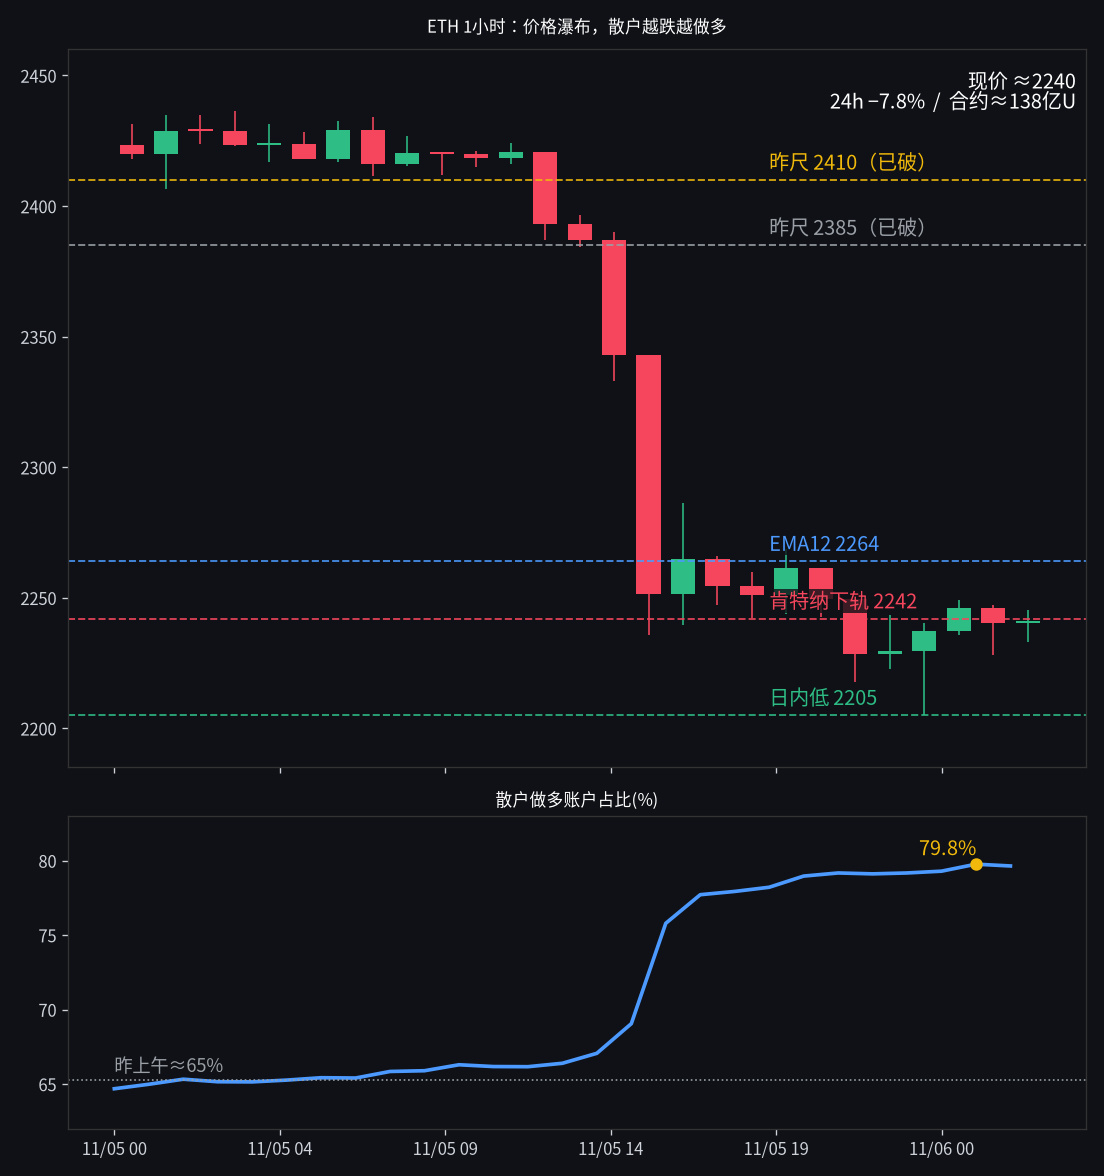
83
·
--
Around $3.9 billion in trading volume, but open interest grew by only 94 BTC—$BTC futures touched a peak of 81,188 after rising from 79,317 at 23:00 last night. The current price is around 79,720, up about 2.1% over the past day, with futures trading volume at around $14 billion. During the hour-long short squeeze, open interest only edged up from about 98,890 BTC to 98,990 BTC, with almost no new longs opening. At midnight, it plunged straight back to about 97,100 BTC—the leverage started unwinding after the peak.
The share of retail accounts going long has steadily fallen from around 72.6% the night before last to about 58.6% now, clearing out much of the crowding. But whales’ long positions are still stuck at around 66.3%, leaving the two sides at odds. Funding rates have stayed around +0.01% all day. Just now, the 20:30 fifteen-minute candle plunged from 80,080 to 79,640, with about $460 million in volume, breaking through the consolidation floor above 80k that held during the day. In short: this move is a pullback after the short-squeeze peak, not a new base for longs, and it hasn’t yet been confirmed as the start of another waterfall decline.
The one-hour RSI is around 48, the 12-period moving average is around 80,269, and the lower Bollinger Band at around 79,931 has been breached. The lower Keltner Channel at around 79,464 is still below price. The KDJ J value has fallen to around 5.7, and the MACD histogram has turned negative.
I’m treating this move around 79,720 as noise from a pullback after the short squeeze, not the start of a new waterfall decline. Until open interest swells back above 98,500 BTC and the share of retail accounts going long climbs back to 65%, I’ll first watch the lower Keltner Channel at 79,464 on the downside. Any rebound will first run into resistance at the 12-period moving average at 80,269. These are my personal views.
$BTC #合约数据 #OpenInterest
Around $3.9 billion in trading volume, but open interest grew by only 94 BTC—$BTC futures touched a peak of 81,188 after rising from 79,317 at 23:00 last night. The current price is around 79,720, up about 2.1% over the past day, with futures trading volume at around $14 billion. During the hour-long short squeeze, open interest only edged up from about 98,890 BTC to 98,990 BTC, with almost no new longs opening. At midnight, it plunged straight back to about 97,100 BTC—the leverage started unwinding after the peak.
The share of retail accounts going long has steadily fallen from around 72.6% the night before last to about 58.6% now, clearing out much of the crowding. But whales’ long positions are still stuck at around 66.3%, leaving the two sides at odds. Funding rates have stayed around +0.01% all day. Just now, the 20:30 fifteen-minute candle plunged from 80,080 to 79,640, with about $460 million in volume, breaking through the consolidation floor above 80k that held during the day. In short: this move is a pullback after the short-squeeze peak, not a new base for longs, and it hasn’t yet been confirmed as the start of another waterfall decline.
The one-hour RSI is around 48, the 12-period moving average is around 80,269, and the lower Bollinger Band at around 79,931 has been breached. The lower Keltner Channel at around 79,464 is still below price. The KDJ J value has fallen to around 5.7, and the MACD histogram has turned negative.
I’m treating this move around 79,720 as noise from a pullback after the short squeeze, not the start of a new waterfall decline. Until open interest swells back above 98,500 BTC and the share of retail accounts going long climbs back to 65%, I’ll first watch the lower Keltner Channel at 79,464 on the downside. Any rebound will first run into resistance at the 12-period moving average at 80,269. These are my personal views.
$BTC #合约数据 #OpenInterest
The share of retail accounts going long has steadily fallen from around 72.6% the night before last to about 58.6% now, clearing out much of the crowding. But whales’ long positions are still stuck at around 66.3%, leaving the two sides at odds. Funding rates have stayed around +0.01% all day. Just now, the 20:30 fifteen-minute candle plunged from 80,080 to 79,640, with about $460 million in volume, breaking through the consolidation floor above 80k that held during the day. In short: this move is a pullback after the short-squeeze peak, not a new base for longs, and it hasn’t yet been confirmed as the start of another waterfall decline.
The one-hour RSI is around 48, the 12-period moving average is around 80,269, and the lower Bollinger Band at around 79,931 has been breached. The lower Keltner Channel at around 79,464 is still below price. The KDJ J value has fallen to around 5.7, and the MACD histogram has turned negative.
I’m treating this move around 79,720 as noise from a pullback after the short squeeze, not the start of a new waterfall decline. Until open interest swells back above 98,500 BTC and the share of retail accounts going long climbs back to 65%, I’ll first watch the lower Keltner Channel at 79,464 on the downside. Any rebound will first run into resistance at the 12-period moving average at 80,269. These are my personal views.
$BTC #合约数据 #OpenInterest
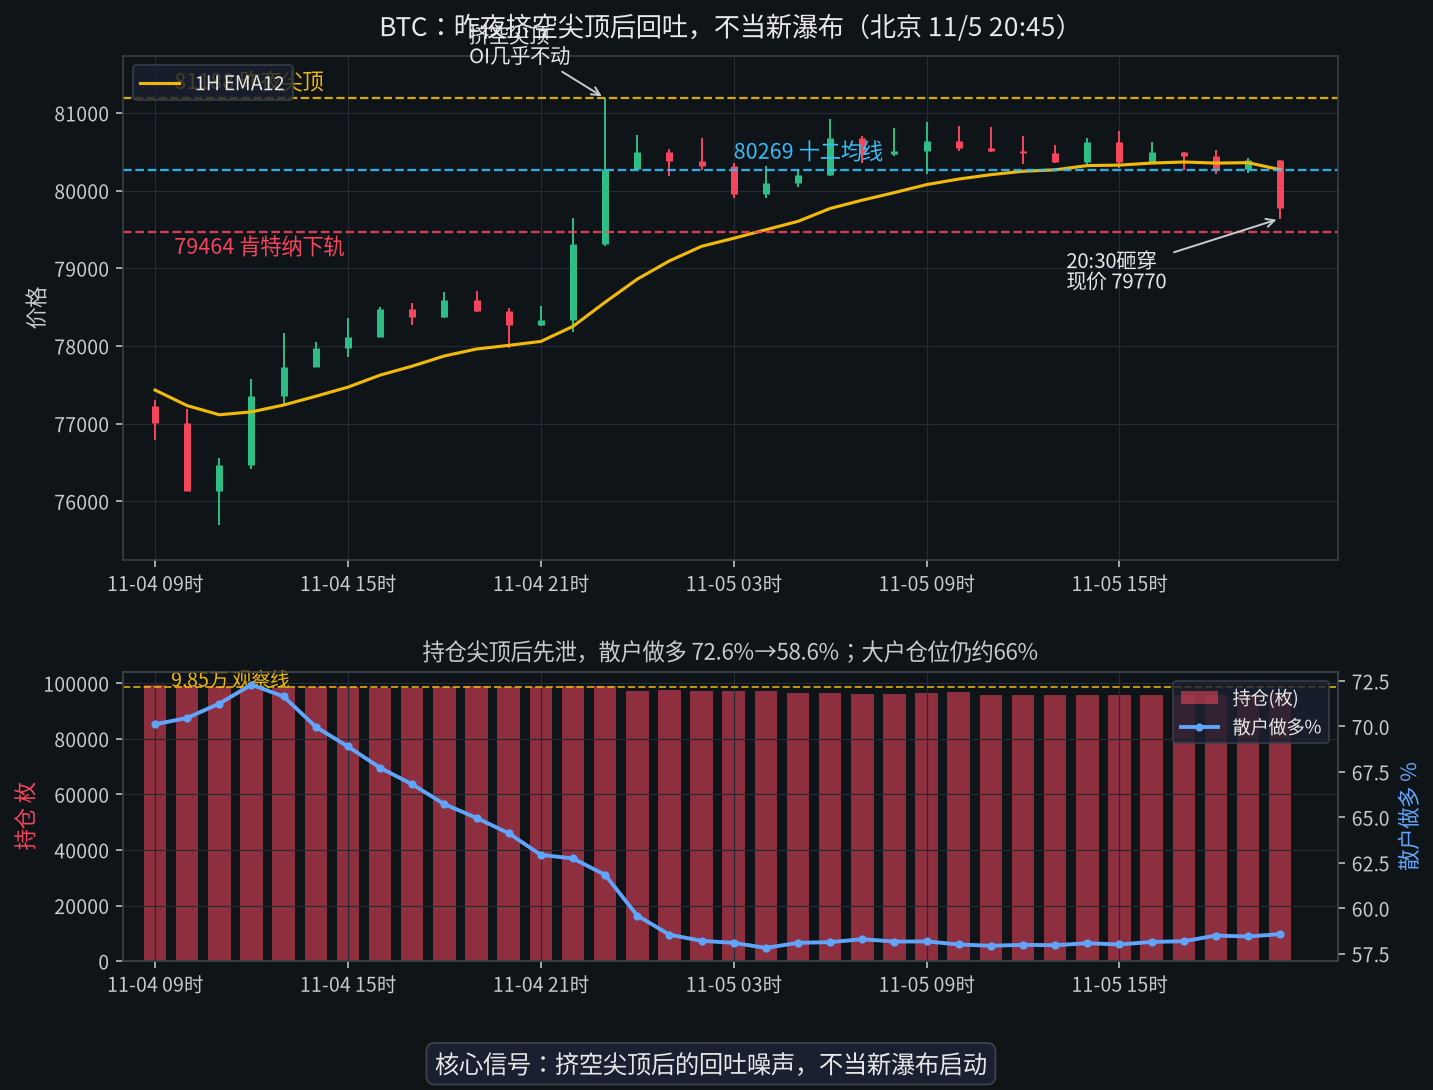
69
Log in to explore more content
Join global crypto users on Binance Square
⚡️ Get latest and useful information about crypto.
💬 Trusted by the world’s largest crypto exchange.
👍 Discover real insights from verified creators.
Email / Phone number
Trending Topics
NvidiaLoses$2.7TrillionInMonthAndAHalf
19,130 views
120 Discussing
Nvidia’s $2.7 Trillion Wipeout: When Narrative Overrides Numbers 📉
Crypto With Faisal
·7 Likes
·5.4k views
CanBTCReboundAfterFallingBelow60K?
762,868 views
2,981 Discussing
GlobalStocksFaceLongestLosingStreakSince2023
277,266 views
1,985 Discussing