
#tokenomics
tokenomics
2.1M views
4,087 Discussing
Hot
Latest

Token Unlocks: What You Need to Watch
High-profile token unlocks like Hyperliquid (HYPE) test market depth. Before buying any altcoin rally, always check the upcoming supply release schedule to avoid holding through heavy dilution.
#Tokenomics #CryptoTips
High-profile token unlocks like Hyperliquid (HYPE) test market depth. Before buying any altcoin rally, always check the upcoming supply release schedule to avoid holding through heavy dilution.
#Tokenomics #CryptoTips



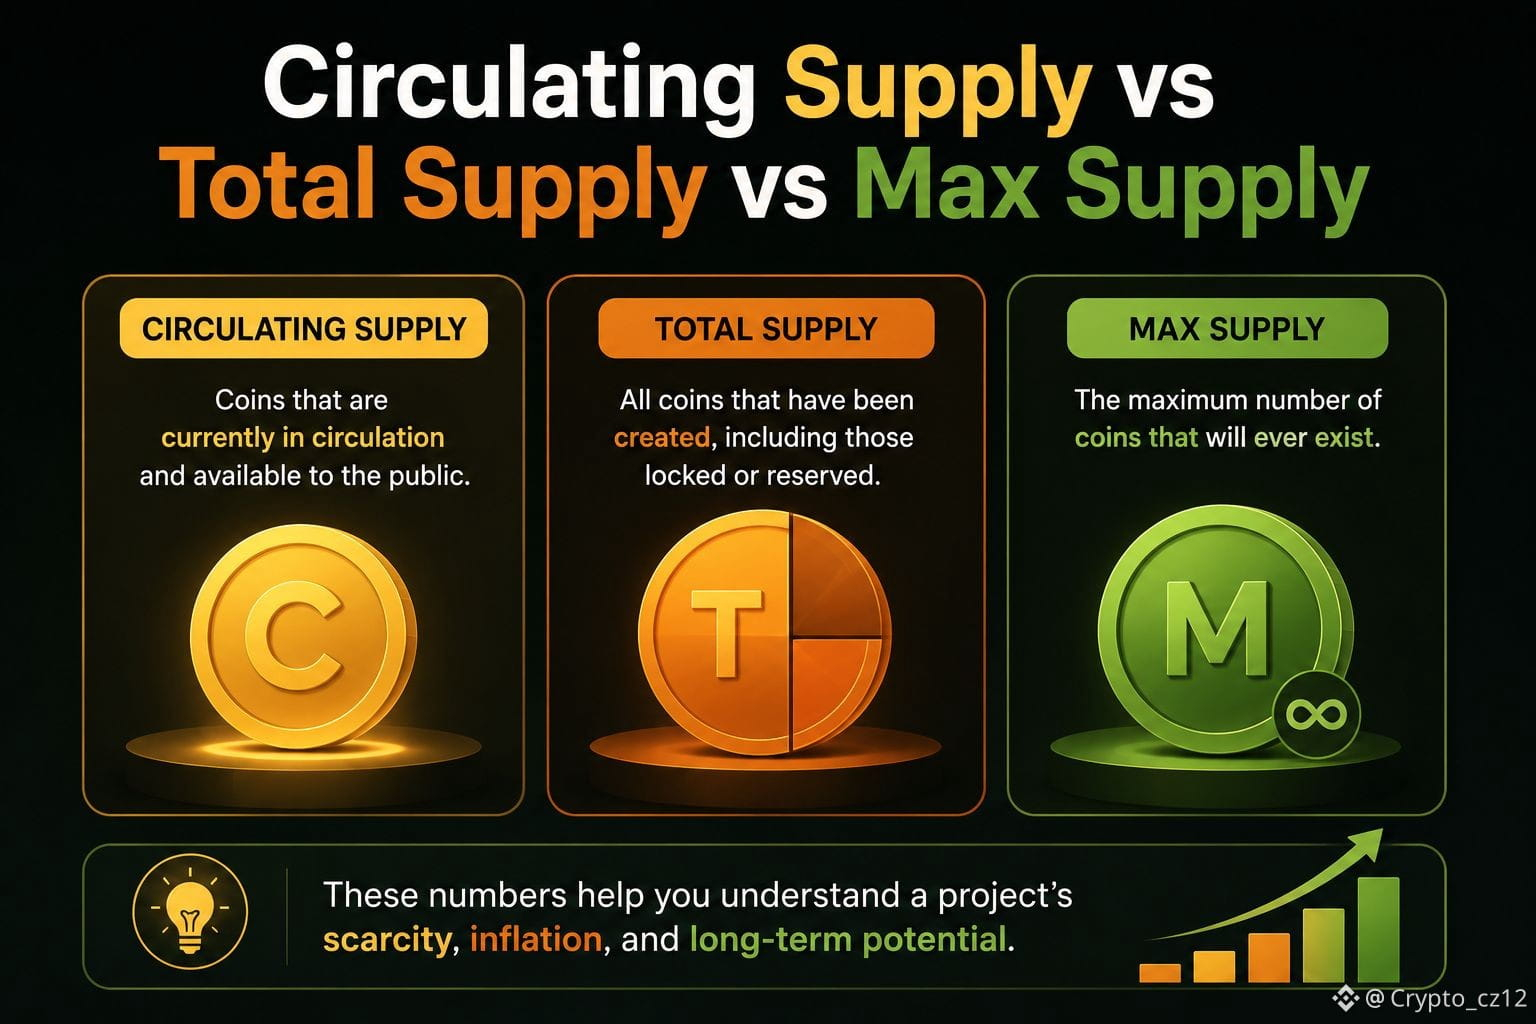
Circulating Supply vs Total Supply vs Max Supply
Definitions with real examples: BTC's hard 21M cap, tokens with no max supply, tokens with large locked supply
#Tokenomics #CryptoEducation
$BTC $USDT $ETH
Definitions with real examples: BTC's hard 21M cap, tokens with no max supply, tokens with large locked supply
#Tokenomics #CryptoEducation
$BTC $USDT $ETH

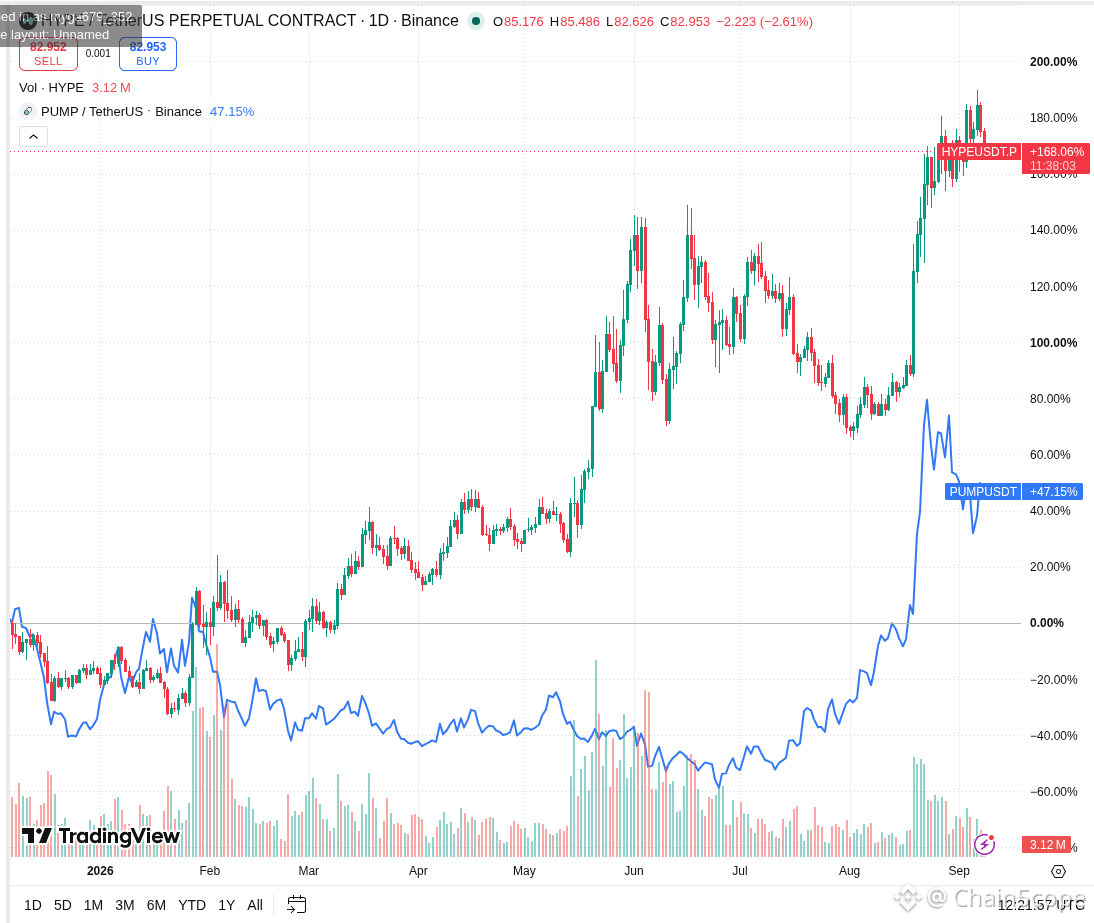
Two protocols are burning tokens like crazy right now. One rallied 70% to new highs. The other's price upside is capped. Same mechanism, opposite outcomes.
Hyperliquid routes 99% of trading fees into buybacks — $1.2B retired since launch, 4.6% of initial supply gone, and $HYPE decoupled entirely from a down-trending altcoin market. Pump.fun burned $442.6M, cutting 16.3% of circulating supply — real money, real burn. But it also unlocked $86.5M to team and investor wallets in July alone, quietly offsetting a huge chunk of that deflation. Net supply reduction is what actually matters, not the burn headline.
Bias: burns backed by real, growing fee revenue with minimal unlock overhang (like HYPE's) carry more price signal than burns fighting against dilution (like $PUMP 's). Before crediting any burn with a rally — is the unlock schedule actually smaller than the burn, or just quieter? #TokenBurn #Tokenomics
Hyperliquid routes 99% of trading fees into buybacks — $1.2B retired since launch, 4.6% of initial supply gone, and $HYPE decoupled entirely from a down-trending altcoin market. Pump.fun burned $442.6M, cutting 16.3% of circulating supply — real money, real burn. But it also unlocked $86.5M to team and investor wallets in July alone, quietly offsetting a huge chunk of that deflation. Net supply reduction is what actually matters, not the burn headline.
Bias: burns backed by real, growing fee revenue with minimal unlock overhang (like HYPE's) carry more price signal than burns fighting against dilution (like $PUMP 's). Before crediting any burn with a rally — is the unlock schedule actually smaller than the burn, or just quieter? #TokenBurn #Tokenomics

🚨 $LAPTOP UNVEILS UNIQUE GAMIFIED SUPPLY BURN DYNAMICS AHEAD OF TOKEN LAUNCH! 🦈
The upcoming launch of $LAPTOP introduces an intriguing game-theory model, setting initial circulating supply at 350 million tokens with a 36-month vesting curve for the remainder. 📊 What catches the eye structurally is the allocation tied directly to 30 Polymarket prediction outcomes.
With 30% of total supply subject to binary settlement mechanics—where YES outcomes trigger permanent token burns and NO outcomes transfer to charity—the market faces a dynamic supply contraction vector. 💡 This setup creates an unusual programmatic order-flow incentive structure rarely seen in speculative asset launches. 💬 How do you see this Polymarket burn mechanism impacting initial liquidity depth? 👇
⚠️ Not financial advice. Always manage your risk. 🛡️
🏷️ #LAPTOP #Tokenomics #Polymarket #CryptoNews
🎯 🦈
The upcoming launch of $LAPTOP introduces an intriguing game-theory model, setting initial circulating supply at 350 million tokens with a 36-month vesting curve for the remainder. 📊 What catches the eye structurally is the allocation tied directly to 30 Polymarket prediction outcomes.
With 30% of total supply subject to binary settlement mechanics—where YES outcomes trigger permanent token burns and NO outcomes transfer to charity—the market faces a dynamic supply contraction vector. 💡 This setup creates an unusual programmatic order-flow incentive structure rarely seen in speculative asset launches. 💬 How do you see this Polymarket burn mechanism impacting initial liquidity depth? 👇
⚠️ Not financial advice. Always manage your risk. 🛡️
🏷️ #LAPTOP #Tokenomics #Polymarket #CryptoNews
🎯 🦈

CRYPTO PROJECTS HAVE SPENT $638M ON TOKEN BUYBACKS IN 2026
Crypto projects have reportedly spent a record $638 million repurchasing their own tokens so far this year.
🔥 The biggest surprise?
Hyperliquid ($HYPE ) and Pump.fun ($PUMP ) account for nearly 90% of total buybacks, highlighting how concentrated this trend has become.
📊 Why it matters:
🔹 Revenue-funded buybacks can create consistent market demand
🔹 Repurchased tokens may reduce circulating supply if burned
🔹 Token value becomes increasingly connected to real protocol revenue
🔹 Crypto tokenomics are beginning to resemble corporate share buybacks
⚠️ However, buybacks are not automatically bullish. Their long-term impact depends on whether the protocol can continue generating sustainable revenue.
👀 A new narrative may be emerging: cash-flow-backed tokens over purely speculative tokenomics.
#Hyperliquid #Tokenomics #DEFİ #SideSwapSuspendsLiquidServices
Crypto projects have reportedly spent a record $638 million repurchasing their own tokens so far this year.
🔥 The biggest surprise?
Hyperliquid ($HYPE ) and Pump.fun ($PUMP ) account for nearly 90% of total buybacks, highlighting how concentrated this trend has become.
📊 Why it matters:
🔹 Revenue-funded buybacks can create consistent market demand
🔹 Repurchased tokens may reduce circulating supply if burned
🔹 Token value becomes increasingly connected to real protocol revenue
🔹 Crypto tokenomics are beginning to resemble corporate share buybacks
⚠️ However, buybacks are not automatically bullish. Their long-term impact depends on whether the protocol can continue generating sustainable revenue.
👀 A new narrative may be emerging: cash-flow-backed tokens over purely speculative tokenomics.
#Hyperliquid #Tokenomics #DEFİ #SideSwapSuspendsLiquidServices

🔥 HYPE Buybacks Are A Story Worth Watching
Hyperliquid is one of the most interesting examples of the current token-buyback trend.
Reports say Hyperliquid has been using protocol revenue to buy back HYPE, while its activity represents a huge portion of crypto's 2026 buyback activity.
What I find interesting isn't simply the buyback.
It's the revenue → buyback → tokenomics connection.
That's a much more interesting model than:
“Price is going up because everyone is buying.”
Still, no tokenomics model is magic.
The protocol needs sustainable demand and real usage.
Revenue matters. Hype alone doesn't.
#HYPE #Hyperliquid #DeFi #Crypto #Tokenomics
Hyperliquid is one of the most interesting examples of the current token-buyback trend.
Reports say Hyperliquid has been using protocol revenue to buy back HYPE, while its activity represents a huge portion of crypto's 2026 buyback activity.
What I find interesting isn't simply the buyback.
It's the revenue → buyback → tokenomics connection.
That's a much more interesting model than:
“Price is going up because everyone is buying.”
Still, no tokenomics model is magic.
The protocol needs sustainable demand and real usage.
Revenue matters. Hype alone doesn't.
#HYPE #Hyperliquid #DeFi #Crypto #Tokenomics

Verified
$ASTER Just Jumped 25% — Here's the Tokenomics Trick Behind It.
$ASTER surged 25% in 18 hours after a tokenomics overhaul — a 12-month cliff extension plus 99% of platform fees redirected into buybacks and burns. A supply-mechanics story, not just hype.
#asterix #Tokenomics #Market_Update
$ASTER surged 25% in 18 hours after a tokenomics overhaul — a 12-month cliff extension plus 99% of platform fees redirected into buybacks and burns. A supply-mechanics story, not just hype.
#asterix #Tokenomics #Market_Update

🚨 HYPERLIQUID ($HYPE) REVENUE & BUYBACK ANALYSIS! 🚨
Arete Capital Managing Partner McKenna highlighted an insightful breakdown regarding Hyperliquid's AQA v2 wallet models! 📊
Key Takeaways:
🔹 AQA v2 Wallet Balance: ~$6.21 Billion in USDC
🔹 Estimated Yield: ~3.10% (based on 30-day SOFR at ~3.65%)
🔹 Annualized Revenue: ~$193 Million/year (assuming 90% flows to Assistance Fund)
🔹 Daily Buyback Pressure: Estimated ~$527,000 PER DAY for $HYPE! 🔥
Note: These numbers are analyst estimates based on on-chain data and interest rates, not official disclosures. However, it shows a strong potential buyback mechanism for $HYPE!
How do you view $HYPE's long-term tokenomics? Let us know below! 👇
#Hyperliquid #hype #CryptoNewss #defi #Tokenomics
Arete Capital Managing Partner McKenna highlighted an insightful breakdown regarding Hyperliquid's AQA v2 wallet models! 📊
Key Takeaways:
🔹 AQA v2 Wallet Balance: ~$6.21 Billion in USDC
🔹 Estimated Yield: ~3.10% (based on 30-day SOFR at ~3.65%)
🔹 Annualized Revenue: ~$193 Million/year (assuming 90% flows to Assistance Fund)
🔹 Daily Buyback Pressure: Estimated ~$527,000 PER DAY for $HYPE! 🔥
Note: These numbers are analyst estimates based on on-chain data and interest rates, not official disclosures. However, it shows a strong potential buyback mechanism for $HYPE!
How do you view $HYPE's long-term tokenomics? Let us know below! 👇
#Hyperliquid #hype #CryptoNewss #defi #Tokenomics

Why is nobody talking about how FDV tricks traders into confusing a price tag with actual capital inflow?
Too many people see a $670M FDV and assume $670M has entered the token, then FOMO into $BTC , $ETH , or a new launch at the worst possible moment. That misunderstanding is how investors end up buying narratives instead of liquidity.
FDV is simply the theoretical value of every token at its current price, including tokens that are still locked, vested, or not circulating. It is not a record of money that has flowed into the market.
Before buying, check circulating market cap, unlock schedules, daily volume, and the percentage of supply already tradable. A token can show a $670M FDV while far less capital has actually changed hands, which makes future unlock pressure far more important than the headline number.
Are traders finally going to stop treating FDV as proof of demand?
#Crypto #Tokenomics #FDV
Too many people see a $670M FDV and assume $670M has entered the token, then FOMO into $BTC , $ETH , or a new launch at the worst possible moment. That misunderstanding is how investors end up buying narratives instead of liquidity.
FDV is simply the theoretical value of every token at its current price, including tokens that are still locked, vested, or not circulating. It is not a record of money that has flowed into the market.
Before buying, check circulating market cap, unlock schedules, daily volume, and the percentage of supply already tradable. A token can show a $670M FDV while far less capital has actually changed hands, which makes future unlock pressure far more important than the headline number.
Are traders finally going to stop treating FDV as proof of demand?
#Crypto #Tokenomics #FDV


Everyone thinks a $670M FDV means $670M poured into a token, but actually that number is only a theoretical valuation.
That misunderstanding can make traders chase inflated launches, buy from FOMO, and get trapped when locked tokens enter circulation.
1. FDV multiplies the current token price by the entire supply, including tokens that are still locked. Think of it like pricing every apartment in a building based on the last unit sold.
2. A $670M FDV does not mean buyers invested $670M. Actual liquidity and market cap may be far smaller, so even modest selling can move the price sharply.
3. Before buying $ETH , $SOL , or any new token, compare FDV with circulating market cap and check the unlock schedule. A large gap can signal future dilution, like adding more slices to the same pizza.
What’s your take on using FDV to evaluate a token?
#CryptoEducation #Tokenomics #CryptoTrading
That misunderstanding can make traders chase inflated launches, buy from FOMO, and get trapped when locked tokens enter circulation.
1. FDV multiplies the current token price by the entire supply, including tokens that are still locked. Think of it like pricing every apartment in a building based on the last unit sold.
2. A $670M FDV does not mean buyers invested $670M. Actual liquidity and market cap may be far smaller, so even modest selling can move the price sharply.
3. Before buying $ETH , $SOL , or any new token, compare FDV with circulating market cap and check the unlock schedule. A large gap can signal future dilution, like adding more slices to the same pizza.
What’s your take on using FDV to evaluate a token?
#CryptoEducation #Tokenomics #CryptoTrading

If you're still treating a token's FDV like actual capital that has already flowed in, stop now.
This mistake cost traders millions last cycle as they bought into the illusion of size and got dumped on during unlocks.
FDV represents the theoretical value of the entire token supply at the current price. It does not mean $670M has flowed into the token.
I remember the same confusion hitting $SOL holders early on compared to how people valued $ETH in its first years. It repeated with $DOGE when the numbers looked massive but most supply was still sitting idle.
The real story is always in the circulating supply and actual liquidity, not the hypothetical fully diluted number.
Where do you think this FDV confusion goes from here in the next wave of launches?
#Crypto #Tokenomics #FDV
This mistake cost traders millions last cycle as they bought into the illusion of size and got dumped on during unlocks.
FDV represents the theoretical value of the entire token supply at the current price. It does not mean $670M has flowed into the token.
I remember the same confusion hitting $SOL holders early on compared to how people valued $ETH in its first years. It repeated with $DOGE when the numbers looked massive but most supply was still sitting idle.
The real story is always in the circulating supply and actual liquidity, not the hypothetical fully diluted number.
Where do you think this FDV confusion goes from here in the next wave of launches?
#Crypto #Tokenomics #FDV

Here's what happened when a new token showed a $670M FDV last week and the timeline exploded with people calling it the next big thing.
Traders jumped in thinking serious money had already committed, only to watch their bags get wrecked when the actual circulating value turned out to be tiny. It's the same trap that keeps catching people who don't look past the headline number.
FDV simply takes the current price and multiplies it by every token that will ever exist. It is a theoretical number, not proof that $670 million has actually flowed into the project. Plenty of launches in past cycles looked enormous on paper for the same reason, yet most of that supply was locked or not even minted.
Think about how $ETH , $SOL and $BNB trade with valuations that actually reflect tokens already in circulation. Newer tokens often float a massive FDV while only a sliver is trading, which is why the chart can collapse the moment early holders start selling. The comparison to older, more mature projects is pretty clear once you start checking the real numbers instead of the fully diluted headline.
Anyone else seeing this pattern repeat with the latest launches?
#Crypto #Tokenomics #FDV
Traders jumped in thinking serious money had already committed, only to watch their bags get wrecked when the actual circulating value turned out to be tiny. It's the same trap that keeps catching people who don't look past the headline number.
FDV simply takes the current price and multiplies it by every token that will ever exist. It is a theoretical number, not proof that $670 million has actually flowed into the project. Plenty of launches in past cycles looked enormous on paper for the same reason, yet most of that supply was locked or not even minted.
Think about how $ETH , $SOL and $BNB trade with valuations that actually reflect tokens already in circulation. Newer tokens often float a massive FDV while only a sliver is trading, which is why the chart can collapse the moment early holders start selling. The comparison to older, more mature projects is pretty clear once you start checking the real numbers instead of the fully diluted headline.
Anyone else seeing this pattern repeat with the latest launches?
#Crypto #Tokenomics #FDV

Picture this: a token trades at $0.95 while both its reported market cap and fully diluted valuation sit near $670 million.
For traders chasing a fresh $PONS move, the price can look deceptively accessible. But a sub-$1 token is not automatically cheap, and focusing on unit price alone can turn FOMO into an expensive mistake.
The key signal is valuation. At roughly $670 million in market cap and $670 million in FDV, $PONS appears to have little gap between circulating and fully diluted supply, potentially reducing future unlock pressure compared with low-float launches.
That does not remove the downside. A $670 million valuation already prices in substantial expectations, so weak liquidity, concentrated ownership, or fading demand could lead to sharp losses. Compare the valuation and market structure with assets like $BTC and $ETH before treating $0.95 as a bargain.
What risk do you think traders are overlooking here?
#PONS #CryptoRisk #Tokenomics
For traders chasing a fresh $PONS move, the price can look deceptively accessible. But a sub-$1 token is not automatically cheap, and focusing on unit price alone can turn FOMO into an expensive mistake.
The key signal is valuation. At roughly $670 million in market cap and $670 million in FDV, $PONS appears to have little gap between circulating and fully diluted supply, potentially reducing future unlock pressure compared with low-float launches.
That does not remove the downside. A $670 million valuation already prices in substantial expectations, so weak liquidity, concentrated ownership, or fading demand could lead to sharp losses. Compare the valuation and market structure with assets like $BTC and $ETH before treating $0.95 as a bargain.
What risk do you think traders are overlooking here?
#PONS #CryptoRisk #Tokenomics

Altcoins aren't "cheaper Bitcoin" — they serve fundamentally different functions.
KEY TAKEAWAY
Altcoin value comes from utility, not price. Five functional categories drive real demand: smart-contract platforms, DeFi primitives, infrastructure, scaling, and app-specific tokens.
EVIDENCE
1. Smart-contract platforms (ETH, SOL, AVAX): Execute code, settle assets — compute layer revenue from gas fees, staking yield, deployment activity
2. DeFi primitives (UNI, AAVE, CRV): Financial infrastructure — protocol fees, TVL growth, governance revenue
3. Infrastructure (LINK, GRT, AR): Oracles, indexing, storage — usage fees from dApps, query volume, data demand
4. Scaling (ARB, OP, MATIC): Throughput solutions — transaction fees, bridged TVL, developer activity
5. App-specific (RENDER, FET, AKT): Niche compute/markets — service revenue, network utilization, token burn/buyback
ANALYSIS
Most altcoins trend toward zero vs BTC over time. Separating signal from noise requires:
- Real revenue/fees (not token inflation)
- Active developers + growing TVL/users
- Liquid markets on Binance (spot + perpetuals)
- Clear catalyst calendar (upgrades, unlocks, governance votes)
- Relative strength vs BTC (ETH/BTC, SOL/BTC charts)
SCENARIOS
Bullish: Alt sector shows broad relative strength vs BTC, TVL expanding, developer activity rising
Neutral: Selective rotation — only categories with revenue catalysts outperform
Bearish: Capital consolidates into BTC; alts bleed on low volume, failed catalysts
BINANCE ANGLE
Binance tools for alt research: Token X-Ray (profile/health/security), Market Breadth (participation), Sector Rotation (narrative heat), Funding Analysis (leverage positioning). Use these to filter tradable vs speculative.
CONCLUSION
Trade the trend, don't marry the bag. Value accrues to protocols with sustainable revenue, active users, and liquid markets — not to narratives alone.
Binance Angels
#Altcoins #Tokenomics #BinanceAngels
KEY TAKEAWAY
Altcoin value comes from utility, not price. Five functional categories drive real demand: smart-contract platforms, DeFi primitives, infrastructure, scaling, and app-specific tokens.
EVIDENCE
1. Smart-contract platforms (ETH, SOL, AVAX): Execute code, settle assets — compute layer revenue from gas fees, staking yield, deployment activity
2. DeFi primitives (UNI, AAVE, CRV): Financial infrastructure — protocol fees, TVL growth, governance revenue
3. Infrastructure (LINK, GRT, AR): Oracles, indexing, storage — usage fees from dApps, query volume, data demand
4. Scaling (ARB, OP, MATIC): Throughput solutions — transaction fees, bridged TVL, developer activity
5. App-specific (RENDER, FET, AKT): Niche compute/markets — service revenue, network utilization, token burn/buyback
ANALYSIS
Most altcoins trend toward zero vs BTC over time. Separating signal from noise requires:
- Real revenue/fees (not token inflation)
- Active developers + growing TVL/users
- Liquid markets on Binance (spot + perpetuals)
- Clear catalyst calendar (upgrades, unlocks, governance votes)
- Relative strength vs BTC (ETH/BTC, SOL/BTC charts)
SCENARIOS
Bullish: Alt sector shows broad relative strength vs BTC, TVL expanding, developer activity rising
Neutral: Selective rotation — only categories with revenue catalysts outperform
Bearish: Capital consolidates into BTC; alts bleed on low volume, failed catalysts
BINANCE ANGLE
Binance tools for alt research: Token X-Ray (profile/health/security), Market Breadth (participation), Sector Rotation (narrative heat), Funding Analysis (leverage positioning). Use these to filter tradable vs speculative.
CONCLUSION
Trade the trend, don't marry the bag. Value accrues to protocols with sustainable revenue, active users, and liquid markets — not to narratives alone.
Binance Angels
#Altcoins #Tokenomics #BinanceAngels
Have you noticed how almost every new token launches with an FDV that's 5-10x the market cap, leaving buyers holding the bag when unlocks hit?
That's the pain most crypto traders face. They FOMO into what looks like a cheap entry only to watch price bleed as more supply floods the market, never knowing when to exit because the real valuation was hidden.
$PONS is sitting at around $0.95 right now with a reported $670M market cap and nearly identical $670M FDV. That alignment means there's no massive overhang of locked tokens waiting to dump.
In a market where $BTC dominance keeps squeezing alts, this kind of tokenomics stands out because the circulating supply appears to match the total. Traders who ignore this ratio keep getting rugged by dilution while others quietly accumulate projects without that risk.
If you want to avoid those losses, start checking market cap against FDV on every potential buy. Look at the actual circulating numbers before you enter, not just the hype around a $0.95 price. $ETH has shown how fully unlocked assets can hold better during downturns compared to high unlock schedules.
Where do you think tokens with matching market cap and FDV go from here in this cycle?
#PONS #Tokenomics #CryptoTrading
That's the pain most crypto traders face. They FOMO into what looks like a cheap entry only to watch price bleed as more supply floods the market, never knowing when to exit because the real valuation was hidden.
$PONS is sitting at around $0.95 right now with a reported $670M market cap and nearly identical $670M FDV. That alignment means there's no massive overhang of locked tokens waiting to dump.
In a market where $BTC dominance keeps squeezing alts, this kind of tokenomics stands out because the circulating supply appears to match the total. Traders who ignore this ratio keep getting rugged by dilution while others quietly accumulate projects without that risk.
If you want to avoid those losses, start checking market cap against FDV on every potential buy. Look at the actual circulating numbers before you enter, not just the hype around a $0.95 price. $ETH has shown how fully unlocked assets can hold better during downturns compared to high unlock schedules.
Where do you think tokens with matching market cap and FDV go from here in this cycle?
#PONS #Tokenomics #CryptoTrading

Everyone thinks a $0.95 token is “cheap,” but actually price alone tells you almost nothing.
That mistake can trigger FOMO, especially when traders compare $PONS with higher-priced assets like $BTC or $ETH without checking the supply math.
1. Look at market cap: $PONS is reported at roughly $670M, so it is already valued far beyond what the $0.95 price tag suggests. Think of token price as the cost of one pizza slice; market cap tells you the price of the whole pizza.
2. Check FDV: at around $670M, the fully diluted valuation is nearly identical to the current market cap. That may indicate limited dilution between reported circulating and total supply, but the figures still need verification.
3. Avoid judging an entry by unit price. Before buying, inspect liquidity, supply distribution, unlock schedules, and whether the reported valuation is supported by real trading activity.
Would you consider $PONS undervalued at this valuation, or is the low token price misleading?
#PONS #CryptoTrading #Tokenomics
That mistake can trigger FOMO, especially when traders compare $PONS with higher-priced assets like $BTC or $ETH without checking the supply math.
1. Look at market cap: $PONS is reported at roughly $670M, so it is already valued far beyond what the $0.95 price tag suggests. Think of token price as the cost of one pizza slice; market cap tells you the price of the whole pizza.
2. Check FDV: at around $670M, the fully diluted valuation is nearly identical to the current market cap. That may indicate limited dilution between reported circulating and total supply, but the figures still need verification.
3. Avoid judging an entry by unit price. Before buying, inspect liquidity, supply distribution, unlock schedules, and whether the reported valuation is supported by real trading activity.
Would you consider $PONS undervalued at this valuation, or is the low token price misleading?
#PONS #CryptoTrading #Tokenomics
A token can show a $670M valuation while having only about $8.8M in liquidity, which is exactly how a chart can look strong until exits get crowded.
That gap is where traders get trapped: you see buyers pushing $PONS near $0.95, FOMO into the momentum, then discover that selling size moves the market far more than expected. A green chart does not guarantee a liquid exit.
For $PONS, the reported market cap and FDV are both around $670M. FDV, or fully diluted valuation, is the value of every token at today’s price; it does not mean $670M of fresh capital entered the asset. In other words, valuation is a price calculation, not a cash balance.
Buying volume currently appears ahead of selling volume, which supports the bullish case for $PONS. But compare the numbers: roughly $670M valuation versus ~$8.8M liquidity. If sentiment flips, thin liquidity can amplify downside quickly, and even $BTC or $BNB strength may not protect a smaller token from its own liquidity crunch.
Is the current demand enough to absorb sellers if momentum cools?
#Crypto #PONS #Tokenomics
That gap is where traders get trapped: you see buyers pushing $PONS near $0.95, FOMO into the momentum, then discover that selling size moves the market far more than expected. A green chart does not guarantee a liquid exit.
For $PONS, the reported market cap and FDV are both around $670M. FDV, or fully diluted valuation, is the value of every token at today’s price; it does not mean $670M of fresh capital entered the asset. In other words, valuation is a price calculation, not a cash balance.
Buying volume currently appears ahead of selling volume, which supports the bullish case for $PONS. But compare the numbers: roughly $670M valuation versus ~$8.8M liquidity. If sentiment flips, thin liquidity can amplify downside quickly, and even $BTC or $BNB strength may not protect a smaller token from its own liquidity crunch.
Is the current demand enough to absorb sellers if momentum cools?
#Crypto #PONS #Tokenomics

Verified
The tokenomics model for $AEVO is evolving in a very interesting direction. 👁️📉
Unlike projects reliant on constant emissions, AEVO is shifting
toward a revenue-driven, deflationary design:
🔥 **70M+ AEVO Burned:** Supply is actively shrinking.
🔓 **Zero Lock Inflation:** Scheduled unlocks are finished; no surprise supply dumps.
♻️ **Buyback Mechanics:** Monthly exchange trading fees are used to buy back AEVO and remove it from circulation.
🎯 **Fixed Capped Supply:** Weekly trader incentives come from the fixed 1B supply, NOT new issuance.
Comparing this to $AAVE or$DYDX, Aevo’s direct connection between exchange volume and token burn creates a unique feedback loop.
Higher volume = More buyback power. 📈
👇 What’s your take on fee-backed buyback models? Do they hold up in the long run?
*Not financial advice — Lilly!*
#aevo #cryptotrading #defi #Tokenomics
$AEVO
Unlike projects reliant on constant emissions, AEVO is shifting
toward a revenue-driven, deflationary design:
🔥 **70M+ AEVO Burned:** Supply is actively shrinking.
🔓 **Zero Lock Inflation:** Scheduled unlocks are finished; no surprise supply dumps.
♻️ **Buyback Mechanics:** Monthly exchange trading fees are used to buy back AEVO and remove it from circulation.
🎯 **Fixed Capped Supply:** Weekly trader incentives come from the fixed 1B supply, NOT new issuance.
Comparing this to $AAVE or$DYDX, Aevo’s direct connection between exchange volume and token burn creates a unique feedback loop.
Higher volume = More buyback power. 📈
👇 What’s your take on fee-backed buyback models? Do they hold up in the long run?
*Not financial advice — Lilly!*
#aevo #cryptotrading #defi #Tokenomics
$AEVO
Log in to explore more content