

HNIW30
6.6k Beiträge

HNIW30
Melden
Nutzer blockieren
HNIW30 here: Crypto vet sharing no-BS insights from market trenches. Real tactics to beat volatility, minus the hype. 🚨 X: @HNIW30
Trade eröffnen

PEPE Halter
Regelmäßiger Trader
3.3 Jahre
202 Following
12.2K+ Follower
4.0K+ Like gegeben
Beiträge
Portfolio
Alle
Zitierungen
Videos
Live
·
--

Artikel
Übersetzung ansehen
How Tokenization Relies on Legacy Market PlumbingTokenization is often framed as a complete replacement of legacy clearing and settlement systems, yet the reality of market plumbing reveals deep structural interdependence. Traditional post-trade rails continue to process the legal claims backing digital representations of real-world assets. As institutions adopt distributed ledgers, integration with established operational networks remains unavoidable.
The institutional architecture of equity markets relies on shares held in street name across custodians and broker-dealers. Beneficial owners do not interact directly with company registries, creating a complex operational layer for communications and corporate actions. Broadridge processed communications for more than one billion equity positions in fiscal 2026, highlighting the structural scale required to coordinate corporate governance.
Current tokenized securities reflect this hybrid reality rather than a purely native on-chain ecosystem. Industry data indicates that approximately ninety percent of tokenized stocks are structured as notes backed by shares held in conventional custodial accounts. When digital asset issuers handle shareholder voting for token holders, they aggregate preferences and execute them through traditional intermediaries such as Broadridge.
This structural link demonstrates that tokenization does not immediately displace established clearing mechanisms. Instead, financial institutions operate in a parallel environment where books, records, and collateral must reconcile across distributed ledgers and centralized databases. Broadridge has adapted to this shift by deploying its distributed ledger repo platform, which processed roughly 360 billion dollars in tokenized collateral daily in September.
Distributed ledger repo demonstrates how institutional market depth develops through operational efficiency rather than disintermediation. The platform enables automated collateral mobility while preserving regulatory compliance and reconciliation frameworks. Broadridge is expanding these capabilities through its DLX infrastructure, confirming that institutional distributed ledgers function as complementary layers within existing custodial architectures.
Beyond tokenization, institutional infrastructure providers are integrating artificial intelligence to handle exception resolution and trade break investigations. Rather than diminishing the necessity of centralized processing entities, these automated tools reduce friction in legacy workflows. For high-volume market participants, operational continuity and regulatory alignment remain primary constraints when deploying new settlement technologies.
As tokenized assets expand distribution to international venues, the underlying collateral remains anchored in domestic custody networks. This dynamic increases the sheer volume of discrete ownership positions requiring administration. Market depth across both crypto-native protocols and institutional venues will depend on how efficiently intermediaries manage the synchronization between on-chain tokens and foundational off-chain assets.
#Tokenization
How Tokenization Relies on Legacy Market Plumbing
Tokenization is often framed as a complete replacement of legacy clearing and settlement systems, yet the reality of market plumbing reveals deep structural interdependence. Traditional post-trade rails continue to process the legal claims backing digital representations of real-world assets. As institutions adopt distributed ledgers, integration with established operational networks remains unavoidable.
The institutional architecture of equity markets relies on shares held in street name across custodians and broker-dealers. Beneficial owners do not interact directly with company registries, creating a complex operational layer for communications and corporate actions. Broadridge processed communications for more than one billion equity positions in fiscal 2026, highlighting the structural scale required to coordinate corporate governance.
Current tokenized securities reflect this hybrid reality rather than a purely native on-chain ecosystem. Industry data indicates that approximately ninety percent of tokenized stocks are structured as notes backed by shares held in conventional custodial accounts. When digital asset issuers handle shareholder voting for token holders, they aggregate preferences and execute them through traditional intermediaries such as Broadridge.
This structural link demonstrates that tokenization does not immediately displace established clearing mechanisms. Instead, financial institutions operate in a parallel environment where books, records, and collateral must reconcile across distributed ledgers and centralized databases. Broadridge has adapted to this shift by deploying its distributed ledger repo platform, which processed roughly 360 billion dollars in tokenized collateral daily in September.
Distributed ledger repo demonstrates how institutional market depth develops through operational efficiency rather than disintermediation. The platform enables automated collateral mobility while preserving regulatory compliance and reconciliation frameworks. Broadridge is expanding these capabilities through its DLX infrastructure, confirming that institutional distributed ledgers function as complementary layers within existing custodial architectures.
Beyond tokenization, institutional infrastructure providers are integrating artificial intelligence to handle exception resolution and trade break investigations. Rather than diminishing the necessity of centralized processing entities, these automated tools reduce friction in legacy workflows. For high-volume market participants, operational continuity and regulatory alignment remain primary constraints when deploying new settlement technologies.
As tokenized assets expand distribution to international venues, the underlying collateral remains anchored in domestic custody networks. This dynamic increases the sheer volume of discrete ownership positions requiring administration. Market depth across both crypto-native protocols and institutional venues will depend on how efficiently intermediaries manage the synchronization between on-chain tokens and foundational off-chain assets.
#Tokenization
2
36
·
--
Übersetzung ansehen
While frontier artificial intelligence development remains concentrated in the United States and China, AI adoption represents a key determinant of future European productivity growth. Digital investment across the euro area has expanded by 73 percent in real terms since 2014, rising from 2.3 percent to 3.3 percent of gross domestic product. Although digital investment has grown at a faster pace in the United States, spending on technology adoption is providing a measurable stimulus to European economic activity.
The composition of European digital investment is primarily concentrated in intangible assets, whereas physical investment in data centres represents a relatively small share. Corporate survey data indicates that artificial intelligence has added roughly 10 percent to business capital expenditure plans this year. Sectoral indicators reflect this uneven momentum, with technology equipment recording stronger output, employment, and new orders than other manufacturing segments. Within services, the software subsector has outpaced peer areas in output, though without matching gains in employment or new orders.
European firms also participate directly in the international technology supply chain, contributing to equipment flows while investors help fund infrastructure expansion through equity, debt, and banking channels. Trade figures show rapid growth in euro area exports and imports of core data centre goods, including hardware deployed for computing, storage, and networking capacity. Whether these adoption trends translate into sustained aggregate productivity gains remains dependent on how broadly firms integrate these tools into existing operations.
#AIAdoption #DigitalInvestment

56
·
--
Übersetzung ansehen
Stablecoins are rapidly transitioning from trading collateral into core financial infrastructure for institutional operations. A recent agreement between Ripple and Robinhood brings Ripple's digital dollar, RLUSD, directly into institutional trade settlement, corporate financing channels, and automated treasury management. This integration reflects how around-the-clock liquidity and near-instant settlement enable institutions to manage cash without relying on traditional banking hours.
For Robinhood, deploying RLUSD supports its goal of building a global financial superapp that centralizes customer activity across retail and institutional segments. Instead of treating dollar-pegged tokens merely as static trading pairs, the arrangement bundles cash management and settlement technology into unified back-office workflows. Issuers increasingly view this integrated model as essential as institutional clients seek operational efficiency across continuous market cycles.
Significant market hurdles remain despite these expansion efforts. The broader stablecoin sector now exceeds 300 billion dollars in total capitalization, yet Tether's USDT and Circle's USDC continue to dominate liquidity across the industry. RLUSD's market capitalization has grown past 2.5 billion dollars, but displacing entrenched incumbents requires sustained institutional adoption and seamless network integration. Whether multi-service infrastructure models can overcome established stablecoin liquidity networks remains an open question for market participants.
$RLUSD $HOODB #Stablecoins #TreasuryManagement
{spot}(HOODBUSDT)
{spot}(RLUSDUSDT)
Stablecoins are rapidly transitioning from trading collateral into core financial infrastructure for institutional operations. A recent agreement between Ripple and Robinhood brings Ripple's digital dollar, RLUSD, directly into institutional trade settlement, corporate financing channels, and automated treasury management. This integration reflects how around-the-clock liquidity and near-instant settlement enable institutions to manage cash without relying on traditional banking hours.
For Robinhood, deploying RLUSD supports its goal of building a global financial superapp that centralizes customer activity across retail and institutional segments. Instead of treating dollar-pegged tokens merely as static trading pairs, the arrangement bundles cash management and settlement technology into unified back-office workflows. Issuers increasingly view this integrated model as essential as institutional clients seek operational efficiency across continuous market cycles.
Significant market hurdles remain despite these expansion efforts. The broader stablecoin sector now exceeds 300 billion dollars in total capitalization, yet Tether's USDT and Circle's USDC continue to dominate liquidity across the industry. RLUSD's market capitalization has grown past 2.5 billion dollars, but displacing entrenched incumbents requires sustained institutional adoption and seamless network integration. Whether multi-service infrastructure models can overcome established stablecoin liquidity networks remains an open question for market participants.
$RLUSD $HOODB #Stablecoins #TreasuryManagement

59
·
--
Übersetzung ansehen
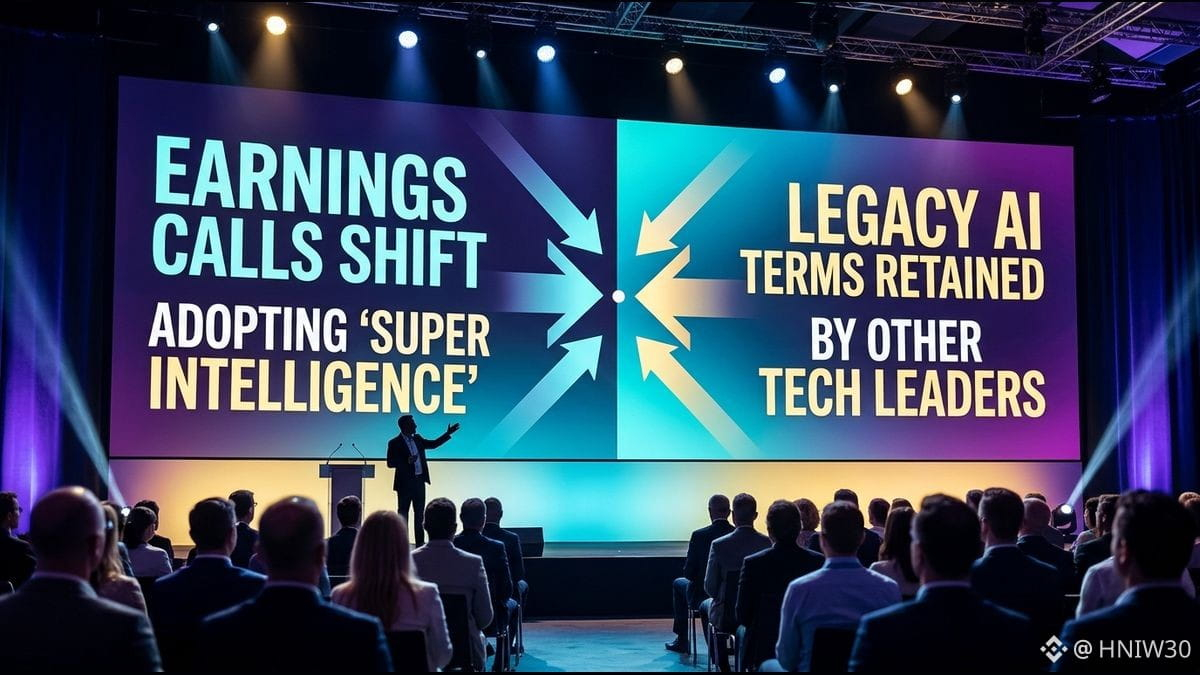
A linguistic shift is emerging across major technology earnings calls as executives weigh whether to adopt political rebranding around artificial intelligence.
Meta CEO Mark Zuckerberg and Tesla CEO Elon Musk adopted the term super intelligence on their third-quarter earnings calls, following an order directing executive branch departments and agencies to replace the term artificial intelligence. Musk referenced the acronym SI while discussing Tesla humanoid robots, following a name change of a rocket division to SpaceXSI. Zuckerberg emphasized delivering personal superintelligence to users, building on Meta Superintelligence Labs established last year.
In contrast, other major technology leaders largely stuck with conventional AI terminology during their quarterly remarks. Amazon CEO Andy Jassy used the acronym AI repeatedly in introductory comments, Alphabet CEO Sundar Pichai credited AI investments with driving user growth, and Microsoft CEO Satya Nadella framed company priorities around designing AI to empower people.
The terminology is nonetheless spreading into corporate disclosures. Microsoft included eight mentions of super intelligence in its annual report letter to shareholders, IBM CEO Arvind Krishna referenced SI alongside AI, and Intel CEO Lip-Bu Tan pointed to demand for super intelligence during industry chip shortages.
While corporate messaging diverges between direct adoption and legacy phrasing, executive disclosures remain tied to commercial performance, infrastructure constraints, and hardware demand.
$METAB $TSLAB #ArtificialIntelligence #Earnings
87
·
--
Hohe Dieselpreise weltweit sorgten im dritten Quartal bei Chevron und ExxonMobil für kräftige Gewinnsteigerungen, da beide Unternehmen ihre US-Raffinerien nahezu an der Kapazitätsgrenze betrieben. Angriffe der Ukraine und des Iran auf Raffinerien in Russland und im Nahen Osten störten die internationalen Lieferketten und trieben die Dieselpreise weltweit in die Höhe. Daraufhin fuhren US-Raffinerien ihre Produktion hoch, um die Versorgungslücke zu schließen.
Chevron meldete für das dritte Quartal einen Nettogewinn von 9,9 Milliarden Dollar – fast 200 Prozent mehr als die 3,5 Milliarden Dollar im Vorjahreszeitraum. Der Gewinn der Raffineriesparte stieg um mehr als 300 Prozent von 1,1 Milliarden auf 4,9 Milliarden Dollar. Chevrons US-Raffinerien verarbeiteten die Rekordmenge von etwas mehr als 1 Million Barrel Rohöl pro Tag und waren zu 98 Prozent ausgelastet. Dadurch stieg die Produktion von Diesel und Kerosin um mehr als 10 Prozent. Die Gesamtproduktion des Konzerns sank leicht auf 3,9 Millionen Barrel pro Tag. Gründe dafür waren das internationale Geschäft und der Konflikt im Nahen Osten.
ExxonMobil verdoppelte seinen Gewinn im dritten Quartal auf 15,4 Milliarden Dollar, nach 7,5 Milliarden Dollar ein Jahr zuvor. Die Raffineriesparte erwirtschaftete rund 7,2 Milliarden Dollar und übertraf damit den Gewinn des Fördergeschäfts von 7,1 Milliarden Dollar. ExxonMobil betrieb seine Raffinerien an der Golfküste mit einer Auslastung von 100 Prozent und erzielte dabei die zweithöchste Dieselproduktion seiner Geschichte.
Beide Unternehmen übertrafen die Gewinnerwartungen der Analysten und die Umsatzprognosen, obwohl die Gesamtförderung leicht zurückging. Chevron meldete einen bereinigten Gewinn je Aktie von 5,28 Dollar bei einem Umsatz von 67,8 Milliarden Dollar. ExxonMobil erzielte einen bereinigten Gewinn je Aktie von 4,23 Dollar bei einem Umsatz von 113,2 Milliarden Dollar.
#Earnings #OilRefining

84
·
--
Übersetzung ansehen
A recent enforcement action highlights an operational risk for crypto investors, showing that public regulatory disclosures can be manipulated to deceive participants. The Securities and Exchange Commission charged BG Wealth Sharing Ltd and DSJ Exchange Pty Ltd for orchestrating an alleged fraud scheme exceeding 130 million dollars that affected tens of thousands of retail investors across dozens of jurisdictions.
According to the complaint, the scheme attracted retail capital by marketing a wealth-sharing program promising extraordinary, risk-free returns through crypto asset trading signals. To manufacture legitimacy, BG Wealth claimed to be the world's largest hedge fund registered with the regulator, partnered with a purported licensed trading platform, DSJ Exchange. The defendants submitted false Form ADV and Form D filings, displaying those public entries and fake regulatory certificates to convince users of official approval.
This action demonstrates the risk of assuming a public filing represents regulatory vetting. Submitting forms to a public database does not constitute official endorsement, licensing, or verification of an investment program. In this case, false filings were combined with marketing across encrypted messaging, live video conferences, a mobile app, and periodic payouts to sustain confidence while funds were misappropriated.
Investors must recognize that promises of risk-free returns paired with trading claims remain significant warning signs. When evaluating platforms, users should verify background information through official resources rather than trusting documentation, seals, or filing records presented by promoters.

2
164
·
--

Artikel
Übersetzung ansehen
Polymarket Vendor Breach Spurs Account RefundsTraders using the international platform of prediction market Polymarket saw unauthorized withdrawals from their wallets on Thursday afternoon. Users initially reported on social media that funds were being moved without approval. The disruption prompted the decentralized finance platform to halt international trading while addressing the problem. Trading resumed at 3 p.m. ET after the team resolved the issue on its end, while its domestic platform remained entirely uncompromised.
The security incident originated from a breach at DebugBear, an external website performance monitoring tool based in the United Kingdom. DebugBear acknowledged on social media that it suffered a security issue on Thursday. Because the service provider is incorporated in Britain, the matter was referred to law enforcement authorities in the United Kingdom. Polymarket confirmed that the vulnerability stemmed from this external vendor rather than an exploit of its own platform operations.
Public blockchain records evaluated by analytics specialists revealed that a single account managed to withdraw at least 2.7 million dollars across 710 separate user wallets during the incident. The international prediction market operates on the Polygon blockchain without regulatory supervision in the United States. Observers highlighted the breach as an unusual and significant event for the venue, particularly given the operational sensitivity surrounding its decentralized finance markets.
To address user losses, the platform pledged to reimburse every affected customer. According to updates shared in a chatroom on Discord, wallets with less than 10,000 dollars taken will have their balances restored by October 30. Account holders who lost larger amounts exceeding that threshold must sign a formal release form before obtaining restitution. While the total number of compromised accounts has not been officially confirmed, the remediation framework sets explicit recovery conditions.
The timing of the disruption is notable as it arrived shortly before the United States midterm elections on November 3. Both the international service and the domestic exchange had anticipated heightened trading volumes in connection with the voting cycle. A similar security issue previously occurred in June, when another third-party vendor was compromised, leading to comparable platform refunds for impacted participants. The recurrence underscores operational challenges with external tools.
External software dependencies continue to introduce security challenges for platforms operating across distributed networks. While core smart contract ledgers on the Polygon network remained intact, peripheral monitoring integrations created an unintended path for unauthorized balance withdrawals. Market participants are left navigating self-administered reimbursement procedures while law enforcement reviews the vendor breach, highlighting ongoing operational dependencies in the sector.
Polymarket Vendor Breach Spurs Account Refunds
Traders using the international platform of prediction market Polymarket saw unauthorized withdrawals from their wallets on Thursday afternoon. Users initially reported on social media that funds were being moved without approval. The disruption prompted the decentralized finance platform to halt international trading while addressing the problem. Trading resumed at 3 p.m. ET after the team resolved the issue on its end, while its domestic platform remained entirely uncompromised.
The security incident originated from a breach at DebugBear, an external website performance monitoring tool based in the United Kingdom. DebugBear acknowledged on social media that it suffered a security issue on Thursday. Because the service provider is incorporated in Britain, the matter was referred to law enforcement authorities in the United Kingdom. Polymarket confirmed that the vulnerability stemmed from this external vendor rather than an exploit of its own platform operations.
Public blockchain records evaluated by analytics specialists revealed that a single account managed to withdraw at least 2.7 million dollars across 710 separate user wallets during the incident. The international prediction market operates on the Polygon blockchain without regulatory supervision in the United States. Observers highlighted the breach as an unusual and significant event for the venue, particularly given the operational sensitivity surrounding its decentralized finance markets.
To address user losses, the platform pledged to reimburse every affected customer. According to updates shared in a chatroom on Discord, wallets with less than 10,000 dollars taken will have their balances restored by October 30. Account holders who lost larger amounts exceeding that threshold must sign a formal release form before obtaining restitution. While the total number of compromised accounts has not been officially confirmed, the remediation framework sets explicit recovery conditions.
The timing of the disruption is notable as it arrived shortly before the United States midterm elections on November 3. Both the international service and the domestic exchange had anticipated heightened trading volumes in connection with the voting cycle. A similar security issue previously occurred in June, when another third-party vendor was compromised, leading to comparable platform refunds for impacted participants. The recurrence underscores operational challenges with external tools.
External software dependencies continue to introduce security challenges for platforms operating across distributed networks. While core smart contract ledgers on the Polygon network remained intact, peripheral monitoring integrations created an unintended path for unauthorized balance withdrawals. Market participants are left navigating self-administered reimbursement procedures while law enforcement reviews the vendor breach, highlighting ongoing operational dependencies in the sector.
186
·
--
Übersetzung ansehen
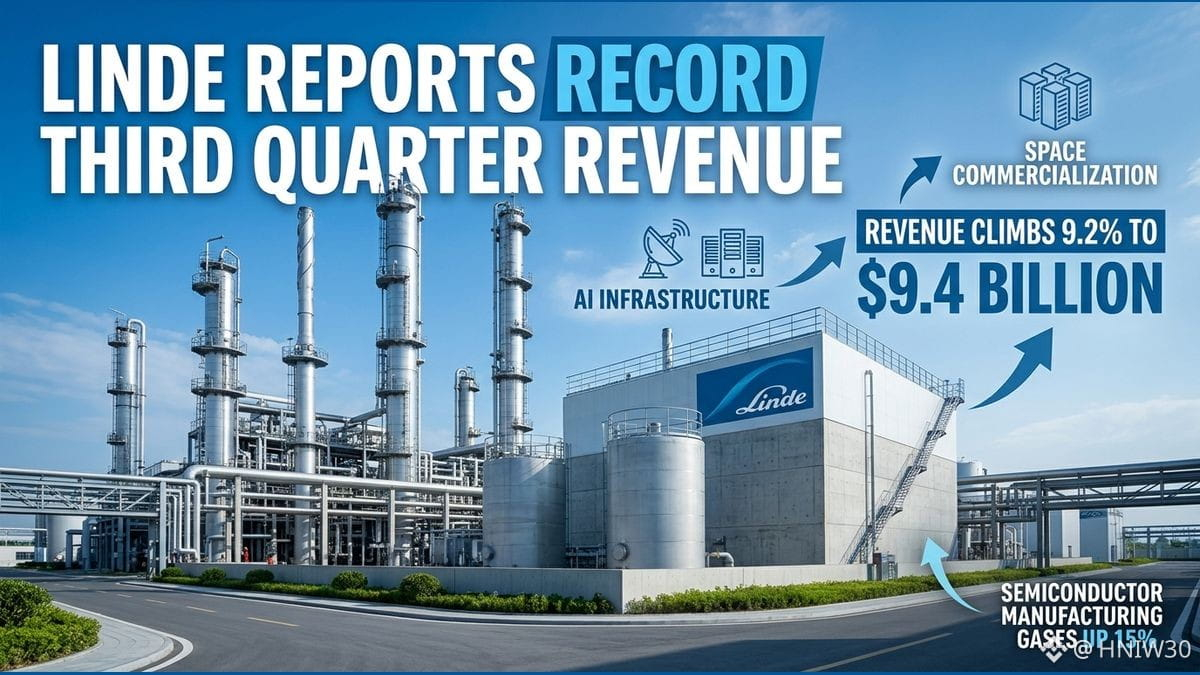
Linde reported record quarterly sales, operating profit, and earnings for its third quarter, lifted by demand from artificial intelligence infrastructure and space commercialization. Revenue climbed 9.2% to $9.4 billion, supported by higher volume and pricing gains.
Adjusted earnings per share rose 9% year over year to $4.59, surpassing expectations. While Linde provided slightly light guidance for the fourth quarter, its full-year outlook remained on par with expectations. Topline growth reflected a 2% volume increase and a 3% price/mix tailwind.
Across end markets, electronics led resilient growth with a 15% sales rise on strong demand for semiconductor manufacturing gases, reaching 10% of total sales. Chemicals and energy sales rose 12% to make up 22% of sales, while manufacturing and metals and mining represented 21% and 12%.
Food and beverage sales rose 3%, while healthcare increased 2%. Geographically, Asia-Pacific sales grew 12% on higher volumes and pricing, Americas sales rose 11%, and Europe, Middle East, and Africa sales climbed 7%. Linde's separate engineering segment also gained 12%.
To address margin pressures at home health unit Lincare, Linde recorded a $425 million restructuring charge, about half for severance. Leadership moved Lincare under the Chief Financial Officer and shifted its reporting to the Other line item while evaluating strategic alternatives.
176
·
--
Übersetzung ansehen
Technological innovation and the arrival of new payment service providers are rapidly reshaping modern payment systems. As novel arrangements develop, central banks must examine how to adapt their policy tools to preserve system safety, efficiency, and public trust in money across an evolving landscape.
The expansion of fast payment systems, non-bank providers, tokenised deposits, stablecoins, and programmable platforms creates clear opportunities for market competition and efficiency. However, these emerging structures also introduce fresh interdependencies and change how credit, liquidity, operational, and cyber risks spread.
Central bank money remains the foundational anchor of trust across the financial system. It supplies the safest and most liquid settlement asset for systemically important networks while sustaining convertibility at par among competing private payment instruments that serve diverse user needs.
Authorities can address these changes through four main responsibilities. As issuers, they determine account access terms. As operators, they modernize settlement infrastructure. As overseers, they assess systemic risks and governance in emerging arrangements. As catalysts, they convene stakeholders to establish shared standards.
Because central bank policies may vary across jurisdictions, sustained and robust international cooperation remains essential. Ongoing cross-border collaboration helps authorities address shared challenges and support financial stability across an increasingly digital and interconnected payments ecosystem.

1
165
·
--

Artikel
Übersetzung ansehen
Mark Price Versus Last Traded Price in BitcoinMany observers look at a screen figure and assume it reflects every aspect of a Bitcoin perpetual contract. In practice, the last traded price and the mark price represent distinct references. The last traded price records the price of the most recent completed trade for an instrument on a venue, rather than the reference used for liquidation checks.
The mark price is a separate reference calculated under a venue's published contract rules, specifically used for liquidation checks. The last traded price and the mark price can differ and must not be treated as identical measurements. Confusing the latest trade execution with the liquidation reference leads to incorrect assessments of a contract.
A common misunderstanding involves chart readings for a Bitcoin perpetual contract. A chart showing last-trade candles does not by itself establish where the mark price was at the same moment. Candle data tracking completed trades cannot reveal the liquidation reference present at that exact second, as the two metrics follow distinct standards.
Proper comparison requires verifying essential details before evaluating any displayed numbers. The display label, selected contract, venue, and timestamp must all be identified before comparing two displayed prices. Overlooking these parameters leads to false comparisons between figures that describe different contracts, venues, or moments.
Account balances also highlight the difference between these references. Unrealized profit or loss can be displayed using different references, so the selected display setting matters for open positions. Meanwhile, realized profit or loss depends on actual opening and closing executions, not merely on the displayed mark reference on the venue.
Order execution further separates these two values. A mark-price value is not a promise that a market order will execute at that value. When entering or exiting a position, actual executions determine the transaction price rather than the mark calculation. The mark reference serves liquidation checks rather than functioning as a guaranteed trade price.
Price differences between these metrics do not indicate directional trends. A gap between last price and mark price alone is not a forecast of future Bitcoin price direction. The existence of a spread merely reflects that the two figures measure different things under venue rules, rather than signaling which way the market will move next.
$BTC
{future}(BTCUSDT)
Mark Price Versus Last Traded Price in Bitcoin
Many observers look at a screen figure and assume it reflects every aspect of a Bitcoin perpetual contract. In practice, the last traded price and the mark price represent distinct references. The last traded price records the price of the most recent completed trade for an instrument on a venue, rather than the reference used for liquidation checks.
The mark price is a separate reference calculated under a venue's published contract rules, specifically used for liquidation checks. The last traded price and the mark price can differ and must not be treated as identical measurements. Confusing the latest trade execution with the liquidation reference leads to incorrect assessments of a contract.
A common misunderstanding involves chart readings for a Bitcoin perpetual contract. A chart showing last-trade candles does not by itself establish where the mark price was at the same moment. Candle data tracking completed trades cannot reveal the liquidation reference present at that exact second, as the two metrics follow distinct standards.
Proper comparison requires verifying essential details before evaluating any displayed numbers. The display label, selected contract, venue, and timestamp must all be identified before comparing two displayed prices. Overlooking these parameters leads to false comparisons between figures that describe different contracts, venues, or moments.
Account balances also highlight the difference between these references. Unrealized profit or loss can be displayed using different references, so the selected display setting matters for open positions. Meanwhile, realized profit or loss depends on actual opening and closing executions, not merely on the displayed mark reference on the venue.
Order execution further separates these two values. A mark-price value is not a promise that a market order will execute at that value. When entering or exiting a position, actual executions determine the transaction price rather than the mark calculation. The mark reference serves liquidation checks rather than functioning as a guaranteed trade price.
Price differences between these metrics do not indicate directional trends. A gap between last price and mark price alone is not a forecast of future Bitcoin price direction. The existence of a spread merely reflects that the two figures measure different things under venue rules, rather than signaling which way the market will move next.
$BTC
2
157
·
--

Artikel
Übersetzung ansehen
Comparing Funding Rates Across Time IntervalsPerpetual contract funding is exchanged between long and short positions at scheduled funding times. When reviewing Bitcoin contracts, observers frequently notice the quoted percentage alone. However, evaluating a rate without its funding interval provides incomplete context. A percentage quoted per settlement is not automatically a rate per hour or per day.
Settlement transfers follow specific directional rules at each scheduled funding event. Positive funding means long positions pay short positions, whereas negative funding reverses that direction so shorts pay longs. Crucially, only positions held at the funding time are eligible to pay or receive that settlement during the scheduled execution.
Equal percentages with different intervals cannot be compared directly across perpetual instruments. Because funding intervals and limits differ between instruments and can be adjusted, identical percentage figures produce distinct payment frequencies. Quoted settlement percentages only reflect the discrete cycle assigned to that specific contract.
Market participants must never assume one universal interval applies to all perpetual contracts. Specifications can differ substantially between instruments and can be adjusted over time. A displayed rate must therefore be read together with its funding interval and next settlement timestamp to understand when and how the settlement will execute.
For a USDT perpetual example, the funding fee depends on position value and the applicable funding rate at the funding time. This transfer represents an exchange between long and short contract holders rather than price performance. Position size and the precise settlement rate determine the total amount transferred between the participating sides.
Funding receipts remain separate from profit or loss caused by contract price changes. Furthermore, a positive rate alone neither guarantees future receipts nor predicts Bitcoin price direction. Observed settlement terms reflect only the immediate scheduled interval, meaning future settlements cannot be assumed from current or historical figures.
Comparing funding schedules requires evaluating the stated rate in conjunction with its operational interval. Without the settlement timestamp and interval length, an isolated percentage provides insufficient context. Understanding how intervals differ ensures that Bitcoin perpetual funding terms are evaluated under their true contractual timing.
$BTC
{future}(BTCUSDT)
Comparing Funding Rates Across Time Intervals
Perpetual contract funding is exchanged between long and short positions at scheduled funding times. When reviewing Bitcoin contracts, observers frequently notice the quoted percentage alone. However, evaluating a rate without its funding interval provides incomplete context. A percentage quoted per settlement is not automatically a rate per hour or per day.
Settlement transfers follow specific directional rules at each scheduled funding event. Positive funding means long positions pay short positions, whereas negative funding reverses that direction so shorts pay longs. Crucially, only positions held at the funding time are eligible to pay or receive that settlement during the scheduled execution.
Equal percentages with different intervals cannot be compared directly across perpetual instruments. Because funding intervals and limits differ between instruments and can be adjusted, identical percentage figures produce distinct payment frequencies. Quoted settlement percentages only reflect the discrete cycle assigned to that specific contract.
Market participants must never assume one universal interval applies to all perpetual contracts. Specifications can differ substantially between instruments and can be adjusted over time. A displayed rate must therefore be read together with its funding interval and next settlement timestamp to understand when and how the settlement will execute.
For a USDT perpetual example, the funding fee depends on position value and the applicable funding rate at the funding time. This transfer represents an exchange between long and short contract holders rather than price performance. Position size and the precise settlement rate determine the total amount transferred between the participating sides.
Funding receipts remain separate from profit or loss caused by contract price changes. Furthermore, a positive rate alone neither guarantees future receipts nor predicts Bitcoin price direction. Observed settlement terms reflect only the immediate scheduled interval, meaning future settlements cannot be assumed from current or historical figures.
Comparing funding schedules requires evaluating the stated rate in conjunction with its operational interval. Without the settlement timestamp and interval length, an isolated percentage provides insufficient context. Understanding how intervals differ ensures that Bitcoin perpetual funding terms are evaluated under their true contractual timing.
$BTC
2
110
·
--

Artikel
Übersetzung ansehen
Open Interest Versus Trading Volume in BitcoinMarket participants frequently follow derivatives turnover alongside open contracts, yet these indicators capture entirely different dimensions of market activity. Trading volume records the cumulative sum of contracts exchanged over a defined time window, such as one day. Open interest instead counts unsettled contracts active at an exact moment.
Every derivative contract requires two opposing sides, consisting of exactly one long and one short position. Because both sides always balance across the entire system, aggregate open interest cannot identify whether buyers or sellers are more numerous. A higher figure shows expanded outstanding commitment, not an imbalance of market sentiment.
The mechanics of trade matching explain why volume and open contracts do not move in lockstep. When a new buyer transacts with a new seller, fresh risk enters the market and open interest expands by one contract. When an existing buyer sells to an existing seller who is covering, that contract is extinguished, lowering open interest alongside new volume.
Volume can also accumulate without altering total open contracts. When an incoming buyer purchases a contract from an existing long who is exiting, trading volume increases by one unit while aggregate open interest remains unchanged. In fast markets, rapid contract turnover between active traders can produce elevated volume while open contracts stay flat.
Measurement units introduce additional distinctions across market feeds. Exposures may be quoted in native coins, contract counts, or nominal dollar values. Dollar-denominated totals fluctuate automatically with underlying spot price changes even when no positions change. Observers must separate valuation shifts from genuine changes in market positioning.
Accurate analysis requires strict alignment across reporting venues, contract terms, snapshot times, and observation windows. Comparing twenty-four-hour turnover against a single point-in-time snapshot merges a cumulative flow metric with an inventory balance. Distinguishing the window of trading activity from remaining exposure prevents distorted interpretations.
In Bitcoin perpetual markets, neither open interest nor trading volume offers a reliable directional forecast on its own. Rising open contracts denote growing capital commitment, whereas heavy turnover indicates fast trade execution. Each metric describes structural mechanics rather than price trajectory, serving as descriptive context rather than a trading signal.
$BTC
{future}(BTCUSDT)
Open Interest Versus Trading Volume in Bitcoin
Market participants frequently follow derivatives turnover alongside open contracts, yet these indicators capture entirely different dimensions of market activity. Trading volume records the cumulative sum of contracts exchanged over a defined time window, such as one day. Open interest instead counts unsettled contracts active at an exact moment.
Every derivative contract requires two opposing sides, consisting of exactly one long and one short position. Because both sides always balance across the entire system, aggregate open interest cannot identify whether buyers or sellers are more numerous. A higher figure shows expanded outstanding commitment, not an imbalance of market sentiment.
The mechanics of trade matching explain why volume and open contracts do not move in lockstep. When a new buyer transacts with a new seller, fresh risk enters the market and open interest expands by one contract. When an existing buyer sells to an existing seller who is covering, that contract is extinguished, lowering open interest alongside new volume.
Volume can also accumulate without altering total open contracts. When an incoming buyer purchases a contract from an existing long who is exiting, trading volume increases by one unit while aggregate open interest remains unchanged. In fast markets, rapid contract turnover between active traders can produce elevated volume while open contracts stay flat.
Measurement units introduce additional distinctions across market feeds. Exposures may be quoted in native coins, contract counts, or nominal dollar values. Dollar-denominated totals fluctuate automatically with underlying spot price changes even when no positions change. Observers must separate valuation shifts from genuine changes in market positioning.
Accurate analysis requires strict alignment across reporting venues, contract terms, snapshot times, and observation windows. Comparing twenty-four-hour turnover against a single point-in-time snapshot merges a cumulative flow metric with an inventory balance. Distinguishing the window of trading activity from remaining exposure prevents distorted interpretations.
In Bitcoin perpetual markets, neither open interest nor trading volume offers a reliable directional forecast on its own. Rising open contracts denote growing capital commitment, whereas heavy turnover indicates fast trade execution. Each metric describes structural mechanics rather than price trajectory, serving as descriptive context rather than a trading signal.
$BTC
75
·
--

Artikel
Übersetzung ansehen
Order Book Depth Versus Recent Trade RecordsMarket participants examine order books to inspect resting quotes across a trading pair, yet resting bids and asks reflect conditional interest rather than completed transactions. An order book lists current resting bids and asks for a designated pair. These entries show quantities offered at price levels rather than trades settled on the venue.
Market depth describes the quantities available at displayed price levels within the order book. Depth outlines visible supply and demand offered by participants across those price levels. In an asset like Bitcoin, displayed depth shows how quantities are spread, but this snapshot does not prove completed trades or guarantee future liquidity.
A key characteristic of resting orders is that displayed quotes can change or face cancellation before execution. Participants can adjust quantities or withdraw resting bids and asks entirely prior to a match. Because pending orders can disappear before execution occurs, visible depth cannot be interpreted as guaranteed or permanent liquidity.
In contrast to resting bids and asks, the recent trades display records actual executions rather than pending intent. Every entry on this display confirms an executed trade, showing the quantity and timestamp of the completed match. Once an execution is recorded on this display, it represents a settled event rather than an adjustable quotation.
Distinguishing resting depth from executed volume is essential when analyzing market activity for Bitcoin. A visible cluster of resting bids or asks shows current quantities offered at specific levels, but those orders can change or cancel before execution. Only the recent trades display confirms where transactions actually occurred with a timestamp.
Proper comparisons between market records require identifying the venue, instrument, time, and displayed depth range. A reference like a BTCUSDT Perp card indicates a Bitcoin instrument rather than evidence of execution. Because instruments and venues differ, any comparison must identify the exact venue, instrument, time, and depth range examined.
Examining order books alongside recent trades helps observers separate pending quotes from executed transactions. While an order book snapshot reveals resting bids and asks that can change or cancel at any moment, the recent trades display confirms completed executions with quantity and timestamp, establishing an accurate record of market events.
$BTC
{future}(BTCUSDT)
Order Book Depth Versus Recent Trade Records
Market participants examine order books to inspect resting quotes across a trading pair, yet resting bids and asks reflect conditional interest rather than completed transactions. An order book lists current resting bids and asks for a designated pair. These entries show quantities offered at price levels rather than trades settled on the venue.
Market depth describes the quantities available at displayed price levels within the order book. Depth outlines visible supply and demand offered by participants across those price levels. In an asset like Bitcoin, displayed depth shows how quantities are spread, but this snapshot does not prove completed trades or guarantee future liquidity.
A key characteristic of resting orders is that displayed quotes can change or face cancellation before execution. Participants can adjust quantities or withdraw resting bids and asks entirely prior to a match. Because pending orders can disappear before execution occurs, visible depth cannot be interpreted as guaranteed or permanent liquidity.
In contrast to resting bids and asks, the recent trades display records actual executions rather than pending intent. Every entry on this display confirms an executed trade, showing the quantity and timestamp of the completed match. Once an execution is recorded on this display, it represents a settled event rather than an adjustable quotation.
Distinguishing resting depth from executed volume is essential when analyzing market activity for Bitcoin. A visible cluster of resting bids or asks shows current quantities offered at specific levels, but those orders can change or cancel before execution. Only the recent trades display confirms where transactions actually occurred with a timestamp.
Proper comparisons between market records require identifying the venue, instrument, time, and displayed depth range. A reference like a BTCUSDT Perp card indicates a Bitcoin instrument rather than evidence of execution. Because instruments and venues differ, any comparison must identify the exact venue, instrument, time, and depth range examined.
Examining order books alongside recent trades helps observers separate pending quotes from executed transactions. While an order book snapshot reveals resting bids and asks that can change or cancel at any moment, the recent trades display confirms completed executions with quantity and timestamp, establishing an accurate record of market events.
$BTC
117
·
--

Artikel
Übersetzung ansehen
Reading Bitcoin Market Screens With the Label and the EvidenceA Bitcoin chart starts with a named instrument. The same asset can appear in a spot market or in a perpetual contract, and those labels describe different products. Before interpreting a screenshot, read the visible market name rather than replacing it with a familiar symbol. A careful reading keeps the instrument label attached to the evidence, so the image is not used to make claims about a different market.
The selected interval tells the reader how each candle groups recorded prices. It does not specify how much history is visible across the screen. Zoom, scrolling and the width of the display also affect that view. A useful caption states the observed interval and avoids inventing a date range that the screenshot does not establish.
A standard candle summarizes open, high, low and close for its interval. Those four values do not reveal the full sequence of trades within the candle. The high may have occurred before the low or after it. A reader who needs that sequence must consult more detailed data rather than treating the candle shape as a complete record.
Colors can help separate candles, but they are not a substitute for labels and values. A chart theme may use different colors from the examples in an article. An explanation should describe the relationship between the opening and closing values instead of assuming that every platform uses the same visual settings. The first illustration reinforces this distinction.
A perpetual contract card identifies a related market. Its presence in an article does not prove that the author opened a position or that a trade is suitable for the reader. The related Bitcoin instrument should remain clearly labeled so that readers can distinguish a market reference from a completed account action. No live quote, funding rate, liquidation amount or account balance is asserted.
The second illustration connects the chart interval with the limits of a screenshot. A still image records one view at one moment, while market data can continue changing. If the capture time is unavailable, the article should acknowledge that missing context. It should not create a precise timestamp or describe the picture as a current trading signal.
When sharing a market screen, keep its explanation close to the image. Preserve the instrument name and interval, distinguish observed values from missing context, and avoid treating a related market card as evidence of execution. These small details make an article easier to check. They also give readers a clearer account of what the screen actually establishes and what remains unknown.
$BTC
{future}(BTCUSDT)
Reading Bitcoin Market Screens With the Label and the Evidence
A Bitcoin chart starts with a named instrument. The same asset can appear in a spot market or in a perpetual contract, and those labels describe different products. Before interpreting a screenshot, read the visible market name rather than replacing it with a familiar symbol. A careful reading keeps the instrument label attached to the evidence, so the image is not used to make claims about a different market.
The selected interval tells the reader how each candle groups recorded prices. It does not specify how much history is visible across the screen. Zoom, scrolling and the width of the display also affect that view. A useful caption states the observed interval and avoids inventing a date range that the screenshot does not establish.
A standard candle summarizes open, high, low and close for its interval. Those four values do not reveal the full sequence of trades within the candle. The high may have occurred before the low or after it. A reader who needs that sequence must consult more detailed data rather than treating the candle shape as a complete record.
Colors can help separate candles, but they are not a substitute for labels and values. A chart theme may use different colors from the examples in an article. An explanation should describe the relationship between the opening and closing values instead of assuming that every platform uses the same visual settings. The first illustration reinforces this distinction.
A perpetual contract card identifies a related market. Its presence in an article does not prove that the author opened a position or that a trade is suitable for the reader. The related Bitcoin instrument should remain clearly labeled so that readers can distinguish a market reference from a completed account action. No live quote, funding rate, liquidation amount or account balance is asserted.
The second illustration connects the chart interval with the limits of a screenshot. A still image records one view at one moment, while market data can continue changing. If the capture time is unavailable, the article should acknowledge that missing context. It should not create a precise timestamp or describe the picture as a current trading signal.
When sharing a market screen, keep its explanation close to the image. Preserve the instrument name and interval, distinguish observed values from missing context, and avoid treating a related market card as evidence of execution. These small details make an article easier to check. They also give readers a clearer account of what the screen actually establishes and what remains unknown.
$BTC
2
148
·
--

Artikel
Was eine Bitcoin-Kerze Marktbeobachtern nicht zeigen kannEine einzelne Bitcoin-Kerze erweckt den Eindruck einer vollständigen Geschichte, verbirgt jedoch den tatsächlichen Kursverlauf. Betrachter sehen sich oft ein einzelnes Intervall in einem Chart an und nehmen an, sie wüssten, wie sich der Handel während dieses Zeitraums entwickelt hat. Tatsächlich fasst eine Kerze für ein Standardintervall nur vier Kurse zusammen: Eröffnung, Hoch, Tief und Schluss. Alles, was zwischen diesen Punkten geschieht, bleibt unberücksichtigt.
Der Aufbau dieses Formats ist einfach. Der Eröffnungskurs ist der erste während des gewählten Intervalls erfasste Kurs, während der Schlusskurs der letzte erfasste Kurs ist. Hoch und Tief markieren die Extremwerte, die während des Zeitraums erreicht wurden, und bilden die Dochte. Der Kerzenkörper umfasst die Spanne zwischen Eröffnungs- und Schlusskurs und verdichtet die Handelsaktivität, ohne die vollständige Abfolge der Geschäfte abzubilden.
Was eine Bitcoin-Kerze Marktbeobachtern nicht zeigen kann
Eine einzelne Bitcoin-Kerze erweckt den Eindruck einer vollständigen Geschichte, verbirgt jedoch den tatsächlichen Kursverlauf. Betrachter sehen sich oft ein einzelnes Intervall in einem Chart an und nehmen an, sie wüssten, wie sich der Handel während dieses Zeitraums entwickelt hat. Tatsächlich fasst eine Kerze für ein Standardintervall nur vier Kurse zusammen: Eröffnung, Hoch, Tief und Schluss. Alles, was zwischen diesen Punkten geschieht, bleibt unberücksichtigt.
Der Aufbau dieses Formats ist einfach. Der Eröffnungskurs ist der erste während des gewählten Intervalls erfasste Kurs, während der Schlusskurs der letzte erfasste Kurs ist. Hoch und Tief markieren die Extremwerte, die während des Zeitraums erreicht wurden, und bilden die Dochte. Der Kerzenkörper umfasst die Spanne zwischen Eröffnungs- und Schlusskurs und verdichtet die Handelsaktivität, ohne die vollständige Abfolge der Geschäfte abzubilden.
Der Aufbau dieses Formats ist einfach. Der Eröffnungskurs ist der erste während des gewählten Intervalls erfasste Kurs, während der Schlusskurs der letzte erfasste Kurs ist. Hoch und Tief markieren die Extremwerte, die während des Zeitraums erreicht wurden, und bilden die Dochte. Der Kerzenkörper umfasst die Spanne zwischen Eröffnungs- und Schlusskurs und verdichtet die Handelsaktivität, ohne die vollständige Abfolge der Geschäfte abzubilden.
1
98
·
--

Artikel
Übersetzung ansehen
Understanding Settlement Units in Bitcoin Futures ContractsEvaluating an account summary begins with understanding result denomination rather than numerical size. In Bitcoin futures, a recorded return cannot be properly interpreted without identifying the settlement currency. An identical numerical change represents completely different units depending on whether settlement occurs in cryptocurrency or a stablecoin.
Binance educational materials state that market exposure and settlement currency are distinct contract elements. A Bitcoin futures contract provides exposure to Bitcoin price movements while potentially settling results in another asset. Exposure follows market direction, but tracking price changes does not mean the final profit or loss is settled in Bitcoin.
USD-margined contracts reflect this structure as linear instruments quoted and settled in USDT or USDC rather than inverse designs. For market participants using these products, all financial gains and losses are denominated directly in the chosen stable asset. The contract provides Bitcoin price exposure, but the realized outcome is measured in the designated stable unit.
Coin-margined contracts use the underlying cryptocurrency as their settlement medium. In a coin-margined Bitcoin contract, profit and loss settle directly in BTC. Observers must recognize that a BTC-denominated result and a USDT-denominated result represent distinct units that cannot be treated as directly equal quantities when assessing overall portfolio changes.
Contract names identify structural distinctions rather than active holdings. For example, the BTCUSDT Perp label designates a linear perpetual contract settled in USDT, not a coin-margined instrument. Relying on a label without reviewing specifications can lead to confusion. A product ticker alone does not confirm account eligibility, trades, or current assets.
Settlement currency should not be confused with contract duration. Both USD-margined and coin-margined lines offer perpetual instruments as well as dated products. Coin settlement must never be equated with perpetual duration. In addition, expiry represents a contract feature rather than a guarantee that any individual position can remain open indefinitely.
Collateral eligibility depends on the specific contract design and selected account mode. Educational documentation notes that observers should not assume every USD-margined account accepts only a single stablecoin. Readers should consult governing contract rules and specifications to verify product parameters, collateral rules, and settlement denomination details.
$BTC
{future}(BTCUSDT)
Understanding Settlement Units in Bitcoin Futures Contracts
Evaluating an account summary begins with understanding result denomination rather than numerical size. In Bitcoin futures, a recorded return cannot be properly interpreted without identifying the settlement currency. An identical numerical change represents completely different units depending on whether settlement occurs in cryptocurrency or a stablecoin.
Binance educational materials state that market exposure and settlement currency are distinct contract elements. A Bitcoin futures contract provides exposure to Bitcoin price movements while potentially settling results in another asset. Exposure follows market direction, but tracking price changes does not mean the final profit or loss is settled in Bitcoin.
USD-margined contracts reflect this structure as linear instruments quoted and settled in USDT or USDC rather than inverse designs. For market participants using these products, all financial gains and losses are denominated directly in the chosen stable asset. The contract provides Bitcoin price exposure, but the realized outcome is measured in the designated stable unit.
Coin-margined contracts use the underlying cryptocurrency as their settlement medium. In a coin-margined Bitcoin contract, profit and loss settle directly in BTC. Observers must recognize that a BTC-denominated result and a USDT-denominated result represent distinct units that cannot be treated as directly equal quantities when assessing overall portfolio changes.
Contract names identify structural distinctions rather than active holdings. For example, the BTCUSDT Perp label designates a linear perpetual contract settled in USDT, not a coin-margined instrument. Relying on a label without reviewing specifications can lead to confusion. A product ticker alone does not confirm account eligibility, trades, or current assets.
Settlement currency should not be confused with contract duration. Both USD-margined and coin-margined lines offer perpetual instruments as well as dated products. Coin settlement must never be equated with perpetual duration. In addition, expiry represents a contract feature rather than a guarantee that any individual position can remain open indefinitely.
Collateral eligibility depends on the specific contract design and selected account mode. Educational documentation notes that observers should not assume every USD-margined account accepts only a single stablecoin. Readers should consult governing contract rules and specifications to verify product parameters, collateral rules, and settlement denomination details.
$BTC
99
·
--

Artikel
Übersetzung ansehen
Why Bitcoin Futures Chart and Liquidation References DifferWhen reviewing a Bitcoin perpetual futures screen on Binance, observers see two separate figures, Last Price and Mark Price. Although these values often appear close, they serve distinct operational functions. Confusing them can lead to misunderstandings regarding position valuation and risk triggers. Bitcoin perpetual contracts illustrate why tracking the distinction between these two references is critical.
Last Price represents the latest executed contract trade price for the Bitcoin perpetual contract. It records the specific value at which the most recent trade occurred. Because Last Price only reflects the latest executed transaction, it can exhibit short-term last-price volatility. Looking at Last Price by itself does not provide an overview of position health or account stability.
Mark Price is a separate price reference used for unrealized profit and loss and liquidation calculations. The two prices can differ. On Binance, Mark Price is intended to reduce unnecessary liquidations resulting from short-term last-price volatility. By separating contract risk assessments from the latest trade price, Mark Price acts as an independent reference for open contract status.
Although Mark Price limits disruptions from brief price spikes, it does not remove liquidation risk. Liquidation relates to insufficient margin against maintenance requirements. If a Bitcoin perpetual position lacks adequate margin backing, liquidation occurs when maintenance requirements are breached, regardless of the protective intent behind the mark pricing mechanism.
A mark reference does not guarantee an execution price. Mark Price is an accounting benchmark for position monitoring, not a guaranteed transaction quote. When contract orders execute, they fill based on actual market trading rather than the Mark Price figure. Observers should not expect realized execution prices to match the mark reference displayed on the interface.
Interpreting interface labels accurately is essential when analyzing contracts. The label BTCUSDT Perp is an instrument label, not proof of a trade or asset ownership. Furthermore, a screenshot of Last Price alone is not the full liquidation reference. Determining account health requires evaluating maintenance requirements and margin balances rather than an isolated trade print.
Recognizing the boundary between Last Price and Mark Price ensures an accurate understanding of Bitcoin perpetual futures. Last Price shows the latest executed trade price, while Mark Price governs unrealized profit and loss and liquidation calculations. Understanding these distinctions helps market participants review contract interfaces clearly and without false expectations.
$BTC
{future}(BTCUSDT)
Why Bitcoin Futures Chart and Liquidation References Differ
When reviewing a Bitcoin perpetual futures screen on Binance, observers see two separate figures, Last Price and Mark Price. Although these values often appear close, they serve distinct operational functions. Confusing them can lead to misunderstandings regarding position valuation and risk triggers. Bitcoin perpetual contracts illustrate why tracking the distinction between these two references is critical.
Last Price represents the latest executed contract trade price for the Bitcoin perpetual contract. It records the specific value at which the most recent trade occurred. Because Last Price only reflects the latest executed transaction, it can exhibit short-term last-price volatility. Looking at Last Price by itself does not provide an overview of position health or account stability.
Mark Price is a separate price reference used for unrealized profit and loss and liquidation calculations. The two prices can differ. On Binance, Mark Price is intended to reduce unnecessary liquidations resulting from short-term last-price volatility. By separating contract risk assessments from the latest trade price, Mark Price acts as an independent reference for open contract status.
Although Mark Price limits disruptions from brief price spikes, it does not remove liquidation risk. Liquidation relates to insufficient margin against maintenance requirements. If a Bitcoin perpetual position lacks adequate margin backing, liquidation occurs when maintenance requirements are breached, regardless of the protective intent behind the mark pricing mechanism.
A mark reference does not guarantee an execution price. Mark Price is an accounting benchmark for position monitoring, not a guaranteed transaction quote. When contract orders execute, they fill based on actual market trading rather than the Mark Price figure. Observers should not expect realized execution prices to match the mark reference displayed on the interface.
Interpreting interface labels accurately is essential when analyzing contracts. The label BTCUSDT Perp is an instrument label, not proof of a trade or asset ownership. Furthermore, a screenshot of Last Price alone is not the full liquidation reference. Determining account health requires evaluating maintenance requirements and margin balances rather than an isolated trade print.
Recognizing the boundary between Last Price and Mark Price ensures an accurate understanding of Bitcoin perpetual futures. Last Price shows the latest executed trade price, while Mark Price governs unrealized profit and loss and liquidation calculations. Understanding these distinctions helps market participants review contract interfaces clearly and without false expectations.
$BTC
1
86
·
--
Übersetzung ansehen
Funding payments are exchanged between long and short perpetual futures position holders rather than serving as guaranteed returns. When the funding rate is positive, long positions normally pay short positions. When the funding rate is negative, short positions pay long positions.
The primary role of this mechanism is to help keep perpetual contract prices close to underlying markets. However, the mechanism does not guarantee that perpetual contract prices will be identical to underlying market prices. The alignment between markets is never absolute or guaranteed.
A displayed funding rate is not a guaranteed profit. Funding rates and settlement intervals may vary by contract, and both can change over time. Because funding payments are transferred between positions, funding directly affects margin balances and overall risk.
Market participants must separate funding rate mechanics from predictable returns. Because rates can change and settlement intervals vary across contracts, a displayed rate cannot be viewed as a dependable return or guaranteed payment. Funding remains a mechanism that influences margin balances and risk, not a promise of profit.

1
153
·
--
Übersetzung ansehen
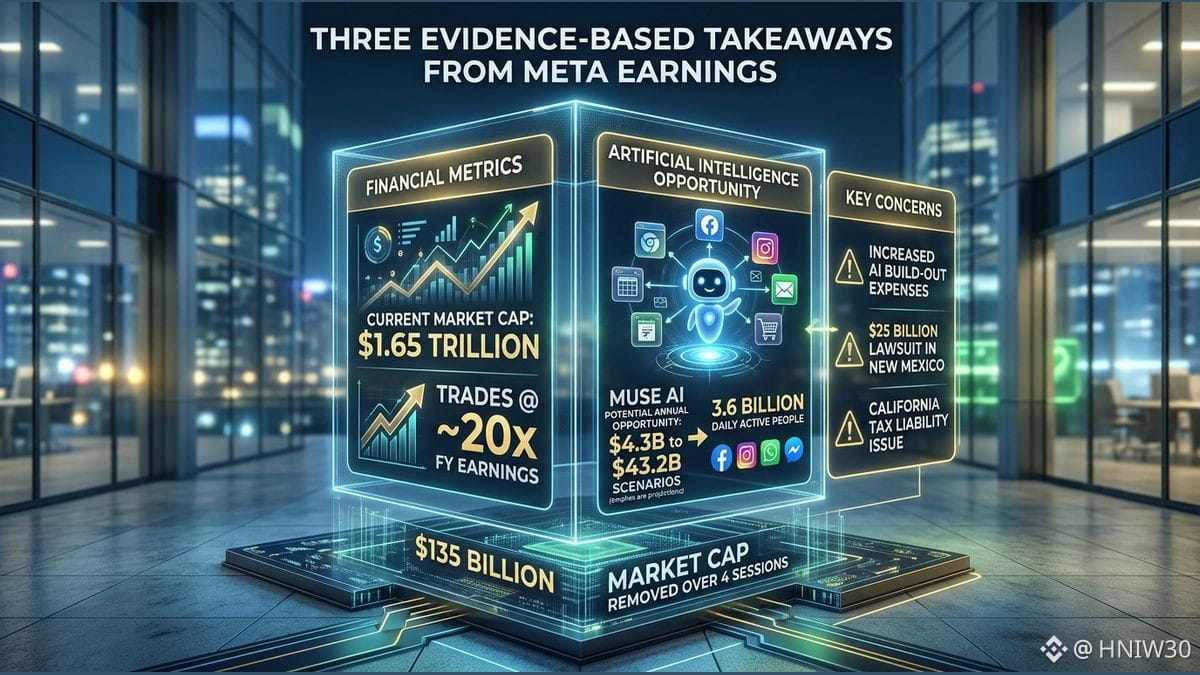
Meta reported stellar earnings this week, but concerns about its artificial intelligence buildout expenses removed 135 billion dollars from its market capitalization over four sessions. The evidence places Meta at a current market capitalization of 1.65 trillion dollars and says the company trades at just under seven times revenue, about 20 times fiscal year earnings, and less than 17 times estimated fiscal 2027 earnings.
The product opportunity remains conditional. Muse is described as a personal artificial intelligence agent that could open browsers, fill out forms, send emails, schedule appointments, book travel, and potentially make purchases. Meta's daily active people across Facebook, Instagram, WhatsApp, and Messenger are given as 3.6 billion. If Muse created 120 dollars of annual value and reached one percent of that audience, the implied annual opportunity would be about 4.3 billion dollars. If it created half that value and reached 20 percent, the implied opportunity would be about 43.2 billion dollars. These are scenarios, not reported revenue.
The evidence also identifies several concerns beyond artificial intelligence spending. They include a 25 billion dollar lawsuit in New Mexico, a potential public relations issue involving an agreement with the founder related to possible tax liabilities in California, and concerns about debt used to finance the company's artificial intelligence investment. A cited options example uses a December short strangle with 580 and 745 strikes and about 21.30 dollars per share in premium at the stated closing prices. These details describe the example and do not establish a guaranteed outcome.
#Crypto
1
95
·
--
Übersetzung ansehen
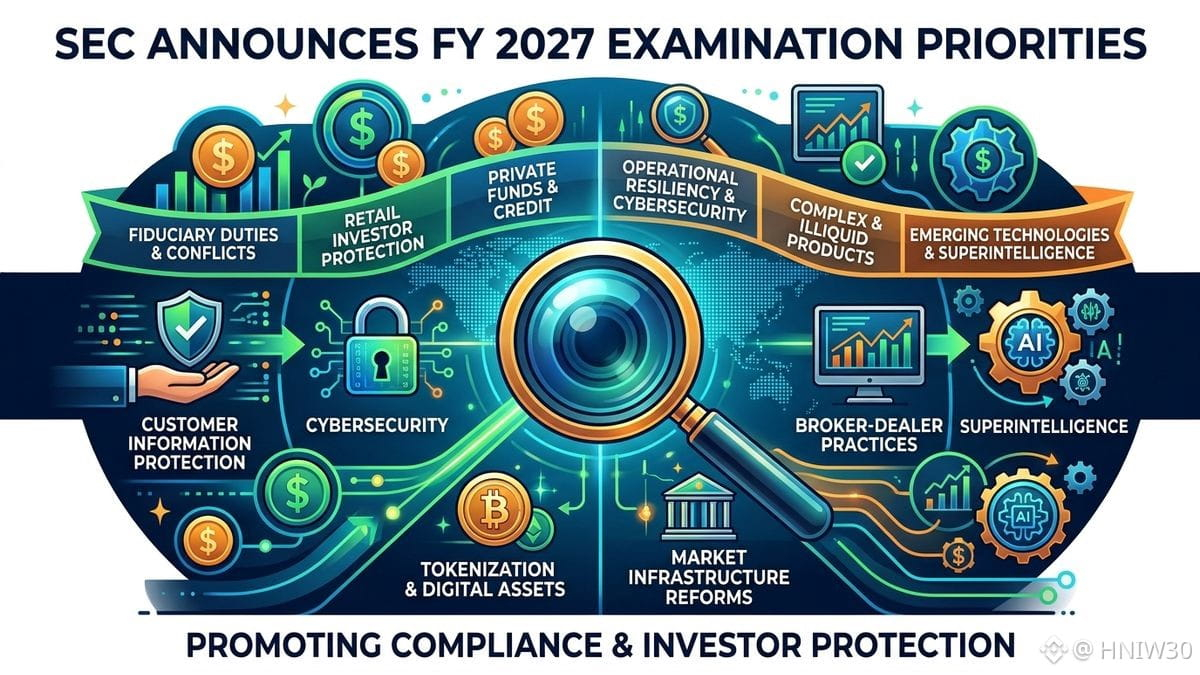
The Securities and Exchange Commission announced the Division of Examinations' priorities for fiscal year 2027 on Oct. 23, 2026. The annual priorities identify areas of focus as the Division carries out its mission to promote compliance, prevent fraud, identify and monitor risk, and inform Commission policy.
The priorities cover examination activities across more than 34,000 registrants, including investment advisers, investment companies, broker dealers, self regulatory organizations, clearing agencies, municipal advisors, transfer agents, funding portals, and security based swap entities. Key areas include fiduciary obligations and conflicts of interest, retail investor protection, complex and illiquid products, private funds and private credit, broker dealer financial responsibility and trading practices, supervision, anti money laundering compliance, operational resiliency, cybersecurity, and protection of customer information.
The Division also identified emerging technologies, including super intelligence and other advanced technologies, as areas that may affect market operations, compliance, fraud prevention, and investor protection. Other priorities include evolving market infrastructure, Treasury clearing reforms, tokenization, and related developments.
The priorities are not an exhaustive list of matters that examiners may review. The Division said it will continue to assess risks during the fiscal year and may adjust its focus in response to market events, investor concerns, emerging technologies, new products and services, and other developments. Firms are expected to maintain strong, risk based compliance programs tailored to their businesses.
#Crypto
1
1
192
Anmelden und weiter Inhalte entdecken
Krypto-Nutzer weltweit auf Binance Square kennenlernen
⚡️ Bleib in Sachen Krypto stets am Puls.
💬 Die weltgrößte Kryptobörse vertraut darauf.
👍 Erhalte verlässliche Einblicke von verifizierten Creators.
E-Mail-Adresse/Telefonnummer
Trendthemen
UniswapA16zSeekDeFiExemptionFromIllinoisCryptoTax
11,653 Aufrufe
516 Kommentare
Die Debatte über die Besteuerung von Kryptowährungen heizt sich auf, da Uniswap und Andreessen Horowitz ( a16z ) sich für eine Ausnahme für DeFi von den vorgeschlagenen Krypto-Steuervorschriften in Illinois einsetzen. Sie befürchten, dass dezentrale Finanzprotokolle und Plattformen ohne Verwahrungspflicht unfairen Steuerlasten ausgesetzt sein könnten, was Innovationen möglicherweise verlangsamt und die Entwicklung von Kryptowährungen erschwert. DeFi-Plattformen ermöglichen es Nutzern, digitale Vermögenswerte ohne traditionelle Intermediäre zu handeln und zu verwalten. Daher könnte die Anwendung herkömmlicher Finanzsteuervorschriften erhebliche Herausforderungen mit sich bringen. Dies könnte ein wichtiger Moment für die US-Kryptoindustrie werden, da die Regulierungsbehörden ein Gleichgewicht zwischen fairer Besteuerung, Anlegerschutz und Innovation finden müssen. 🚀
Die größte Sorge ist, dass die vorgeschlagene Steuer von 0,2 % auf den Transaktionswert und nicht einfach auf die Handelsgewinne berechnet wird. Uniswap, a16z und der DeFi Education Fund wollen Auszahlungen aus Wallets und Cross-Chain-Bridges davon ausnehmen und lehnen zugleich die Anforderungen zur Aufbewahrung von Private-Key-Aufzeichnungen ab. Illinois hat zugestimmt, die Einführung vorbehaltlich der gerichtlichen Genehmigung bis zum 1. Juli 2027 aufzuschieben. Das Ergebnis könnte beeinflussen, wie andere US-Bundesstaaten die Besteuerung von DeFi angehen. The Defiant +2
Was denkst du 🤔 ? Sollten DeFi-Transaktionen steuerfrei sein, um die Dezentralisierung zu schützen, oder sollten Krypto-Plattformen den traditionellen Steuervorschriften folgen ? 🤔
#UniswapA16zSeekDeFiExemptionFromIllinoisCryptoTax
Volatile
·3 Likes
·88 Aufrufe
HKDollarStablecoinHKDAPToLaunchOnSolana
7,197 Aufrufe
305 Kommentare
$1.5BInLeveragedCryptoBetsLiquidated
23,176 Aufrufe
212 Kommentare