


A Bitcoin chart starts with a named instrument. The same asset can appear in a spot market or in a perpetual contract, and those labels describe different products. Before interpreting a screenshot, read the visible market name rather than replacing it with a familiar symbol. A careful reading keeps the instrument label attached to the evidence, so the image is not used to make claims about a different market.
The selected interval tells the reader how each candle groups recorded prices. It does not specify how much history is visible across the screen. Zoom, scrolling and the width of the display also affect that view. A useful caption states the observed interval and avoids inventing a date range that the screenshot does not establish.

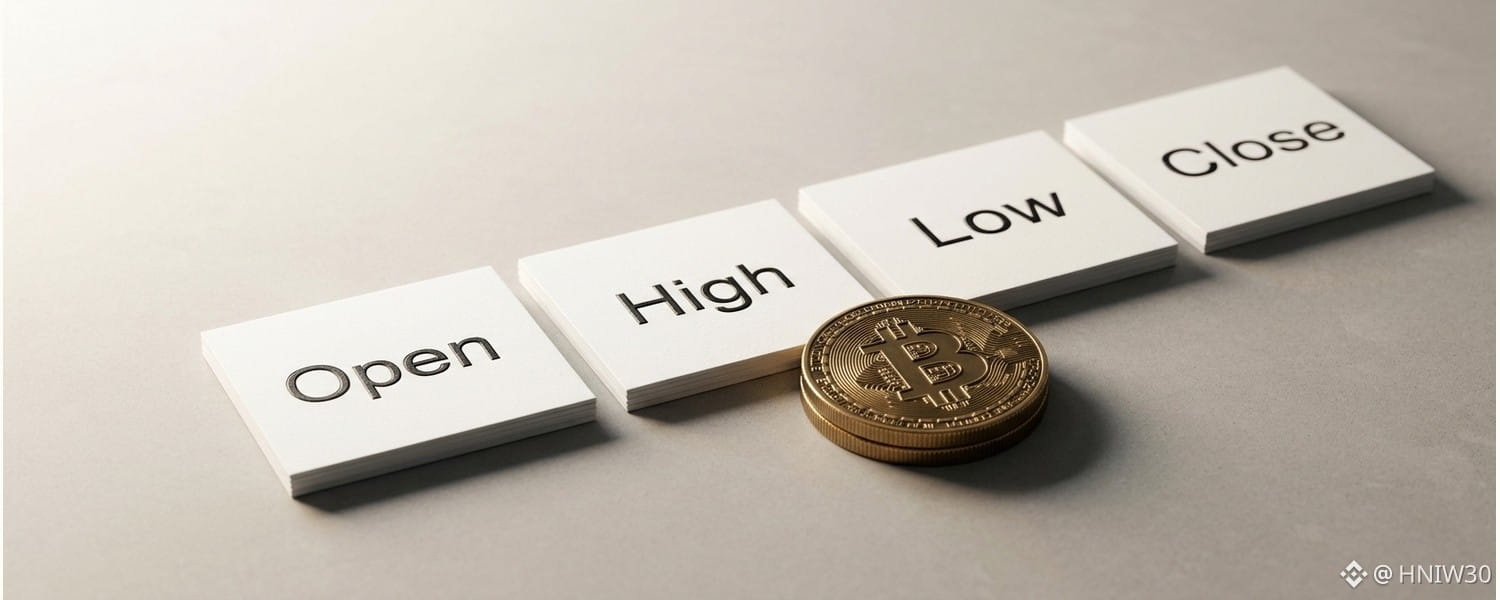
A standard candle summarizes open, high, low and close for its interval. Those four values do not reveal the full sequence of trades within the candle. The high may have occurred before the low or after it. A reader who needs that sequence must consult more detailed data rather than treating the candle shape as a complete record.
Colors can help separate candles, but they are not a substitute for labels and values. A chart theme may use different colors from the examples in an article. An explanation should describe the relationship between the opening and closing values instead of assuming that every platform uses the same visual settings. The first illustration reinforces this distinction.

A perpetual contract card identifies a related market. Its presence in an article does not prove that the author opened a position or that a trade is suitable for the reader. The related Bitcoin instrument should remain clearly labeled so that readers can distinguish a market reference from a completed account action. No live quote, funding rate, liquidation amount or account balance is asserted.
The second illustration connects the chart interval with the limits of a screenshot. A still image records one view at one moment, while market data can continue changing. If the capture time is unavailable, the article should acknowledge that missing context. It should not create a precise timestamp or describe the picture as a current trading signal.
When sharing a market screen, keep its explanation close to the image. Preserve the instrument name and interval, distinguish observed values from missing context, and avoid treating a related market card as evidence of execution. These small details make an article easier to check. They also give readers a clearer account of what the screen actually establishes and what remains unknown.
