

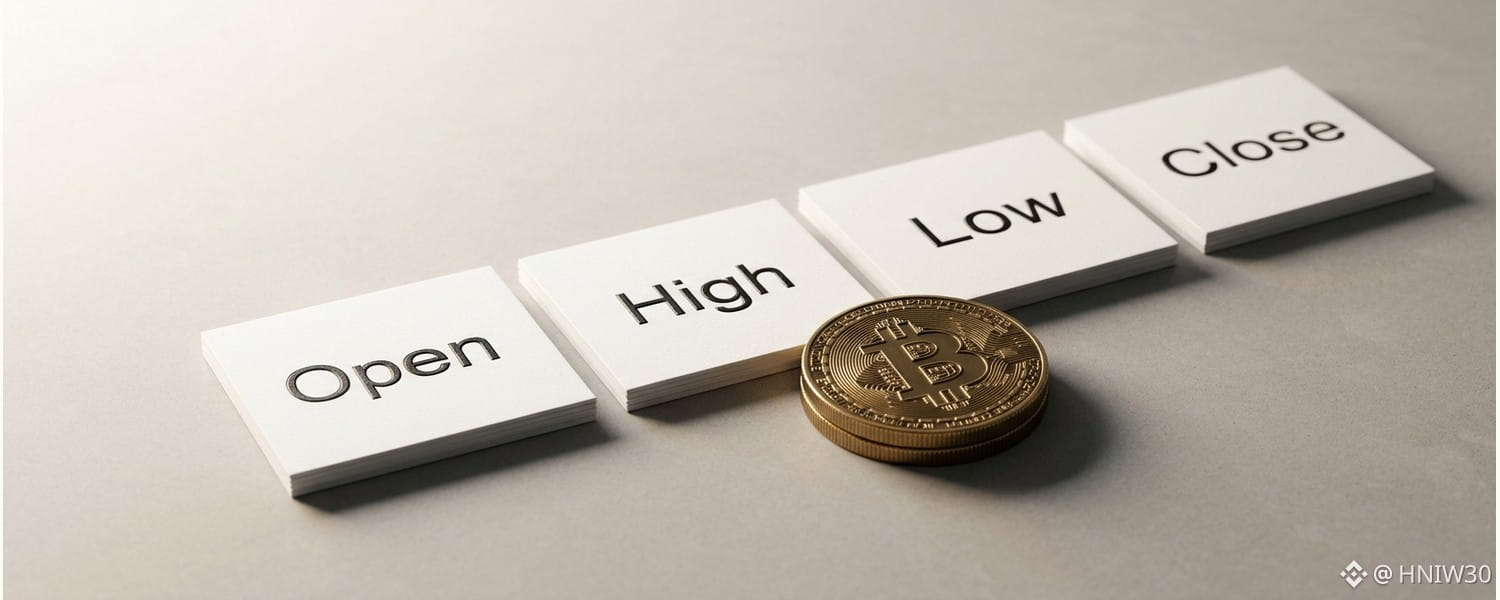

A single Bitcoin candlestick gives the impression of a complete narrative, yet it conceals the actual path of price. Observers often view an individual interval on a chart and assume they understand how trading unfolded across that duration. In reality, a standard interval candle summarizes only four prices: open, high, low, and close. Everything between those points is excluded.

The construction of this format is straightforward. The open is the first recorded price during the chosen interval, whereas the close is the final recorded price. The high and low mark the extreme levels reached during the span, forming the wicks. The candle body covers the open-to-close span, condensing activity without showing the complete sequence of trades.
Crucially, a candle alone cannot establish whether the high occurred before or after the low. A candle displaying extended wicks might reflect an early move toward the high followed by a drop to the low, or the opposite order. It could also stem from repeated swings. Although the final candle appears identical, the actual order of trades is entirely distinct.

Color conventions can also lead to misinterpretation. On common charting interfaces, a green candle normally means that the close finished above the open. That color does not mean that every price movement during the interval was upward. Downward moves can occur inside a green interval, just as upward moves can happen inside an interval that closes lower.
Visual settings require care because platform colors can be customized. Because palettes are adjustable, color alone cannot substitute for exact labels and values. Furthermore, a Bitcoin chart caption should identify the specific instrument and interval. It is inaccurate to assume that every Bitcoin market presents identical data across different charts.
Standard candlesticks must also be separated from alternative charting styles such as Heikin-Ashi. While standard candles present recorded open, high, low, and close values, Heikin-Ashi uses averaged and synthetic values. Because of these modified numbers, standard open, high, low, and close interpretation cannot silently be applied to synthetic displays.
Understanding these boundaries allows observers to read Bitcoin charts with appropriate context. Candlesticks offer a convenient summary of interval extremes, but they do not reveal the complete sequence of trades. Recognizing that candles present boundary values rather than chronological order keeps visual analysis grounded in neutral context checks.
