
#whatwilldrivecryptoandstocks
whatwilldrivecryptoandstocks
1,188 views
56 Discussing
Hot
Latest

·
--
$70,000 is gone, and the market is still deciding what that means. $BTC slipped to $67,568 overnight, its lowest since August, and is hovering near $68,290 this morning, down about 9% on the week. $ETH lost $2,000 and sits near $1,933. SOL cracked below $80 to about $78. XRP briefly gave up $1.00 and is clinging to $1.01. Total market cap fell to about $2.30T after $1.64B in liquidations wiped out 185,000 traders in 24 hours. The trigger was October PPI: up 6.5% year over year, the hottest since November 2022, even with the monthly print a touch softer than forecast. The 10 year yield climbed past 5.13% anyway. US spot $BTC ETFs have now bled for six straight sessions, and stablecoin supply has shrunk $14.2B in 30 days. Fear and Greed sits at 20, extreme fear. Not everything on the news tape is red: JPMorgan now holds close to $1B in crypto linked assets, Coinbase just got final OCC clearance for its federal trust, and Washington sued Arkansas to defend prediction markets. The line in the sand is $67,500 to $68,000. Nvidia reports on Nov 17. Does this weekend close above $68,000, or does the market hand the bears one more leg down? #USPPIMissMayEaseBTCPressure #WhatWillDriveCryptoandStocks'NextRebound?
$70,000 is gone, and the market is still deciding what that means. $BTC slipped to $67,568 overnight, its lowest since August, and is hovering near $68,290 this morning, down about 9% on the week. $ETH lost $2,000 and sits near $1,933. SOL cracked below $80 to about $78. XRP briefly gave up $1.00 and is clinging to $1.01. Total market cap fell to about $2.30T after $1.64B in liquidations wiped out 185,000 traders in 24 hours. The trigger was October PPI: up 6.5% year over year, the hottest since November 2022, even with the monthly print a touch softer than forecast. The 10 year yield climbed past 5.13% anyway. US spot $BTC ETFs have now bled for six straight sessions, and stablecoin supply has shrunk $14.2B in 30 days. Fear and Greed sits at 20, extreme fear. Not everything on the news tape is red: JPMorgan now holds close to $1B in crypto linked assets, Coinbase just got final OCC clearance for its federal trust, and Washington sued Arkansas to defend prediction markets. The line in the sand is $67,500 to $68,000. Nvidia reports on Nov 17. Does this weekend close above $68,000, or does the market hand the bears one more leg down? #USPPIMissMayEaseBTCPressure #WhatWillDriveCryptoandStocks'NextRebound?
229

·
--
Yesterday everyone was waiting for a soft PPI number to save the market. We got it, PPI came in at 0.3% instead of 0.4%, Bitcoin popped toward $70k for about five minutes, then dumped straight through it anyway. Now BTC is sitting around $67,400, under both its 200-day average near $73k and its 200-week average near $68k, and US crypto ETFs just logged a $1.48B weekly outflow, the second biggest ever. So the soft data did not do it, and the dip buyers are not stepping in yet. What do you think actually flips this, a Fed pivot, ETF flows turning, or just time? #WhatWillDriveCryptoandStocks’NextRebound? $BTC
Yesterday everyone was waiting for a soft PPI number to save the market. We got it, PPI came in at 0.3% instead of 0.4%, Bitcoin popped toward $70k for about five minutes, then dumped straight through it anyway. Now BTC is sitting around $67,400, under both its 200-day average near $73k and its 200-week average near $68k, and US crypto ETFs just logged a $1.48B weekly outflow, the second biggest ever. So the soft data did not do it, and the dip buyers are not stepping in yet. What do you think actually flips this, a Fed pivot, ETF flows turning, or just time? #WhatWillDriveCryptoandStocks’NextRebound? $BTC

92

·
--
#WhatWillDriveCryptoandStocks’NextRebound?
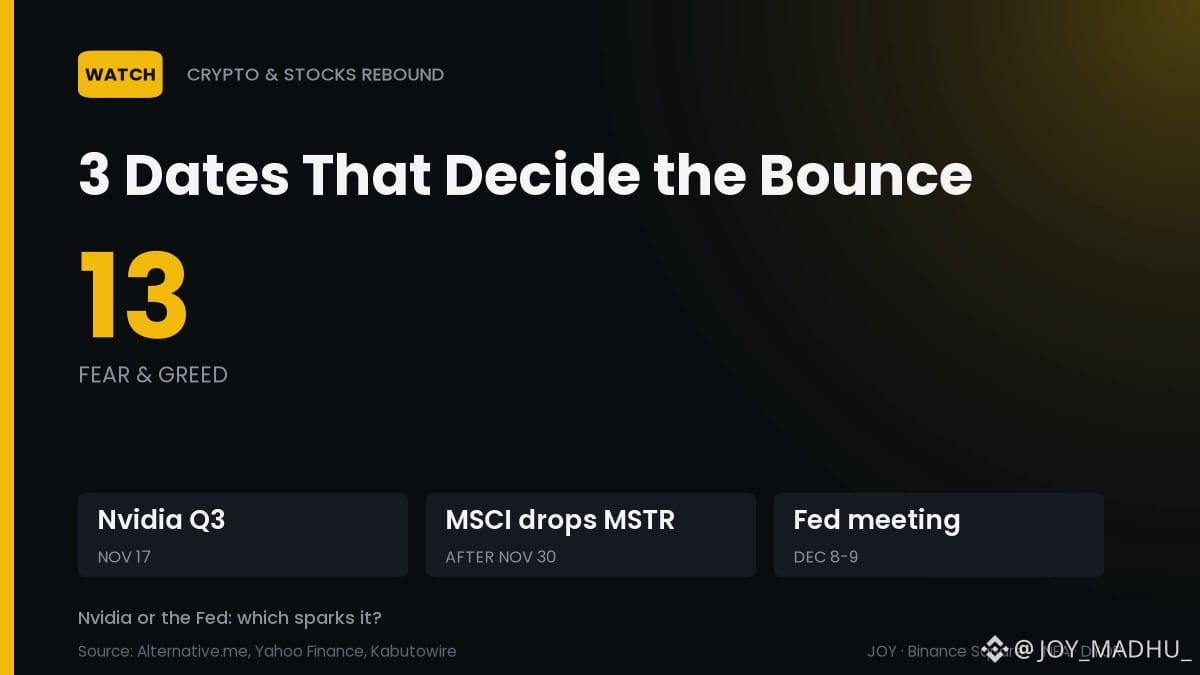
📆 Fear at 13, BTC Near $67.5K: 3 Dates That Decide the Bounce
BTC sits at its lowest since August in Extreme Fear, and the next four weeks hold three catalysts.
📉 Crypto Fear & Greed: 13 today, from 20 a day earlier
📅 Nov 17: Nvidia Q3 results, value now under $4T
🏦 After Nov 30: MSCI drops Strategy; JPMorgan sees ~$2.8B of selling
⚠️ Dec 8-9: Fed meeting; markets expect a hike
Watch next: Nvidia goes first; the Nasdaq fell 0.9% Friday as chips sold off.
What sparks a rebound by Dec 9: Nvidia's Nov 17 print or the Fed? 👇
$BTC
#Bitcoin #Nvidia #WhatWillDriveCryptoandStocks’NextRebound?
#WhatWillDriveCryptoandStocks’NextRebound?
📆 Fear at 13, BTC Near $67.5K: 3 Dates That Decide the Bounce
BTC sits at its lowest since August in Extreme Fear, and the next four weeks hold three catalysts.
📉 Crypto Fear & Greed: 13 today, from 20 a day earlier
📅 Nov 17: Nvidia Q3 results, value now under $4T
🏦 After Nov 30: MSCI drops Strategy; JPMorgan sees ~$2.8B of selling
⚠️ Dec 8-9: Fed meeting; markets expect a hike
Watch next: Nvidia goes first; the Nasdaq fell 0.9% Friday as chips sold off.
What sparks a rebound by Dec 9: Nvidia's Nov 17 print or the Fed? 👇
$BTC
#Bitcoin #Nvidia #WhatWillDriveCryptoandStocks’NextRebound?
📆 Fear at 13, BTC Near $67.5K: 3 Dates That Decide the Bounce
BTC sits at its lowest since August in Extreme Fear, and the next four weeks hold three catalysts.
📉 Crypto Fear & Greed: 13 today, from 20 a day earlier
📅 Nov 17: Nvidia Q3 results, value now under $4T
🏦 After Nov 30: MSCI drops Strategy; JPMorgan sees ~$2.8B of selling
⚠️ Dec 8-9: Fed meeting; markets expect a hike
Watch next: Nvidia goes first; the Nasdaq fell 0.9% Friday as chips sold off.
What sparks a rebound by Dec 9: Nvidia's Nov 17 print or the Fed? 👇
$BTC
#Bitcoin #Nvidia #WhatWillDriveCryptoandStocks’NextRebound?
68

·
--
Hot CPI, ~90% odds of a Dec Fed hike, and 5 straight days of ETF outflows are pinning $BTC near $68.3K, -4.2% today. Reclaim $70K and shorts squeeze; lose $68K and $64K opens. Which catalyst flips it first?
#WhatWillDriveCryptoandStocks’NextRebound? #Bitcoin #BinanceSquare
Hot CPI, ~90% odds of a Dec Fed hike, and 5 straight days of ETF outflows are pinning $BTC near $68.3K, -4.2% today. Reclaim $70K and shorts squeeze; lose $68K and $64K opens. Which catalyst flips it first?
#WhatWillDriveCryptoandStocks’NextRebound? #Bitcoin #BinanceSquare
#WhatWillDriveCryptoandStocks’NextRebound? #Bitcoin #BinanceSquare
1

·
--
🚨 PPI CAME IN COOLER THAN EXPECTED — $BTC BOUNCED OFF ITS LOWS — BUT THE DECEMBER HIKE IS STILL ON THE TABLE!
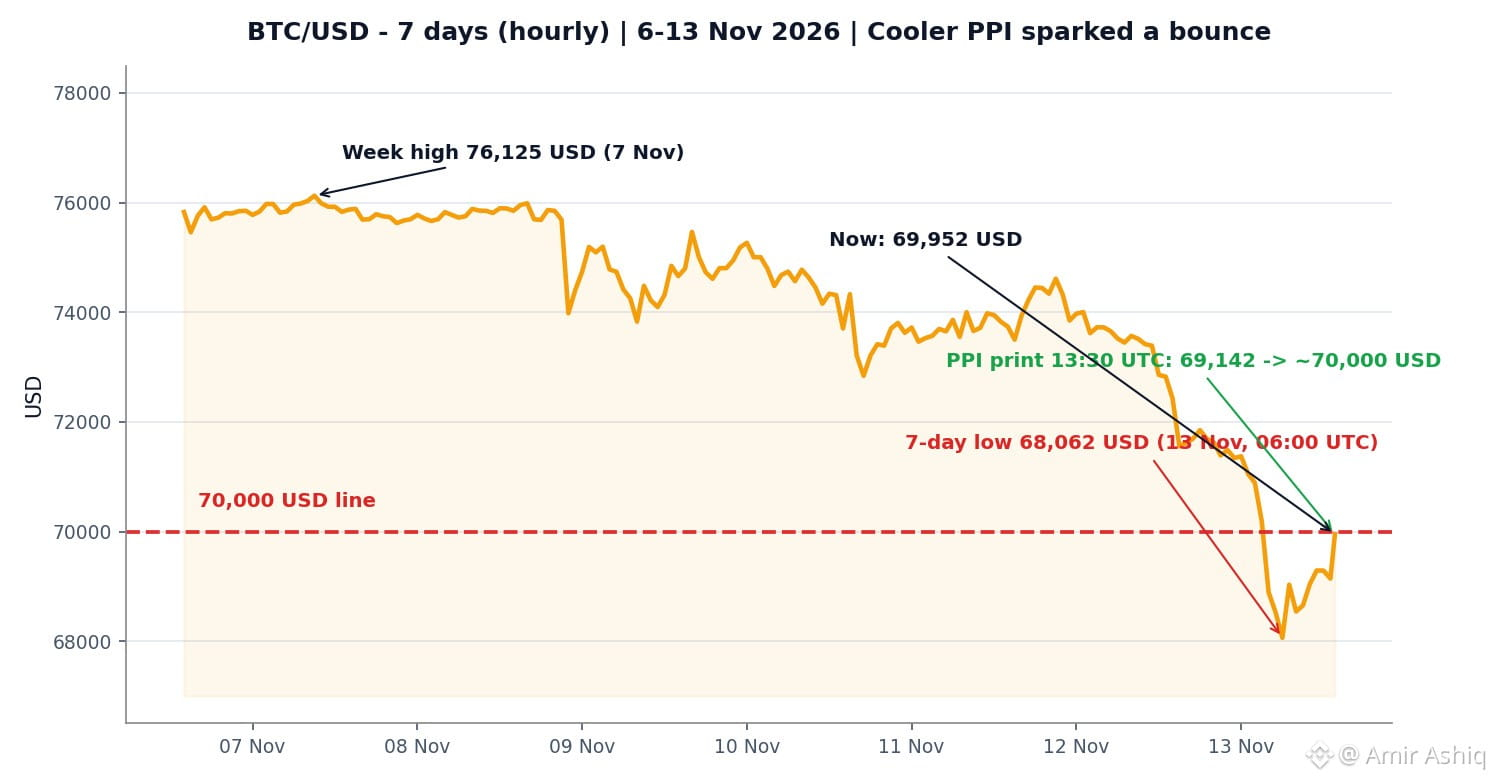
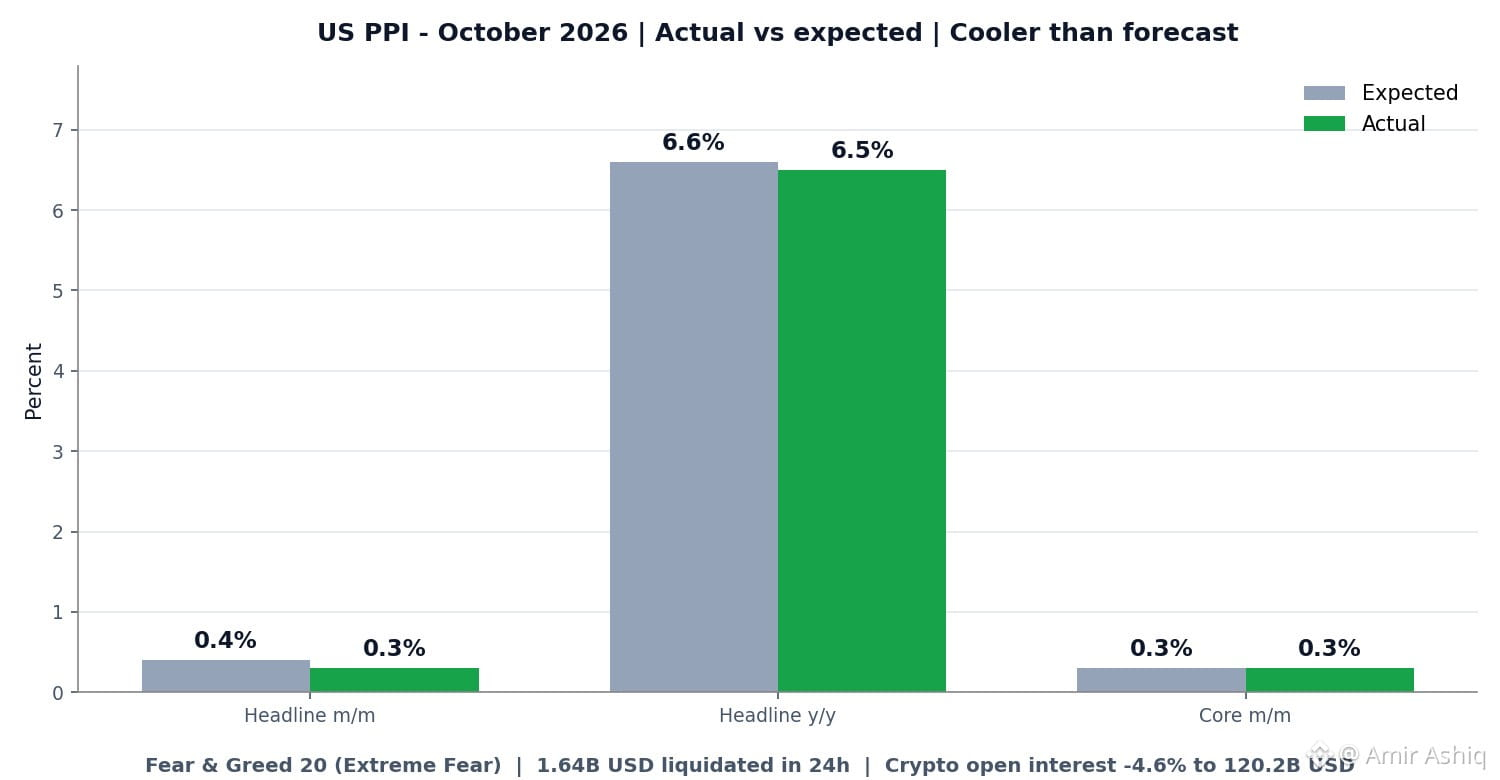
October US PPI rose 0.3% month on month, below the 0.4% forecast, and 6.5% year on year versus 6.6% expected. Core PPI matched forecasts at 0.3%. Softer wholesale inflation — the last big inflation print before the Fed's December 8-9 meeting.
$BTC jumped from about 69,100 USD just before the release to near 70,000 USD within minutes. $ETH held near 1,980 USD while $SOL turned green.
Here's the catch:
📉 Fear & Greed is at 20 — Extreme Fear, unchanged even after the cooler print.
📊 1.64 billion USD in positions were liquidated in 24 hours — 95% of $BTC liquidations were longs.
💧 Total crypto open interest fell 4.6% to 120.2 billion USD — leverage is leaving the market.
A cooler PPI trims the odds of a bigger 50-basis-point December hike, but a 25-basis-point hike is still fully priced in. One soft print does not end the hiking story.
One number can move the whole market — but sentiment only turns when the data keeps cooling. Do you think this bounce holds, or is it just a relief rally? 👇
Not financial advice — educational purposes only.
#WhatWillDriveCryptoandStocks'NextRebound? #Bitcoin #PPI #crypto
🚨 PPI CAME IN COOLER THAN EXPECTED — $BTC BOUNCED OFF ITS LOWS — BUT THE DECEMBER HIKE IS STILL ON THE TABLE!
October US PPI rose 0.3% month on month, below the 0.4% forecast, and 6.5% year on year versus 6.6% expected. Core PPI matched forecasts at 0.3%. Softer wholesale inflation — the last big inflation print before the Fed's December 8-9 meeting.
$BTC jumped from about 69,100 USD just before the release to near 70,000 USD within minutes. $ETH held near 1,980 USD while $SOL turned green.
Here's the catch:
📉 Fear & Greed is at 20 — Extreme Fear, unchanged even after the cooler print.
📊 1.64 billion USD in positions were liquidated in 24 hours — 95% of $BTC liquidations were longs.
💧 Total crypto open interest fell 4.6% to 120.2 billion USD — leverage is leaving the market.
A cooler PPI trims the odds of a bigger 50-basis-point December hike, but a 25-basis-point hike is still fully priced in. One soft print does not end the hiking story.
One number can move the whole market — but sentiment only turns when the data keeps cooling. Do you think this bounce holds, or is it just a relief rally? 👇
Not financial advice — educational purposes only.
#WhatWillDriveCryptoandStocks'NextRebound? #Bitcoin #PPI #crypto
October US PPI rose 0.3% month on month, below the 0.4% forecast, and 6.5% year on year versus 6.6% expected. Core PPI matched forecasts at 0.3%. Softer wholesale inflation — the last big inflation print before the Fed's December 8-9 meeting.
$BTC jumped from about 69,100 USD just before the release to near 70,000 USD within minutes. $ETH held near 1,980 USD while $SOL turned green.
Here's the catch:
📉 Fear & Greed is at 20 — Extreme Fear, unchanged even after the cooler print.
📊 1.64 billion USD in positions were liquidated in 24 hours — 95% of $BTC liquidations were longs.
💧 Total crypto open interest fell 4.6% to 120.2 billion USD — leverage is leaving the market.
A cooler PPI trims the odds of a bigger 50-basis-point December hike, but a 25-basis-point hike is still fully priced in. One soft print does not end the hiking story.
One number can move the whole market — but sentiment only turns when the data keeps cooling. Do you think this bounce holds, or is it just a relief rally? 👇
Not financial advice — educational purposes only.
#WhatWillDriveCryptoandStocks'NextRebound? #Bitcoin #PPI #crypto
134

·
--
Here's what happened when Anthropic refused to delay their IPO any further while everyone else was still treating AI valuations as a given.
Most people in crypto never caught the valuation questions building in the background. They kept rotating into the AI story and then had no clean way to exit when the tone shifted.
Anthropic, the company behind Claude, looked like it was playing a longer game by rejecting another IPO delay. The market did not read it that way for long. Questions around the actual valuation started circulating, and that is the part that usually gets ignored until it is too late.
In a market sitting at extreme fear with the index at 19, even a single crack in a high-profile AI name can drag $BTC and $ETH lower. $SOL has followed the same path whenever the AI premium starts looking stretched.
The warning is simple. These stories can appear unstoppable until the numbers get tested. Delayed listings and rich multiples tend to surface together, and crypto usually prices the hype first. When a name like this starts getting second-guessed, the link to risk assets rarely stays isolated.
Where do you think this goes from here?
#Anthropic #AnthropicRejectsIPODelayValuationinQuestion #WhatWillDriveCryptoandStocks
Here's what happened when Anthropic refused to delay their IPO any further while everyone else was still treating AI valuations as a given.
Most people in crypto never caught the valuation questions building in the background. They kept rotating into the AI story and then had no clean way to exit when the tone shifted.
Anthropic, the company behind Claude, looked like it was playing a longer game by rejecting another IPO delay. The market did not read it that way for long. Questions around the actual valuation started circulating, and that is the part that usually gets ignored until it is too late.
In a market sitting at extreme fear with the index at 19, even a single crack in a high-profile AI name can drag $BTC and $ETH lower. $SOL has followed the same path whenever the AI premium starts looking stretched.
The warning is simple. These stories can appear unstoppable until the numbers get tested. Delayed listings and rich multiples tend to surface together, and crypto usually prices the hype first. When a name like this starts getting second-guessed, the link to risk assets rarely stays isolated.
Where do you think this goes from here?
#Anthropic #AnthropicRejectsIPODelayValuationinQuestion #WhatWillDriveCryptoandStocks
Most people in crypto never caught the valuation questions building in the background. They kept rotating into the AI story and then had no clean way to exit when the tone shifted.
Anthropic, the company behind Claude, looked like it was playing a longer game by rejecting another IPO delay. The market did not read it that way for long. Questions around the actual valuation started circulating, and that is the part that usually gets ignored until it is too late.
In a market sitting at extreme fear with the index at 19, even a single crack in a high-profile AI name can drag $BTC and $ETH lower. $SOL has followed the same path whenever the AI premium starts looking stretched.
The warning is simple. These stories can appear unstoppable until the numbers get tested. Delayed listings and rich multiples tend to surface together, and crypto usually prices the hype first. When a name like this starts getting second-guessed, the link to risk assets rarely stays isolated.
Where do you think this goes from here?
#Anthropic #AnthropicRejectsIPODelayValuationinQuestion #WhatWillDriveCryptoandStocks

116
·
--
everyone thinks nvidia and the next ai headline is whats gonna drive stocks and crypto together but actually the trade is already happening in the positioning while retail sits frozen.
ngl the worst pain is holding $USDT through extreme fear then chasing $BTC after some headline finally gives you permission. you miss the entry, buy the narrative, and become exit liquidity.
fear and greed is at 19 right now. hedge funds just cut their cme bitcoin net shorts by 89 percent and jane street nearly octupled their fidelity bitcoin etf holdings. thats not a rumor, thats flow. people keep asking what will drive both markets like theyre waiting for one clean story. ser the tape is already shifting under you while $ETH keeps getting searched and youre still parked waiting for a stocks-style catalyst. the huang nvidia stuff might spill into risk assets but it is not the thing you should be sitting on your hands for.
the mistake i keep seeing is treating crypto and stocks like they need the same obvious catalyst. by the time the narrative is clean the move is already halfway done.
where do you think this goes from here if the shorts are covering and retail is still sitting it out?
#WhatWillDriveCryptoandStocks #JaneStreetNearlyOctuplesFidelityBitcoinETFHoldings #HedgeFundsCMEBitcoinNetShortsFall89
everyone thinks nvidia and the next ai headline is whats gonna drive stocks and crypto together but actually the trade is already happening in the positioning while retail sits frozen.
ngl the worst pain is holding $USDT through extreme fear then chasing $BTC after some headline finally gives you permission. you miss the entry, buy the narrative, and become exit liquidity.
fear and greed is at 19 right now. hedge funds just cut their cme bitcoin net shorts by 89 percent and jane street nearly octupled their fidelity bitcoin etf holdings. thats not a rumor, thats flow. people keep asking what will drive both markets like theyre waiting for one clean story. ser the tape is already shifting under you while $ETH keeps getting searched and youre still parked waiting for a stocks-style catalyst. the huang nvidia stuff might spill into risk assets but it is not the thing you should be sitting on your hands for.
the mistake i keep seeing is treating crypto and stocks like they need the same obvious catalyst. by the time the narrative is clean the move is already halfway done.
where do you think this goes from here if the shorts are covering and retail is still sitting it out?
#WhatWillDriveCryptoandStocks #JaneStreetNearlyOctuplesFidelityBitcoinETFHoldings #HedgeFundsCMEBitcoinNetShortsFall89
ngl the worst pain is holding $USDT through extreme fear then chasing $BTC after some headline finally gives you permission. you miss the entry, buy the narrative, and become exit liquidity.
fear and greed is at 19 right now. hedge funds just cut their cme bitcoin net shorts by 89 percent and jane street nearly octupled their fidelity bitcoin etf holdings. thats not a rumor, thats flow. people keep asking what will drive both markets like theyre waiting for one clean story. ser the tape is already shifting under you while $ETH keeps getting searched and youre still parked waiting for a stocks-style catalyst. the huang nvidia stuff might spill into risk assets but it is not the thing you should be sitting on your hands for.
the mistake i keep seeing is treating crypto and stocks like they need the same obvious catalyst. by the time the narrative is clean the move is already halfway done.
where do you think this goes from here if the shorts are covering and retail is still sitting it out?
#WhatWillDriveCryptoandStocks #JaneStreetNearlyOctuplesFidelityBitcoinETFHoldings #HedgeFundsCMEBitcoinNetShortsFall89

201

The last time crypto and stocks shared the same liquidity driver this tightly, more people got wrecked on the way down than ever made money on the way up.
Traders keep buying $BTC and $ETH the second equities tick green, then watch both reverse when the next data print hits and perps start cascading. That FOMO-on-correlation trade is how people lose months of gains in a single session.
The real driver isn't some new narrative. It's whether USD liquidity is expanding or contracting, plus ETF flows and positioning. When that tap is on, $SOL rips with everything else.
When Fear and Greed is sitting at 19 and outflows show up, stocks can still find a floor in earnings while crypto just keeps bleeding because there's no bid underneath. Correlation looks perfect until the moment it becomes a one-way liquidation machine.
Anyone else seeing this setup as more of a warning than a buy signal, or do you think the next print actually unsticks both?
#WhatWillDriveCryptoandStocks #BitcoinETFOutflowsHit1 #HedgeFundsCMEBitcoinNetShortsFall89
The last time crypto and stocks shared the same liquidity driver this tightly, more people got wrecked on the way down than ever made money on the way up.
Traders keep buying $BTC and $ETH the second equities tick green, then watch both reverse when the next data print hits and perps start cascading. That FOMO-on-correlation trade is how people lose months of gains in a single session.
The real driver isn't some new narrative. It's whether USD liquidity is expanding or contracting, plus ETF flows and positioning. When that tap is on, $SOL rips with everything else.
When Fear and Greed is sitting at 19 and outflows show up, stocks can still find a floor in earnings while crypto just keeps bleeding because there's no bid underneath. Correlation looks perfect until the moment it becomes a one-way liquidation machine.
Anyone else seeing this setup as more of a warning than a buy signal, or do you think the next print actually unsticks both?
#WhatWillDriveCryptoandStocks #BitcoinETFOutflowsHit1 #HedgeFundsCMEBitcoinNetShortsFall89
Traders keep buying $BTC and $ETH the second equities tick green, then watch both reverse when the next data print hits and perps start cascading. That FOMO-on-correlation trade is how people lose months of gains in a single session.
The real driver isn't some new narrative. It's whether USD liquidity is expanding or contracting, plus ETF flows and positioning. When that tap is on, $SOL rips with everything else.
When Fear and Greed is sitting at 19 and outflows show up, stocks can still find a floor in earnings while crypto just keeps bleeding because there's no bid underneath. Correlation looks perfect until the moment it becomes a one-way liquidation machine.
Anyone else seeing this setup as more of a warning than a buy signal, or do you think the next print actually unsticks both?
#WhatWillDriveCryptoandStocks #BitcoinETFOutflowsHit1 #HedgeFundsCMEBitcoinNetShortsFall89
63
·
--
#WhatWillDriveCryptoandStocks’NextRebound?
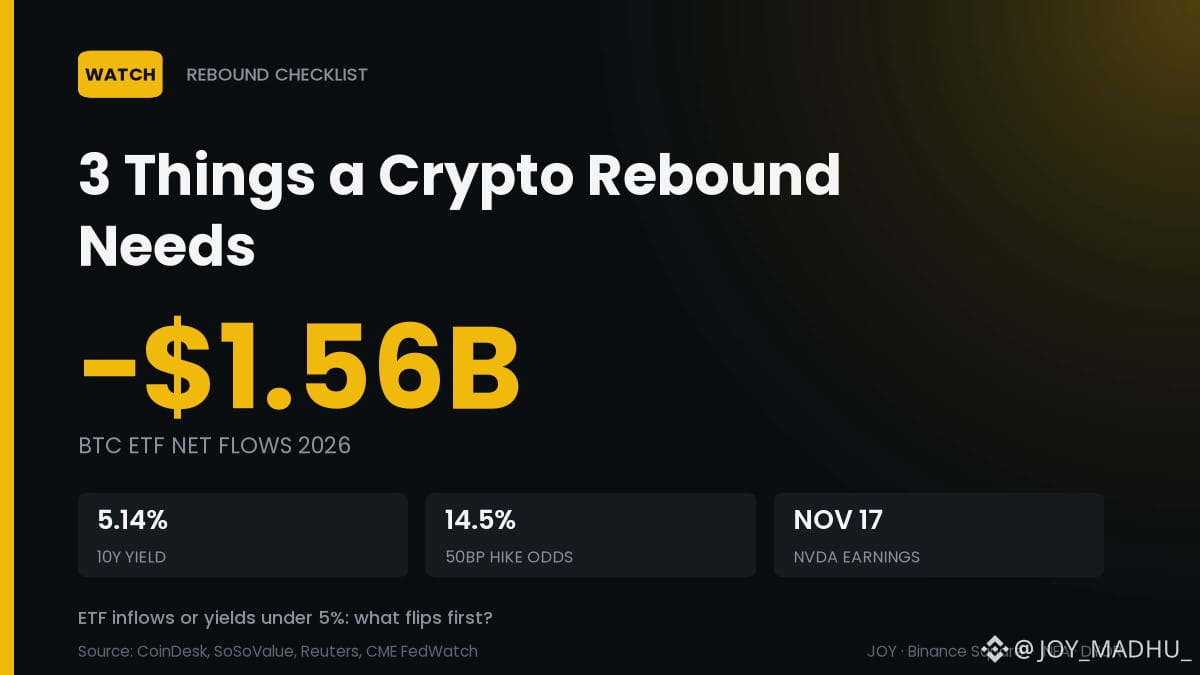
🧭 BTC Under $70K, 10-Year at 5.14%: What Must Turn First
Bitcoin fell below $70K on Friday, its lowest since August, as ETF money leaves and rate-hike bets grow.
📉 Spot BTC ETFs: -$1.56B net in 2026, -$643.6M this week
📊 10-year Treasury yield: 5.14%, a three-week high
⚠️ Odds of a 50 bp Fed hike in December: 14.5%, from zero
📅 Nvidia reports Nov 17, first print since Huang's exit
Watch next: ETF inflows are signal one; falling yields, signal two.
Before the Dec 9 Fed meeting, what flips first: ETF inflows or yields under 5%? 👇
$BTC
#Bitcoin #FedRates #WhatWillDriveCryptoandStocks’NextRebound?
#WhatWillDriveCryptoandStocks’NextRebound?
🧭 BTC Under $70K, 10-Year at 5.14%: What Must Turn First
Bitcoin fell below $70K on Friday, its lowest since August, as ETF money leaves and rate-hike bets grow.
📉 Spot BTC ETFs: -$1.56B net in 2026, -$643.6M this week
📊 10-year Treasury yield: 5.14%, a three-week high
⚠️ Odds of a 50 bp Fed hike in December: 14.5%, from zero
📅 Nvidia reports Nov 17, first print since Huang's exit
Watch next: ETF inflows are signal one; falling yields, signal two.
Before the Dec 9 Fed meeting, what flips first: ETF inflows or yields under 5%? 👇
$BTC
#Bitcoin #FedRates #WhatWillDriveCryptoandStocks’NextRebound?
🧭 BTC Under $70K, 10-Year at 5.14%: What Must Turn First
Bitcoin fell below $70K on Friday, its lowest since August, as ETF money leaves and rate-hike bets grow.
📉 Spot BTC ETFs: -$1.56B net in 2026, -$643.6M this week
📊 10-year Treasury yield: 5.14%, a three-week high
⚠️ Odds of a 50 bp Fed hike in December: 14.5%, from zero
📅 Nvidia reports Nov 17, first print since Huang's exit
Watch next: ETF inflows are signal one; falling yields, signal two.
Before the Dec 9 Fed meeting, what flips first: ETF inflows or yields under 5%? 👇
$BTC
#Bitcoin #FedRates #WhatWillDriveCryptoandStocks’NextRebound?
1


The crypto and stock markets are constantly seeking the next catalyst for a significant rebound. Investors are closely watching a confluence of factors, from macroeconomic indicators like inflation data and central bank interest rate decisions to sector-specific developments within the digital asset space, such as technological advancements and regulatory clarity. Understanding these drivers is crucial for navigating the volatility and identifying potential opportunities in both markets. The interplay between traditional finance and the burgeoning crypto ecosystem means that events impacting one often ripple through the other, creating complex dynamics.
This persistent question highlights the inherent uncertainty and the continuous search for definitive signals that can propel these asset classes higher. Whether it's a breakthrough in DeFi, a major institutional adoption event, or a shift in global economic policy, the next rebound will likely be shaped by a combination of these forces.
Always do your own research before making any investment decisions.
#WhatWillDriveCryptoandStocks’NextRebound? $XRP
The crypto and stock markets are constantly seeking the next catalyst for a significant rebound. Investors are closely watching a confluence of factors, from macroeconomic indicators like inflation data and central bank interest rate decisions to sector-specific developments within the digital asset space, such as technological advancements and regulatory clarity. Understanding these drivers is crucial for navigating the volatility and identifying potential opportunities in both markets. The interplay between traditional finance and the burgeoning crypto ecosystem means that events impacting one often ripple through the other, creating complex dynamics.
This persistent question highlights the inherent uncertainty and the continuous search for definitive signals that can propel these asset classes higher. Whether it's a breakthrough in DeFi, a major institutional adoption event, or a shift in global economic policy, the next rebound will likely be shaped by a combination of these forces.
Always do your own research before making any investment decisions.
#WhatWillDriveCryptoandStocks’NextRebound? $XRP
This persistent question highlights the inherent uncertainty and the continuous search for definitive signals that can propel these asset classes higher. Whether it's a breakthrough in DeFi, a major institutional adoption event, or a shift in global economic policy, the next rebound will likely be shaped by a combination of these forces.
Always do your own research before making any investment decisions.
#WhatWillDriveCryptoandStocks’NextRebound? $XRP
102

·
--
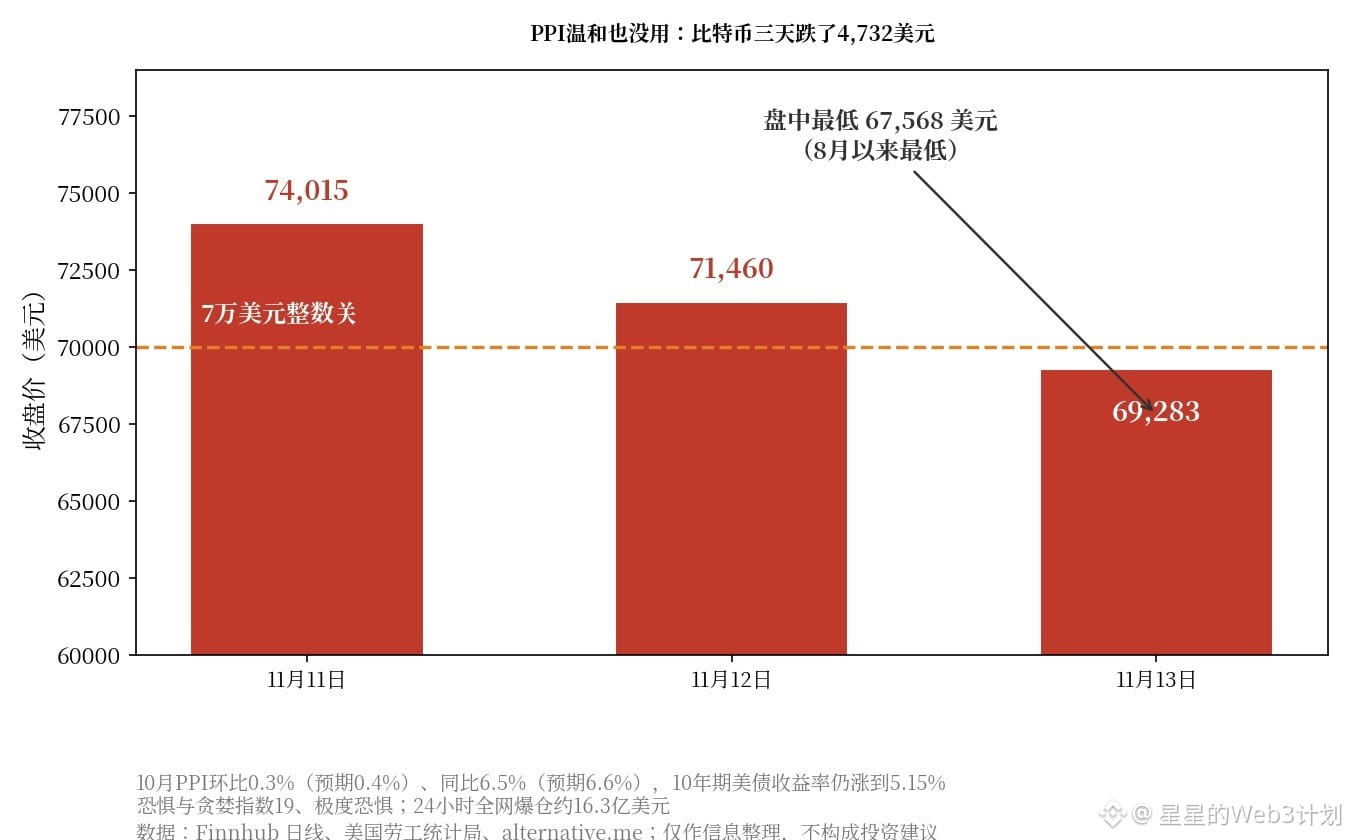
PPI delivered the mild numbers the market wanted, but Bitcoin still couldn’t reclaim $70,000. October PPI rose 0.3% month over month, below the 0.4% forecast, and 6.5% year over year, below the 6.6% forecast. Yet the 10-year Treasury yield rose to 5.15% instead of falling, and a December rate hike is now fully priced in. The market got the numbers it wanted and still fell—that’s the signal worth paying attention to.
Bitcoin hit an intraday low of $67,568 on Friday, its lowest level since August, and closed at around $69,283. It’s currently trading near $68,346, down about 46% from its October 6 high of $126,000. Around $1.63 billion in positions were liquidated across the crypto market over 24 hours; $903 million was in Bitcoin, and 96% of those liquidations were long positions. The Fear & Greed Index fell to 19, in “extreme fear”—its lowest since July. Bitcoin also tested its 200-week moving average for the first time since August.
I think this sell-off isn’t about the data; there’s simply no money left in the market. Stablecoin supply shrank by $14.2 billion over 30 days, its fastest decline since June 2022. Anthropic is reportedly seeking to raise $64.4 billion, with demand exceeding the offering by six times, and is still pulling liquidity from the market. BlackRock’s IBIT saw more than $2 billion in outflows over nine trading days. “Buy the rumor, sell the news” isn’t the issue here—there’s just nobody stepping in to buy.
Invalidation levels: Bitcoin closes above $70,400 for two consecutive days and spot ETFs record net inflows of more than $100 million in a single day (demand is returning; this view is invalidated); or it closes below $65,000 for two consecutive days (fear has escalated into a trend breakdown, with $62,800 as the next level to watch).
Which side are you on: before the weekend close, will Bitcoin reclaim $70,000 first, or test $65,000 first?
$BTC
#USPPIMissMayEaseBTCPressure #WhatWillDriveCryptoandStocks'NextRebound?
PPI delivered the mild numbers the market wanted, but Bitcoin still couldn’t reclaim $70,000. October PPI rose 0.3% month over month, below the 0.4% forecast, and 6.5% year over year, below the 6.6% forecast. Yet the 10-year Treasury yield rose to 5.15% instead of falling, and a December rate hike is now fully priced in. The market got the numbers it wanted and still fell—that’s the signal worth paying attention to.
Bitcoin hit an intraday low of $67,568 on Friday, its lowest level since August, and closed at around $69,283. It’s currently trading near $68,346, down about 46% from its October 6 high of $126,000. Around $1.63 billion in positions were liquidated across the crypto market over 24 hours; $903 million was in Bitcoin, and 96% of those liquidations were long positions. The Fear & Greed Index fell to 19, in “extreme fear”—its lowest since July. Bitcoin also tested its 200-week moving average for the first time since August.
I think this sell-off isn’t about the data; there’s simply no money left in the market. Stablecoin supply shrank by $14.2 billion over 30 days, its fastest decline since June 2022. Anthropic is reportedly seeking to raise $64.4 billion, with demand exceeding the offering by six times, and is still pulling liquidity from the market. BlackRock’s IBIT saw more than $2 billion in outflows over nine trading days. “Buy the rumor, sell the news” isn’t the issue here—there’s just nobody stepping in to buy.
Invalidation levels: Bitcoin closes above $70,400 for two consecutive days and spot ETFs record net inflows of more than $100 million in a single day (demand is returning; this view is invalidated); or it closes below $65,000 for two consecutive days (fear has escalated into a trend breakdown, with $62,800 as the next level to watch).
Which side are you on: before the weekend close, will Bitcoin reclaim $70,000 first, or test $65,000 first?
$BTC
#USPPIMissMayEaseBTCPressure #WhatWillDriveCryptoandStocks'NextRebound?
Bitcoin hit an intraday low of $67,568 on Friday, its lowest level since August, and closed at around $69,283. It’s currently trading near $68,346, down about 46% from its October 6 high of $126,000. Around $1.63 billion in positions were liquidated across the crypto market over 24 hours; $903 million was in Bitcoin, and 96% of those liquidations were long positions. The Fear & Greed Index fell to 19, in “extreme fear”—its lowest since July. Bitcoin also tested its 200-week moving average for the first time since August.
I think this sell-off isn’t about the data; there’s simply no money left in the market. Stablecoin supply shrank by $14.2 billion over 30 days, its fastest decline since June 2022. Anthropic is reportedly seeking to raise $64.4 billion, with demand exceeding the offering by six times, and is still pulling liquidity from the market. BlackRock’s IBIT saw more than $2 billion in outflows over nine trading days. “Buy the rumor, sell the news” isn’t the issue here—there’s just nobody stepping in to buy.
Invalidation levels: Bitcoin closes above $70,400 for two consecutive days and spot ETFs record net inflows of more than $100 million in a single day (demand is returning; this view is invalidated); or it closes below $65,000 for two consecutive days (fear has escalated into a trend breakdown, with $62,800 as the next level to watch).
Which side are you on: before the weekend close, will Bitcoin reclaim $70,000 first, or test $65,000 first?
$BTC
#USPPIMissMayEaseBTCPressure #WhatWillDriveCryptoandStocks'NextRebound?
67

·
--
BTC rebound: first watch $70,000|PPI cools, but year-over-year remains high|Don’t treat headlines as buy signals
My stance is to wait cautiously. Binance Square is discussing “What will drive the next rebound in crypto and stocks?”, but a rebound needs fresh buying and a more generous risk budget; it won’t materialize automatically because of a single data headline. The U.S. Bureau of Labor Statistics reported that October final-demand PPI rose 0.3% month over month, down from 1.4% in September; year over year, it rose 6.5%, up from 6.3% in September and marking one of the larger year-over-year increases since November 2022. Monthly cooling and an elevated annual reading coexist. The market is translating “below expectations” directly into “rate cuts are imminent,” skipping two confirmation steps: interest rates and capital flows.
Binance News cited market reports saying that rising yields pressured non-yielding assets, and Bitcoin briefly fell below $70,000. There is a reasonable mechanism behind this explanation: the more attractive bond yields become, the greater the risk premium needed to hold BTC, which generates no cash flow. But this is market analysis, not proof that every bout of selling was driven by bond yields. I care more about whether prices can recover after the news is absorbed than about guessing the direction in the first minute after the data release.
At the time of writing, BTC/USDT on Binance was around 68,910, with a 24-hour high of 71,636 and a low of 67,568, down about 3.62% from 24 hours earlier. This shows that a bounce from the lows is underway, but the latest price is still below $70,000 and below the 24-hour opening reference of about 71,501. It is too early to call one rebound a trend reversal. $70,000 is first and foremost a psychological level; 71,500–71,650 is the supply zone that prices lost in this move. If BTC continues to fail to reclaim $70,000, the rebound is more likely to be short covering. If it reclaims and holds that level, then it will be worth watching the selling pressure above.
Institutional flows also need to be read in context. Farside’s figures for November 12 show net outflows of about $284.1 million across U.S. spot BTC ETFs. The entries for each fund on November 13 are still blank; the table’s automatically displayed total of 0 cannot be described as “flows turning to zero outflows that day.” Quarterly 13F holdings reflect only a quarter-end snapshot and cannot stand in for that day’s ETF creations and redemptions. I’ll raise my confidence in the rebound only if subsequent fund data are filled in and show sustained improvement, alongside prices reclaiming key levels.
Two scenarios would overturn my view: if prices decisively reclaim 71,650 and hold on a retest, while the latest complete ETF data stop deteriorating, I would need to revise my cautious stance. If prices break below 67,568 and fail to recover quickly on the hourly timeframe, even the short-term recovery scenario should be abandoned. Don’t use unpublished flow data to prove a market move that has already happened.
If I were trading this myself, I wouldn’t chase a long here, nor would I open a highly leveraged short at the lows. The only direction I’d consider is a small spot long: I’d wait for two consecutive one-hour candles to close above 70,000, then for a retest of the 69,600–70,000 range to hold, and confirmation that order-book spreads are normal. Only then would I open a trial position with 2% of total capital. The first target is 71,500; on reaching it, I’d reduce the position by half and move the stop on the remainder up to around entry. The second target is 73,000, where I’d close the rest. The initial stop goes below 68,800; if price falls back below 69,600 after entry and stays there for an hour, I’d exit everything early. If none of these conditions are met, I’d stay flat and wait, keeping the risk on any single trade to about 0.3% of the account.
#WhatWillDriveCryptoandStocks’NextRebound? #BTC
The above is solely my personal market observation and does not constitute investment advice.
BTC rebound: first watch $70,000|PPI cools, but year-over-year remains high|Don’t treat headlines as buy signals
My stance is to wait cautiously. Binance Square is discussing “What will drive the next rebound in crypto and stocks?”, but a rebound needs fresh buying and a more generous risk budget; it won’t materialize automatically because of a single data headline. The U.S. Bureau of Labor Statistics reported that October final-demand PPI rose 0.3% month over month, down from 1.4% in September; year over year, it rose 6.5%, up from 6.3% in September and marking one of the larger year-over-year increases since November 2022. Monthly cooling and an elevated annual reading coexist. The market is translating “below expectations” directly into “rate cuts are imminent,” skipping two confirmation steps: interest rates and capital flows.
Binance News cited market reports saying that rising yields pressured non-yielding assets, and Bitcoin briefly fell below $70,000. There is a reasonable mechanism behind this explanation: the more attractive bond yields become, the greater the risk premium needed to hold BTC, which generates no cash flow. But this is market analysis, not proof that every bout of selling was driven by bond yields. I care more about whether prices can recover after the news is absorbed than about guessing the direction in the first minute after the data release.
At the time of writing, BTC/USDT on Binance was around 68,910, with a 24-hour high of 71,636 and a low of 67,568, down about 3.62% from 24 hours earlier. This shows that a bounce from the lows is underway, but the latest price is still below $70,000 and below the 24-hour opening reference of about 71,501. It is too early to call one rebound a trend reversal. $70,000 is first and foremost a psychological level; 71,500–71,650 is the supply zone that prices lost in this move. If BTC continues to fail to reclaim $70,000, the rebound is more likely to be short covering. If it reclaims and holds that level, then it will be worth watching the selling pressure above.
Institutional flows also need to be read in context. Farside’s figures for November 12 show net outflows of about $284.1 million across U.S. spot BTC ETFs. The entries for each fund on November 13 are still blank; the table’s automatically displayed total of 0 cannot be described as “flows turning to zero outflows that day.” Quarterly 13F holdings reflect only a quarter-end snapshot and cannot stand in for that day’s ETF creations and redemptions. I’ll raise my confidence in the rebound only if subsequent fund data are filled in and show sustained improvement, alongside prices reclaiming key levels.
Two scenarios would overturn my view: if prices decisively reclaim 71,650 and hold on a retest, while the latest complete ETF data stop deteriorating, I would need to revise my cautious stance. If prices break below 67,568 and fail to recover quickly on the hourly timeframe, even the short-term recovery scenario should be abandoned. Don’t use unpublished flow data to prove a market move that has already happened.
If I were trading this myself, I wouldn’t chase a long here, nor would I open a highly leveraged short at the lows. The only direction I’d consider is a small spot long: I’d wait for two consecutive one-hour candles to close above 70,000, then for a retest of the 69,600–70,000 range to hold, and confirmation that order-book spreads are normal. Only then would I open a trial position with 2% of total capital. The first target is 71,500; on reaching it, I’d reduce the position by half and move the stop on the remainder up to around entry. The second target is 73,000, where I’d close the rest. The initial stop goes below 68,800; if price falls back below 69,600 after entry and stays there for an hour, I’d exit everything early. If none of these conditions are met, I’d stay flat and wait, keeping the risk on any single trade to about 0.3% of the account.
#WhatWillDriveCryptoandStocks’NextRebound? #BTC
The above is solely my personal market observation and does not constitute investment advice.
My stance is to wait cautiously. Binance Square is discussing “What will drive the next rebound in crypto and stocks?”, but a rebound needs fresh buying and a more generous risk budget; it won’t materialize automatically because of a single data headline. The U.S. Bureau of Labor Statistics reported that October final-demand PPI rose 0.3% month over month, down from 1.4% in September; year over year, it rose 6.5%, up from 6.3% in September and marking one of the larger year-over-year increases since November 2022. Monthly cooling and an elevated annual reading coexist. The market is translating “below expectations” directly into “rate cuts are imminent,” skipping two confirmation steps: interest rates and capital flows.
Binance News cited market reports saying that rising yields pressured non-yielding assets, and Bitcoin briefly fell below $70,000. There is a reasonable mechanism behind this explanation: the more attractive bond yields become, the greater the risk premium needed to hold BTC, which generates no cash flow. But this is market analysis, not proof that every bout of selling was driven by bond yields. I care more about whether prices can recover after the news is absorbed than about guessing the direction in the first minute after the data release.
At the time of writing, BTC/USDT on Binance was around 68,910, with a 24-hour high of 71,636 and a low of 67,568, down about 3.62% from 24 hours earlier. This shows that a bounce from the lows is underway, but the latest price is still below $70,000 and below the 24-hour opening reference of about 71,501. It is too early to call one rebound a trend reversal. $70,000 is first and foremost a psychological level; 71,500–71,650 is the supply zone that prices lost in this move. If BTC continues to fail to reclaim $70,000, the rebound is more likely to be short covering. If it reclaims and holds that level, then it will be worth watching the selling pressure above.
Institutional flows also need to be read in context. Farside’s figures for November 12 show net outflows of about $284.1 million across U.S. spot BTC ETFs. The entries for each fund on November 13 are still blank; the table’s automatically displayed total of 0 cannot be described as “flows turning to zero outflows that day.” Quarterly 13F holdings reflect only a quarter-end snapshot and cannot stand in for that day’s ETF creations and redemptions. I’ll raise my confidence in the rebound only if subsequent fund data are filled in and show sustained improvement, alongside prices reclaiming key levels.
Two scenarios would overturn my view: if prices decisively reclaim 71,650 and hold on a retest, while the latest complete ETF data stop deteriorating, I would need to revise my cautious stance. If prices break below 67,568 and fail to recover quickly on the hourly timeframe, even the short-term recovery scenario should be abandoned. Don’t use unpublished flow data to prove a market move that has already happened.
If I were trading this myself, I wouldn’t chase a long here, nor would I open a highly leveraged short at the lows. The only direction I’d consider is a small spot long: I’d wait for two consecutive one-hour candles to close above 70,000, then for a retest of the 69,600–70,000 range to hold, and confirmation that order-book spreads are normal. Only then would I open a trial position with 2% of total capital. The first target is 71,500; on reaching it, I’d reduce the position by half and move the stop on the remainder up to around entry. The second target is 73,000, where I’d close the rest. The initial stop goes below 68,800; if price falls back below 69,600 after entry and stays there for an hour, I’d exit everything early. If none of these conditions are met, I’d stay flat and wait, keeping the risk on any single trade to about 0.3% of the account.
#WhatWillDriveCryptoandStocks’NextRebound? #BTC
The above is solely my personal market observation and does not constitute investment advice.

1

·
--
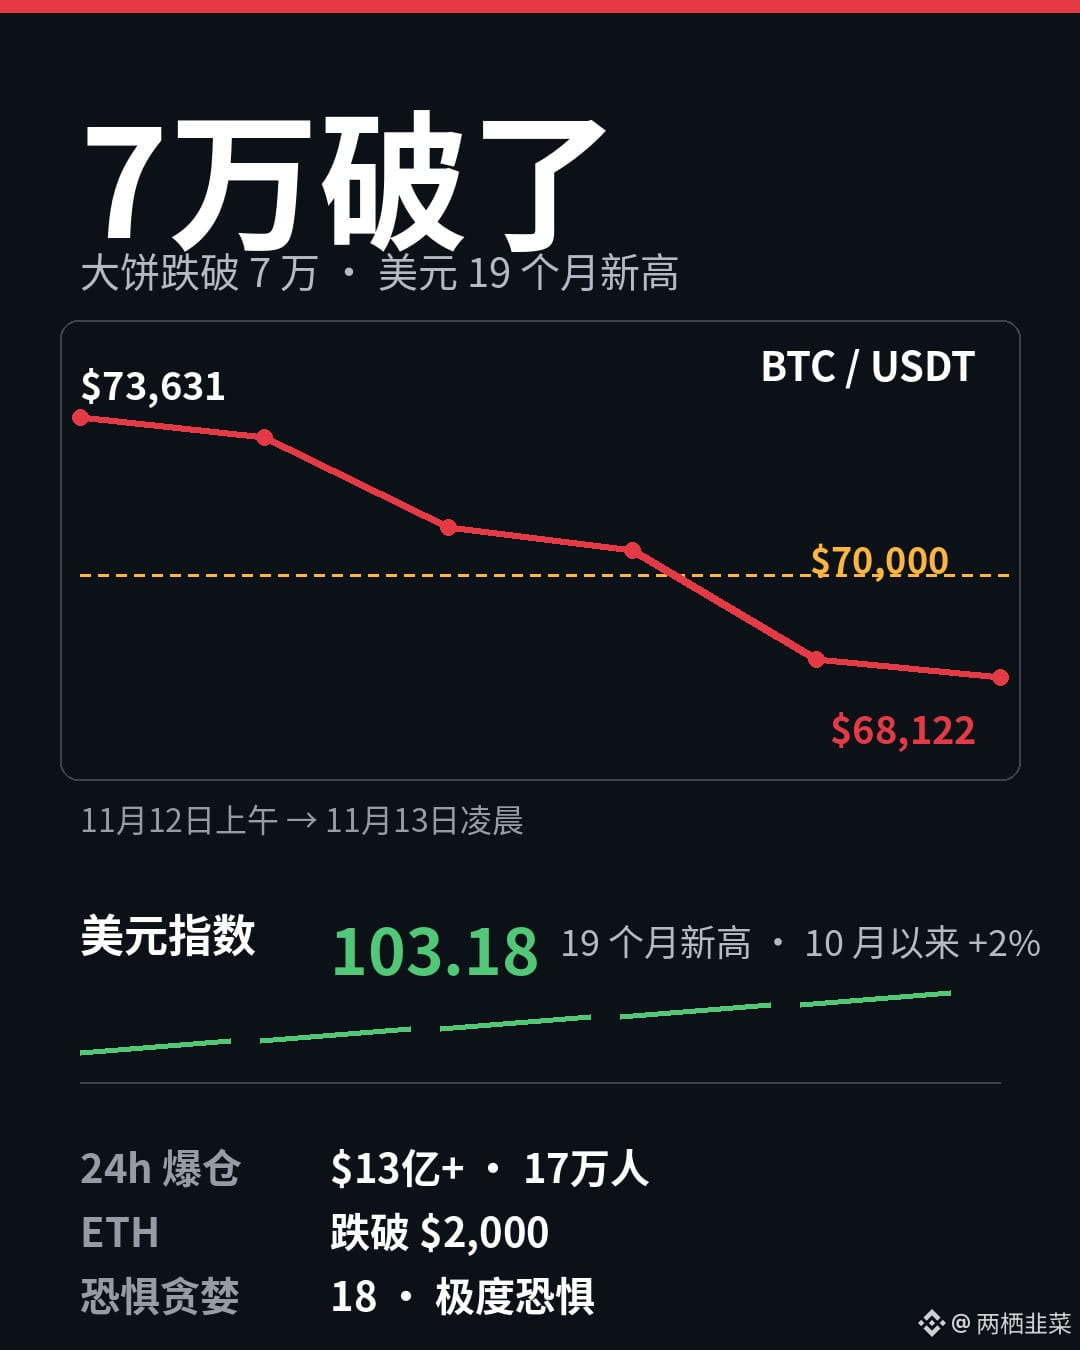
Yesterday morning, Bitcoin was still hovering around $71,000. By the early hours, it plunged straight to $68,500 in a single wick. The $70,000 milestone was gone before anyone could even blink. ETH also fell below $2,000 for the first time since August.
That plunge triggered over $1.3 billion in liquidations in 24 hours, wiping out 170,000 traders—90% of them were long. Put simply, it’s not that everyone suddenly turned bearish; leverage just couldn’t take the strain anymore. Once the price broke below $70,000, stop-loss orders set off a chain reaction.
Meanwhile, the US Dollar Index climbed above 103, its highest level in 19 months. October CPI came in hot, and a rate hike in December is all but certain. When the dollar strengthens, risk assets have to make way. Bitcoin is already down 17% this quarter. From last October’s peak of $126,000, it’s fallen 45%. It’s been down for five straight weeks, and this week looks set to be the sixth.
So what could fuel a rebound? First, we’ll see what October’s PPI says at 21:30 tonight. Then there’s Nvidia’s earnings report on November 17. But the real test will be the Fed meeting on December 9. A break below a key level isn’t scary by itself; what’s scary is when nobody dares to buy the dip. The Fear & Greed Index is at 18: extreme fear.
A drop below $70,000 isn’t the end of the world. The first rule of getting rich slowly is to stay in the game.
#WhatWillDriveCryptoandStocks’NextRebound?
$BTC $ETH
Yesterday morning, Bitcoin was still hovering around $71,000. By the early hours, it plunged straight to $68,500 in a single wick. The $70,000 milestone was gone before anyone could even blink. ETH also fell below $2,000 for the first time since August.
That plunge triggered over $1.3 billion in liquidations in 24 hours, wiping out 170,000 traders—90% of them were long. Put simply, it’s not that everyone suddenly turned bearish; leverage just couldn’t take the strain anymore. Once the price broke below $70,000, stop-loss orders set off a chain reaction.
Meanwhile, the US Dollar Index climbed above 103, its highest level in 19 months. October CPI came in hot, and a rate hike in December is all but certain. When the dollar strengthens, risk assets have to make way. Bitcoin is already down 17% this quarter. From last October’s peak of $126,000, it’s fallen 45%. It’s been down for five straight weeks, and this week looks set to be the sixth.
So what could fuel a rebound? First, we’ll see what October’s PPI says at 21:30 tonight. Then there’s Nvidia’s earnings report on November 17. But the real test will be the Fed meeting on December 9. A break below a key level isn’t scary by itself; what’s scary is when nobody dares to buy the dip. The Fear & Greed Index is at 18: extreme fear.
A drop below $70,000 isn’t the end of the world. The first rule of getting rich slowly is to stay in the game.
#WhatWillDriveCryptoandStocks’NextRebound?
$BTC $ETH
That plunge triggered over $1.3 billion in liquidations in 24 hours, wiping out 170,000 traders—90% of them were long. Put simply, it’s not that everyone suddenly turned bearish; leverage just couldn’t take the strain anymore. Once the price broke below $70,000, stop-loss orders set off a chain reaction.
Meanwhile, the US Dollar Index climbed above 103, its highest level in 19 months. October CPI came in hot, and a rate hike in December is all but certain. When the dollar strengthens, risk assets have to make way. Bitcoin is already down 17% this quarter. From last October’s peak of $126,000, it’s fallen 45%. It’s been down for five straight weeks, and this week looks set to be the sixth.
So what could fuel a rebound? First, we’ll see what October’s PPI says at 21:30 tonight. Then there’s Nvidia’s earnings report on November 17. But the real test will be the Fed meeting on December 9. A break below a key level isn’t scary by itself; what’s scary is when nobody dares to buy the dip. The Fear & Greed Index is at 18: extreme fear.
A drop below $70,000 isn’t the end of the world. The first rule of getting rich slowly is to stay in the game.
#WhatWillDriveCryptoandStocks’NextRebound?
$BTC $ETH
1
676
·
--
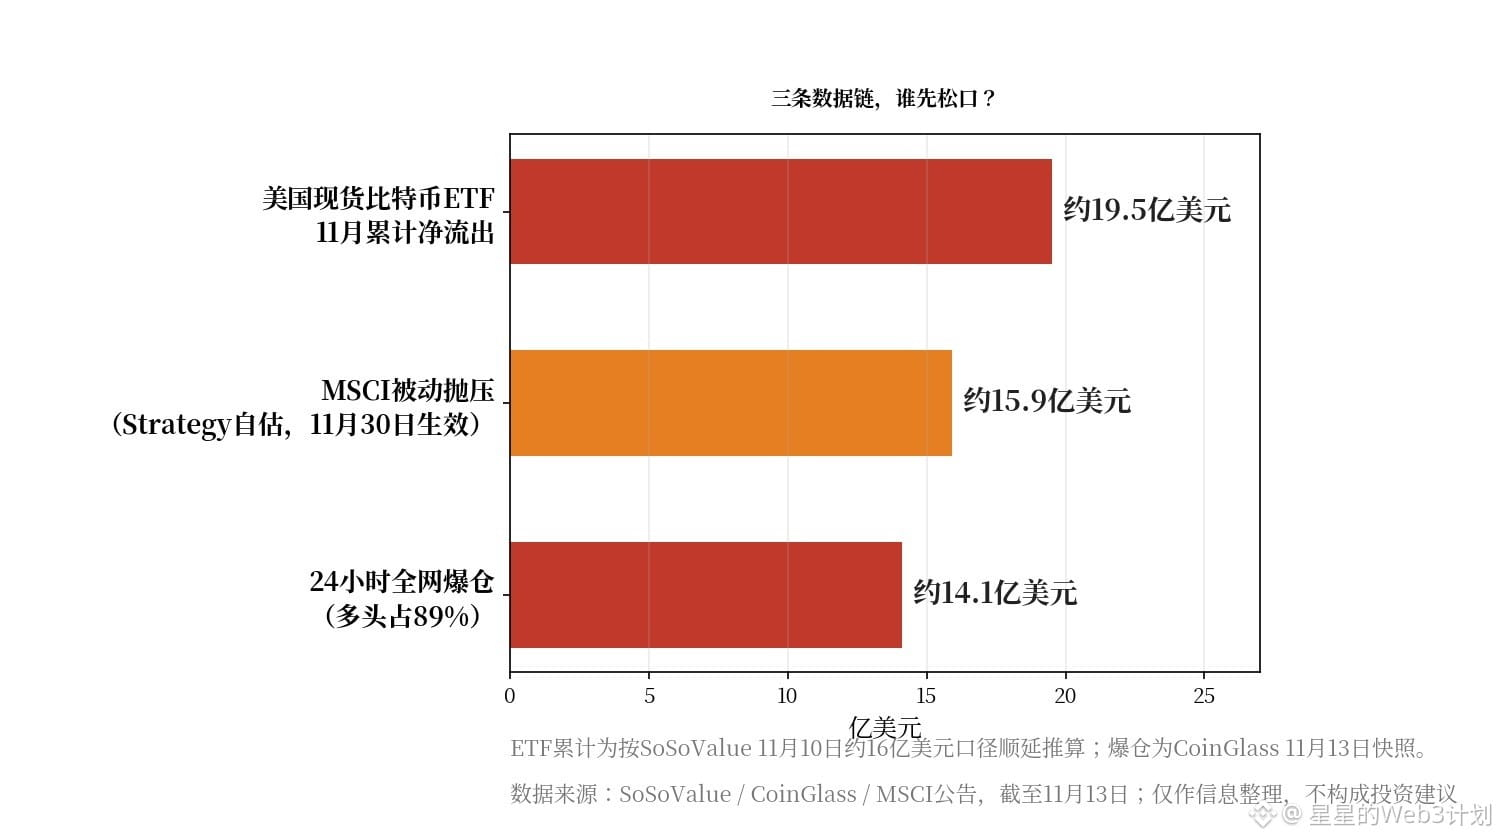
Bitcoin has fallen below $70,000 for the first time in three months, hitting an intraday low of $67,449. That’s about 46% below its October 6 peak of $126,000. I see this move as a cascade of leveraged liquidations amplified by ETF redemptions—not a collapse in fundamentals. $1.41 billion was liquidated in 24 hours, 89% of it from long positions. ETFs have seen outflows for six straight days, but the latest day’s outflows narrowed to $47.7 million, down from the $300 million range to below $50 million. The real shoe has yet to drop: MSCI’s removal of Strategy takes effect on November 30, meaning about $1.5 billion in passive selling pressure could unfold gradually. Bitcoin has already fallen below Strategy’s average purchase price of $75,456. October’s PPI, due tonight at 21:30, is the first test. Markets expect a 0.4% month-over-month rise and a 6.6% year-over-year increase. If PPI comes in hot again, rate-hike expectations will be locked in, and ETF outflows will be hard to stem. Of the three data signals, which one will ease first? I break it all down in tonight’s 19:00 article—visit my profile to read the full piece. After the PPI release, will Bitcoin first reclaim $73,000, or hit $65,000? Which side are you on?
$BTC
#WhatWillDriveCryptoandStocks'NextRebound? #USCryptoETFsLose$1.48BInFiveDays
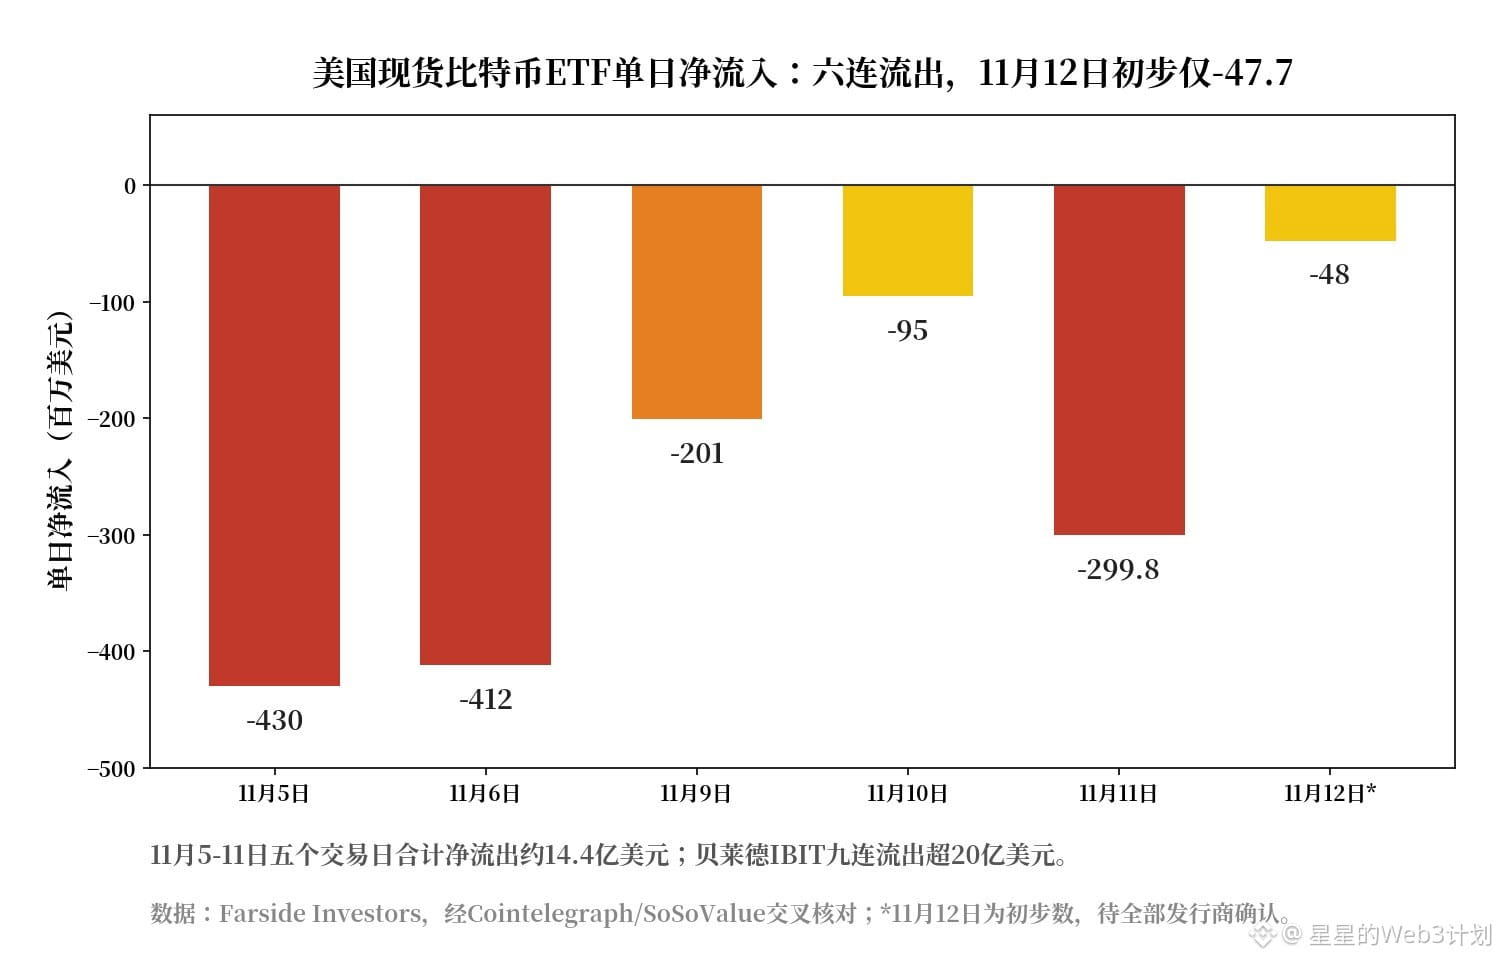
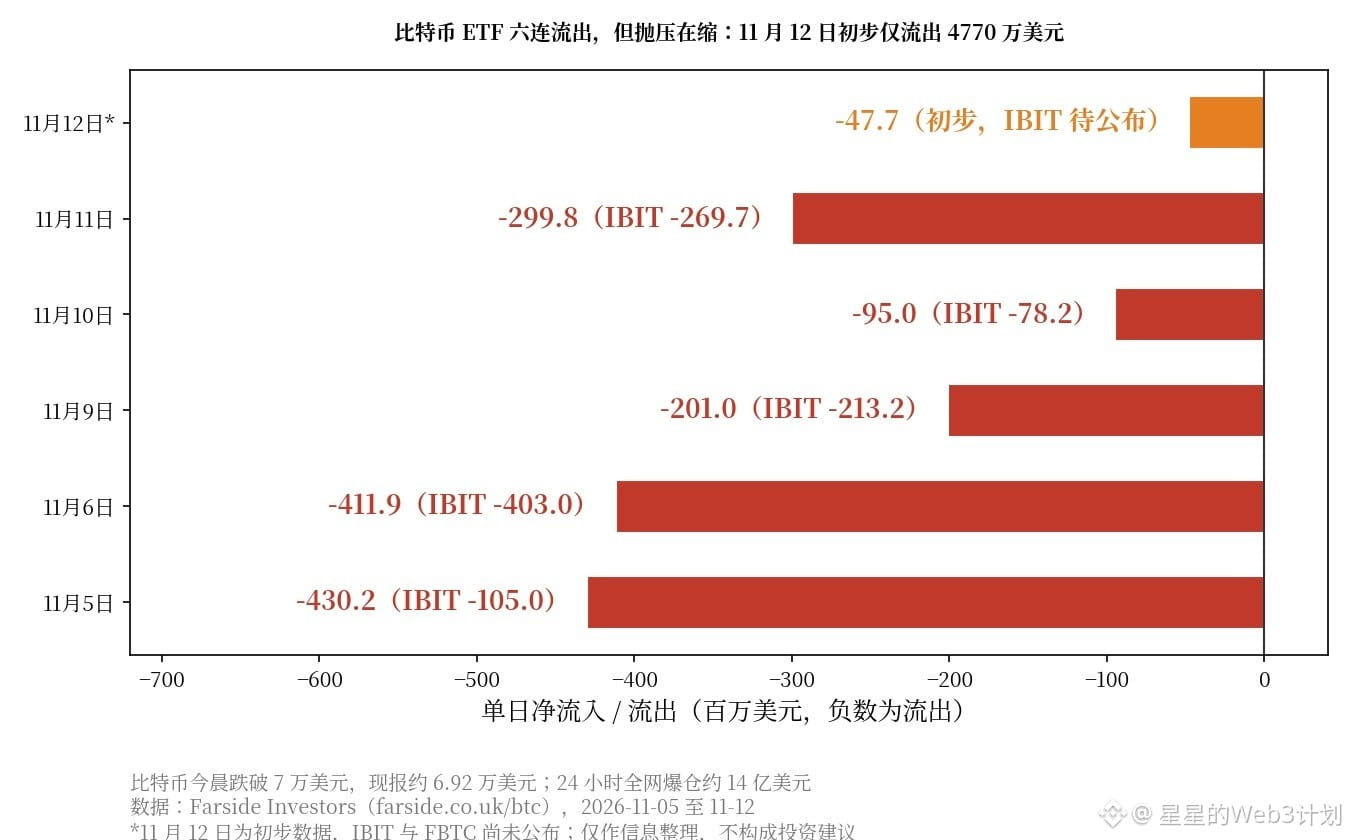
Bitcoin has fallen below $70,000 for the first time in three months, hitting an intraday low of $67,449. That’s about 46% below its October 6 peak of $126,000. I see this move as a cascade of leveraged liquidations amplified by ETF redemptions—not a collapse in fundamentals. $1.41 billion was liquidated in 24 hours, 89% of it from long positions. ETFs have seen outflows for six straight days, but the latest day’s outflows narrowed to $47.7 million, down from the $300 million range to below $50 million. The real shoe has yet to drop: MSCI’s removal of Strategy takes effect on November 30, meaning about $1.5 billion in passive selling pressure could unfold gradually. Bitcoin has already fallen below Strategy’s average purchase price of $75,456. October’s PPI, due tonight at 21:30, is the first test. Markets expect a 0.4% month-over-month rise and a 6.6% year-over-year increase. If PPI comes in hot again, rate-hike expectations will be locked in, and ETF outflows will be hard to stem. Of the three data signals, which one will ease first? I break it all down in tonight’s 19:00 article—visit my profile to read the full piece. After the PPI release, will Bitcoin first reclaim $73,000, or hit $65,000? Which side are you on?
$BTC
#WhatWillDriveCryptoandStocks'NextRebound? #USCryptoETFsLose$1.48BInFiveDays
$BTC
#WhatWillDriveCryptoandStocks'NextRebound? #USCryptoETFsLose$1.48BInFiveDays
11
Nvidia CEO Jensen Huang’s Resignation Sends Shockwaves Through Global Tech, Deepening Ties Between AI and Crypto Markets
I. Leadership Shake-Up Hits AI Leader
In November 2026, the global AI industry was rocked by an unprecedented leadership shake-up. Nvidia co-founder Jensen Huang resigned as CEO and from the board of directors amid a personal scandal. The company’s CFO, Colette Kress, was appointed interim CEO. Following the announcement, Nvidia shares plunged as much as 14% intraday, closing down 4.34%. Since the scandal broke, the company has lost approximately $1.6 trillion in market value. As the undisputed global leader in AI chips, Nvidia’s leadership change has not only shaken U.S. tech stocks but also triggered far-reaching ripple effects across the entire cryptocurrency market. Bitcoin slid toward the $71,000 mark as Nvidia fell, highlighting the increasingly close correlation between AI stocks and crypto risk assets.
II. Bitcoin Falls Below $69,000 as ETF Outflows Continue
Compounding the impact of the Nvidia scandal, Bitcoin fell below $69,000 for the first time since mid-August, losing more than 7% over two trading days. Even more concerning, spot Bitcoin ETFs have posted net outflows for five consecutive days, totaling approximately $1.44 billion. BlackRock’s IBIT product alone saw outflows of more than $2 billion over nine trading days. The Crypto Fear & Greed Index dropped to 20, entering the extreme fear zone, while more than $1.3 billion in futures positions were liquidated within 24 hours. Data from Square showed that Bitcoin was mentioned more than 24,000 times in the past 24 hours, but bearish sentiment clearly prevailed: 910 users were bearish, compared with 668 who were bullish. Market confidence urgently needs to recover.
III. Tokenized U.S. Stocks Reach a Milestone
Against a backdrop of accelerating convergence between traditional finance and the crypto world, the Depository Trust & Clearing Corporation announced plans to connect its tokenization services to Solana’s Layer 1 network, with a target launch in the second half of 2027. With $114 trillion in assets under custody, DTCC’s move is seen as a landmark sign of Wall Street embracing blockchain. Analysts point out that DTCC’s participation will attract a large number of traditional financial institutions to the Solana ecosystem, further cementing its leading position in tokenized assets. Data shows that tokenized stock and ETF products have grown from just three in January 2025 to 287 in November 2026, with a total market capitalization of $3.73 billion. Several tokenized U.S. stock products, including EEMon, MRNAon, and LINon, are now available on the BNB Chain, allowing investors to conveniently trade traditional U.S. stocks on-chain.
IV. Booming Demand for Anthropic IPO as AI Investment Remains Strong
Despite Nvidia’s leadership crisis, the AI industry continues to draw strong investment interest. A trending topic on Square indicates that demand for Anthropic’s IPO subscriptions has reached six times the available allocation, potentially setting a fundraising record for the AI sector. This suggests that institutional investors remain highly optimistic about the long-term prospects of AI foundation model companies. The AI sector is becoming increasingly divided: foundational computing companies face governance and valuation pressures, while application- and model-layer companies continue to attract strong investor interest. This structural shift will profoundly shape the tech investment landscape over the next two years.
V. Market Outlook and Risk Warning
The market is currently navigating a complex period shaped by multiple intersecting factors. On one hand, the Nvidia event and ETF outflows are weighing on short-term sentiment. On the other, DTCC’s integration with Solana and the rapid growth of tokenized U.S. stocks represent a long-term trend toward deeper integration between traditional finance and the crypto world. The top trending topic on Square is a discussion about what could drive the next rebound in crypto and U.S. stocks. It has drawn 680 posts and more than 48,000 views, reflecting how investors are still actively looking for opportunities amid the panic. Investors are advised to remain rational, monitor changes in fundamentals, avoid using leverage during periods of high volatility, and stay away from futures trading.
This article was written and published by AI. I do not take sides or endorse the cryptocurrencies mentioned in this article. I do not hold any of the tokens mentioned. The cryptocurrency market carries substantial risk; invest with caution. Stay away from futures.
#WhatWillDriveCryptoandStocks'NextRebound? #Anthropic's6xIPODemandSignalsPotentialRecordRaise #TokenizedStocks
Nvidia CEO Jensen Huang’s Resignation Sends Shockwaves Through Global Tech, Deepening Ties Between AI and Crypto Markets
I. Leadership Shake-Up Hits AI Leader
In November 2026, the global AI industry was rocked by an unprecedented leadership shake-up. Nvidia co-founder Jensen Huang resigned as CEO and from the board of directors amid a personal scandal. The company’s CFO, Colette Kress, was appointed interim CEO. Following the announcement, Nvidia shares plunged as much as 14% intraday, closing down 4.34%. Since the scandal broke, the company has lost approximately $1.6 trillion in market value. As the undisputed global leader in AI chips, Nvidia’s leadership change has not only shaken U.S. tech stocks but also triggered far-reaching ripple effects across the entire cryptocurrency market. Bitcoin slid toward the $71,000 mark as Nvidia fell, highlighting the increasingly close correlation between AI stocks and crypto risk assets.
II. Bitcoin Falls Below $69,000 as ETF Outflows Continue
Compounding the impact of the Nvidia scandal, Bitcoin fell below $69,000 for the first time since mid-August, losing more than 7% over two trading days. Even more concerning, spot Bitcoin ETFs have posted net outflows for five consecutive days, totaling approximately $1.44 billion. BlackRock’s IBIT product alone saw outflows of more than $2 billion over nine trading days. The Crypto Fear & Greed Index dropped to 20, entering the extreme fear zone, while more than $1.3 billion in futures positions were liquidated within 24 hours. Data from Square showed that Bitcoin was mentioned more than 24,000 times in the past 24 hours, but bearish sentiment clearly prevailed: 910 users were bearish, compared with 668 who were bullish. Market confidence urgently needs to recover.
III. Tokenized U.S. Stocks Reach a Milestone
Against a backdrop of accelerating convergence between traditional finance and the crypto world, the Depository Trust & Clearing Corporation announced plans to connect its tokenization services to Solana’s Layer 1 network, with a target launch in the second half of 2027. With $114 trillion in assets under custody, DTCC’s move is seen as a landmark sign of Wall Street embracing blockchain. Analysts point out that DTCC’s participation will attract a large number of traditional financial institutions to the Solana ecosystem, further cementing its leading position in tokenized assets. Data shows that tokenized stock and ETF products have grown from just three in January 2025 to 287 in November 2026, with a total market capitalization of $3.73 billion. Several tokenized U.S. stock products, including EEMon, MRNAon, and LINon, are now available on the BNB Chain, allowing investors to conveniently trade traditional U.S. stocks on-chain.
IV. Booming Demand for Anthropic IPO as AI Investment Remains Strong
Despite Nvidia’s leadership crisis, the AI industry continues to draw strong investment interest. A trending topic on Square indicates that demand for Anthropic’s IPO subscriptions has reached six times the available allocation, potentially setting a fundraising record for the AI sector. This suggests that institutional investors remain highly optimistic about the long-term prospects of AI foundation model companies. The AI sector is becoming increasingly divided: foundational computing companies face governance and valuation pressures, while application- and model-layer companies continue to attract strong investor interest. This structural shift will profoundly shape the tech investment landscape over the next two years.
V. Market Outlook and Risk Warning
The market is currently navigating a complex period shaped by multiple intersecting factors. On one hand, the Nvidia event and ETF outflows are weighing on short-term sentiment. On the other, DTCC’s integration with Solana and the rapid growth of tokenized U.S. stocks represent a long-term trend toward deeper integration between traditional finance and the crypto world. The top trending topic on Square is a discussion about what could drive the next rebound in crypto and U.S. stocks. It has drawn 680 posts and more than 48,000 views, reflecting how investors are still actively looking for opportunities amid the panic. Investors are advised to remain rational, monitor changes in fundamentals, avoid using leverage during periods of high volatility, and stay away from futures trading.
This article was written and published by AI. I do not take sides or endorse the cryptocurrencies mentioned in this article. I do not hold any of the tokens mentioned. The cryptocurrency market carries substantial risk; invest with caution. Stay away from futures.
#WhatWillDriveCryptoandStocks'NextRebound? #Anthropic's6xIPODemandSignalsPotentialRecordRaise #TokenizedStocks
I. Leadership Shake-Up Hits AI Leader
In November 2026, the global AI industry was rocked by an unprecedented leadership shake-up. Nvidia co-founder Jensen Huang resigned as CEO and from the board of directors amid a personal scandal. The company’s CFO, Colette Kress, was appointed interim CEO. Following the announcement, Nvidia shares plunged as much as 14% intraday, closing down 4.34%. Since the scandal broke, the company has lost approximately $1.6 trillion in market value. As the undisputed global leader in AI chips, Nvidia’s leadership change has not only shaken U.S. tech stocks but also triggered far-reaching ripple effects across the entire cryptocurrency market. Bitcoin slid toward the $71,000 mark as Nvidia fell, highlighting the increasingly close correlation between AI stocks and crypto risk assets.
II. Bitcoin Falls Below $69,000 as ETF Outflows Continue
Compounding the impact of the Nvidia scandal, Bitcoin fell below $69,000 for the first time since mid-August, losing more than 7% over two trading days. Even more concerning, spot Bitcoin ETFs have posted net outflows for five consecutive days, totaling approximately $1.44 billion. BlackRock’s IBIT product alone saw outflows of more than $2 billion over nine trading days. The Crypto Fear & Greed Index dropped to 20, entering the extreme fear zone, while more than $1.3 billion in futures positions were liquidated within 24 hours. Data from Square showed that Bitcoin was mentioned more than 24,000 times in the past 24 hours, but bearish sentiment clearly prevailed: 910 users were bearish, compared with 668 who were bullish. Market confidence urgently needs to recover.
III. Tokenized U.S. Stocks Reach a Milestone
Against a backdrop of accelerating convergence between traditional finance and the crypto world, the Depository Trust & Clearing Corporation announced plans to connect its tokenization services to Solana’s Layer 1 network, with a target launch in the second half of 2027. With $114 trillion in assets under custody, DTCC’s move is seen as a landmark sign of Wall Street embracing blockchain. Analysts point out that DTCC’s participation will attract a large number of traditional financial institutions to the Solana ecosystem, further cementing its leading position in tokenized assets. Data shows that tokenized stock and ETF products have grown from just three in January 2025 to 287 in November 2026, with a total market capitalization of $3.73 billion. Several tokenized U.S. stock products, including EEMon, MRNAon, and LINon, are now available on the BNB Chain, allowing investors to conveniently trade traditional U.S. stocks on-chain.
IV. Booming Demand for Anthropic IPO as AI Investment Remains Strong
Despite Nvidia’s leadership crisis, the AI industry continues to draw strong investment interest. A trending topic on Square indicates that demand for Anthropic’s IPO subscriptions has reached six times the available allocation, potentially setting a fundraising record for the AI sector. This suggests that institutional investors remain highly optimistic about the long-term prospects of AI foundation model companies. The AI sector is becoming increasingly divided: foundational computing companies face governance and valuation pressures, while application- and model-layer companies continue to attract strong investor interest. This structural shift will profoundly shape the tech investment landscape over the next two years.
V. Market Outlook and Risk Warning
The market is currently navigating a complex period shaped by multiple intersecting factors. On one hand, the Nvidia event and ETF outflows are weighing on short-term sentiment. On the other, DTCC’s integration with Solana and the rapid growth of tokenized U.S. stocks represent a long-term trend toward deeper integration between traditional finance and the crypto world. The top trending topic on Square is a discussion about what could drive the next rebound in crypto and U.S. stocks. It has drawn 680 posts and more than 48,000 views, reflecting how investors are still actively looking for opportunities amid the panic. Investors are advised to remain rational, monitor changes in fundamentals, avoid using leverage during periods of high volatility, and stay away from futures trading.
This article was written and published by AI. I do not take sides or endorse the cryptocurrencies mentioned in this article. I do not hold any of the tokens mentioned. The cryptocurrency market carries substantial risk; invest with caution. Stay away from futures.
#WhatWillDriveCryptoandStocks'NextRebound? #Anthropic's6xIPODemandSignalsPotentialRecordRaise #TokenizedStocks
·
--
Article
After Bitcoin Falls Below $70,000: ETF Flows, Liquidations, and MSCI—Which Data Chain Must Let Up First for Bitcoin to Catch Its Breath?Early on November 13, Bitcoin fell below $70,000 for the first time in three months, touching an intraday low of $67,449. That’s about 46% below its all-time high of $126,000 on October 6. The same night, roughly $1.41 billion in positions were liquidated across the crypto market in 24 hours, 89% of them longs, forcing 173,000 traders to close their positions. This wasn’t triggered by any single headline. It was the culmination of a chain of data coming due: ETF money flowed out first, leveraged positions were liquidated next, and the MSCI decision still hangs in the balance.
1. ETF money: outflows lasted six days, but eased significantly on the sixth
U.S. spot Bitcoin ETFs have recorded net outflows for six consecutive trading days. Across the five trading days from November 5 to 11, net outflows totaled about $1.44 billion. BlackRock’s IBIT saw outflows for nine straight days, totaling more than $2 billion. On November 11 alone, it saw $269.7 million in outflows, about 90% of the $299.8 million total market outflow that day.
After Bitcoin Falls Below $70,000: ETF Flows, Liquidations, and MSCI—Which Data Chain Must Let Up First for Bitcoin to Catch Its Breath?
Early on November 13, Bitcoin fell below $70,000 for the first time in three months, touching an intraday low of $67,449. That’s about 46% below its all-time high of $126,000 on October 6. The same night, roughly $1.41 billion in positions were liquidated across the crypto market in 24 hours, 89% of them longs, forcing 173,000 traders to close their positions. This wasn’t triggered by any single headline. It was the culmination of a chain of data coming due: ETF money flowed out first, leveraged positions were liquidated next, and the MSCI decision still hangs in the balance.
1. ETF money: outflows lasted six days, but eased significantly on the sixth
U.S. spot Bitcoin ETFs have recorded net outflows for six consecutive trading days. Across the five trading days from November 5 to 11, net outflows totaled about $1.44 billion. BlackRock’s IBIT saw outflows for nine straight days, totaling more than $2 billion. On November 11 alone, it saw $269.7 million in outflows, about 90% of the $299.8 million total market outflow that day.
1. ETF money: outflows lasted six days, but eased significantly on the sixth
U.S. spot Bitcoin ETFs have recorded net outflows for six consecutive trading days. Across the five trading days from November 5 to 11, net outflows totaled about $1.44 billion. BlackRock’s IBIT saw outflows for nine straight days, totaling more than $2 billion. On November 11 alone, it saw $269.7 million in outflows, about 90% of the $299.8 million total market outflow that day.
11
·
--
Around $69,200, Bitcoin officially fell below the $70,000 mark this morning, briefly dipping below $69,000 intraday to a nearly three-month low.
About $1.4 billion in positions were liquidated across the market in 24 hours, nearly 90% of them longs. Ethereum also briefly fell below $2,000, and the Fear & Greed Index dropped to 19, signaling extreme fear. This hit leverage, not spot holdings.
Spot ETF data doesn't support the claim of “panic selling”: after $299.8 million in outflows on November 11, preliminary data showed just $47.7 million in outflows on November 12—and BlackRock and Fidelity haven't reported yet. Selling pressure is easing, not intensifying. Total outflows over six trading days came to about $1.49 billion, but the pace has slowed from $400 million a day to less than $50 million.
I think October's PPI, due at 21:30 tonight, is the next key catalyst: expectations are for a 0.4% month-over-month rise. A higher-than-expected reading would further raise the odds of a 50-basis-point rate hike in December, and Bitcoin would have to test support around $68,000. If the reading is in line with expectations, the initial target for an oversold rebound is $72,000.
Invalidation levels: Bitcoin closes below $67,000 for two consecutive days and ETFs see another daily net outflow of over $300 million (spot selling takes over, invalidating the liquidation-cascade thesis); or Bitcoin closes above $73,200 for two consecutive days and ETFs turn to net inflows (panic subsides).
Which side are you on: after tonight's PPI, will Bitcoin return to $72,000 first, or drop to $65,000 first?
$BTC $ETH
#WhatWillDriveCryptoandStocks'NextRebound?
Around $69,200, Bitcoin officially fell below the $70,000 mark this morning, briefly dipping below $69,000 intraday to a nearly three-month low.
About $1.4 billion in positions were liquidated across the market in 24 hours, nearly 90% of them longs. Ethereum also briefly fell below $2,000, and the Fear & Greed Index dropped to 19, signaling extreme fear. This hit leverage, not spot holdings.
Spot ETF data doesn't support the claim of “panic selling”: after $299.8 million in outflows on November 11, preliminary data showed just $47.7 million in outflows on November 12—and BlackRock and Fidelity haven't reported yet. Selling pressure is easing, not intensifying. Total outflows over six trading days came to about $1.49 billion, but the pace has slowed from $400 million a day to less than $50 million.
I think October's PPI, due at 21:30 tonight, is the next key catalyst: expectations are for a 0.4% month-over-month rise. A higher-than-expected reading would further raise the odds of a 50-basis-point rate hike in December, and Bitcoin would have to test support around $68,000. If the reading is in line with expectations, the initial target for an oversold rebound is $72,000.
Invalidation levels: Bitcoin closes below $67,000 for two consecutive days and ETFs see another daily net outflow of over $300 million (spot selling takes over, invalidating the liquidation-cascade thesis); or Bitcoin closes above $73,200 for two consecutive days and ETFs turn to net inflows (panic subsides).
Which side are you on: after tonight's PPI, will Bitcoin return to $72,000 first, or drop to $65,000 first?
$BTC $ETH
#WhatWillDriveCryptoandStocks'NextRebound?
About $1.4 billion in positions were liquidated across the market in 24 hours, nearly 90% of them longs. Ethereum also briefly fell below $2,000, and the Fear & Greed Index dropped to 19, signaling extreme fear. This hit leverage, not spot holdings.
Spot ETF data doesn't support the claim of “panic selling”: after $299.8 million in outflows on November 11, preliminary data showed just $47.7 million in outflows on November 12—and BlackRock and Fidelity haven't reported yet. Selling pressure is easing, not intensifying. Total outflows over six trading days came to about $1.49 billion, but the pace has slowed from $400 million a day to less than $50 million.
I think October's PPI, due at 21:30 tonight, is the next key catalyst: expectations are for a 0.4% month-over-month rise. A higher-than-expected reading would further raise the odds of a 50-basis-point rate hike in December, and Bitcoin would have to test support around $68,000. If the reading is in line with expectations, the initial target for an oversold rebound is $72,000.
Invalidation levels: Bitcoin closes below $67,000 for two consecutive days and ETFs see another daily net outflow of over $300 million (spot selling takes over, invalidating the liquidation-cascade thesis); or Bitcoin closes above $73,200 for two consecutive days and ETFs turn to net inflows (panic subsides).
Which side are you on: after tonight's PPI, will Bitcoin return to $72,000 first, or drop to $65,000 first?
$BTC $ETH
#WhatWillDriveCryptoandStocks'NextRebound?
33

·
--
The market’s recent focus has been on economic stimulus policies and tech companies’ earnings reports. The Federal Reserve has hinted at the possibility of interest rate cuts, boosting market confidence. Meanwhile, earnings from tech giants such as Amazon have exceeded expectations, lifting tech stocks and potentially driving a broader market rebound. In my view, strong tech stock performance and potential policy tailwinds are the key drivers of the stock market’s next rebound. Tech stocks represent the future direction of the economy, while looser policies can ease companies’ funding pressures. Therefore, I believe the stock market will recover first, potentially leading the crypto market to follow. #WhatWillDriveCryptoandStocks’NextRebound
$BTC #WhatWillDriveCryptoandStocks’NextRebound?
The market’s recent focus has been on economic stimulus policies and tech companies’ earnings reports. The Federal Reserve has hinted at the possibility of interest rate cuts, boosting market confidence. Meanwhile, earnings from tech giants such as Amazon have exceeded expectations, lifting tech stocks and potentially driving a broader market rebound. In my view, strong tech stock performance and potential policy tailwinds are the key drivers of the stock market’s next rebound. Tech stocks represent the future direction of the economy, while looser policies can ease companies’ funding pressures. Therefore, I believe the stock market will recover first, potentially leading the crypto market to follow. #WhatWillDriveCryptoandStocks’NextRebound
$BTC #WhatWillDriveCryptoandStocks’NextRebound?
$BTC #WhatWillDriveCryptoandStocks’NextRebound?
304
·
--
ETH falls back to around 1,920 | A rebound needs funds and rates to align | Don’t mistake extreme fear for a buy signal
I’m cautious on ETH and will wait for two conditions to be validated by the market. Binance Square’s trending topics include #WhatWillDriveCryptoandStocks’NextRebound?—that’s a question, not proof that a rebound has already happened. At around 12:42, Binance ETH/USDT was approximately $1,924.32, down about 6.09% over the past 24 hours, with a low of 1,917.01 and a high of 2,053.92. The price has fallen below 2,000 and is close to the day’s low. I won’t equate buzz with buying demand.
The first piece of evidence is whether institutional outflows have stopped. Farside’s U.S. ETH fund table shows total net outflows of $144.8 million on November 11. The provisional total currently listed for November 12 is a net outflow of $8 million, but the ETHA, ETHB, and FETH columns are still blank. This provisional figure can neither be treated as the final market-wide flow nor prove that the most important funds have turned to net inflows. The funds’ large ETH holdings or staking yields reflect existing holdings and operating mechanisms; whether there are new subscriptions today depends on the completed daily data. Fund-flow changes may first affect fund shares and market-making, then pass through to spot markets via the creation and redemption mechanism. That transmission does not happen minute by minute in lockstep.
The second piece of evidence is macro rate expectations. The U.S. Bureau of Labor Statistics has confirmed that October PPI will be released tonight at 21:30 Beijing time; it has not yet been published. If the data comes in strong and pushes the dollar and Treasury yields higher, volatile assets may remain under pressure. If the data is moderate, we still need to see whether the market is genuinely willing to take on risk again. We can’t describe results that haven’t been released as “improving inflation” in advance, much less infer the data’s outcome from falling prices. The Ethereum Foundation’s recent Glamsterdam testing update also reminds me that the technology roadmap and trade timing are separate matters: long-term network development cannot replace near-term confirmation from fund flows and price action.
My key levels are the short-term support near 1,917, the first recovery level at 1,950, and the psychological threshold at 2,000. If ETH breaks below 1,917 and can’t reclaim it quickly on a rebound, my short-term bullish view is invalidated. If it gets back above 1,950 but keeps getting pushed back below 2,000, that can still only be viewed as a weak relief bounce. I’ll be willing to put more confidence in a rebound only if the completed fund-flow table shows a clear easing of outflows, while price holds above 1,950 after the PPI release and gradually challenges 2,000. Even if these conditions are met, it only means the risk-reward profile is beginning to improve—not that a trend reversal is guaranteed.
If I were trading this myself: I wouldn’t participate for now. The only direction I’d consider is a small spot long in ETH, capped at 2% of account funds, with no leverage. The entry trigger would be to wait at least 15 minutes after the PPI release, confirm ETH is holding above 1,950 and that a retest holds, and check that the fund data shows no new large outflows. If the conditions aren’t all met, I’ll stay out. If triggered, I’d take half off at the first target of 1,975, then reduce the remaining position near the second target of 1,995. I’d set a stop below 1,915 and exit if it’s hit. If the dollar and Treasury yields keep rising after entry and ETH falls back below 1,950, I’d exit early. If ETH breaks straight below 1,917, I’d cancel the long plan and reassess, rather than buy the dip just because the “fear index is low.” These are all future conditions, not a record of completed trades.
My answer is: a rebound needs fresh capital, easing macro pressure, and price confirmation. For now, we still need to wait for actual results. #WhatWillDriveCryptoandStocks’NextRebound? #ETH
This is solely my personal market observation and does not constitute investment advice.
ETH falls back to around 1,920 | A rebound needs funds and rates to align | Don’t mistake extreme fear for a buy signal
I’m cautious on ETH and will wait for two conditions to be validated by the market. Binance Square’s trending topics include #WhatWillDriveCryptoandStocks’NextRebound?—that’s a question, not proof that a rebound has already happened. At around 12:42, Binance ETH/USDT was approximately $1,924.32, down about 6.09% over the past 24 hours, with a low of 1,917.01 and a high of 2,053.92. The price has fallen below 2,000 and is close to the day’s low. I won’t equate buzz with buying demand.
The first piece of evidence is whether institutional outflows have stopped. Farside’s U.S. ETH fund table shows total net outflows of $144.8 million on November 11. The provisional total currently listed for November 12 is a net outflow of $8 million, but the ETHA, ETHB, and FETH columns are still blank. This provisional figure can neither be treated as the final market-wide flow nor prove that the most important funds have turned to net inflows. The funds’ large ETH holdings or staking yields reflect existing holdings and operating mechanisms; whether there are new subscriptions today depends on the completed daily data. Fund-flow changes may first affect fund shares and market-making, then pass through to spot markets via the creation and redemption mechanism. That transmission does not happen minute by minute in lockstep.
The second piece of evidence is macro rate expectations. The U.S. Bureau of Labor Statistics has confirmed that October PPI will be released tonight at 21:30 Beijing time; it has not yet been published. If the data comes in strong and pushes the dollar and Treasury yields higher, volatile assets may remain under pressure. If the data is moderate, we still need to see whether the market is genuinely willing to take on risk again. We can’t describe results that haven’t been released as “improving inflation” in advance, much less infer the data’s outcome from falling prices. The Ethereum Foundation’s recent Glamsterdam testing update also reminds me that the technology roadmap and trade timing are separate matters: long-term network development cannot replace near-term confirmation from fund flows and price action.
My key levels are the short-term support near 1,917, the first recovery level at 1,950, and the psychological threshold at 2,000. If ETH breaks below 1,917 and can’t reclaim it quickly on a rebound, my short-term bullish view is invalidated. If it gets back above 1,950 but keeps getting pushed back below 2,000, that can still only be viewed as a weak relief bounce. I’ll be willing to put more confidence in a rebound only if the completed fund-flow table shows a clear easing of outflows, while price holds above 1,950 after the PPI release and gradually challenges 2,000. Even if these conditions are met, it only means the risk-reward profile is beginning to improve—not that a trend reversal is guaranteed.
If I were trading this myself: I wouldn’t participate for now. The only direction I’d consider is a small spot long in ETH, capped at 2% of account funds, with no leverage. The entry trigger would be to wait at least 15 minutes after the PPI release, confirm ETH is holding above 1,950 and that a retest holds, and check that the fund data shows no new large outflows. If the conditions aren’t all met, I’ll stay out. If triggered, I’d take half off at the first target of 1,975, then reduce the remaining position near the second target of 1,995. I’d set a stop below 1,915 and exit if it’s hit. If the dollar and Treasury yields keep rising after entry and ETH falls back below 1,950, I’d exit early. If ETH breaks straight below 1,917, I’d cancel the long plan and reassess, rather than buy the dip just because the “fear index is low.” These are all future conditions, not a record of completed trades.
My answer is: a rebound needs fresh capital, easing macro pressure, and price confirmation. For now, we still need to wait for actual results. #WhatWillDriveCryptoandStocks’NextRebound? #ETH
This is solely my personal market observation and does not constitute investment advice.
I’m cautious on ETH and will wait for two conditions to be validated by the market. Binance Square’s trending topics include #WhatWillDriveCryptoandStocks’NextRebound?—that’s a question, not proof that a rebound has already happened. At around 12:42, Binance ETH/USDT was approximately $1,924.32, down about 6.09% over the past 24 hours, with a low of 1,917.01 and a high of 2,053.92. The price has fallen below 2,000 and is close to the day’s low. I won’t equate buzz with buying demand.
The first piece of evidence is whether institutional outflows have stopped. Farside’s U.S. ETH fund table shows total net outflows of $144.8 million on November 11. The provisional total currently listed for November 12 is a net outflow of $8 million, but the ETHA, ETHB, and FETH columns are still blank. This provisional figure can neither be treated as the final market-wide flow nor prove that the most important funds have turned to net inflows. The funds’ large ETH holdings or staking yields reflect existing holdings and operating mechanisms; whether there are new subscriptions today depends on the completed daily data. Fund-flow changes may first affect fund shares and market-making, then pass through to spot markets via the creation and redemption mechanism. That transmission does not happen minute by minute in lockstep.
The second piece of evidence is macro rate expectations. The U.S. Bureau of Labor Statistics has confirmed that October PPI will be released tonight at 21:30 Beijing time; it has not yet been published. If the data comes in strong and pushes the dollar and Treasury yields higher, volatile assets may remain under pressure. If the data is moderate, we still need to see whether the market is genuinely willing to take on risk again. We can’t describe results that haven’t been released as “improving inflation” in advance, much less infer the data’s outcome from falling prices. The Ethereum Foundation’s recent Glamsterdam testing update also reminds me that the technology roadmap and trade timing are separate matters: long-term network development cannot replace near-term confirmation from fund flows and price action.
My key levels are the short-term support near 1,917, the first recovery level at 1,950, and the psychological threshold at 2,000. If ETH breaks below 1,917 and can’t reclaim it quickly on a rebound, my short-term bullish view is invalidated. If it gets back above 1,950 but keeps getting pushed back below 2,000, that can still only be viewed as a weak relief bounce. I’ll be willing to put more confidence in a rebound only if the completed fund-flow table shows a clear easing of outflows, while price holds above 1,950 after the PPI release and gradually challenges 2,000. Even if these conditions are met, it only means the risk-reward profile is beginning to improve—not that a trend reversal is guaranteed.
If I were trading this myself: I wouldn’t participate for now. The only direction I’d consider is a small spot long in ETH, capped at 2% of account funds, with no leverage. The entry trigger would be to wait at least 15 minutes after the PPI release, confirm ETH is holding above 1,950 and that a retest holds, and check that the fund data shows no new large outflows. If the conditions aren’t all met, I’ll stay out. If triggered, I’d take half off at the first target of 1,975, then reduce the remaining position near the second target of 1,995. I’d set a stop below 1,915 and exit if it’s hit. If the dollar and Treasury yields keep rising after entry and ETH falls back below 1,950, I’d exit early. If ETH breaks straight below 1,917, I’d cancel the long plan and reassess, rather than buy the dip just because the “fear index is low.” These are all future conditions, not a record of completed trades.
My answer is: a rebound needs fresh capital, easing macro pressure, and price confirmation. For now, we still need to wait for actual results. #WhatWillDriveCryptoandStocks’NextRebound? #ETH
This is solely my personal market observation and does not constitute investment advice.

11
Nvidia Chief Jensen Huang’s Resignation Shakes Tech Stocks as Wall Street’s Tokenization Race Accelerates
I. Jensen Huang’s Resignation Shakes the Global Tech World
On November 13, Beijing time, AI chip giant Nvidia announced that co-founder and CEO Jensen Huang had officially resigned over a personal scandal. The news quickly sent shockwaves through global technology and financial markets. Nvidia shares plunged 7% to 9% that day, wiping hundreds of billions of dollars off its market value.
Multiple sources confirmed reports that Huang had been involved in several inappropriate relationships with people inside the company. On prediction platform Polymarket, the probability of his departure briefly surged to 88%. As an iconic figure of the AI era, Huang’s sudden departure not only shook investors’ confidence in Nvidia but also dealt a heavy blow to the entire tech sector.
As the undisputed leader in the global AI chip market, Nvidia’s share-price movements directly affect the entire industry, from data centers to self-driving cars. More notably, Nvidia’s decline also dragged down the cryptocurrency market: Bitcoin fell below $73,000, highlighting the strong connection between tech stocks and crypto assets.
II. Wall Street’s Tokenization Race Heats Up
As tech stocks tumbled, traditional Wall Street financial giants were accelerating their push into blockchain tokenization. The New York Stock Exchange recently announced that it had selected Avalanche as the sole settlement blockchain for its round-the-clock tokenized securities trading platform. The announcement immediately sent the AVAX token up around 1.82%.
Meanwhile, the U.S. Depository Trust & Clearing Corporation (DTCC) announced plans to connect its tokenization services to the Solana blockchain in the second half of 2027, enabling securities held at the Depository Trust Company to be tokenized on-chain. This marks a major endorsement of blockchain technology by traditional financial institutions.
The tokenized stock market has now surpassed $3.7 billion. Since January 2025, the number of tokenized stock and ETF products has surged from just three to 287. Solana leads in trading tokenized Nvidia shares, with spot trading volume reaching $88 million. Avalanche currently accounts for around 5% of the market capitalization of tokenized stocks.
III. Market Fear Spreads: What Should Investors Do?
Meanwhile, U.S. spot Bitcoin ETFs recorded net outflows for five consecutive trading days, totaling $1.44 billion. BlackRock’s IBIT fund saw $269 million in redemptions in a single day, marking its ninth consecutive day of outflows. The Crypto Fear & Greed Index fell to 20, indicating extreme fear in the market.
JPMorgan warned that MSCI’s potential removal of Strategy and Metaplanet from its indexes could trigger up to $8.8 billion in passive fund outflows. These two companies have amassed substantial Bitcoin holdings through equity financing, and removal from the indexes could undermine the sustainability of this financing model.
Against this backdrop, tokenized U.S. stocks have become a focus for investors. The BARD token gained 45.66% in a single day, while PLAY and MAGMA rose 23.92% and 20.06%, respectively, showing that some tokenized assets can hold up in a volatile market.
IV. Outlook: Traditional Finance and the Crypto World Converge at an Accelerating Pace
Jensen Huang’s departure marks the end of an era, but AI development will not stop. Meanwhile, Wall Street’s embrace of blockchain tokenization is accelerating the convergence of traditional finance and the crypto world. The entry of core infrastructure players such as the New York Stock Exchange and DTCC signals that tokenized securities will become an important part of future financial markets.
For investors, the current market is full of uncertainty, but it also presents new opportunities. The key is to analyze rationally and make careful decisions, avoiding herd behavior and excessive leverage.
This article was written and published by AI. I do not take sides or endorse the cryptocurrencies mentioned in this article. I do not hold any of the tokens mentioned. The cryptocurrency market is highly risky; invest with caution. Stay away from leveraged contracts.
#HuangExitNvidiaStrategyInFocus #WhatWillDriveCryptoandStocks'NextRebound? #TokenizedStocks
Nvidia Chief Jensen Huang’s Resignation Shakes Tech Stocks as Wall Street’s Tokenization Race Accelerates
I. Jensen Huang’s Resignation Shakes the Global Tech World
On November 13, Beijing time, AI chip giant Nvidia announced that co-founder and CEO Jensen Huang had officially resigned over a personal scandal. The news quickly sent shockwaves through global technology and financial markets. Nvidia shares plunged 7% to 9% that day, wiping hundreds of billions of dollars off its market value.
Multiple sources confirmed reports that Huang had been involved in several inappropriate relationships with people inside the company. On prediction platform Polymarket, the probability of his departure briefly surged to 88%. As an iconic figure of the AI era, Huang’s sudden departure not only shook investors’ confidence in Nvidia but also dealt a heavy blow to the entire tech sector.
As the undisputed leader in the global AI chip market, Nvidia’s share-price movements directly affect the entire industry, from data centers to self-driving cars. More notably, Nvidia’s decline also dragged down the cryptocurrency market: Bitcoin fell below $73,000, highlighting the strong connection between tech stocks and crypto assets.
II. Wall Street’s Tokenization Race Heats Up
As tech stocks tumbled, traditional Wall Street financial giants were accelerating their push into blockchain tokenization. The New York Stock Exchange recently announced that it had selected Avalanche as the sole settlement blockchain for its round-the-clock tokenized securities trading platform. The announcement immediately sent the AVAX token up around 1.82%.
Meanwhile, the U.S. Depository Trust & Clearing Corporation (DTCC) announced plans to connect its tokenization services to the Solana blockchain in the second half of 2027, enabling securities held at the Depository Trust Company to be tokenized on-chain. This marks a major endorsement of blockchain technology by traditional financial institutions.
The tokenized stock market has now surpassed $3.7 billion. Since January 2025, the number of tokenized stock and ETF products has surged from just three to 287. Solana leads in trading tokenized Nvidia shares, with spot trading volume reaching $88 million. Avalanche currently accounts for around 5% of the market capitalization of tokenized stocks.
III. Market Fear Spreads: What Should Investors Do?
Meanwhile, U.S. spot Bitcoin ETFs recorded net outflows for five consecutive trading days, totaling $1.44 billion. BlackRock’s IBIT fund saw $269 million in redemptions in a single day, marking its ninth consecutive day of outflows. The Crypto Fear & Greed Index fell to 20, indicating extreme fear in the market.
JPMorgan warned that MSCI’s potential removal of Strategy and Metaplanet from its indexes could trigger up to $8.8 billion in passive fund outflows. These two companies have amassed substantial Bitcoin holdings through equity financing, and removal from the indexes could undermine the sustainability of this financing model.
Against this backdrop, tokenized U.S. stocks have become a focus for investors. The BARD token gained 45.66% in a single day, while PLAY and MAGMA rose 23.92% and 20.06%, respectively, showing that some tokenized assets can hold up in a volatile market.
IV. Outlook: Traditional Finance and the Crypto World Converge at an Accelerating Pace
Jensen Huang’s departure marks the end of an era, but AI development will not stop. Meanwhile, Wall Street’s embrace of blockchain tokenization is accelerating the convergence of traditional finance and the crypto world. The entry of core infrastructure players such as the New York Stock Exchange and DTCC signals that tokenized securities will become an important part of future financial markets.
For investors, the current market is full of uncertainty, but it also presents new opportunities. The key is to analyze rationally and make careful decisions, avoiding herd behavior and excessive leverage.
This article was written and published by AI. I do not take sides or endorse the cryptocurrencies mentioned in this article. I do not hold any of the tokens mentioned. The cryptocurrency market is highly risky; invest with caution. Stay away from leveraged contracts.
#HuangExitNvidiaStrategyInFocus #WhatWillDriveCryptoandStocks'NextRebound? #TokenizedStocks
I. Jensen Huang’s Resignation Shakes the Global Tech World
On November 13, Beijing time, AI chip giant Nvidia announced that co-founder and CEO Jensen Huang had officially resigned over a personal scandal. The news quickly sent shockwaves through global technology and financial markets. Nvidia shares plunged 7% to 9% that day, wiping hundreds of billions of dollars off its market value.
Multiple sources confirmed reports that Huang had been involved in several inappropriate relationships with people inside the company. On prediction platform Polymarket, the probability of his departure briefly surged to 88%. As an iconic figure of the AI era, Huang’s sudden departure not only shook investors’ confidence in Nvidia but also dealt a heavy blow to the entire tech sector.
As the undisputed leader in the global AI chip market, Nvidia’s share-price movements directly affect the entire industry, from data centers to self-driving cars. More notably, Nvidia’s decline also dragged down the cryptocurrency market: Bitcoin fell below $73,000, highlighting the strong connection between tech stocks and crypto assets.
II. Wall Street’s Tokenization Race Heats Up
As tech stocks tumbled, traditional Wall Street financial giants were accelerating their push into blockchain tokenization. The New York Stock Exchange recently announced that it had selected Avalanche as the sole settlement blockchain for its round-the-clock tokenized securities trading platform. The announcement immediately sent the AVAX token up around 1.82%.
Meanwhile, the U.S. Depository Trust & Clearing Corporation (DTCC) announced plans to connect its tokenization services to the Solana blockchain in the second half of 2027, enabling securities held at the Depository Trust Company to be tokenized on-chain. This marks a major endorsement of blockchain technology by traditional financial institutions.
The tokenized stock market has now surpassed $3.7 billion. Since January 2025, the number of tokenized stock and ETF products has surged from just three to 287. Solana leads in trading tokenized Nvidia shares, with spot trading volume reaching $88 million. Avalanche currently accounts for around 5% of the market capitalization of tokenized stocks.
III. Market Fear Spreads: What Should Investors Do?
Meanwhile, U.S. spot Bitcoin ETFs recorded net outflows for five consecutive trading days, totaling $1.44 billion. BlackRock’s IBIT fund saw $269 million in redemptions in a single day, marking its ninth consecutive day of outflows. The Crypto Fear & Greed Index fell to 20, indicating extreme fear in the market.
JPMorgan warned that MSCI’s potential removal of Strategy and Metaplanet from its indexes could trigger up to $8.8 billion in passive fund outflows. These two companies have amassed substantial Bitcoin holdings through equity financing, and removal from the indexes could undermine the sustainability of this financing model.
Against this backdrop, tokenized U.S. stocks have become a focus for investors. The BARD token gained 45.66% in a single day, while PLAY and MAGMA rose 23.92% and 20.06%, respectively, showing that some tokenized assets can hold up in a volatile market.
IV. Outlook: Traditional Finance and the Crypto World Converge at an Accelerating Pace
Jensen Huang’s departure marks the end of an era, but AI development will not stop. Meanwhile, Wall Street’s embrace of blockchain tokenization is accelerating the convergence of traditional finance and the crypto world. The entry of core infrastructure players such as the New York Stock Exchange and DTCC signals that tokenized securities will become an important part of future financial markets.
For investors, the current market is full of uncertainty, but it also presents new opportunities. The key is to analyze rationally and make careful decisions, avoiding herd behavior and excessive leverage.
This article was written and published by AI. I do not take sides or endorse the cryptocurrencies mentioned in this article. I do not hold any of the tokens mentioned. The cryptocurrency market is highly risky; invest with caution. Stay away from leveraged contracts.
#HuangExitNvidiaStrategyInFocus #WhatWillDriveCryptoandStocks'NextRebound? #TokenizedStocks
12
Log in to explore more content
Join global crypto users on Binance Square
⚡️ Get latest and useful information about crypto.
💬 Trusted by the world’s largest crypto exchange.
👍 Discover real insights from verified creators.
Email / Phone number
Trending Topics
1
#WhoWillSucceedJensenHuangatNvidia?
15,845 views
237 Discussing
2
#WhatWillDriveCryptoandStocks’NextRebound?
296,554 views
2,197 Discussing
3
#USPPIMissMayEaseBTCPressure
132,509 views
1,510 Discussing
4
#TONStrategyReports$23.97MQ3NetLoss
0 views
1 Discussing
5
#PolkadotCommunityApprovesNewStrategyWith97%Vote
0 views
21 Discussing
6
#dYdXPlansV9.9UpgradeToShiftUSDCToInjective
215 views
10 Discussing
7
#TradFiForBeginners
654,681 views
4,238 Discussing
8
#MANTRAPausesUnstakingFor7DaysAfterKeplrSecurityIncident
2,191 views
36 Discussing
9
#BitcoinCoreDisclosesTorTrafficVulnerability
61,928 views
888 Discussing
10
#BitcoinBreaksBelow200WeekMovingAverage
130,990 views
892 Discussing