

castbot_io
6.7k Posts

castbot_io
Report
Block User
BTC/ETH 新闻快讯和观点,价格异动实时推,在castbot_io主页让AI帮你生成合规贴,帮你曝光!
Open Trade

BTC Holder
Frequent Trader
4.9 Years
375 Following
269 Followers
247 Liked
Posts
Portfolio
All
Quotes
Videos
PINNED
·
--
📰 News Flash: What This Message Means for BTC/ETH
📊 Price Volatility: Wick wicks, liquidations, whale transfers—minute-level alerts
If you want real-time push notifications, go to castbot.io
🤖 You can also use castbot.io to have AI generate content + compliance filtering to help you get exposure!
⚠️ Not investment advice
📰 News Flash: What This Message Means for BTC/ETH
📊 Price Volatility: Wick wicks, liquidations, whale transfers—minute-level alerts
If you want real-time push notifications, go to castbot.io
🤖 You can also use castbot.io to have AI generate content + compliance filtering to help you get exposure!
⚠️ Not investment advice
📊 Price Volatility: Wick wicks, liquidations, whale transfers—minute-level alerts
If you want real-time push notifications, go to castbot.io
🤖 You can also use castbot.io to have AI generate content + compliance filtering to help you get exposure!
⚠️ Not investment advice
118
·
--
📰 BNB Chain Leads Growth in Token Funds: Is the $3.7B Inflow a Fluke or a Trend?
Over the past few months, the size of token funds on BNB Chain has surged by $370 million, making it the leader among all blockchains. This means more and more money is flowing into financial products on BNB Chain, such as lending and derivatives, which are somewhat similar to traditional financial products. For investors, choosing funds on BNB Chain may be safer than buying tokens directly, since funds can diversify risk. For BNB Chain itself, this means its ecosystem is becoming more complete and could attract more institutional capital in the future.
Why does this news matter?
Behind this news is a long-term trend in digital assets: bringing traditional financial practices onto the blockchain. BNB Chain’s success can be attributed to several factors. First, its native token, BNB, has a wide range of uses across the chain, including paying transaction fees and participating in on-chain governance. Second, the BNB Chain team has consistently worked to attract developers and projects. There are now many DeFi projects running on the chain, offering plenty of choices and naturally encouraging users to invest. Third, compared with other public blockchains, BNB Chain has relatively low fees and high capital efficiency. This means that as the digital asset ecosystem reaches a certain level of development, capital will need somewhere to go, and BNB Chain’s products are well positioned to meet that demand.
Market impact
From a market perspective, the growth of token funds on BNB Chain may lead investors to see this sector as hot in the short term, potentially accelerating the development of similar products on other chains. In the long term, however, it signals that the digital asset industry is gradually maturing, shifting from simply speculating on tokens toward more complex financial investments. For BTC and ETH, this news is not directly bullish, since they are already the most mainstream cryptocurrencies, but it can be seen as a sign that the broader market ecosystem is becoming more diverse. If other chains can also launch similar products successfully, there may be more options in the future, and capital could become more widely distributed.
💡 BNB Chain’s growth reflects the digital asset industry’s increasing maturity and suggests that more on-chain financial products may emerge in the future. If token funds on other chains fail to keep pace, this trend may slow down.
This article was not sponsored by any project, and the author does not hold any of the assets mentioned.
According to CryptoBriefing
$BNB $BTC $ETH
📰 BNB Chain Leads Growth in Token Funds: Is the $3.7B Inflow a Fluke or a Trend?
Over the past few months, the size of token funds on BNB Chain has surged by $370 million, making it the leader among all blockchains. This means more and more money is flowing into financial products on BNB Chain, such as lending and derivatives, which are somewhat similar to traditional financial products. For investors, choosing funds on BNB Chain may be safer than buying tokens directly, since funds can diversify risk. For BNB Chain itself, this means its ecosystem is becoming more complete and could attract more institutional capital in the future.
Why does this news matter?
Behind this news is a long-term trend in digital assets: bringing traditional financial practices onto the blockchain. BNB Chain’s success can be attributed to several factors. First, its native token, BNB, has a wide range of uses across the chain, including paying transaction fees and participating in on-chain governance. Second, the BNB Chain team has consistently worked to attract developers and projects. There are now many DeFi projects running on the chain, offering plenty of choices and naturally encouraging users to invest. Third, compared with other public blockchains, BNB Chain has relatively low fees and high capital efficiency. This means that as the digital asset ecosystem reaches a certain level of development, capital will need somewhere to go, and BNB Chain’s products are well positioned to meet that demand.
Market impact
From a market perspective, the growth of token funds on BNB Chain may lead investors to see this sector as hot in the short term, potentially accelerating the development of similar products on other chains. In the long term, however, it signals that the digital asset industry is gradually maturing, shifting from simply speculating on tokens toward more complex financial investments. For BTC and ETH, this news is not directly bullish, since they are already the most mainstream cryptocurrencies, but it can be seen as a sign that the broader market ecosystem is becoming more diverse. If other chains can also launch similar products successfully, there may be more options in the future, and capital could become more widely distributed.
💡 BNB Chain’s growth reflects the digital asset industry’s increasing maturity and suggests that more on-chain financial products may emerge in the future. If token funds on other chains fail to keep pace, this trend may slow down.
This article was not sponsored by any project, and the author does not hold any of the assets mentioned.
According to CryptoBriefing
$BNB $BTC $ETH
Over the past few months, the size of token funds on BNB Chain has surged by $370 million, making it the leader among all blockchains. This means more and more money is flowing into financial products on BNB Chain, such as lending and derivatives, which are somewhat similar to traditional financial products. For investors, choosing funds on BNB Chain may be safer than buying tokens directly, since funds can diversify risk. For BNB Chain itself, this means its ecosystem is becoming more complete and could attract more institutional capital in the future.
Why does this news matter?
Behind this news is a long-term trend in digital assets: bringing traditional financial practices onto the blockchain. BNB Chain’s success can be attributed to several factors. First, its native token, BNB, has a wide range of uses across the chain, including paying transaction fees and participating in on-chain governance. Second, the BNB Chain team has consistently worked to attract developers and projects. There are now many DeFi projects running on the chain, offering plenty of choices and naturally encouraging users to invest. Third, compared with other public blockchains, BNB Chain has relatively low fees and high capital efficiency. This means that as the digital asset ecosystem reaches a certain level of development, capital will need somewhere to go, and BNB Chain’s products are well positioned to meet that demand.
Market impact
From a market perspective, the growth of token funds on BNB Chain may lead investors to see this sector as hot in the short term, potentially accelerating the development of similar products on other chains. In the long term, however, it signals that the digital asset industry is gradually maturing, shifting from simply speculating on tokens toward more complex financial investments. For BTC and ETH, this news is not directly bullish, since they are already the most mainstream cryptocurrencies, but it can be seen as a sign that the broader market ecosystem is becoming more diverse. If other chains can also launch similar products successfully, there may be more options in the future, and capital could become more widely distributed.
💡 BNB Chain’s growth reflects the digital asset industry’s increasing maturity and suggests that more on-chain financial products may emerge in the future. If token funds on other chains fail to keep pace, this trend may slow down.
This article was not sponsored by any project, and the author does not hold any of the assets mentioned.
According to CryptoBriefing
$BNB $BTC $ETH




301
·
--
📰 Just a couple of days ago, we said Bitcoin’s $80K consolidation was about to end. Now people are saying the bear market is over—is that really credible?
Galaxy Research suddenly announced that Bitcoin’s bear market ended in June and that it has entered an accumulation phase. In other words, Bitcoin could be gearing up to rise, but the market is still full of uncertainty, so caution is warranted. That’s good news for those of us watching Bitcoin, but don’t rush in—there are still risks ahead.
Why does this news matter?
The idea behind this news is simple: are people starting to accumulate Bitcoin ahead of a potential rise? Bitcoin’s bear market has dragged on for quite a while, and now some are saying it may have bottomed, suggesting market sentiment could be shifting. Compared with previous signals, this one looks more like money is actually starting to flow in. Similar reports have appeared before, but this time the message is clearer.
Impact on the market
For prices, this is certainly a sentiment boost. Bitcoin is currently at $79,950. If it can hold at this level, a further rally may become more likely. The broader crypto market—especially ETH—could also strengthen. In terms of capital flows, institutions may be starting to gradually increase their Bitcoin holdings. A similar event happened last December: people made comparable claims, but they didn’t pan out. What’s different this time is that Bitcoin hasn’t made a new low.
Trading approach
Honestly, it’s a little early to conclude that Bitcoin is about to start rising, but this signal is worth watching closely. If Bitcoin can hold above $80K over the next few days, this thesis could become more compelling. If there’s a sharp drop, the thesis no longer holds.
If X happens, this thesis is invalidated
Source
According to CryptoBriefing
This article is not sponsored by any project. The author does not hold any of the assets mentioned.
$BTC $ETH #BTC #ETH
⚠️ This is not investment advice. Predictions are for reference only.
#EarningsSeason
📰 Just a couple of days ago, we said Bitcoin’s $80K consolidation was about to end. Now people are saying the bear market is over—is that really credible?
Galaxy Research suddenly announced that Bitcoin’s bear market ended in June and that it has entered an accumulation phase. In other words, Bitcoin could be gearing up to rise, but the market is still full of uncertainty, so caution is warranted. That’s good news for those of us watching Bitcoin, but don’t rush in—there are still risks ahead.
Why does this news matter?
The idea behind this news is simple: are people starting to accumulate Bitcoin ahead of a potential rise? Bitcoin’s bear market has dragged on for quite a while, and now some are saying it may have bottomed, suggesting market sentiment could be shifting. Compared with previous signals, this one looks more like money is actually starting to flow in. Similar reports have appeared before, but this time the message is clearer.
Impact on the market
For prices, this is certainly a sentiment boost. Bitcoin is currently at $79,950. If it can hold at this level, a further rally may become more likely. The broader crypto market—especially ETH—could also strengthen. In terms of capital flows, institutions may be starting to gradually increase their Bitcoin holdings. A similar event happened last December: people made comparable claims, but they didn’t pan out. What’s different this time is that Bitcoin hasn’t made a new low.
Trading approach
Honestly, it’s a little early to conclude that Bitcoin is about to start rising, but this signal is worth watching closely. If Bitcoin can hold above $80K over the next few days, this thesis could become more compelling. If there’s a sharp drop, the thesis no longer holds.
If X happens, this thesis is invalidated
Source
According to CryptoBriefing
This article is not sponsored by any project. The author does not hold any of the assets mentioned.
$BTC $ETH #BTC #ETH
⚠️ This is not investment advice. Predictions are for reference only.
#EarningsSeason
Galaxy Research suddenly announced that Bitcoin’s bear market ended in June and that it has entered an accumulation phase. In other words, Bitcoin could be gearing up to rise, but the market is still full of uncertainty, so caution is warranted. That’s good news for those of us watching Bitcoin, but don’t rush in—there are still risks ahead.
Why does this news matter?
The idea behind this news is simple: are people starting to accumulate Bitcoin ahead of a potential rise? Bitcoin’s bear market has dragged on for quite a while, and now some are saying it may have bottomed, suggesting market sentiment could be shifting. Compared with previous signals, this one looks more like money is actually starting to flow in. Similar reports have appeared before, but this time the message is clearer.
Impact on the market
For prices, this is certainly a sentiment boost. Bitcoin is currently at $79,950. If it can hold at this level, a further rally may become more likely. The broader crypto market—especially ETH—could also strengthen. In terms of capital flows, institutions may be starting to gradually increase their Bitcoin holdings. A similar event happened last December: people made comparable claims, but they didn’t pan out. What’s different this time is that Bitcoin hasn’t made a new low.
Trading approach
Honestly, it’s a little early to conclude that Bitcoin is about to start rising, but this signal is worth watching closely. If Bitcoin can hold above $80K over the next few days, this thesis could become more compelling. If there’s a sharp drop, the thesis no longer holds.
If X happens, this thesis is invalidated
Source
According to CryptoBriefing
This article is not sponsored by any project. The author does not hold any of the assets mentioned.
$BTC $ETH #BTC #ETH
⚠️ This is not investment advice. Predictions are for reference only.
#EarningsSeason



337
·
--
📰 Why Is Solana’s Geo-Based Leader Proposal Keeping Validators Up at Night?
Solana is exploring a proposal to determine leader handoffs based on geographic location, aiming to help validators switch faster by grouping them according to proximity. But the idea comes with a warning: grouping leaders in specific regions could weaken decentralized security, forcing validators to choose between faster system responses and the risk of potential single points of failure.
Why does this matter?
Solana’s proposal aims to address a pain point in today’s blockchains: during leader handoffs, validators have to wait for cross-continent network latency, sometimes for several minutes. Geographic grouping could significantly shorten this window. But there’s another side to the coin: decentralization means you can’t have too many leaders clustered in the same region—which conflicts with geographic proximity. If something goes wrong in one location, such as an earthquake or cyberattack, validators across the entire region could be affected.
Market impact
The news is neutral for Solana and won’t change how the market views its technology in the short term. Solana has always positioned itself as a high-throughput network, and this is simply one technical option for improving speed. Whether validators are willing to adopt it depends on whether they trust Solana to strike the right balance between security and efficiency. If other blockchains follow suit, it could accelerate the ecosystem’s shift toward geographic optimization. The impact on BTC and ETH is limited because their validators are more evenly distributed geographically.
💡 This means Solana may try to use geographic optimization to increase transaction speeds, but validators may demand greater security assurances in return. If implemented, the proposal is unlikely to have a direct impact on SOL’s price in the short term. However, if validators leave due to concerns, token supply could increase.
This article is not sponsored by any project, and the author does not hold any of the assets mentioned.
⚠️ This is not investment advice. Predictions are for reference only.
$SOL $BTC $ETH
📰 Why Is Solana’s Geo-Based Leader Proposal Keeping Validators Up at Night?
Solana is exploring a proposal to determine leader handoffs based on geographic location, aiming to help validators switch faster by grouping them according to proximity. But the idea comes with a warning: grouping leaders in specific regions could weaken decentralized security, forcing validators to choose between faster system responses and the risk of potential single points of failure.
Why does this matter?
Solana’s proposal aims to address a pain point in today’s blockchains: during leader handoffs, validators have to wait for cross-continent network latency, sometimes for several minutes. Geographic grouping could significantly shorten this window. But there’s another side to the coin: decentralization means you can’t have too many leaders clustered in the same region—which conflicts with geographic proximity. If something goes wrong in one location, such as an earthquake or cyberattack, validators across the entire region could be affected.
Market impact
The news is neutral for Solana and won’t change how the market views its technology in the short term. Solana has always positioned itself as a high-throughput network, and this is simply one technical option for improving speed. Whether validators are willing to adopt it depends on whether they trust Solana to strike the right balance between security and efficiency. If other blockchains follow suit, it could accelerate the ecosystem’s shift toward geographic optimization. The impact on BTC and ETH is limited because their validators are more evenly distributed geographically.
💡 This means Solana may try to use geographic optimization to increase transaction speeds, but validators may demand greater security assurances in return. If implemented, the proposal is unlikely to have a direct impact on SOL’s price in the short term. However, if validators leave due to concerns, token supply could increase.
This article is not sponsored by any project, and the author does not hold any of the assets mentioned.
⚠️ This is not investment advice. Predictions are for reference only.
$SOL $BTC $ETH
Solana is exploring a proposal to determine leader handoffs based on geographic location, aiming to help validators switch faster by grouping them according to proximity. But the idea comes with a warning: grouping leaders in specific regions could weaken decentralized security, forcing validators to choose between faster system responses and the risk of potential single points of failure.
Why does this matter?
Solana’s proposal aims to address a pain point in today’s blockchains: during leader handoffs, validators have to wait for cross-continent network latency, sometimes for several minutes. Geographic grouping could significantly shorten this window. But there’s another side to the coin: decentralization means you can’t have too many leaders clustered in the same region—which conflicts with geographic proximity. If something goes wrong in one location, such as an earthquake or cyberattack, validators across the entire region could be affected.
Market impact
The news is neutral for Solana and won’t change how the market views its technology in the short term. Solana has always positioned itself as a high-throughput network, and this is simply one technical option for improving speed. Whether validators are willing to adopt it depends on whether they trust Solana to strike the right balance between security and efficiency. If other blockchains follow suit, it could accelerate the ecosystem’s shift toward geographic optimization. The impact on BTC and ETH is limited because their validators are more evenly distributed geographically.
💡 This means Solana may try to use geographic optimization to increase transaction speeds, but validators may demand greater security assurances in return. If implemented, the proposal is unlikely to have a direct impact on SOL’s price in the short term. However, if validators leave due to concerns, token supply could increase.
This article is not sponsored by any project, and the author does not hold any of the assets mentioned.
⚠️ This is not investment advice. Predictions are for reference only.
$SOL $BTC $ETH



350
·
--
📰 Is Bitcoin’s $80K consolidation about to end? ARP Digital says macro events are on the countdown
Bitcoin is currently consolidating around the $80K mark, but market analysis firm ARP Digital predicts that this situation could soon break. The firm believes that a series of major macroeconomic events on the horizon could bring significant changes to Bitcoin’s price action, directly affecting investors’ strategies and overall market dynamics.
Why does this news matter?
The forecast centers on the anticipated “macro events.” In today’s global economic environment, any major policy shift, geopolitical development, or financial data release could trigger sharp swings in Bitcoin’s price. ARP Digital’s view is not unfounded: historically, Bitcoin has often shown greater volatility around key economic events. This reflects the market digesting the uncertainty ahead or reacting in advance to potential positive or negative developments. For Bitcoin, consolidation around key price levels like $80K is often a precursor to a major trend reversal.
Market impact
In the short term, concerns about uncertainty surrounding macro events may lead investors to adopt a cautious approach, leaving Bitcoin under continued selling pressure around $80K. But once an event’s actual outcome meets or exceeds market expectations, Bitcoin could quickly break out of its current trading range. That breakout could be upward or downward, depending on the nature of the event and how the market reassesses the economic outlook. More broadly, if this event validates Bitcoin’s role as a “macroeconomic indicator,” it could further reinforce its reputation as a store-of-value asset and attract more attention from traditional investors. For Bitcoin and Ethereum, this means the current volatility window is a period that leveraged traders and long-term holders should watch closely.
Trading outlook
The current consolidation around $80K looks more like a brief accumulation phase than the end of a trend. If Bitcoin holds above $80K over the next few days and macro events unfold relatively smoothly, $80K could form a comparatively strong support level, providing a foundation for further gains. However, if the market prices in risk ahead of the macro events and Bitcoin falls below $79K, the current consolidation structure around $80K could be at risk of breaking down.
This article is not sponsored by any project. The author does not hold any of the assets mentioned.
⚠️ This is not investment advice. Predictions are for reference only.
#EarningsSeason
$BTC $ETH $BNB
📰 Is Bitcoin’s $80K consolidation about to end? ARP Digital says macro events are on the countdown
Bitcoin is currently consolidating around the $80K mark, but market analysis firm ARP Digital predicts that this situation could soon break. The firm believes that a series of major macroeconomic events on the horizon could bring significant changes to Bitcoin’s price action, directly affecting investors’ strategies and overall market dynamics.
Why does this news matter?
The forecast centers on the anticipated “macro events.” In today’s global economic environment, any major policy shift, geopolitical development, or financial data release could trigger sharp swings in Bitcoin’s price. ARP Digital’s view is not unfounded: historically, Bitcoin has often shown greater volatility around key economic events. This reflects the market digesting the uncertainty ahead or reacting in advance to potential positive or negative developments. For Bitcoin, consolidation around key price levels like $80K is often a precursor to a major trend reversal.
Market impact
In the short term, concerns about uncertainty surrounding macro events may lead investors to adopt a cautious approach, leaving Bitcoin under continued selling pressure around $80K. But once an event’s actual outcome meets or exceeds market expectations, Bitcoin could quickly break out of its current trading range. That breakout could be upward or downward, depending on the nature of the event and how the market reassesses the economic outlook. More broadly, if this event validates Bitcoin’s role as a “macroeconomic indicator,” it could further reinforce its reputation as a store-of-value asset and attract more attention from traditional investors. For Bitcoin and Ethereum, this means the current volatility window is a period that leveraged traders and long-term holders should watch closely.
Trading outlook
The current consolidation around $80K looks more like a brief accumulation phase than the end of a trend. If Bitcoin holds above $80K over the next few days and macro events unfold relatively smoothly, $80K could form a comparatively strong support level, providing a foundation for further gains. However, if the market prices in risk ahead of the macro events and Bitcoin falls below $79K, the current consolidation structure around $80K could be at risk of breaking down.
This article is not sponsored by any project. The author does not hold any of the assets mentioned.
⚠️ This is not investment advice. Predictions are for reference only.
#EarningsSeason
$BTC $ETH $BNB
Bitcoin is currently consolidating around the $80K mark, but market analysis firm ARP Digital predicts that this situation could soon break. The firm believes that a series of major macroeconomic events on the horizon could bring significant changes to Bitcoin’s price action, directly affecting investors’ strategies and overall market dynamics.
Why does this news matter?
The forecast centers on the anticipated “macro events.” In today’s global economic environment, any major policy shift, geopolitical development, or financial data release could trigger sharp swings in Bitcoin’s price. ARP Digital’s view is not unfounded: historically, Bitcoin has often shown greater volatility around key economic events. This reflects the market digesting the uncertainty ahead or reacting in advance to potential positive or negative developments. For Bitcoin, consolidation around key price levels like $80K is often a precursor to a major trend reversal.
Market impact
In the short term, concerns about uncertainty surrounding macro events may lead investors to adopt a cautious approach, leaving Bitcoin under continued selling pressure around $80K. But once an event’s actual outcome meets or exceeds market expectations, Bitcoin could quickly break out of its current trading range. That breakout could be upward or downward, depending on the nature of the event and how the market reassesses the economic outlook. More broadly, if this event validates Bitcoin’s role as a “macroeconomic indicator,” it could further reinforce its reputation as a store-of-value asset and attract more attention from traditional investors. For Bitcoin and Ethereum, this means the current volatility window is a period that leveraged traders and long-term holders should watch closely.
Trading outlook
The current consolidation around $80K looks more like a brief accumulation phase than the end of a trend. If Bitcoin holds above $80K over the next few days and macro events unfold relatively smoothly, $80K could form a comparatively strong support level, providing a foundation for further gains. However, if the market prices in risk ahead of the macro events and Bitcoin falls below $79K, the current consolidation structure around $80K could be at risk of breaking down.
This article is not sponsored by any project. The author does not hold any of the assets mentioned.
⚠️ This is not investment advice. Predictions are for reference only.
#EarningsSeason
$BTC $ETH $BNB



390
·
--
📰 The Miners’ Shield Has Been Breached: Nearly $1 Million Stolen from a Solana Bot—What Does It Mean?
Bloom, an automated trading bot on Solana, was hacked, resulting in losses of nearly $1 million. The hacker stole 49 wallets belonging to 9 users, but the company says no keys were stolen and it will fully reimburse users. So how did the hacker pull it off? Through a vulnerability in a third-party tool.
Why does this news matter?
This attack didn’t directly target Bloom’s code. Instead, it exploited a vulnerability in a third-party tool used in its system. This exposes the fragility of the DeFi bot ecosystem: if one link fails, the whole chain could collapse. Why is this important? Because it shows that:
- It’s not just major projects that get hacked—even bots, the supposed “security guards,” can get caught in the crossfire.
- DeFi’s “untrusted-on-untrusted” problem (untrusted code plus untrusted third parties) means bots can end up making things worse.
Market impact
For Solana, although the company claims no keys were lost, this incident has made the market question the security of bot systems. The short-term sentiment impact is negative because:
- SOL at $101.37 may face more scrutiny.
- This could trigger a domino effect of concerns about the security of the entire Solana DeFi ecosystem.
- Funds may temporarily flow out of automated pools such as bots.
Similar incidents in the past? SmartBee on Binance Smart Chain had a similar vulnerability in 2019, but on a much smaller scale. This incident is larger and took place on a popular chain like Solana, so its impact is broader.
Trading approach
💡 For SOL, below $95 is a relatively safe zone—but that thesis is invalidated if it later turns out that Bloom’s private keys really were lost. Put simply: the bot tool is starting to fail.
This article is not sponsored by any project. The author does not hold any of the assets mentioned.
⚠️ This is not investment advice. Predictions are for reference only.
$SOL #SecurityIncident
📰 The Miners’ Shield Has Been Breached: Nearly $1 Million Stolen from a Solana Bot—What Does It Mean?
Bloom, an automated trading bot on Solana, was hacked, resulting in losses of nearly $1 million. The hacker stole 49 wallets belonging to 9 users, but the company says no keys were stolen and it will fully reimburse users. So how did the hacker pull it off? Through a vulnerability in a third-party tool.
Why does this news matter?
This attack didn’t directly target Bloom’s code. Instead, it exploited a vulnerability in a third-party tool used in its system. This exposes the fragility of the DeFi bot ecosystem: if one link fails, the whole chain could collapse. Why is this important? Because it shows that:
- It’s not just major projects that get hacked—even bots, the supposed “security guards,” can get caught in the crossfire.
- DeFi’s “untrusted-on-untrusted” problem (untrusted code plus untrusted third parties) means bots can end up making things worse.
Market impact
For Solana, although the company claims no keys were lost, this incident has made the market question the security of bot systems. The short-term sentiment impact is negative because:
- SOL at $101.37 may face more scrutiny.
- This could trigger a domino effect of concerns about the security of the entire Solana DeFi ecosystem.
- Funds may temporarily flow out of automated pools such as bots.
Similar incidents in the past? SmartBee on Binance Smart Chain had a similar vulnerability in 2019, but on a much smaller scale. This incident is larger and took place on a popular chain like Solana, so its impact is broader.
Trading approach
💡 For SOL, below $95 is a relatively safe zone—but that thesis is invalidated if it later turns out that Bloom’s private keys really were lost. Put simply: the bot tool is starting to fail.
This article is not sponsored by any project. The author does not hold any of the assets mentioned.
⚠️ This is not investment advice. Predictions are for reference only.
$SOL #SecurityIncident
Bloom, an automated trading bot on Solana, was hacked, resulting in losses of nearly $1 million. The hacker stole 49 wallets belonging to 9 users, but the company says no keys were stolen and it will fully reimburse users. So how did the hacker pull it off? Through a vulnerability in a third-party tool.
Why does this news matter?
This attack didn’t directly target Bloom’s code. Instead, it exploited a vulnerability in a third-party tool used in its system. This exposes the fragility of the DeFi bot ecosystem: if one link fails, the whole chain could collapse. Why is this important? Because it shows that:
- It’s not just major projects that get hacked—even bots, the supposed “security guards,” can get caught in the crossfire.
- DeFi’s “untrusted-on-untrusted” problem (untrusted code plus untrusted third parties) means bots can end up making things worse.
Market impact
For Solana, although the company claims no keys were lost, this incident has made the market question the security of bot systems. The short-term sentiment impact is negative because:
- SOL at $101.37 may face more scrutiny.
- This could trigger a domino effect of concerns about the security of the entire Solana DeFi ecosystem.
- Funds may temporarily flow out of automated pools such as bots.
Similar incidents in the past? SmartBee on Binance Smart Chain had a similar vulnerability in 2019, but on a much smaller scale. This incident is larger and took place on a popular chain like Solana, so its impact is broader.
Trading approach
💡 For SOL, below $95 is a relatively safe zone—but that thesis is invalidated if it later turns out that Bloom’s private keys really were lost. Put simply: the bot tool is starting to fail.
This article is not sponsored by any project. The author does not hold any of the assets mentioned.
⚠️ This is not investment advice. Predictions are for reference only.
$SOL #SecurityIncident




113
·
--
📰 ETF funds suddenly reverse course as Bitcoin falls below $80,000: Why are long positions taking a major hit?
From Thursday to Friday last week, after Bitcoin ETFs had recorded three consecutive days of net inflows, spot Bitcoin ETFs suddenly saw $773 million in outflows—more than twice the inflows recorded the previous day. Even more dramatically, on the same day as the ETF outflows, Bitcoin briefly fell below the $80,000 mark, triggering stop-losses on a large number of long positions and resulting in total losses of $404 million within four hours. It was like slamming on the brakes just as the market was feeling optimistic, with both money and confidence fleeing at once.
Why does this news matter?
The sudden reversal in ETF flows is more than a simple market fluctuation; it signals a major shift in investor sentiment. First, three consecutive days of net ETF inflows had shown that institutional confidence in crypto assets was recovering, but Friday’s reversal suggests that confidence remains fragile. More importantly, the outflows occurred as Bitcoin’s price approached a previous resistance level—a point where bullish and bearish forces often clash intensely. When Bitcoin breaks below the psychological $80,000 threshold as ETF funds flow out at the same time, it can trigger a large number of stop-loss orders and create a vicious cycle.
The impact on the broader market is evident on several levels: First, it exposes the risk aversion of ETF investors who bought in at higher prices; second, it suggests institutional investors may be reassessing crypto market valuations; third, it indicates that uncertainty over the regulatory outlook is increasing investors’ risk exposure. Historically, similar events—such as the sudden outflows from Bitcoin ETFs amid market panic in March 2020—ultimately accelerated price declines.
Market impact
In the short term, $80,000 is an important dividing line between bullish and bearish sentiment for Bitcoin, and ETF outflows have intensified bearish momentum. In the medium to long term, however, the strength of support in this price range remains to be tested. If Bitcoin can hold in the $78,000–$79,000 range, the ETF outflows may prove to be merely a sentiment-driven pullback. But if it falls below $77,000, these outflows could accelerate into sustained capital flight. From an industry-cycle perspective, this comes during a period of regulatory uncertainty, and the outflows may reflect investors seeking to hedge against potential policy changes.
Historically, sudden ETF outflows of this kind have mostly occurred after major negative market news. What makes this time different is that the earlier inflows had provided some cushion for the market. This suggests the current outflows are more of a mix of "profit-taking and risk aversion" than purely panic-driven selling. The impact on other cryptocurrencies such as ETH may emerge with a lag, but in the short term they are also likely to follow Bitcoin’s weaker sentiment.
Trading outlook
Sentiment toward Bitcoin is bearish in the short term, but be alert to a possible technical rebound below $77,000. If sustained holding behavior can absorb the ETF outflows, Bitcoin may find support again. But if it breaks below the key $77,000 support level, the ETF outflows could develop into sustained capital flight. Long-term positions should remain cautious for now, while investors watch to see whether ETF flows can stabilize.
This outlook is invalidated if ETFs return to net inflows next week and Bitcoin holds above $78,000.
This article was not sponsored by any project, and the author does not hold any of the assets mentioned.
$BTC $ETH #BTC #ETH
⚠️ This is not investment advice. Forecasts are for reference only.
#Cryptolongslose$404millioninfourhoursasbitcoinbrieflyslipsbelow$80,000
$BNB
📰 ETF funds suddenly reverse course as Bitcoin falls below $80,000: Why are long positions taking a major hit?
From Thursday to Friday last week, after Bitcoin ETFs had recorded three consecutive days of net inflows, spot Bitcoin ETFs suddenly saw $773 million in outflows—more than twice the inflows recorded the previous day. Even more dramatically, on the same day as the ETF outflows, Bitcoin briefly fell below the $80,000 mark, triggering stop-losses on a large number of long positions and resulting in total losses of $404 million within four hours. It was like slamming on the brakes just as the market was feeling optimistic, with both money and confidence fleeing at once.
Why does this news matter?
The sudden reversal in ETF flows is more than a simple market fluctuation; it signals a major shift in investor sentiment. First, three consecutive days of net ETF inflows had shown that institutional confidence in crypto assets was recovering, but Friday’s reversal suggests that confidence remains fragile. More importantly, the outflows occurred as Bitcoin’s price approached a previous resistance level—a point where bullish and bearish forces often clash intensely. When Bitcoin breaks below the psychological $80,000 threshold as ETF funds flow out at the same time, it can trigger a large number of stop-loss orders and create a vicious cycle.
The impact on the broader market is evident on several levels: First, it exposes the risk aversion of ETF investors who bought in at higher prices; second, it suggests institutional investors may be reassessing crypto market valuations; third, it indicates that uncertainty over the regulatory outlook is increasing investors’ risk exposure. Historically, similar events—such as the sudden outflows from Bitcoin ETFs amid market panic in March 2020—ultimately accelerated price declines.
Market impact
In the short term, $80,000 is an important dividing line between bullish and bearish sentiment for Bitcoin, and ETF outflows have intensified bearish momentum. In the medium to long term, however, the strength of support in this price range remains to be tested. If Bitcoin can hold in the $78,000–$79,000 range, the ETF outflows may prove to be merely a sentiment-driven pullback. But if it falls below $77,000, these outflows could accelerate into sustained capital flight. From an industry-cycle perspective, this comes during a period of regulatory uncertainty, and the outflows may reflect investors seeking to hedge against potential policy changes.
Historically, sudden ETF outflows of this kind have mostly occurred after major negative market news. What makes this time different is that the earlier inflows had provided some cushion for the market. This suggests the current outflows are more of a mix of "profit-taking and risk aversion" than purely panic-driven selling. The impact on other cryptocurrencies such as ETH may emerge with a lag, but in the short term they are also likely to follow Bitcoin’s weaker sentiment.
Trading outlook
Sentiment toward Bitcoin is bearish in the short term, but be alert to a possible technical rebound below $77,000. If sustained holding behavior can absorb the ETF outflows, Bitcoin may find support again. But if it breaks below the key $77,000 support level, the ETF outflows could develop into sustained capital flight. Long-term positions should remain cautious for now, while investors watch to see whether ETF flows can stabilize.
This outlook is invalidated if ETFs return to net inflows next week and Bitcoin holds above $78,000.
This article was not sponsored by any project, and the author does not hold any of the assets mentioned.
$BTC $ETH #BTC #ETH
⚠️ This is not investment advice. Forecasts are for reference only.
#Cryptolongslose$404millioninfourhoursasbitcoinbrieflyslipsbelow$80,000
$BNB
From Thursday to Friday last week, after Bitcoin ETFs had recorded three consecutive days of net inflows, spot Bitcoin ETFs suddenly saw $773 million in outflows—more than twice the inflows recorded the previous day. Even more dramatically, on the same day as the ETF outflows, Bitcoin briefly fell below the $80,000 mark, triggering stop-losses on a large number of long positions and resulting in total losses of $404 million within four hours. It was like slamming on the brakes just as the market was feeling optimistic, with both money and confidence fleeing at once.
Why does this news matter?
The sudden reversal in ETF flows is more than a simple market fluctuation; it signals a major shift in investor sentiment. First, three consecutive days of net ETF inflows had shown that institutional confidence in crypto assets was recovering, but Friday’s reversal suggests that confidence remains fragile. More importantly, the outflows occurred as Bitcoin’s price approached a previous resistance level—a point where bullish and bearish forces often clash intensely. When Bitcoin breaks below the psychological $80,000 threshold as ETF funds flow out at the same time, it can trigger a large number of stop-loss orders and create a vicious cycle.
The impact on the broader market is evident on several levels: First, it exposes the risk aversion of ETF investors who bought in at higher prices; second, it suggests institutional investors may be reassessing crypto market valuations; third, it indicates that uncertainty over the regulatory outlook is increasing investors’ risk exposure. Historically, similar events—such as the sudden outflows from Bitcoin ETFs amid market panic in March 2020—ultimately accelerated price declines.
Market impact
In the short term, $80,000 is an important dividing line between bullish and bearish sentiment for Bitcoin, and ETF outflows have intensified bearish momentum. In the medium to long term, however, the strength of support in this price range remains to be tested. If Bitcoin can hold in the $78,000–$79,000 range, the ETF outflows may prove to be merely a sentiment-driven pullback. But if it falls below $77,000, these outflows could accelerate into sustained capital flight. From an industry-cycle perspective, this comes during a period of regulatory uncertainty, and the outflows may reflect investors seeking to hedge against potential policy changes.
Historically, sudden ETF outflows of this kind have mostly occurred after major negative market news. What makes this time different is that the earlier inflows had provided some cushion for the market. This suggests the current outflows are more of a mix of "profit-taking and risk aversion" than purely panic-driven selling. The impact on other cryptocurrencies such as ETH may emerge with a lag, but in the short term they are also likely to follow Bitcoin’s weaker sentiment.
Trading outlook
Sentiment toward Bitcoin is bearish in the short term, but be alert to a possible technical rebound below $77,000. If sustained holding behavior can absorb the ETF outflows, Bitcoin may find support again. But if it breaks below the key $77,000 support level, the ETF outflows could develop into sustained capital flight. Long-term positions should remain cautious for now, while investors watch to see whether ETF flows can stabilize.
This outlook is invalidated if ETFs return to net inflows next week and Bitcoin holds above $78,000.
This article was not sponsored by any project, and the author does not hold any of the assets mentioned.
$BTC $ETH #BTC #ETH
⚠️ This is not investment advice. Forecasts are for reference only.
#Cryptolongslose$404millioninfourhoursasbitcoinbrieflyslipsbelow$80,000
$BNB



15
·
--
📰 BNB Standard Rings the Nasdaq Bell: Is Its Validator Plan the Icing on the Cake or Unnecessary Overkill?
BNB Standard has announced that it will soon list on Nasdaq, while also planning to launch validator services for BNB Chain. The market sees this as a two-pronged strategy to strengthen its position in the crypto ecosystem, but the impact on shareholder value remains to be seen. According to Crypto Briefing, these moves will transform BNB Standard from a technology provider into an infrastructure operator.
Why does this news matter?
The core idea behind BNB Standard’s move is to create a closed loop. Currently, validators in the BNB Chain ecosystem are mainly operated by Binance Chain (which has since merged into BNB Chain), with very few independent third-party validators. By becoming a validator, BNB Standard can demonstrate the strength of its technology while directly participating in the distribution of on-chain staking rewards, creating a positive feedback loop between technology, services, and revenue. This looks more like a strategic enhancement than a disruptive innovation—the industry currently has no comparable publicly listed company with such a complete ecosystem loop.
Market impact
The impact on BTC/ETH prices is likely to be primarily sentiment-driven. On the one hand, a crypto company going public is generally a positive signal. Nasdaq’s rigorous listing requirements also mean that BNB Standard has earned recognition from mainstream capital markets. This could set an example for other on-chain projects and potentially lead to modest valuation adjustments for smaller-cap projects. On the other hand, the validator business is essentially about attracting BSC (Binance Smart Chain) liquidity, and competition with other validators is fierce, potentially diverting some existing market share. There are few historical examples to draw on, but the 2017 Ethereum validator battle offers a point of comparison: large-scale expansion at the time diluted overall staking yields.
How to approach it
This means BNB Standard is evolving from a single-purpose technology licensor into an ecosystem services provider, reducing the risks associated with relying on a single business. For investors, its status as a publicly listed company means greater transparency, but competition in the validator business is intense, and it may not generate excess returns. BNB is currently hovering around the $745 level. If the validator plan can meaningfully improve BNB Chain’s computing-power security and staking rate, it could provide moderate support for the BNB price. If the market finds that the validator business conflicts with the interests of the Binance ecosystem, this support thesis could fail.
This article is not sponsored by any project. The author does not hold any of the assets mentioned.
$BTC $ETH #BTC #ETH
⚠️ This is not investment advice. Predictions are for reference only.
#Nasdaqbell
$BNB
📰 BNB Standard Rings the Nasdaq Bell: Is Its Validator Plan the Icing on the Cake or Unnecessary Overkill?
BNB Standard has announced that it will soon list on Nasdaq, while also planning to launch validator services for BNB Chain. The market sees this as a two-pronged strategy to strengthen its position in the crypto ecosystem, but the impact on shareholder value remains to be seen. According to Crypto Briefing, these moves will transform BNB Standard from a technology provider into an infrastructure operator.
Why does this news matter?
The core idea behind BNB Standard’s move is to create a closed loop. Currently, validators in the BNB Chain ecosystem are mainly operated by Binance Chain (which has since merged into BNB Chain), with very few independent third-party validators. By becoming a validator, BNB Standard can demonstrate the strength of its technology while directly participating in the distribution of on-chain staking rewards, creating a positive feedback loop between technology, services, and revenue. This looks more like a strategic enhancement than a disruptive innovation—the industry currently has no comparable publicly listed company with such a complete ecosystem loop.
Market impact
The impact on BTC/ETH prices is likely to be primarily sentiment-driven. On the one hand, a crypto company going public is generally a positive signal. Nasdaq’s rigorous listing requirements also mean that BNB Standard has earned recognition from mainstream capital markets. This could set an example for other on-chain projects and potentially lead to modest valuation adjustments for smaller-cap projects. On the other hand, the validator business is essentially about attracting BSC (Binance Smart Chain) liquidity, and competition with other validators is fierce, potentially diverting some existing market share. There are few historical examples to draw on, but the 2017 Ethereum validator battle offers a point of comparison: large-scale expansion at the time diluted overall staking yields.
How to approach it
This means BNB Standard is evolving from a single-purpose technology licensor into an ecosystem services provider, reducing the risks associated with relying on a single business. For investors, its status as a publicly listed company means greater transparency, but competition in the validator business is intense, and it may not generate excess returns. BNB is currently hovering around the $745 level. If the validator plan can meaningfully improve BNB Chain’s computing-power security and staking rate, it could provide moderate support for the BNB price. If the market finds that the validator business conflicts with the interests of the Binance ecosystem, this support thesis could fail.
This article is not sponsored by any project. The author does not hold any of the assets mentioned.
$BTC $ETH #BTC #ETH
⚠️ This is not investment advice. Predictions are for reference only.
#Nasdaqbell
$BNB
BNB Standard has announced that it will soon list on Nasdaq, while also planning to launch validator services for BNB Chain. The market sees this as a two-pronged strategy to strengthen its position in the crypto ecosystem, but the impact on shareholder value remains to be seen. According to Crypto Briefing, these moves will transform BNB Standard from a technology provider into an infrastructure operator.
Why does this news matter?
The core idea behind BNB Standard’s move is to create a closed loop. Currently, validators in the BNB Chain ecosystem are mainly operated by Binance Chain (which has since merged into BNB Chain), with very few independent third-party validators. By becoming a validator, BNB Standard can demonstrate the strength of its technology while directly participating in the distribution of on-chain staking rewards, creating a positive feedback loop between technology, services, and revenue. This looks more like a strategic enhancement than a disruptive innovation—the industry currently has no comparable publicly listed company with such a complete ecosystem loop.
Market impact
The impact on BTC/ETH prices is likely to be primarily sentiment-driven. On the one hand, a crypto company going public is generally a positive signal. Nasdaq’s rigorous listing requirements also mean that BNB Standard has earned recognition from mainstream capital markets. This could set an example for other on-chain projects and potentially lead to modest valuation adjustments for smaller-cap projects. On the other hand, the validator business is essentially about attracting BSC (Binance Smart Chain) liquidity, and competition with other validators is fierce, potentially diverting some existing market share. There are few historical examples to draw on, but the 2017 Ethereum validator battle offers a point of comparison: large-scale expansion at the time diluted overall staking yields.
How to approach it
This means BNB Standard is evolving from a single-purpose technology licensor into an ecosystem services provider, reducing the risks associated with relying on a single business. For investors, its status as a publicly listed company means greater transparency, but competition in the validator business is intense, and it may not generate excess returns. BNB is currently hovering around the $745 level. If the validator plan can meaningfully improve BNB Chain’s computing-power security and staking rate, it could provide moderate support for the BNB price. If the market finds that the validator business conflicts with the interests of the Binance ecosystem, this support thesis could fail.
This article is not sponsored by any project. The author does not hold any of the assets mentioned.
$BTC $ETH #BTC #ETH
⚠️ This is not investment advice. Predictions are for reference only.
#Nasdaqbell
$BNB



310
·
--
📰 Why are miners still sticking around at $80K? The MEXC CEO’s optimism is at odds with liquidation data
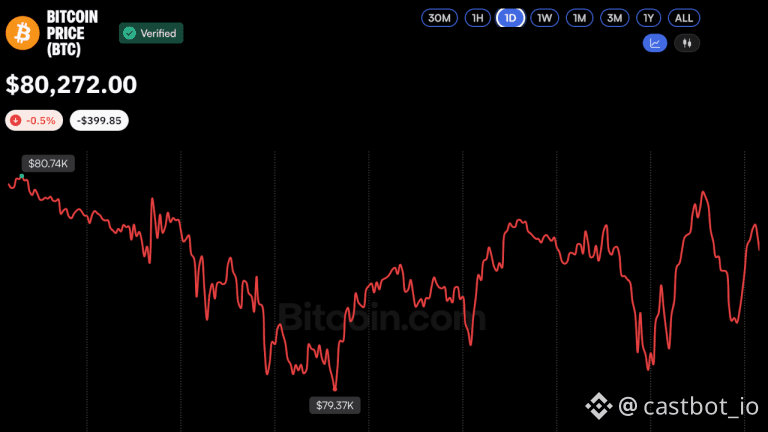
Bitcoin has repeatedly tested the $80K level over the past couple of days, but just can’t break through. The price is hovering around $80,100, and last Friday’s $36M liquidation wave is still fresh in traders’ minds. 65% of Bitcoin liquidations were highly leveraged longs getting wiped out. The MEXC CEO is bullish, but the reality on the ground is a bit sobering. What does this mean for everyday traders? And why aren’t miners leaving?
Why does this news matter?
Bitcoin has turned back down twice after reaching $80K, showing that resistance above that level is very strong. The fact that leveraged liquidations accounted for 65% of the total suggests that buyers aren’t eager to step in, and market sentiment is leaning bearish. The MEXC CEO’s optimism may have more to do with commercial interests, since exchanges benefit when crypto prices rise. But miners are holding their ground, suggesting that the price is unlikely to fall below their cost basis.
Market impact
How long will this tug-of-war last? For now, Bitcoin is likely to keep trading sideways in the $80K–$79.5K range in the short term. The $36M liquidation wave will have only a short-term impact on market liquidity, but the damage to bullish confidence could last longer. For everyday traders, this means chasing a rally carries significant short-term risk, while those with a lower cost basis can wait and see. Miners staying put also suggests that the price is unlikely to fall below their exit threshold in the near term.
Trading approach
For now, Bitcoin is likely to keep trading around $80K. Liquidation data shows that bullish confidence has taken a hit, making it risky to chase prices in the short term. But miners staying put also limits the downside. If the MEXC CEO’s optimism becomes the market consensus, Bitcoin could break higher. If the $36M liquidation wave turns into a much larger exodus, $80K could give way. If neither of these scenarios plays out, this assessment no longer holds.
This article is not sponsored by any project, and the author does not hold any of the assets mentioned.
⚠️ This is not investment advice. Forecasts are for reference only.
$BTC
📰 Why are miners still sticking around at $80K? The MEXC CEO’s optimism is at odds with liquidation data
Bitcoin has repeatedly tested the $80K level over the past couple of days, but just can’t break through. The price is hovering around $80,100, and last Friday’s $36M liquidation wave is still fresh in traders’ minds. 65% of Bitcoin liquidations were highly leveraged longs getting wiped out. The MEXC CEO is bullish, but the reality on the ground is a bit sobering. What does this mean for everyday traders? And why aren’t miners leaving?
Why does this news matter?
Bitcoin has turned back down twice after reaching $80K, showing that resistance above that level is very strong. The fact that leveraged liquidations accounted for 65% of the total suggests that buyers aren’t eager to step in, and market sentiment is leaning bearish. The MEXC CEO’s optimism may have more to do with commercial interests, since exchanges benefit when crypto prices rise. But miners are holding their ground, suggesting that the price is unlikely to fall below their cost basis.
Market impact
How long will this tug-of-war last? For now, Bitcoin is likely to keep trading sideways in the $80K–$79.5K range in the short term. The $36M liquidation wave will have only a short-term impact on market liquidity, but the damage to bullish confidence could last longer. For everyday traders, this means chasing a rally carries significant short-term risk, while those with a lower cost basis can wait and see. Miners staying put also suggests that the price is unlikely to fall below their exit threshold in the near term.
Trading approach
For now, Bitcoin is likely to keep trading around $80K. Liquidation data shows that bullish confidence has taken a hit, making it risky to chase prices in the short term. But miners staying put also limits the downside. If the MEXC CEO’s optimism becomes the market consensus, Bitcoin could break higher. If the $36M liquidation wave turns into a much larger exodus, $80K could give way. If neither of these scenarios plays out, this assessment no longer holds.
This article is not sponsored by any project, and the author does not hold any of the assets mentioned.
⚠️ This is not investment advice. Forecasts are for reference only.
$BTC
Bitcoin has repeatedly tested the $80K level over the past couple of days, but just can’t break through. The price is hovering around $80,100, and last Friday’s $36M liquidation wave is still fresh in traders’ minds. 65% of Bitcoin liquidations were highly leveraged longs getting wiped out. The MEXC CEO is bullish, but the reality on the ground is a bit sobering. What does this mean for everyday traders? And why aren’t miners leaving?
Why does this news matter?
Bitcoin has turned back down twice after reaching $80K, showing that resistance above that level is very strong. The fact that leveraged liquidations accounted for 65% of the total suggests that buyers aren’t eager to step in, and market sentiment is leaning bearish. The MEXC CEO’s optimism may have more to do with commercial interests, since exchanges benefit when crypto prices rise. But miners are holding their ground, suggesting that the price is unlikely to fall below their cost basis.
Market impact
How long will this tug-of-war last? For now, Bitcoin is likely to keep trading sideways in the $80K–$79.5K range in the short term. The $36M liquidation wave will have only a short-term impact on market liquidity, but the damage to bullish confidence could last longer. For everyday traders, this means chasing a rally carries significant short-term risk, while those with a lower cost basis can wait and see. Miners staying put also suggests that the price is unlikely to fall below their exit threshold in the near term.
Trading approach
For now, Bitcoin is likely to keep trading around $80K. Liquidation data shows that bullish confidence has taken a hit, making it risky to chase prices in the short term. But miners staying put also limits the downside. If the MEXC CEO’s optimism becomes the market consensus, Bitcoin could break higher. If the $36M liquidation wave turns into a much larger exodus, $80K could give way. If neither of these scenarios plays out, this assessment no longer holds.
This article is not sponsored by any project, and the author does not hold any of the assets mentioned.
⚠️ This is not investment advice. Forecasts are for reference only.
$BTC


101
·
--
📰 Why did the Akash team suddenly change course? What does making Solana its sole target mean?
Greg Osuri, co-founder of Akash Network, publicly announced that the core team has decided to move its entire computing marketplace from the Cosmos ecosystem to Solana. The plan is to separate the akashnet-2 public chain and rebuild the computing marketplace on Solana mainnet, while also making the AKT token a native Solana token. This migration plan requires an on-chain vote and is still at the proposal stage; no specific timeline has been announced. According to Binance Square.
Why is this news important?
The main reason for this migration may lie in the Cosmos ecosystem's lack of efficiency and innovation. Although Cosmos emphasizes interoperability between multiple chains, the fact that each chain develops independently has led to fragmented resources, and performance and development speed have gradually fallen behind. Solana, by contrast, has an advantage in the competition to build Web3 infrastructure thanks to its TPS and low fees. Akash's decision seems more like a pragmatic choice in the Web3 2.0 era, in search of more efficient underlying infrastructure. This echoes the recent trend in the NFT sector of embracing high-performance chains such as Aptos and Sui, and suggests that the infrastructure layer is becoming increasingly fragmented, with Cosmos potentially being marginalized.
Market impact
The impact on ETH is greater because this involves cross-chain migration and a reshaping of the token ecosystem. However, given ETH's current 24-hour decline of 1.33%, this news is more likely to intensify anxiety over L2s replacing L1s. BTC is relatively less affected, since ecosystem migration is currently taking place mainly within Ethereum's sub-ecosystems. In terms of capital flows, this could accelerate the reallocation of crypto funds toward high-performance public chains, with SOL's share of computing power potentially rising by 15–20% over the next six months. Historically, every migration from consortium-chain systems such as Cosmos to more decentralized public chains has intensified competition between chains—for example, Polkadot's early vision of interoperability ultimately gave way to Starknet's hard fork.
💡 From an industry perspective, this news reinforces the long-term dominance of high-performance public chains. If the akashnet-2 vote passes within the next two weeks, this decision may begin to positively affect activity on the Solana network in three months. The caveat is that if Cosmos cannot quickly close the performance gap through technical upgrades, the rationale for the migration will no longer hold.
This article is not sponsored by any project, and the author does not hold any of the assets mentioned.
⚠️ This is not investment advice. Predictions are for reference only.
$SOL $BTC $ETH
📰 Why did the Akash team suddenly change course? What does making Solana its sole target mean?
Greg Osuri, co-founder of Akash Network, publicly announced that the core team has decided to move its entire computing marketplace from the Cosmos ecosystem to Solana. The plan is to separate the akashnet-2 public chain and rebuild the computing marketplace on Solana mainnet, while also making the AKT token a native Solana token. This migration plan requires an on-chain vote and is still at the proposal stage; no specific timeline has been announced. According to Binance Square.
Why is this news important?
The main reason for this migration may lie in the Cosmos ecosystem's lack of efficiency and innovation. Although Cosmos emphasizes interoperability between multiple chains, the fact that each chain develops independently has led to fragmented resources, and performance and development speed have gradually fallen behind. Solana, by contrast, has an advantage in the competition to build Web3 infrastructure thanks to its TPS and low fees. Akash's decision seems more like a pragmatic choice in the Web3 2.0 era, in search of more efficient underlying infrastructure. This echoes the recent trend in the NFT sector of embracing high-performance chains such as Aptos and Sui, and suggests that the infrastructure layer is becoming increasingly fragmented, with Cosmos potentially being marginalized.
Market impact
The impact on ETH is greater because this involves cross-chain migration and a reshaping of the token ecosystem. However, given ETH's current 24-hour decline of 1.33%, this news is more likely to intensify anxiety over L2s replacing L1s. BTC is relatively less affected, since ecosystem migration is currently taking place mainly within Ethereum's sub-ecosystems. In terms of capital flows, this could accelerate the reallocation of crypto funds toward high-performance public chains, with SOL's share of computing power potentially rising by 15–20% over the next six months. Historically, every migration from consortium-chain systems such as Cosmos to more decentralized public chains has intensified competition between chains—for example, Polkadot's early vision of interoperability ultimately gave way to Starknet's hard fork.
💡 From an industry perspective, this news reinforces the long-term dominance of high-performance public chains. If the akashnet-2 vote passes within the next two weeks, this decision may begin to positively affect activity on the Solana network in three months. The caveat is that if Cosmos cannot quickly close the performance gap through technical upgrades, the rationale for the migration will no longer hold.
This article is not sponsored by any project, and the author does not hold any of the assets mentioned.
⚠️ This is not investment advice. Predictions are for reference only.
$SOL $BTC $ETH
Greg Osuri, co-founder of Akash Network, publicly announced that the core team has decided to move its entire computing marketplace from the Cosmos ecosystem to Solana. The plan is to separate the akashnet-2 public chain and rebuild the computing marketplace on Solana mainnet, while also making the AKT token a native Solana token. This migration plan requires an on-chain vote and is still at the proposal stage; no specific timeline has been announced. According to Binance Square.
Why is this news important?
The main reason for this migration may lie in the Cosmos ecosystem's lack of efficiency and innovation. Although Cosmos emphasizes interoperability between multiple chains, the fact that each chain develops independently has led to fragmented resources, and performance and development speed have gradually fallen behind. Solana, by contrast, has an advantage in the competition to build Web3 infrastructure thanks to its TPS and low fees. Akash's decision seems more like a pragmatic choice in the Web3 2.0 era, in search of more efficient underlying infrastructure. This echoes the recent trend in the NFT sector of embracing high-performance chains such as Aptos and Sui, and suggests that the infrastructure layer is becoming increasingly fragmented, with Cosmos potentially being marginalized.
Market impact
The impact on ETH is greater because this involves cross-chain migration and a reshaping of the token ecosystem. However, given ETH's current 24-hour decline of 1.33%, this news is more likely to intensify anxiety over L2s replacing L1s. BTC is relatively less affected, since ecosystem migration is currently taking place mainly within Ethereum's sub-ecosystems. In terms of capital flows, this could accelerate the reallocation of crypto funds toward high-performance public chains, with SOL's share of computing power potentially rising by 15–20% over the next six months. Historically, every migration from consortium-chain systems such as Cosmos to more decentralized public chains has intensified competition between chains—for example, Polkadot's early vision of interoperability ultimately gave way to Starknet's hard fork.
💡 From an industry perspective, this news reinforces the long-term dominance of high-performance public chains. If the akashnet-2 vote passes within the next two weeks, this decision may begin to positively affect activity on the Solana network in three months. The caveat is that if Cosmos cannot quickly close the performance gap through technical upgrades, the rationale for the migration will no longer hold.
This article is not sponsored by any project, and the author does not hold any of the assets mentioned.
⚠️ This is not investment advice. Predictions are for reference only.
$SOL $BTC $ETH



346
·
--
📰 Bernstein revises its outlook: Crypto revenue is changing—who’s better positioned, Coinbase or Circle?
Major investment bank Bernstein has revised its valuation outlook for Coinbase, citing major changes in the crypto industry’s revenue mix. In the past, the focus was mainly on spot trading fees. Now, derivatives, prediction markets, and tokenized assets are increasingly in the spotlight. Coinbase’s position is looking more favorable, suggesting that the market is starting to focus on how different business segments generate revenue, rather than simply looking at trading volume. This could have implications for the entire crypto ecosystem.
Why does this news matter?
At the heart of Bernstein’s revision is a recognition of the crypto industry’s new economic model. Under the traditional model, platforms like Binance and Coinbase primarily make money from trading fees by attracting users to trade. But that approach is becoming increasingly unreliable—regulatory crackdowns and shrinking activity during bear markets can both deal serious blows. The industry is now split into three major segments: spot trading; increasingly popular derivatives, such as options and futures; and tokenized assets and prediction markets. Bernstein’s point is that although Coinbase’s trading volume has yet to pick up, it moved early on derivatives and tokenization, which could make its future revenue more resilient. This perspective is more forward-looking than simply focusing on fees.
Market impact
This could have far-reaching effects on the crypto landscape. People used to think Coinbase and Binance had the same business model, but they are now starting to diverge. Platforms like Coinbase that invested early in derivatives may be more resilient in the face of regulation and volatility. However, Bernstein also lowered its price target for Coinbase, showing that its view is only relatively optimistic—the industry as a whole remains fragile. More importantly, if derivatives and tokenization really can become major pillars of the business, traditional exchanges and crypto projects will need to fundamentally change their business models. This shift in revenue mix is reminiscent of the early days of the mobile internet: the companies that invested early in mobile payments and e-commerce ended up in a very different position from those that didn’t.
Trading approach
💡 Bernstein’s view suggests that the crypto industry is moving away from “trading is everything” and toward a “tools + asset services” model. Platforms like Coinbase that are making this transition quickly may be more resilient than those that rely purely on fees. This shift in revenue mix is not a short-term phenomenon. If, over the next six months, we see the share of revenue from spot trading fees continue to shrink—for example, falling below 40%—while the share from derivatives and tokenization rises above 20%, that would confirm the trend. If regulators suddenly impose a blanket ban on derivatives, however, this thesis would no longer hold.
This article is not sponsored by any project, and the author does not hold any of the assets mentioned.
⚠️ This is not investment advice. Forecasts are for reference only.
$BTC
📰 Bernstein revises its outlook: Crypto revenue is changing—who’s better positioned, Coinbase or Circle?
Major investment bank Bernstein has revised its valuation outlook for Coinbase, citing major changes in the crypto industry’s revenue mix. In the past, the focus was mainly on spot trading fees. Now, derivatives, prediction markets, and tokenized assets are increasingly in the spotlight. Coinbase’s position is looking more favorable, suggesting that the market is starting to focus on how different business segments generate revenue, rather than simply looking at trading volume. This could have implications for the entire crypto ecosystem.
Why does this news matter?
At the heart of Bernstein’s revision is a recognition of the crypto industry’s new economic model. Under the traditional model, platforms like Binance and Coinbase primarily make money from trading fees by attracting users to trade. But that approach is becoming increasingly unreliable—regulatory crackdowns and shrinking activity during bear markets can both deal serious blows. The industry is now split into three major segments: spot trading; increasingly popular derivatives, such as options and futures; and tokenized assets and prediction markets. Bernstein’s point is that although Coinbase’s trading volume has yet to pick up, it moved early on derivatives and tokenization, which could make its future revenue more resilient. This perspective is more forward-looking than simply focusing on fees.
Market impact
This could have far-reaching effects on the crypto landscape. People used to think Coinbase and Binance had the same business model, but they are now starting to diverge. Platforms like Coinbase that invested early in derivatives may be more resilient in the face of regulation and volatility. However, Bernstein also lowered its price target for Coinbase, showing that its view is only relatively optimistic—the industry as a whole remains fragile. More importantly, if derivatives and tokenization really can become major pillars of the business, traditional exchanges and crypto projects will need to fundamentally change their business models. This shift in revenue mix is reminiscent of the early days of the mobile internet: the companies that invested early in mobile payments and e-commerce ended up in a very different position from those that didn’t.
Trading approach
💡 Bernstein’s view suggests that the crypto industry is moving away from “trading is everything” and toward a “tools + asset services” model. Platforms like Coinbase that are making this transition quickly may be more resilient than those that rely purely on fees. This shift in revenue mix is not a short-term phenomenon. If, over the next six months, we see the share of revenue from spot trading fees continue to shrink—for example, falling below 40%—while the share from derivatives and tokenization rises above 20%, that would confirm the trend. If regulators suddenly impose a blanket ban on derivatives, however, this thesis would no longer hold.
This article is not sponsored by any project, and the author does not hold any of the assets mentioned.
⚠️ This is not investment advice. Forecasts are for reference only.
$BTC
Major investment bank Bernstein has revised its valuation outlook for Coinbase, citing major changes in the crypto industry’s revenue mix. In the past, the focus was mainly on spot trading fees. Now, derivatives, prediction markets, and tokenized assets are increasingly in the spotlight. Coinbase’s position is looking more favorable, suggesting that the market is starting to focus on how different business segments generate revenue, rather than simply looking at trading volume. This could have implications for the entire crypto ecosystem.
Why does this news matter?
At the heart of Bernstein’s revision is a recognition of the crypto industry’s new economic model. Under the traditional model, platforms like Binance and Coinbase primarily make money from trading fees by attracting users to trade. But that approach is becoming increasingly unreliable—regulatory crackdowns and shrinking activity during bear markets can both deal serious blows. The industry is now split into three major segments: spot trading; increasingly popular derivatives, such as options and futures; and tokenized assets and prediction markets. Bernstein’s point is that although Coinbase’s trading volume has yet to pick up, it moved early on derivatives and tokenization, which could make its future revenue more resilient. This perspective is more forward-looking than simply focusing on fees.
Market impact
This could have far-reaching effects on the crypto landscape. People used to think Coinbase and Binance had the same business model, but they are now starting to diverge. Platforms like Coinbase that invested early in derivatives may be more resilient in the face of regulation and volatility. However, Bernstein also lowered its price target for Coinbase, showing that its view is only relatively optimistic—the industry as a whole remains fragile. More importantly, if derivatives and tokenization really can become major pillars of the business, traditional exchanges and crypto projects will need to fundamentally change their business models. This shift in revenue mix is reminiscent of the early days of the mobile internet: the companies that invested early in mobile payments and e-commerce ended up in a very different position from those that didn’t.
Trading approach
💡 Bernstein’s view suggests that the crypto industry is moving away from “trading is everything” and toward a “tools + asset services” model. Platforms like Coinbase that are making this transition quickly may be more resilient than those that rely purely on fees. This shift in revenue mix is not a short-term phenomenon. If, over the next six months, we see the share of revenue from spot trading fees continue to shrink—for example, falling below 40%—while the share from derivatives and tokenization rises above 20%, that would confirm the trend. If regulators suddenly impose a blanket ban on derivatives, however, this thesis would no longer hold.
This article is not sponsored by any project, and the author does not hold any of the assets mentioned.
⚠️ This is not investment advice. Forecasts are for reference only.
$BTC



181
·
--
📰 Why Does Buterin Think AI Restrictions Are More Effective Than KYC?
Ethereum co-founder Vitalik Buterin publicly supported Moonshot AI’s decision to remove advanced offensive hacking tools from its Kimi K3.1 Pro model. He believes restricting what AI can do is far preferable to restricting who can use it, and warned that AI security vulnerabilities could lead to KYC identity verification and surveillance. Moonshot’s own tests showed [...] (According to Bitcoinist)
Why does this news matter?
This news reflects the regulatory tug-of-war over the convergence of AI and Web3. Buterin’s philosophy of “function restrictions over identity restrictions” is essentially a call for industry-wide technical standards rather than simple barriers. This suggests that when technological capabilities outstrip identity-based approaches, regulation needs to shift from access control to rules governing behavior. Recent AI regulatory pilots on BNB Chain and model review policies on Solana both point in this direction.
Market impact
Amid ETH’s 1.23% decline over the past 24 hours, this news offers some support. A technology-driven narrative is positive for ETH’s value chain, but its real-world impact depends on how well leading players such as OpenAI coordinate. Compared with the Microsoft–OpenAI antitrust case in June 2024, regulators are now more inclined toward technical governance than identity-based discrimination, suggesting that future policies will focus more on code audits than on KYC.
Trading approach
ETH’s modest pullback to $2,318.3 could benefit from the confidence generated by this kind of technical-governance narrative. But if OpenAI rejects this approach to restrictions, or major model providers shift toward decentralized governance, this supportive effect will fade. More importantly, if KYC is imposed due to AI attack risks, it could instead provoke a collective backlash from the Web3 community.
This article is not sponsored by any project, and the author does not hold any of the assets mentioned
$BTC $ETH #BTC #ETH
⚠️ This is not investment advice. Predictions are for reference only.
$BNB
📰 Why Does Buterin Think AI Restrictions Are More Effective Than KYC?
Ethereum co-founder Vitalik Buterin publicly supported Moonshot AI’s decision to remove advanced offensive hacking tools from its Kimi K3.1 Pro model. He believes restricting what AI can do is far preferable to restricting who can use it, and warned that AI security vulnerabilities could lead to KYC identity verification and surveillance. Moonshot’s own tests showed [...] (According to Bitcoinist)
Why does this news matter?
This news reflects the regulatory tug-of-war over the convergence of AI and Web3. Buterin’s philosophy of “function restrictions over identity restrictions” is essentially a call for industry-wide technical standards rather than simple barriers. This suggests that when technological capabilities outstrip identity-based approaches, regulation needs to shift from access control to rules governing behavior. Recent AI regulatory pilots on BNB Chain and model review policies on Solana both point in this direction.
Market impact
Amid ETH’s 1.23% decline over the past 24 hours, this news offers some support. A technology-driven narrative is positive for ETH’s value chain, but its real-world impact depends on how well leading players such as OpenAI coordinate. Compared with the Microsoft–OpenAI antitrust case in June 2024, regulators are now more inclined toward technical governance than identity-based discrimination, suggesting that future policies will focus more on code audits than on KYC.
Trading approach
ETH’s modest pullback to $2,318.3 could benefit from the confidence generated by this kind of technical-governance narrative. But if OpenAI rejects this approach to restrictions, or major model providers shift toward decentralized governance, this supportive effect will fade. More importantly, if KYC is imposed due to AI attack risks, it could instead provoke a collective backlash from the Web3 community.
This article is not sponsored by any project, and the author does not hold any of the assets mentioned
$BTC $ETH #BTC #ETH
⚠️ This is not investment advice. Predictions are for reference only.
$BNB
Ethereum co-founder Vitalik Buterin publicly supported Moonshot AI’s decision to remove advanced offensive hacking tools from its Kimi K3.1 Pro model. He believes restricting what AI can do is far preferable to restricting who can use it, and warned that AI security vulnerabilities could lead to KYC identity verification and surveillance. Moonshot’s own tests showed [...] (According to Bitcoinist)
Why does this news matter?
This news reflects the regulatory tug-of-war over the convergence of AI and Web3. Buterin’s philosophy of “function restrictions over identity restrictions” is essentially a call for industry-wide technical standards rather than simple barriers. This suggests that when technological capabilities outstrip identity-based approaches, regulation needs to shift from access control to rules governing behavior. Recent AI regulatory pilots on BNB Chain and model review policies on Solana both point in this direction.
Market impact
Amid ETH’s 1.23% decline over the past 24 hours, this news offers some support. A technology-driven narrative is positive for ETH’s value chain, but its real-world impact depends on how well leading players such as OpenAI coordinate. Compared with the Microsoft–OpenAI antitrust case in June 2024, regulators are now more inclined toward technical governance than identity-based discrimination, suggesting that future policies will focus more on code audits than on KYC.
Trading approach
ETH’s modest pullback to $2,318.3 could benefit from the confidence generated by this kind of technical-governance narrative. But if OpenAI rejects this approach to restrictions, or major model providers shift toward decentralized governance, this supportive effect will fade. More importantly, if KYC is imposed due to AI attack risks, it could instead provoke a collective backlash from the Web3 community.
This article is not sponsored by any project, and the author does not hold any of the assets mentioned
$BTC $ETH #BTC #ETH
⚠️ This is not investment advice. Predictions are for reference only.
$BNB



269
·
--
📰 AI Stocks Crash, Inflation Comes in Hotter Than Expected—Why Is BTC Holding Above $80K?
Bitcoin has been struggling lately. After hitting a high of $83,800 early last week, the market was suddenly rattled by hotter-than-expected inflation data and a broad sell-off in AI stocks (Meta, for example, fell more than 20%). Investors rushed for the exits, sending BTC from its high to $80,100 in a week. Fortunately, BTC has shown resilience, rebounding to around $81,000 over the past couple of days. Whether it can hold here depends largely on how the Fed and tech stocks react next.
Why does this news matter?
The main reason for the decline isn’t a problem with Bitcoin itself, but sharp swings in the macroeconomic flow of funds. AI and tech stocks have been heavily hyped lately, but the continued plunge in giants like Meta (down more than 30% last week) is making the market question whether this rally is a bubble. At the same time, inflation data came in hotter than expected again (the article didn’t give specific figures, but said the reading was above forecasts), directly intensifying expectations of Fed rate hikes. For the crypto market, there are two channels through which this can have an impact:
1. **U.S. stocks and stock funds are a major potential source of capital for crypto**: When the U.S. tech sector plunges across the board, as we saw last week with $316M in redemptions from U.S. stock funds, some money may spill over into the smaller crypto market—but overall, risk appetite tends to decline.
2. **Macro interest rates are a cornerstone of the crypto market**: The higher inflation is, the more likely the Fed is to accelerate rate hikes, and the crypto market is far more sensitive to interest rate changes than traditional assets. Last week, expectations of Fed rate hikes had already pushed Bitcoin down from around $80K. The latest AI stock sell-off, combined with inflation, is a double blow.
Market impact
In the short term, BTC holding above $80K is a positive signal, but this level is essentially where macro headwinds and crypto’s own support are battling it out. This means:
- BTC at $80,186 is a key area of balance between bulls and bears, with $81K as the first major resistance above it.
- If the Fed takes a tougher-than-expected stance (for example, announcing a 75-basis-point rate hike in December), BTC could fall further toward $78K (based on past rate-hike cycles, Bitcoin has fallen by more than 5% after each 75-basis-point hike).
- The impact on ETH and other smaller coins could be greater, since they lack BTC’s safe-haven appeal. When AI stocks crash, ETH typically falls 10–15% more than BTC.
Trading outlook
The current view is that BTC has technical support around $80K, but the macro risks haven’t gone away. If the Fed stands pat this week, BTC could continue rebounding toward $82K, though investors should watch for profit-taking at that level. If the Fed suddenly sends a more hawkish signal, the $80K support could quickly give way. Put simply: investors holding BTC right now are like people picking up money on the edge of a cliff—the next move in macro policy will determine whether they can get away with it.
【This view is subject to invalidation】If the Fed announces a December rate hike of more than 50 basis points, or the Nasdaq continues to plunge and falls below 12,000, this assessment of $80K support is invalidated.
This article is not sponsored by any project. The author does not hold any of the assets mentioned.
According to Bitcoinist
$BTC $ETH #BTC #ETH
⚠️ This is not investment advice. Forecasts are for reference only.
#InflationAndAIStockSell-OffRattleCryptoMarkets
$BNB
📰 AI Stocks Crash, Inflation Comes in Hotter Than Expected—Why Is BTC Holding Above $80K?
Bitcoin has been struggling lately. After hitting a high of $83,800 early last week, the market was suddenly rattled by hotter-than-expected inflation data and a broad sell-off in AI stocks (Meta, for example, fell more than 20%). Investors rushed for the exits, sending BTC from its high to $80,100 in a week. Fortunately, BTC has shown resilience, rebounding to around $81,000 over the past couple of days. Whether it can hold here depends largely on how the Fed and tech stocks react next.
Why does this news matter?
The main reason for the decline isn’t a problem with Bitcoin itself, but sharp swings in the macroeconomic flow of funds. AI and tech stocks have been heavily hyped lately, but the continued plunge in giants like Meta (down more than 30% last week) is making the market question whether this rally is a bubble. At the same time, inflation data came in hotter than expected again (the article didn’t give specific figures, but said the reading was above forecasts), directly intensifying expectations of Fed rate hikes. For the crypto market, there are two channels through which this can have an impact:
1. **U.S. stocks and stock funds are a major potential source of capital for crypto**: When the U.S. tech sector plunges across the board, as we saw last week with $316M in redemptions from U.S. stock funds, some money may spill over into the smaller crypto market—but overall, risk appetite tends to decline.
2. **Macro interest rates are a cornerstone of the crypto market**: The higher inflation is, the more likely the Fed is to accelerate rate hikes, and the crypto market is far more sensitive to interest rate changes than traditional assets. Last week, expectations of Fed rate hikes had already pushed Bitcoin down from around $80K. The latest AI stock sell-off, combined with inflation, is a double blow.
Market impact
In the short term, BTC holding above $80K is a positive signal, but this level is essentially where macro headwinds and crypto’s own support are battling it out. This means:
- BTC at $80,186 is a key area of balance between bulls and bears, with $81K as the first major resistance above it.
- If the Fed takes a tougher-than-expected stance (for example, announcing a 75-basis-point rate hike in December), BTC could fall further toward $78K (based on past rate-hike cycles, Bitcoin has fallen by more than 5% after each 75-basis-point hike).
- The impact on ETH and other smaller coins could be greater, since they lack BTC’s safe-haven appeal. When AI stocks crash, ETH typically falls 10–15% more than BTC.
Trading outlook
The current view is that BTC has technical support around $80K, but the macro risks haven’t gone away. If the Fed stands pat this week, BTC could continue rebounding toward $82K, though investors should watch for profit-taking at that level. If the Fed suddenly sends a more hawkish signal, the $80K support could quickly give way. Put simply: investors holding BTC right now are like people picking up money on the edge of a cliff—the next move in macro policy will determine whether they can get away with it.
【This view is subject to invalidation】If the Fed announces a December rate hike of more than 50 basis points, or the Nasdaq continues to plunge and falls below 12,000, this assessment of $80K support is invalidated.
This article is not sponsored by any project. The author does not hold any of the assets mentioned.
According to Bitcoinist
$BTC $ETH #BTC #ETH
⚠️ This is not investment advice. Forecasts are for reference only.
#InflationAndAIStockSell-OffRattleCryptoMarkets
$BNB
Bitcoin has been struggling lately. After hitting a high of $83,800 early last week, the market was suddenly rattled by hotter-than-expected inflation data and a broad sell-off in AI stocks (Meta, for example, fell more than 20%). Investors rushed for the exits, sending BTC from its high to $80,100 in a week. Fortunately, BTC has shown resilience, rebounding to around $81,000 over the past couple of days. Whether it can hold here depends largely on how the Fed and tech stocks react next.
Why does this news matter?
The main reason for the decline isn’t a problem with Bitcoin itself, but sharp swings in the macroeconomic flow of funds. AI and tech stocks have been heavily hyped lately, but the continued plunge in giants like Meta (down more than 30% last week) is making the market question whether this rally is a bubble. At the same time, inflation data came in hotter than expected again (the article didn’t give specific figures, but said the reading was above forecasts), directly intensifying expectations of Fed rate hikes. For the crypto market, there are two channels through which this can have an impact:
1. **U.S. stocks and stock funds are a major potential source of capital for crypto**: When the U.S. tech sector plunges across the board, as we saw last week with $316M in redemptions from U.S. stock funds, some money may spill over into the smaller crypto market—but overall, risk appetite tends to decline.
2. **Macro interest rates are a cornerstone of the crypto market**: The higher inflation is, the more likely the Fed is to accelerate rate hikes, and the crypto market is far more sensitive to interest rate changes than traditional assets. Last week, expectations of Fed rate hikes had already pushed Bitcoin down from around $80K. The latest AI stock sell-off, combined with inflation, is a double blow.
Market impact
In the short term, BTC holding above $80K is a positive signal, but this level is essentially where macro headwinds and crypto’s own support are battling it out. This means:
- BTC at $80,186 is a key area of balance between bulls and bears, with $81K as the first major resistance above it.
- If the Fed takes a tougher-than-expected stance (for example, announcing a 75-basis-point rate hike in December), BTC could fall further toward $78K (based on past rate-hike cycles, Bitcoin has fallen by more than 5% after each 75-basis-point hike).
- The impact on ETH and other smaller coins could be greater, since they lack BTC’s safe-haven appeal. When AI stocks crash, ETH typically falls 10–15% more than BTC.
Trading outlook
The current view is that BTC has technical support around $80K, but the macro risks haven’t gone away. If the Fed stands pat this week, BTC could continue rebounding toward $82K, though investors should watch for profit-taking at that level. If the Fed suddenly sends a more hawkish signal, the $80K support could quickly give way. Put simply: investors holding BTC right now are like people picking up money on the edge of a cliff—the next move in macro policy will determine whether they can get away with it.
【This view is subject to invalidation】If the Fed announces a December rate hike of more than 50 basis points, or the Nasdaq continues to plunge and falls below 12,000, this assessment of $80K support is invalidated.
This article is not sponsored by any project. The author does not hold any of the assets mentioned.
According to Bitcoinist
$BTC $ETH #BTC #ETH
⚠️ This is not investment advice. Forecasts are for reference only.
#InflationAndAIStockSell-OffRattleCryptoMarkets
$BNB



317
·
--
📰 Massive ETF Outflows? What Are Institutional Bitcoin Funds Really Afraid Of?
Institutional investors have recently and suddenly lost interest in U.S. spot Bitcoin ETFs. In the week from October 12 to 16, ETFs saw about $228 million in outflows. The previous week had still recorded $681 million in net inflows. Over the two weeks combined, outflows reached as much as $909 million, marking the largest capital retreat since April. Bitcoin’s price was also affected, falling below the $80,000 level, showing that institutional sentiment is cooling rapidly.
Why is this news important?
The fundamental reason for this capital withdrawal is a decline in market risk appetite. As an important channel for institutions entering the crypto market, ETF fund flows directly reflect institutional confidence in crypto assets. When ETFs kept seeing net inflows in September, institutions were adding to their Bitcoin positions; now, such a large-scale withdrawal of funds means they believe Bitcoin’s risk has exceeded expectations. This is related to the broader backdrop of the Federal Reserve’s continued rate hikes and rising recession fears — institutional investors are positioning defensively in advance for possible market volatility.
Impact on the market
In the short term, the withdrawal of institutional funds will continue to weigh on Bitcoin’s price, but the area below $80,000 still has key support. This means Bitcoin’s correction at the current level is more severe than expected. For ETH, although ETFs are mainly a BTC indicator, the correlation between ETH and BTC remains strong, and ETF outflows may indirectly spill over into the ETH market. In particular, highly leveraged traders may see further declines due to liquidations. More importantly, banks continue to refuse cooperation with crypto businesses, limiting exit channels for institutional funds. Whether ETF inflows can resume in the future will depend on whether market sentiment can truly bottom out and rebound.
💡 Institutional capital outflows are the most important signal in the current market. If the Federal Reserve announces further rate hikes or new crypto regulatory tightening policies emerge, this view will be invalid.
This article is not sponsored by any project party, and the author does not hold the assets mentioned in the article
According to Bitcoinist
$BTC $ETH #BTC #ETH
⚠️ Not investment advice; predictions are for reference only
📰 Massive ETF Outflows? What Are Institutional Bitcoin Funds Really Afraid Of?
Institutional investors have recently and suddenly lost interest in U.S. spot Bitcoin ETFs. In the week from October 12 to 16, ETFs saw about $228 million in outflows. The previous week had still recorded $681 million in net inflows. Over the two weeks combined, outflows reached as much as $909 million, marking the largest capital retreat since April. Bitcoin’s price was also affected, falling below the $80,000 level, showing that institutional sentiment is cooling rapidly.
Why is this news important?
The fundamental reason for this capital withdrawal is a decline in market risk appetite. As an important channel for institutions entering the crypto market, ETF fund flows directly reflect institutional confidence in crypto assets. When ETFs kept seeing net inflows in September, institutions were adding to their Bitcoin positions; now, such a large-scale withdrawal of funds means they believe Bitcoin’s risk has exceeded expectations. This is related to the broader backdrop of the Federal Reserve’s continued rate hikes and rising recession fears — institutional investors are positioning defensively in advance for possible market volatility.
Impact on the market
In the short term, the withdrawal of institutional funds will continue to weigh on Bitcoin’s price, but the area below $80,000 still has key support. This means Bitcoin’s correction at the current level is more severe than expected. For ETH, although ETFs are mainly a BTC indicator, the correlation between ETH and BTC remains strong, and ETF outflows may indirectly spill over into the ETH market. In particular, highly leveraged traders may see further declines due to liquidations. More importantly, banks continue to refuse cooperation with crypto businesses, limiting exit channels for institutional funds. Whether ETF inflows can resume in the future will depend on whether market sentiment can truly bottom out and rebound.
💡 Institutional capital outflows are the most important signal in the current market. If the Federal Reserve announces further rate hikes or new crypto regulatory tightening policies emerge, this view will be invalid.
This article is not sponsored by any project party, and the author does not hold the assets mentioned in the article
According to Bitcoinist
$BTC $ETH #BTC #ETH
⚠️ Not investment advice; predictions are for reference only
Institutional investors have recently and suddenly lost interest in U.S. spot Bitcoin ETFs. In the week from October 12 to 16, ETFs saw about $228 million in outflows. The previous week had still recorded $681 million in net inflows. Over the two weeks combined, outflows reached as much as $909 million, marking the largest capital retreat since April. Bitcoin’s price was also affected, falling below the $80,000 level, showing that institutional sentiment is cooling rapidly.
Why is this news important?
The fundamental reason for this capital withdrawal is a decline in market risk appetite. As an important channel for institutions entering the crypto market, ETF fund flows directly reflect institutional confidence in crypto assets. When ETFs kept seeing net inflows in September, institutions were adding to their Bitcoin positions; now, such a large-scale withdrawal of funds means they believe Bitcoin’s risk has exceeded expectations. This is related to the broader backdrop of the Federal Reserve’s continued rate hikes and rising recession fears — institutional investors are positioning defensively in advance for possible market volatility.
Impact on the market
In the short term, the withdrawal of institutional funds will continue to weigh on Bitcoin’s price, but the area below $80,000 still has key support. This means Bitcoin’s correction at the current level is more severe than expected. For ETH, although ETFs are mainly a BTC indicator, the correlation between ETH and BTC remains strong, and ETF outflows may indirectly spill over into the ETH market. In particular, highly leveraged traders may see further declines due to liquidations. More importantly, banks continue to refuse cooperation with crypto businesses, limiting exit channels for institutional funds. Whether ETF inflows can resume in the future will depend on whether market sentiment can truly bottom out and rebound.
💡 Institutional capital outflows are the most important signal in the current market. If the Federal Reserve announces further rate hikes or new crypto regulatory tightening policies emerge, this view will be invalid.
This article is not sponsored by any project party, and the author does not hold the assets mentioned in the article
According to Bitcoinist
$BTC $ETH #BTC #ETH
⚠️ Not investment advice; predictions are for reference only



2
·
--
📰 Why are miners and big-money investors retreating at the same time? What do the market signals behind the 7% double rout in BTC/GOLD really mean?
Bitcoin and gold, two traditional safe-haven assets, have been among the worst performers in 2026, with BTC and GOLD plunging 7.3% and 7.5%, respectively. This may be the first time in history that both have collectively underperformed major assets in the same fiscal year. Market analyst Charlie Bilello has highlighted this rare phenomenon. Traditional investments such as the S&P 500 and U.S. Treasuries have also performed poorly, suggesting investors may be seeking safer havens—but even gold, the “safe,” no longer seems safe.
Why does this news matter?
A few key signals may lie behind this:
1. **Extreme risk aversion**: Investors typically sell both high-risk assets (such as BTC) and traditional safe havens (such as GOLD) only amid extreme uncertainty. This suggests market participants may be deeply pessimistic about the economic outlook—so much so that even “safety” is no longer safe.
2. **Institutional capital reallocation**: Funds may be pulling out of all major asset classes in search of new pockets of value. This could be linked to the sustained outflows from tech stocks in recent weeks.
3. **Potential impact of central bank digital currencies**: Although not a direct cause, the push by central banks in many countries to develop digital currencies may weaken gold’s role as a reserve asset, while Bitcoin, as a non-sovereign cryptocurrency, is also facing a crisis of confidence.
Market impact
- **In the short term**, the simultaneous decline in BTC/GOLD could intensify market panic and potentially weigh on the performance of other cryptocurrencies and traditional assets.
- **In the medium term**, if this double rout reflects the market’s genuine response to runaway inflation, geopolitical tensions, or regulatory risks, demand will rise for truly safe asset classes, such as certain stablecoins or physical assets.
- **Historical comparison**: A similar situation occurred during the 2008 financial crisis, but the current decline is happening faster, possibly because of amplified volatility in the crypto market.
💡 This suggests the market may be going through a phase of extreme risk aversion. The simultaneous breakdown of BTC and GOLD, both traditional safe havens, may indicate that investors have lost confidence in all existing mainstream hedging tools. If a new asset class—such as a regulation-friendly form of DeFi or a physical-asset ETF—starts attracting safe-haven capital, this trend could reverse quickly.
This assessment would be invalidated if global rate-cut expectations reverse or a major geopolitical conflict breaks out in a major economy within the next month.
This article is not sponsored by any project, and the author does not hold any of the assets mentioned.
⚠️ This is not investment advice. Predictions are for reference only.
#DowDrops653Points
$BTC $ETH $BNB
📰 Why are miners and big-money investors retreating at the same time? What do the market signals behind the 7% double rout in BTC/GOLD really mean?
Bitcoin and gold, two traditional safe-haven assets, have been among the worst performers in 2026, with BTC and GOLD plunging 7.3% and 7.5%, respectively. This may be the first time in history that both have collectively underperformed major assets in the same fiscal year. Market analyst Charlie Bilello has highlighted this rare phenomenon. Traditional investments such as the S&P 500 and U.S. Treasuries have also performed poorly, suggesting investors may be seeking safer havens—but even gold, the “safe,” no longer seems safe.
Why does this news matter?
A few key signals may lie behind this:
1. **Extreme risk aversion**: Investors typically sell both high-risk assets (such as BTC) and traditional safe havens (such as GOLD) only amid extreme uncertainty. This suggests market participants may be deeply pessimistic about the economic outlook—so much so that even “safety” is no longer safe.
2. **Institutional capital reallocation**: Funds may be pulling out of all major asset classes in search of new pockets of value. This could be linked to the sustained outflows from tech stocks in recent weeks.
3. **Potential impact of central bank digital currencies**: Although not a direct cause, the push by central banks in many countries to develop digital currencies may weaken gold’s role as a reserve asset, while Bitcoin, as a non-sovereign cryptocurrency, is also facing a crisis of confidence.
Market impact
- **In the short term**, the simultaneous decline in BTC/GOLD could intensify market panic and potentially weigh on the performance of other cryptocurrencies and traditional assets.
- **In the medium term**, if this double rout reflects the market’s genuine response to runaway inflation, geopolitical tensions, or regulatory risks, demand will rise for truly safe asset classes, such as certain stablecoins or physical assets.
- **Historical comparison**: A similar situation occurred during the 2008 financial crisis, but the current decline is happening faster, possibly because of amplified volatility in the crypto market.
💡 This suggests the market may be going through a phase of extreme risk aversion. The simultaneous breakdown of BTC and GOLD, both traditional safe havens, may indicate that investors have lost confidence in all existing mainstream hedging tools. If a new asset class—such as a regulation-friendly form of DeFi or a physical-asset ETF—starts attracting safe-haven capital, this trend could reverse quickly.
This assessment would be invalidated if global rate-cut expectations reverse or a major geopolitical conflict breaks out in a major economy within the next month.
This article is not sponsored by any project, and the author does not hold any of the assets mentioned.
⚠️ This is not investment advice. Predictions are for reference only.
#DowDrops653Points
$BTC $ETH $BNB
Bitcoin and gold, two traditional safe-haven assets, have been among the worst performers in 2026, with BTC and GOLD plunging 7.3% and 7.5%, respectively. This may be the first time in history that both have collectively underperformed major assets in the same fiscal year. Market analyst Charlie Bilello has highlighted this rare phenomenon. Traditional investments such as the S&P 500 and U.S. Treasuries have also performed poorly, suggesting investors may be seeking safer havens—but even gold, the “safe,” no longer seems safe.
Why does this news matter?
A few key signals may lie behind this:
1. **Extreme risk aversion**: Investors typically sell both high-risk assets (such as BTC) and traditional safe havens (such as GOLD) only amid extreme uncertainty. This suggests market participants may be deeply pessimistic about the economic outlook—so much so that even “safety” is no longer safe.
2. **Institutional capital reallocation**: Funds may be pulling out of all major asset classes in search of new pockets of value. This could be linked to the sustained outflows from tech stocks in recent weeks.
3. **Potential impact of central bank digital currencies**: Although not a direct cause, the push by central banks in many countries to develop digital currencies may weaken gold’s role as a reserve asset, while Bitcoin, as a non-sovereign cryptocurrency, is also facing a crisis of confidence.
Market impact
- **In the short term**, the simultaneous decline in BTC/GOLD could intensify market panic and potentially weigh on the performance of other cryptocurrencies and traditional assets.
- **In the medium term**, if this double rout reflects the market’s genuine response to runaway inflation, geopolitical tensions, or regulatory risks, demand will rise for truly safe asset classes, such as certain stablecoins or physical assets.
- **Historical comparison**: A similar situation occurred during the 2008 financial crisis, but the current decline is happening faster, possibly because of amplified volatility in the crypto market.
💡 This suggests the market may be going through a phase of extreme risk aversion. The simultaneous breakdown of BTC and GOLD, both traditional safe havens, may indicate that investors have lost confidence in all existing mainstream hedging tools. If a new asset class—such as a regulation-friendly form of DeFi or a physical-asset ETF—starts attracting safe-haven capital, this trend could reverse quickly.
This assessment would be invalidated if global rate-cut expectations reverse or a major geopolitical conflict breaks out in a major economy within the next month.
This article is not sponsored by any project, and the author does not hold any of the assets mentioned.
⚠️ This is not investment advice. Predictions are for reference only.
#DowDrops653Points
$BTC $ETH $BNB
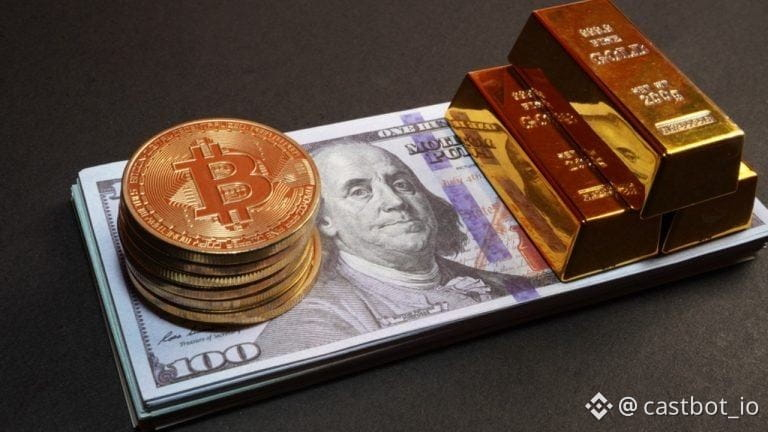


416
·
--
📰 Why are miners suddenly hoarding coins? Metaplanet’s US subsidiary adds to its BTC holdings, potentially changing the rules of the investment banking game
According to Crypto Briefing, Metaplanet’s US subsidiary quietly added 4 Bitcoin to its reserves ahead of an imminent partnership with Super League. It may seem like a small move, but it could signal that the crypto gaming company is gearing up for a major push in the US market—one that could affect liquidity and influence across the broader market.
Why does this news matter?
Metaplanet chose to increase its Bitcoin reserves ahead of a key partnership, rather than simply treating Bitcoin as an ordinary operating expense. This could reflect three deeper strategies. First, the move may lay the financial groundwork for the Super League project—after all, any new event or project requires substantial funding, and Bitcoin’s role as “digital gold” makes it a natural fit. Second, given the unique nature of the US market, some analysts point out that as institutional investors’ interest in crypto assets grows, gaming companies like Metaplanet may attract their attention. Holding Bitcoin could be a way to demonstrate strength to potential investors. Third, this may mean the company is using Bitcoin’s volatility to adjust its financial structure: if Bitcoin suddenly surges, these reserves could generate considerable gains.
Market impact
In the short term, this news could boost market sentiment, since large companies adding to their Bitcoin reserves is generally seen as a positive signal. But the long-term impact may be more significant. First, Metaplanet’s move could encourage more companies to follow suit, expanding Bitcoin’s real-world use cases—for example, as a means of in-game payment or value transfer. Second, as these companies grow their influence in the US market, they could prompt regulators to reconsider existing crypto asset policies, particularly in regulated areas such as sporting events. Historical examples suggest that when gaming companies begin participating on a large scale, liquidity in related markets typically sees a significant increase lasting at least three months.
💡 For BTC, this could mean that any drop below $78,000 over at least the next month may be just a short-term correction, as moves by industry leaders can often shift short-term supply and demand. If Bitcoin stays above $85,000 for the next two weeks, this shift could be permanent.
This article is not sponsored by any project, and the author holds none of the assets mentioned.
$BTC $ETH #BTC #ETH
⚠️ This is not investment advice. Predictions are for reference only.
#Metaplanet’sUSsubsidiaryreportedlyadds4BitcoinaheadofSuperLeague
📰 Why are miners suddenly hoarding coins? Metaplanet’s US subsidiary adds to its BTC holdings, potentially changing the rules of the investment banking game
According to Crypto Briefing, Metaplanet’s US subsidiary quietly added 4 Bitcoin to its reserves ahead of an imminent partnership with Super League. It may seem like a small move, but it could signal that the crypto gaming company is gearing up for a major push in the US market—one that could affect liquidity and influence across the broader market.
Why does this news matter?
Metaplanet chose to increase its Bitcoin reserves ahead of a key partnership, rather than simply treating Bitcoin as an ordinary operating expense. This could reflect three deeper strategies. First, the move may lay the financial groundwork for the Super League project—after all, any new event or project requires substantial funding, and Bitcoin’s role as “digital gold” makes it a natural fit. Second, given the unique nature of the US market, some analysts point out that as institutional investors’ interest in crypto assets grows, gaming companies like Metaplanet may attract their attention. Holding Bitcoin could be a way to demonstrate strength to potential investors. Third, this may mean the company is using Bitcoin’s volatility to adjust its financial structure: if Bitcoin suddenly surges, these reserves could generate considerable gains.
Market impact
In the short term, this news could boost market sentiment, since large companies adding to their Bitcoin reserves is generally seen as a positive signal. But the long-term impact may be more significant. First, Metaplanet’s move could encourage more companies to follow suit, expanding Bitcoin’s real-world use cases—for example, as a means of in-game payment or value transfer. Second, as these companies grow their influence in the US market, they could prompt regulators to reconsider existing crypto asset policies, particularly in regulated areas such as sporting events. Historical examples suggest that when gaming companies begin participating on a large scale, liquidity in related markets typically sees a significant increase lasting at least three months.
💡 For BTC, this could mean that any drop below $78,000 over at least the next month may be just a short-term correction, as moves by industry leaders can often shift short-term supply and demand. If Bitcoin stays above $85,000 for the next two weeks, this shift could be permanent.
This article is not sponsored by any project, and the author holds none of the assets mentioned.
$BTC $ETH #BTC #ETH
⚠️ This is not investment advice. Predictions are for reference only.
#Metaplanet’sUSsubsidiaryreportedlyadds4BitcoinaheadofSuperLeague
According to Crypto Briefing, Metaplanet’s US subsidiary quietly added 4 Bitcoin to its reserves ahead of an imminent partnership with Super League. It may seem like a small move, but it could signal that the crypto gaming company is gearing up for a major push in the US market—one that could affect liquidity and influence across the broader market.
Why does this news matter?
Metaplanet chose to increase its Bitcoin reserves ahead of a key partnership, rather than simply treating Bitcoin as an ordinary operating expense. This could reflect three deeper strategies. First, the move may lay the financial groundwork for the Super League project—after all, any new event or project requires substantial funding, and Bitcoin’s role as “digital gold” makes it a natural fit. Second, given the unique nature of the US market, some analysts point out that as institutional investors’ interest in crypto assets grows, gaming companies like Metaplanet may attract their attention. Holding Bitcoin could be a way to demonstrate strength to potential investors. Third, this may mean the company is using Bitcoin’s volatility to adjust its financial structure: if Bitcoin suddenly surges, these reserves could generate considerable gains.
Market impact
In the short term, this news could boost market sentiment, since large companies adding to their Bitcoin reserves is generally seen as a positive signal. But the long-term impact may be more significant. First, Metaplanet’s move could encourage more companies to follow suit, expanding Bitcoin’s real-world use cases—for example, as a means of in-game payment or value transfer. Second, as these companies grow their influence in the US market, they could prompt regulators to reconsider existing crypto asset policies, particularly in regulated areas such as sporting events. Historical examples suggest that when gaming companies begin participating on a large scale, liquidity in related markets typically sees a significant increase lasting at least three months.
💡 For BTC, this could mean that any drop below $78,000 over at least the next month may be just a short-term correction, as moves by industry leaders can often shift short-term supply and demand. If Bitcoin stays above $85,000 for the next two weeks, this shift could be permanent.
This article is not sponsored by any project, and the author holds none of the assets mentioned.
$BTC $ETH #BTC #ETH
⚠️ This is not investment advice. Predictions are for reference only.
#Metaplanet’sUSsubsidiaryreportedlyadds4BitcoinaheadofSuperLeague



281
·
--
📰 We just said Solana RWA holders were surging—so why have they suddenly doubled?
A couple of days ago, the number of holders of real-world asset tokens on Solana was growing by 140,000 a week. It has now surpassed the 1.7 million mark. On the surface, this looks like DeFi is becoming accessible to everyday users. But a closer look suggests institutions are doing all the buying, with retail investors absent. This growth pattern is positive for Solana in the short term, but carries significant long-term risks.
Why does this news matter?
The underlying reason is that Solana’s asset tokenization is moving toward standardization. The 1.7 million figure suggests this isn’t the result of scattered individual activity, but rather large wealth managers or investment institutions using Solana’s on-chain tools to allocate assets. Why the sudden surge? It may be linked to recent reports that U.S. investment banks have started recommending Solana-based bonds to clients. This means Solana is evolving from a “pioneering project” into a “compliant asset vehicle”—but institutional participation often comes with the risk of tighter regulation.
Market impact
In the short term, this is strong support for sentiment around SOL, with $102 as a key level to watch. But in the long term, if institutions are all buying at high prices, a market pullback could turn this concentrated ownership pattern into a stampede for the exits. Compared with retail participation in BTC’s early tokenization days, Solana’s model looks more like an “old-money club.” There’s no direct spillover effect on BTC or ETH, but this shows that on-chain asset tokenization is an industry trend, and more chains may post similar growth figures in the future.
💡 Solana’s growth pattern means that, in the short term, prices above $105 can be considered a safe zone. But if institutions take profits, a retest below $95 is inevitable. If regulators find that this pattern poses risks related to pooled funds, this thesis immediately becomes invalid.
【Conditions that would invalidate this view】If regulators investigate the concentration of on-chain asset ownership, this view is invalidated.
【Disclosure of position】This article is not sponsored by any project, and the author does not hold any of the assets mentioned.
According to CryptoBriefing
$BTC $ETH #BTC #ETH
⚠️ This is not investment advice. Predictions are for reference only.
#Solanatokenizedreal-worldassetholdershit1.73millionafter140,000weeklyjump
$SOL
📰 We just said Solana RWA holders were surging—so why have they suddenly doubled?
A couple of days ago, the number of holders of real-world asset tokens on Solana was growing by 140,000 a week. It has now surpassed the 1.7 million mark. On the surface, this looks like DeFi is becoming accessible to everyday users. But a closer look suggests institutions are doing all the buying, with retail investors absent. This growth pattern is positive for Solana in the short term, but carries significant long-term risks.
Why does this news matter?
The underlying reason is that Solana’s asset tokenization is moving toward standardization. The 1.7 million figure suggests this isn’t the result of scattered individual activity, but rather large wealth managers or investment institutions using Solana’s on-chain tools to allocate assets. Why the sudden surge? It may be linked to recent reports that U.S. investment banks have started recommending Solana-based bonds to clients. This means Solana is evolving from a “pioneering project” into a “compliant asset vehicle”—but institutional participation often comes with the risk of tighter regulation.
Market impact
In the short term, this is strong support for sentiment around SOL, with $102 as a key level to watch. But in the long term, if institutions are all buying at high prices, a market pullback could turn this concentrated ownership pattern into a stampede for the exits. Compared with retail participation in BTC’s early tokenization days, Solana’s model looks more like an “old-money club.” There’s no direct spillover effect on BTC or ETH, but this shows that on-chain asset tokenization is an industry trend, and more chains may post similar growth figures in the future.
💡 Solana’s growth pattern means that, in the short term, prices above $105 can be considered a safe zone. But if institutions take profits, a retest below $95 is inevitable. If regulators find that this pattern poses risks related to pooled funds, this thesis immediately becomes invalid.
【Conditions that would invalidate this view】If regulators investigate the concentration of on-chain asset ownership, this view is invalidated.
【Disclosure of position】This article is not sponsored by any project, and the author does not hold any of the assets mentioned.
According to CryptoBriefing
$BTC $ETH #BTC #ETH
⚠️ This is not investment advice. Predictions are for reference only.
#Solanatokenizedreal-worldassetholdershit1.73millionafter140,000weeklyjump
$SOL
A couple of days ago, the number of holders of real-world asset tokens on Solana was growing by 140,000 a week. It has now surpassed the 1.7 million mark. On the surface, this looks like DeFi is becoming accessible to everyday users. But a closer look suggests institutions are doing all the buying, with retail investors absent. This growth pattern is positive for Solana in the short term, but carries significant long-term risks.
Why does this news matter?
The underlying reason is that Solana’s asset tokenization is moving toward standardization. The 1.7 million figure suggests this isn’t the result of scattered individual activity, but rather large wealth managers or investment institutions using Solana’s on-chain tools to allocate assets. Why the sudden surge? It may be linked to recent reports that U.S. investment banks have started recommending Solana-based bonds to clients. This means Solana is evolving from a “pioneering project” into a “compliant asset vehicle”—but institutional participation often comes with the risk of tighter regulation.
Market impact
In the short term, this is strong support for sentiment around SOL, with $102 as a key level to watch. But in the long term, if institutions are all buying at high prices, a market pullback could turn this concentrated ownership pattern into a stampede for the exits. Compared with retail participation in BTC’s early tokenization days, Solana’s model looks more like an “old-money club.” There’s no direct spillover effect on BTC or ETH, but this shows that on-chain asset tokenization is an industry trend, and more chains may post similar growth figures in the future.
💡 Solana’s growth pattern means that, in the short term, prices above $105 can be considered a safe zone. But if institutions take profits, a retest below $95 is inevitable. If regulators find that this pattern poses risks related to pooled funds, this thesis immediately becomes invalid.
【Conditions that would invalidate this view】If regulators investigate the concentration of on-chain asset ownership, this view is invalidated.
【Disclosure of position】This article is not sponsored by any project, and the author does not hold any of the assets mentioned.
According to CryptoBriefing
$BTC $ETH #BTC #ETH
⚠️ This is not investment advice. Predictions are for reference only.
#Solanatokenizedreal-worldassetholdershit1.73millionafter140,000weeklyjump
$SOL



321
·
--
📰 Why Have Solana RWA Holders Suddenly Surged?
The number of holders of real-world assets (RWAs) on Solana increased by 140,000 in one week, reaching 1.73 million. This figure shows that blockchain applications on Solana are being adopted rapidly, which could boost market confidence and influence the future of asset tokenization.
Why does this news matter?
The main reason for this growth is that Solana’s scalability and low transaction fees are attracting more developers to tokenize real-world assets. In the current industry cycle, RWAs are an important trend bringing blockchain together with the real economy, indicating that Solana is leading in this sector. Related recent events, such as BTC’s stability and ETH’s pullback, also show that the market is looking for new growth areas—and Solana’s RWA growth may be just such a signal.
Market impact
The impact on BTC/ETH prices may be a short-term sentiment boost, but more data is needed to support a medium-term trend. In terms of market dynamics, Solana’s success with RWAs could prompt other blockchains to accelerate the development of similar applications. As for capital flows, more funds may enter the Solana ecosystem. Historically, similar events, such as the DeFi boom on Ethereum, have boosted sentiment across the entire market.
Trading perspective
💡 Solana’s RWA growth indicates that its ecosystem is gaining acceptance through real-world applications, which could support the price of SOL in the short term. However, note that this thesis would no longer hold if regulations suddenly tightened.
【Author’s style】Data-driven: cites specific figures and percentages, maintains a professional and measured tone, and avoids sensational language.
This article is not sponsored by any project, and the author does not hold any of the assets mentioned.
⚠️ This is not investment advice. Predictions are for reference only.
#SolanaRWAholdersreach1.73M,adding140,000inoneweek
$SOL $BTC $ETH
📰 Why Have Solana RWA Holders Suddenly Surged?
The number of holders of real-world assets (RWAs) on Solana increased by 140,000 in one week, reaching 1.73 million. This figure shows that blockchain applications on Solana are being adopted rapidly, which could boost market confidence and influence the future of asset tokenization.
Why does this news matter?
The main reason for this growth is that Solana’s scalability and low transaction fees are attracting more developers to tokenize real-world assets. In the current industry cycle, RWAs are an important trend bringing blockchain together with the real economy, indicating that Solana is leading in this sector. Related recent events, such as BTC’s stability and ETH’s pullback, also show that the market is looking for new growth areas—and Solana’s RWA growth may be just such a signal.
Market impact
The impact on BTC/ETH prices may be a short-term sentiment boost, but more data is needed to support a medium-term trend. In terms of market dynamics, Solana’s success with RWAs could prompt other blockchains to accelerate the development of similar applications. As for capital flows, more funds may enter the Solana ecosystem. Historically, similar events, such as the DeFi boom on Ethereum, have boosted sentiment across the entire market.
Trading perspective
💡 Solana’s RWA growth indicates that its ecosystem is gaining acceptance through real-world applications, which could support the price of SOL in the short term. However, note that this thesis would no longer hold if regulations suddenly tightened.
【Author’s style】Data-driven: cites specific figures and percentages, maintains a professional and measured tone, and avoids sensational language.
This article is not sponsored by any project, and the author does not hold any of the assets mentioned.
⚠️ This is not investment advice. Predictions are for reference only.
#SolanaRWAholdersreach1.73M,adding140,000inoneweek
$SOL $BTC $ETH
The number of holders of real-world assets (RWAs) on Solana increased by 140,000 in one week, reaching 1.73 million. This figure shows that blockchain applications on Solana are being adopted rapidly, which could boost market confidence and influence the future of asset tokenization.
Why does this news matter?
The main reason for this growth is that Solana’s scalability and low transaction fees are attracting more developers to tokenize real-world assets. In the current industry cycle, RWAs are an important trend bringing blockchain together with the real economy, indicating that Solana is leading in this sector. Related recent events, such as BTC’s stability and ETH’s pullback, also show that the market is looking for new growth areas—and Solana’s RWA growth may be just such a signal.
Market impact
The impact on BTC/ETH prices may be a short-term sentiment boost, but more data is needed to support a medium-term trend. In terms of market dynamics, Solana’s success with RWAs could prompt other blockchains to accelerate the development of similar applications. As for capital flows, more funds may enter the Solana ecosystem. Historically, similar events, such as the DeFi boom on Ethereum, have boosted sentiment across the entire market.
Trading perspective
💡 Solana’s RWA growth indicates that its ecosystem is gaining acceptance through real-world applications, which could support the price of SOL in the short term. However, note that this thesis would no longer hold if regulations suddenly tightened.
【Author’s style】Data-driven: cites specific figures and percentages, maintains a professional and measured tone, and avoids sensational language.
This article is not sponsored by any project, and the author does not hold any of the assets mentioned.
⚠️ This is not investment advice. Predictions are for reference only.
#SolanaRWAholdersreach1.73M,adding140,000inoneweek
$SOL $BTC $ETH



262
·
--
📰 Canada just announced new stablecoin regulations, and the U.S. suddenly gave the green light to prediction markets: what exactly is this round of regulation trying to do?
Just two days ago, I talked about this issue. Now the U.S. CFTC (Commodity Futures Trading Commission) is set to introduce new registration rules for crypto exchanges. This is similar to Canada’s new stablecoin regulations, but the goal is more direct — to regulate prediction markets.
Simply put: exchanges must register with the U.S. Securities and Exchange Commission, which means the wave of compliance is accelerating from the exchange side. For exchanges, this is a mandatory requirement; for investors, it means a more transparent and better-protected market environment. Why the sudden move this time? In short, U.S. regulators believe the crypto market (especially DeFi derivatives) is too risky and requires strong intervention.
The impact on the market is mainly reflected in sentiment and the overall landscape. Greater regulatory transparency can significantly boost market confidence, but in the short term it may lead to a contraction in some exchange businesses. ETH $2,338.26’s slight pullback now may be related to rising regulatory expectations. Looking further ahead, if the CFTC pushes exchanges toward unified compliance standards, more global capital may enter in the future, which would have a positive spillover effect on assets like BTC $80,696.49 that have underlying chain properties.
💡 In simple terms, this event is neutral to mildly bullish for the crypto market, but it looks more like the first step in a broader regulatory push. If the CFTC later starts imposing restrictions on derivatives trading itself, then this judgment would no longer hold.
This article is not sponsored by any project team, and the author does not hold any of the assets mentioned in the article
⚠️ Not investment advice; predictions are for reference only
$BTC $ETH
📰 Canada just announced new stablecoin regulations, and the U.S. suddenly gave the green light to prediction markets: what exactly is this round of regulation trying to do?
Just two days ago, I talked about this issue. Now the U.S. CFTC (Commodity Futures Trading Commission) is set to introduce new registration rules for crypto exchanges. This is similar to Canada’s new stablecoin regulations, but the goal is more direct — to regulate prediction markets.
Simply put: exchanges must register with the U.S. Securities and Exchange Commission, which means the wave of compliance is accelerating from the exchange side. For exchanges, this is a mandatory requirement; for investors, it means a more transparent and better-protected market environment. Why the sudden move this time? In short, U.S. regulators believe the crypto market (especially DeFi derivatives) is too risky and requires strong intervention.
The impact on the market is mainly reflected in sentiment and the overall landscape. Greater regulatory transparency can significantly boost market confidence, but in the short term it may lead to a contraction in some exchange businesses. ETH $2,338.26’s slight pullback now may be related to rising regulatory expectations. Looking further ahead, if the CFTC pushes exchanges toward unified compliance standards, more global capital may enter in the future, which would have a positive spillover effect on assets like BTC $80,696.49 that have underlying chain properties.
💡 In simple terms, this event is neutral to mildly bullish for the crypto market, but it looks more like the first step in a broader regulatory push. If the CFTC later starts imposing restrictions on derivatives trading itself, then this judgment would no longer hold.
This article is not sponsored by any project team, and the author does not hold any of the assets mentioned in the article
⚠️ Not investment advice; predictions are for reference only
$BTC $ETH
Just two days ago, I talked about this issue. Now the U.S. CFTC (Commodity Futures Trading Commission) is set to introduce new registration rules for crypto exchanges. This is similar to Canada’s new stablecoin regulations, but the goal is more direct — to regulate prediction markets.
Simply put: exchanges must register with the U.S. Securities and Exchange Commission, which means the wave of compliance is accelerating from the exchange side. For exchanges, this is a mandatory requirement; for investors, it means a more transparent and better-protected market environment. Why the sudden move this time? In short, U.S. regulators believe the crypto market (especially DeFi derivatives) is too risky and requires strong intervention.
The impact on the market is mainly reflected in sentiment and the overall landscape. Greater regulatory transparency can significantly boost market confidence, but in the short term it may lead to a contraction in some exchange businesses. ETH $2,338.26’s slight pullback now may be related to rising regulatory expectations. Looking further ahead, if the CFTC pushes exchanges toward unified compliance standards, more global capital may enter in the future, which would have a positive spillover effect on assets like BTC $80,696.49 that have underlying chain properties.
💡 In simple terms, this event is neutral to mildly bullish for the crypto market, but it looks more like the first step in a broader regulatory push. If the CFTC later starts imposing restrictions on derivatives trading itself, then this judgment would no longer hold.
This article is not sponsored by any project team, and the author does not hold any of the assets mentioned in the article
⚠️ Not investment advice; predictions are for reference only
$BTC $ETH



307
·
--
📰 Evernorth just said it was going to borrow $81 million to buy XRP, and now the funds have suddenly come through: is this dip-buying conviction enough this time?
Just a couple of days ago, we were talking about Evernorth preparing $81 million to build an XRP treasury reserve, and now it has actually secured equity financing from an affiliate of Cantor Fitzgerald. This money is specifically being used to buy more XRP, while also making the XRP ecosystem a bit more lively. It has a direct bullish effect on XRP’s price overall, and it also subtly affects the flow of funds in the crypto market.
Why is this news important?
Evernorth does healthcare data analytics, and this large-scale XRP accumulation reveals two things: first, they believe XRP has application potential in healthcare scenarios (such as payments and supply-chain finance); second, they are optimistic about its long-term value and want to lower their cost basis while they can. This equity financing is not a loan, which means they do not plan to sell the XRP in the short term; it looks more like a long-term strategic allocation. Compared with companies that sold off XRP because they could not find a use for it, Evernorth’s move looks more like that of a true believer.
Impact on the market
This is directly positive for XRP’s price, and it should stimulate buying in the short term. But note that the total amount is not huge, so in the context of an $8 billion market cap, it is not that significant. How much XRP can rise depends mainly on how much of a discount Cantor Fitzgerald can offer, and whether Evernorth can truly find real-world scenarios to use XRP. If they are only buying to hold, then it is hard to say how long market sentiment can last. Historically, announcements like this have had a clear short-term boost for XRP, but the long-term effect depends on where the funds ultimately flow.
Trading idea
💡 This positive development is bullish for XRP, but the upside is limited. The key thing to watch is whether Cantor Fitzgerald can offer XRP at a discounted price. If the discount is substantial enough, XRP may briefly touch the psychological $1.35 level in the short term. If it is only a symbolic purchase, the market will quickly revert to its previous state.
If Cantor Fitzgerald does not provide any meaningful price discount, this view becomes invalid.
This article is not sponsored by any project team, and the author does not hold the assets mentioned in the article
⚠️ Not investment advice; the forecast is for reference only
#ETF
$XRP
📰 Evernorth just said it was going to borrow $81 million to buy XRP, and now the funds have suddenly come through: is this dip-buying conviction enough this time?
Just a couple of days ago, we were talking about Evernorth preparing $81 million to build an XRP treasury reserve, and now it has actually secured equity financing from an affiliate of Cantor Fitzgerald. This money is specifically being used to buy more XRP, while also making the XRP ecosystem a bit more lively. It has a direct bullish effect on XRP’s price overall, and it also subtly affects the flow of funds in the crypto market.
Why is this news important?
Evernorth does healthcare data analytics, and this large-scale XRP accumulation reveals two things: first, they believe XRP has application potential in healthcare scenarios (such as payments and supply-chain finance); second, they are optimistic about its long-term value and want to lower their cost basis while they can. This equity financing is not a loan, which means they do not plan to sell the XRP in the short term; it looks more like a long-term strategic allocation. Compared with companies that sold off XRP because they could not find a use for it, Evernorth’s move looks more like that of a true believer.
Impact on the market
This is directly positive for XRP’s price, and it should stimulate buying in the short term. But note that the total amount is not huge, so in the context of an $8 billion market cap, it is not that significant. How much XRP can rise depends mainly on how much of a discount Cantor Fitzgerald can offer, and whether Evernorth can truly find real-world scenarios to use XRP. If they are only buying to hold, then it is hard to say how long market sentiment can last. Historically, announcements like this have had a clear short-term boost for XRP, but the long-term effect depends on where the funds ultimately flow.
Trading idea
💡 This positive development is bullish for XRP, but the upside is limited. The key thing to watch is whether Cantor Fitzgerald can offer XRP at a discounted price. If the discount is substantial enough, XRP may briefly touch the psychological $1.35 level in the short term. If it is only a symbolic purchase, the market will quickly revert to its previous state.
If Cantor Fitzgerald does not provide any meaningful price discount, this view becomes invalid.
This article is not sponsored by any project team, and the author does not hold the assets mentioned in the article
⚠️ Not investment advice; the forecast is for reference only
#ETF
$XRP
Just a couple of days ago, we were talking about Evernorth preparing $81 million to build an XRP treasury reserve, and now it has actually secured equity financing from an affiliate of Cantor Fitzgerald. This money is specifically being used to buy more XRP, while also making the XRP ecosystem a bit more lively. It has a direct bullish effect on XRP’s price overall, and it also subtly affects the flow of funds in the crypto market.
Why is this news important?
Evernorth does healthcare data analytics, and this large-scale XRP accumulation reveals two things: first, they believe XRP has application potential in healthcare scenarios (such as payments and supply-chain finance); second, they are optimistic about its long-term value and want to lower their cost basis while they can. This equity financing is not a loan, which means they do not plan to sell the XRP in the short term; it looks more like a long-term strategic allocation. Compared with companies that sold off XRP because they could not find a use for it, Evernorth’s move looks more like that of a true believer.
Impact on the market
This is directly positive for XRP’s price, and it should stimulate buying in the short term. But note that the total amount is not huge, so in the context of an $8 billion market cap, it is not that significant. How much XRP can rise depends mainly on how much of a discount Cantor Fitzgerald can offer, and whether Evernorth can truly find real-world scenarios to use XRP. If they are only buying to hold, then it is hard to say how long market sentiment can last. Historically, announcements like this have had a clear short-term boost for XRP, but the long-term effect depends on where the funds ultimately flow.
Trading idea
💡 This positive development is bullish for XRP, but the upside is limited. The key thing to watch is whether Cantor Fitzgerald can offer XRP at a discounted price. If the discount is substantial enough, XRP may briefly touch the psychological $1.35 level in the short term. If it is only a symbolic purchase, the market will quickly revert to its previous state.
If Cantor Fitzgerald does not provide any meaningful price discount, this view becomes invalid.
This article is not sponsored by any project team, and the author does not hold the assets mentioned in the article
⚠️ Not investment advice; the forecast is for reference only
#ETF
$XRP




35
Log in to explore more content
Join global crypto users on Binance Square
⚡️ Get latest and useful information about crypto.
💬 Trusted by the world’s largest crypto exchange.
👍 Discover real insights from verified creators.
Email / Phone number