

#uscorepceeasesto3
uscorepceeasesto3
443 views
20 Discussing
Hot
Latest

·
--
If you're still sitting on the sidelines waiting for Powell to confirm a rate cut, stop now.
That exact hesitation is how traders miss entire cycles. You watch the data come in, overthink the "what if it's a one-off," then FOMO in at the top after the market has already moved 20 percent.
Core PCE easing to 3 percent is the Fed's preferred gauge finally cooperating. We've been here before. In 2023 the same cooling inflation narrative got laughed at as transitory round two, yet it kicked off the rally that took us from the bear market lows.
This time Fear and Greed sits at 68 and alts are stirring. $XRP and $AAVE have been leading the way while $ENA stays in the conversation.
The comparison isn't identical, but the market is pricing the pivot faster than last cycle. Liquidity tends to show up before the official announcement.
Where do you think this PCE print actually takes us from here?
#USCorePCEEasesTo3 #BitcoinClears #AltcoinSeasonIndexHoldsAbove60For5Days
If you're still sitting on the sidelines waiting for Powell to confirm a rate cut, stop now.
That exact hesitation is how traders miss entire cycles. You watch the data come in, overthink the "what if it's a one-off," then FOMO in at the top after the market has already moved 20 percent.
Core PCE easing to 3 percent is the Fed's preferred gauge finally cooperating. We've been here before. In 2023 the same cooling inflation narrative got laughed at as transitory round two, yet it kicked off the rally that took us from the bear market lows.
This time Fear and Greed sits at 68 and alts are stirring. $XRP and $AAVE have been leading the way while $ENA stays in the conversation.
The comparison isn't identical, but the market is pricing the pivot faster than last cycle. Liquidity tends to show up before the official announcement.
Where do you think this PCE print actually takes us from here?
#USCorePCEEasesTo3 #BitcoinClears #AltcoinSeasonIndexHoldsAbove60For5Days
That exact hesitation is how traders miss entire cycles. You watch the data come in, overthink the "what if it's a one-off," then FOMO in at the top after the market has already moved 20 percent.
Core PCE easing to 3 percent is the Fed's preferred gauge finally cooperating. We've been here before. In 2023 the same cooling inflation narrative got laughed at as transitory round two, yet it kicked off the rally that took us from the bear market lows.
This time Fear and Greed sits at 68 and alts are stirring. $XRP and $AAVE have been leading the way while $ENA stays in the conversation.
The comparison isn't identical, but the market is pricing the pivot faster than last cycle. Liquidity tends to show up before the official announcement.
Where do you think this PCE print actually takes us from here?
#USCorePCEEasesTo3 #BitcoinClears #AltcoinSeasonIndexHoldsAbove60For5Days

345

Have you noticed how quickly this market treats a single inflation print as permission to abandon all risk management?
Traders see Core PCE ease to 3% and immediately rotate out of $USDT into whatever is pumping, then wonder why they keep buying local tops. That FOMO cycle is how accounts get wrecked, not how they compound.
A 3% Core PCE is progress, not a victory lap. The Fed still wants 2%. Services inflation remains sticky and the labor market has not cracked. Pricing in aggressive cuts off one print is how you get caught on the wrong side of the next FOMC. I am not saying ignore it. I am saying stop treating it like a buy signal for everything.
Here is what I am actually doing. I keep a larger $USDT buffer than usual and only add on confirmed strength, not headlines. I am watching $XRP and $AAVE for whether they hold bid on any dip rather than chasing every name that is trending. If Bitcoin holds its range after this data, alts can follow. If it fades, this was just another liquidity grab dressed as good news.
Where do you think this goes from here?
#USCorePCEEasesTo3 #BitcoinClears #AltcoinSeasonIndexHoldsAbove60For5Days
Have you noticed how quickly this market treats a single inflation print as permission to abandon all risk management?
Traders see Core PCE ease to 3% and immediately rotate out of $USDT into whatever is pumping, then wonder why they keep buying local tops. That FOMO cycle is how accounts get wrecked, not how they compound.
A 3% Core PCE is progress, not a victory lap. The Fed still wants 2%. Services inflation remains sticky and the labor market has not cracked. Pricing in aggressive cuts off one print is how you get caught on the wrong side of the next FOMC. I am not saying ignore it. I am saying stop treating it like a buy signal for everything.
Here is what I am actually doing. I keep a larger $USDT buffer than usual and only add on confirmed strength, not headlines. I am watching $XRP and $AAVE for whether they hold bid on any dip rather than chasing every name that is trending. If Bitcoin holds its range after this data, alts can follow. If it fades, this was just another liquidity grab dressed as good news.
Where do you think this goes from here?
#USCorePCEEasesTo3 #BitcoinClears #AltcoinSeasonIndexHoldsAbove60For5Days
Traders see Core PCE ease to 3% and immediately rotate out of $USDT into whatever is pumping, then wonder why they keep buying local tops. That FOMO cycle is how accounts get wrecked, not how they compound.
A 3% Core PCE is progress, not a victory lap. The Fed still wants 2%. Services inflation remains sticky and the labor market has not cracked. Pricing in aggressive cuts off one print is how you get caught on the wrong side of the next FOMC. I am not saying ignore it. I am saying stop treating it like a buy signal for everything.
Here is what I am actually doing. I keep a larger $USDT buffer than usual and only add on confirmed strength, not headlines. I am watching $XRP and $AAVE for whether they hold bid on any dip rather than chasing every name that is trending. If Bitcoin holds its range after this data, alts can follow. If it fades, this was just another liquidity grab dressed as good news.
Where do you think this goes from here?
#USCorePCEEasesTo3 #BitcoinClears #AltcoinSeasonIndexHoldsAbove60For5Days

11

·
--
The latest US Core PCE data for August has shown a welcome easing, dropping to the 3% mark. This figure is a significant indicator for the Federal Reserve's monetary policy decisions, suggesting that inflationary pressures may be moderating.
This development is crucial for the crypto market as it could influence the Fed's stance on interest rates. Lower inflation often leads to a less hawkish monetary policy, which can be bullish for risk assets like cryptocurrencies. Investors will be closely watching how this data impacts future rate hike expectations and the overall market sentiment. A potential shift towards a more accommodative stance could unlock further upside potential for digital assets.
This information is for informational purposes only and does not constitute investment advice.
#USCorePCEEasesTo3%InAugust
The latest US Core PCE data for August has shown a welcome easing, dropping to the 3% mark. This figure is a significant indicator for the Federal Reserve's monetary policy decisions, suggesting that inflationary pressures may be moderating.
This development is crucial for the crypto market as it could influence the Fed's stance on interest rates. Lower inflation often leads to a less hawkish monetary policy, which can be bullish for risk assets like cryptocurrencies. Investors will be closely watching how this data impacts future rate hike expectations and the overall market sentiment. A potential shift towards a more accommodative stance could unlock further upside potential for digital assets.
This information is for informational purposes only and does not constitute investment advice.
#USCorePCEEasesTo3%InAugust
This development is crucial for the crypto market as it could influence the Fed's stance on interest rates. Lower inflation often leads to a less hawkish monetary policy, which can be bullish for risk assets like cryptocurrencies. Investors will be closely watching how this data impacts future rate hike expectations and the overall market sentiment. A potential shift towards a more accommodative stance could unlock further upside potential for digital assets.
This information is for informational purposes only and does not constitute investment advice.
#USCorePCEEasesTo3%InAugust

12

·
--
Core PCE YoY at 3.0% | Real consumption up 0.6% QoQ | ETH around 2680—wait first
My stance is to stand by: inflation readings are relatively mild, so you can’t jump straight to “easing is already settled”; consumption still shows resilience, so you also can’t label this data as an economic downturn. The U.S. Bureau of Economic Analysis’ personal income and spending report released on September 30 (for August) is very clear: the core PCE price index excluding food and energy rose 3.0% year over year and 0.2% month over month; real personal consumption expenditures increased 0.6% month over month, and nominal consumer spending increased 0.9% month over month. Here, 3.0% is the year-over-year price growth, while 0.6% is the month-over-month change in consumption volume adjusted for prices—different measures, so you can’t subtract them to derive some so-called “real interest rate.”
How does this affect ETH? The market prices risk assets through future policy interest rates, U.S. Treasury yields, and dollar liquidity. Easing price pressure may reduce discount-rate concerns, but stronger-than-expected consumption also implies demand hasn’t cooled meaningfully, so the central bank may not be willing to give an immediately sustainable easing commitment. For an asset like ETH, which is influenced simultaneously by macro liquidity, ETF creations/redemptions, and on-chain demand, the macro direction is only one line. I’d rather see confirmation from both capital flows and spot prices. Farside’s September 30 table for ETH spot fund holdings shows net outflows of $59.6 million, with FETH, ETHE, and Grayscale’s mini fund all negative. That doesn’t match the simplistic narrative that “mild inflation means you must buy ETH right away,” but it also can’t prove that fund outflows were caused by PCE alone.
How has the market reacted? When I wrote this, Binance ETH/USDT was around 2681.51, with a 24-hour rolling high of 2738.51 and a low of 2665.00—and it still hasn’t reclaimed the upper band. Binance Square’s #USCorePCEEasesTo3%InAugust is a hot-board item directly related to this topic, but the title’s “down to 3%” doesn’t mean the Federal Reserve has decided to cut rates. My key levels are defense around 2665, a short-term reclaim at 2700, and the prior high around 2738. If price holds 2700 and then breaks back above 2738, and if subsequent fund creations/redemptions improve, then I would cautiously revise upward. If it breaks below 2665, I’ll temporarily cancel the bounce assumption. Especially, you can’t treat the 24-hour rolling percentage change as an independent reaction after data release—that would blur the time window.
If it were me trading: I wouldn’t participate now; I’m only preparing to go long on unleveraged spot. Only if the one-hour closing price holds above 2700, then retests 2690 to 2700 without breaking, and the exchange deposits/withdrawals are confirmed normal, would I put in at most 0.4% of total capital. First target: 2725 (take half off). Second target: 2738 to 2750 (scale out in batches). Entering, a hard stop-loss at 2672. Even if the stop isn’t hit, if two consecutive one-hour closes reclaim, then I exit if price is back below 2690. If it breaks below 2665 before triggering, the entire plan is void—I won’t add to average down. Both macro data and fund data could be revised; what you can truly control is position sizing and exit conditions—not speculation about central bank remarks or a single day’s net flow.
Data sources: U.S. BEA August personal income and spending release, Farside ETH ETF daily table on September 30, Binance ETH/USDT price action and Binance Square hot board. The data represent different times and market contexts, and do not support a single-cause attribution.
#USCorePCEEasesTo3%InAugust #ETH
The above is only my personal market observation and does not constitute investment advice.
Core PCE YoY at 3.0% | Real consumption up 0.6% QoQ | ETH around 2680—wait first
My stance is to stand by: inflation readings are relatively mild, so you can’t jump straight to “easing is already settled”; consumption still shows resilience, so you also can’t label this data as an economic downturn. The U.S. Bureau of Economic Analysis’ personal income and spending report released on September 30 (for August) is very clear: the core PCE price index excluding food and energy rose 3.0% year over year and 0.2% month over month; real personal consumption expenditures increased 0.6% month over month, and nominal consumer spending increased 0.9% month over month. Here, 3.0% is the year-over-year price growth, while 0.6% is the month-over-month change in consumption volume adjusted for prices—different measures, so you can’t subtract them to derive some so-called “real interest rate.”
How does this affect ETH? The market prices risk assets through future policy interest rates, U.S. Treasury yields, and dollar liquidity. Easing price pressure may reduce discount-rate concerns, but stronger-than-expected consumption also implies demand hasn’t cooled meaningfully, so the central bank may not be willing to give an immediately sustainable easing commitment. For an asset like ETH, which is influenced simultaneously by macro liquidity, ETF creations/redemptions, and on-chain demand, the macro direction is only one line. I’d rather see confirmation from both capital flows and spot prices. Farside’s September 30 table for ETH spot fund holdings shows net outflows of $59.6 million, with FETH, ETHE, and Grayscale’s mini fund all negative. That doesn’t match the simplistic narrative that “mild inflation means you must buy ETH right away,” but it also can’t prove that fund outflows were caused by PCE alone.
How has the market reacted? When I wrote this, Binance ETH/USDT was around 2681.51, with a 24-hour rolling high of 2738.51 and a low of 2665.00—and it still hasn’t reclaimed the upper band. Binance Square’s #USCorePCEEasesTo3%InAugust is a hot-board item directly related to this topic, but the title’s “down to 3%” doesn’t mean the Federal Reserve has decided to cut rates. My key levels are defense around 2665, a short-term reclaim at 2700, and the prior high around 2738. If price holds 2700 and then breaks back above 2738, and if subsequent fund creations/redemptions improve, then I would cautiously revise upward. If it breaks below 2665, I’ll temporarily cancel the bounce assumption. Especially, you can’t treat the 24-hour rolling percentage change as an independent reaction after data release—that would blur the time window.
If it were me trading: I wouldn’t participate now; I’m only preparing to go long on unleveraged spot. Only if the one-hour closing price holds above 2700, then retests 2690 to 2700 without breaking, and the exchange deposits/withdrawals are confirmed normal, would I put in at most 0.4% of total capital. First target: 2725 (take half off). Second target: 2738 to 2750 (scale out in batches). Entering, a hard stop-loss at 2672. Even if the stop isn’t hit, if two consecutive one-hour closes reclaim, then I exit if price is back below 2690. If it breaks below 2665 before triggering, the entire plan is void—I won’t add to average down. Both macro data and fund data could be revised; what you can truly control is position sizing and exit conditions—not speculation about central bank remarks or a single day’s net flow.
Data sources: U.S. BEA August personal income and spending release, Farside ETH ETF daily table on September 30, Binance ETH/USDT price action and Binance Square hot board. The data represent different times and market contexts, and do not support a single-cause attribution.
#USCorePCEEasesTo3%InAugust #ETH
The above is only my personal market observation and does not constitute investment advice.
My stance is to stand by: inflation readings are relatively mild, so you can’t jump straight to “easing is already settled”; consumption still shows resilience, so you also can’t label this data as an economic downturn. The U.S. Bureau of Economic Analysis’ personal income and spending report released on September 30 (for August) is very clear: the core PCE price index excluding food and energy rose 3.0% year over year and 0.2% month over month; real personal consumption expenditures increased 0.6% month over month, and nominal consumer spending increased 0.9% month over month. Here, 3.0% is the year-over-year price growth, while 0.6% is the month-over-month change in consumption volume adjusted for prices—different measures, so you can’t subtract them to derive some so-called “real interest rate.”
How does this affect ETH? The market prices risk assets through future policy interest rates, U.S. Treasury yields, and dollar liquidity. Easing price pressure may reduce discount-rate concerns, but stronger-than-expected consumption also implies demand hasn’t cooled meaningfully, so the central bank may not be willing to give an immediately sustainable easing commitment. For an asset like ETH, which is influenced simultaneously by macro liquidity, ETF creations/redemptions, and on-chain demand, the macro direction is only one line. I’d rather see confirmation from both capital flows and spot prices. Farside’s September 30 table for ETH spot fund holdings shows net outflows of $59.6 million, with FETH, ETHE, and Grayscale’s mini fund all negative. That doesn’t match the simplistic narrative that “mild inflation means you must buy ETH right away,” but it also can’t prove that fund outflows were caused by PCE alone.
How has the market reacted? When I wrote this, Binance ETH/USDT was around 2681.51, with a 24-hour rolling high of 2738.51 and a low of 2665.00—and it still hasn’t reclaimed the upper band. Binance Square’s #USCorePCEEasesTo3%InAugust is a hot-board item directly related to this topic, but the title’s “down to 3%” doesn’t mean the Federal Reserve has decided to cut rates. My key levels are defense around 2665, a short-term reclaim at 2700, and the prior high around 2738. If price holds 2700 and then breaks back above 2738, and if subsequent fund creations/redemptions improve, then I would cautiously revise upward. If it breaks below 2665, I’ll temporarily cancel the bounce assumption. Especially, you can’t treat the 24-hour rolling percentage change as an independent reaction after data release—that would blur the time window.
If it were me trading: I wouldn’t participate now; I’m only preparing to go long on unleveraged spot. Only if the one-hour closing price holds above 2700, then retests 2690 to 2700 without breaking, and the exchange deposits/withdrawals are confirmed normal, would I put in at most 0.4% of total capital. First target: 2725 (take half off). Second target: 2738 to 2750 (scale out in batches). Entering, a hard stop-loss at 2672. Even if the stop isn’t hit, if two consecutive one-hour closes reclaim, then I exit if price is back below 2690. If it breaks below 2665 before triggering, the entire plan is void—I won’t add to average down. Both macro data and fund data could be revised; what you can truly control is position sizing and exit conditions—not speculation about central bank remarks or a single day’s net flow.
Data sources: U.S. BEA August personal income and spending release, Farside ETH ETF daily table on September 30, Binance ETH/USDT price action and Binance Square hot board. The data represent different times and market contexts, and do not support a single-cause attribution.
#USCorePCEEasesTo3%InAugust #ETH
The above is only my personal market observation and does not constitute investment advice.

123

·
--
Based on the latest search results, the U.S. core personal consumption expenditures (PCE) price index fell from 3.6% in July to 3% in August, the largest decline since March 2021. This data suggests that U.S. inflation pressures have eased somewhat, though they remain at elevated levels. At its September meeting, the Federal Reserve had predicted that inflation would fall back to its 2% target by year-end, but this decline in the PCE data may require longer observation to confirm that the trend will persist. In addition, the year-over-year growth rate of the core PCE index is still at a high 5.3%, indicating that the process of peak inflation giving way to decline is still a long one. Overall, August’s data gives the market a brief moment of breathing room, but the economic outlook still needs to be watched closely. #USCorePCEEasesTo3%InAugust
Based on the latest search results, the U.S. core personal consumption expenditures (PCE) price index fell from 3.6% in July to 3% in August, the largest decline since March 2021. This data suggests that U.S. inflation pressures have eased somewhat, though they remain at elevated levels. At its September meeting, the Federal Reserve had predicted that inflation would fall back to its 2% target by year-end, but this decline in the PCE data may require longer observation to confirm that the trend will persist. In addition, the year-over-year growth rate of the core PCE index is still at a high 5.3%, indicating that the process of peak inflation giving way to decline is still a long one. Overall, August’s data gives the market a brief moment of breathing room, but the economic outlook still needs to be watched closely. #USCorePCEEasesTo3%InAugust
11
·
--
Core PCE cooling remains a hot topic|ZEC’s privacy feature is not an inflation hedge|Around 1427 I’ll wait for now
My attitude is cautious and watchful. I won’t slap a “safe-haven asset” label on ZEC just because inflation data is better than some expectations. Binance Square#USCorePCEEasesTo3%InAugust is still trending. The U.S. Bureau of Economic Analysis reported that August’s core PCE year-on-year is about 3.0%—an inflation gauge that excludes food and energy. It can influence rate expectations and market risk appetite, but by itself it does not say that crypto assets have received new policy support. There are still jobs, subsequent inflation, and officials’ judgments between the inflation prints and the Fed’s actual decisions; you can’t write the data release as if rate cuts have already been made.
Why does this relate to ZEC? Privacy-coin trading still relies on market liquidity. If funds increase risk exposure because rate expectations improve, some high-volatility coins may get bought along the way. However, ZEC’s privacy functionality is an on-chain transaction design, not a guarantee of purchasing power in USD, and it won’t automatically generate cash flow when inflation falls. Mixing up “privacy demand” with “macroeconomic hedging” will underestimate ZEC’s exchange availability, liquidity, and regulatory risks. My take is just an analysis of transmission mechanisms—I’m not claiming that institutions have already bought ZEC due to PCE.
The current price also reminds me to control the pace. When I was drafting, Binance’s ZECUSDT was around $1427.27, up about 0.81% in 24 hours, ranging from $1381 to $1494.52. The price is still above the lower end of the range, but it has clearly fallen back from the intraday high. This suggests that macro tailwinds have not turned into an uninterrupted one-way trend. In the same period, Farside’s table of ZEC-related funds still hasn’t provided complete fund-by-fund flow for September 30. The automatically displayed total zero value on the page can’t be explained away as “institutions aren’t trading.” ZEC fund units, spot coin prices, and real on-chain usage are three different indicators—you can’t casually substitute one for another.
I’d rather use price and information together to verify. If around 1450 it repeatedly meets resistance, then chasing price on the short term isn’t worth it. If it breaks above 1495, you still need trading volume and sustained follow-through to count as a true renewed challenge to the highs. Below, around 1380, is a near-term defensive level. If that level is lost, you can’t keep using the old PCE narrative to find an excuse for the decline. If later U.S. data pushes yields higher again, or fund disclosures show that capital is not being passed along, or if trading channels face new restrictions, my cautious assessment will be strengthened. Conversely, only if real inflows arrive and price stabilizes and holds above 1495 will the current wait-and-see view be overturned.
If I were trading for myself, I wouldn’t participate now—and I wouldn’t short impulsively just because it pulled back. Only if ZEC’s one-hour closing price is above $1495, then it pulls back and holds, with clear spot trading volume, would I consider using up to 3% of total capital to add longs in batches. First target: 1530; second target: 1580. If it reaches 1530, I’d cut the position in half; the remaining position’s stop-loss would be raised to the cost basis. My initial stop-loss would be set below the pullback low, keeping the maximum loss per trade at 0.3% of total capital. If price breaks below 1380 first, or if macro facts and capital evidence overturn the premise, I would cancel the plan and immediately close any existing position. If the conditions aren’t triggered, I’ll only record observations and won’t repackage waiting as execution or profit. #USCorePCEEasesTo3%InAugust #ZEC
The above is purely my personal market observations and does not constitute investment advice.
Core PCE cooling remains a hot topic|ZEC’s privacy feature is not an inflation hedge|Around 1427 I’ll wait for now
My attitude is cautious and watchful. I won’t slap a “safe-haven asset” label on ZEC just because inflation data is better than some expectations. Binance Square#USCorePCEEasesTo3%InAugust is still trending. The U.S. Bureau of Economic Analysis reported that August’s core PCE year-on-year is about 3.0%—an inflation gauge that excludes food and energy. It can influence rate expectations and market risk appetite, but by itself it does not say that crypto assets have received new policy support. There are still jobs, subsequent inflation, and officials’ judgments between the inflation prints and the Fed’s actual decisions; you can’t write the data release as if rate cuts have already been made.
Why does this relate to ZEC? Privacy-coin trading still relies on market liquidity. If funds increase risk exposure because rate expectations improve, some high-volatility coins may get bought along the way. However, ZEC’s privacy functionality is an on-chain transaction design, not a guarantee of purchasing power in USD, and it won’t automatically generate cash flow when inflation falls. Mixing up “privacy demand” with “macroeconomic hedging” will underestimate ZEC’s exchange availability, liquidity, and regulatory risks. My take is just an analysis of transmission mechanisms—I’m not claiming that institutions have already bought ZEC due to PCE.
The current price also reminds me to control the pace. When I was drafting, Binance’s ZECUSDT was around $1427.27, up about 0.81% in 24 hours, ranging from $1381 to $1494.52. The price is still above the lower end of the range, but it has clearly fallen back from the intraday high. This suggests that macro tailwinds have not turned into an uninterrupted one-way trend. In the same period, Farside’s table of ZEC-related funds still hasn’t provided complete fund-by-fund flow for September 30. The automatically displayed total zero value on the page can’t be explained away as “institutions aren’t trading.” ZEC fund units, spot coin prices, and real on-chain usage are three different indicators—you can’t casually substitute one for another.
I’d rather use price and information together to verify. If around 1450 it repeatedly meets resistance, then chasing price on the short term isn’t worth it. If it breaks above 1495, you still need trading volume and sustained follow-through to count as a true renewed challenge to the highs. Below, around 1380, is a near-term defensive level. If that level is lost, you can’t keep using the old PCE narrative to find an excuse for the decline. If later U.S. data pushes yields higher again, or fund disclosures show that capital is not being passed along, or if trading channels face new restrictions, my cautious assessment will be strengthened. Conversely, only if real inflows arrive and price stabilizes and holds above 1495 will the current wait-and-see view be overturned.
If I were trading for myself, I wouldn’t participate now—and I wouldn’t short impulsively just because it pulled back. Only if ZEC’s one-hour closing price is above $1495, then it pulls back and holds, with clear spot trading volume, would I consider using up to 3% of total capital to add longs in batches. First target: 1530; second target: 1580. If it reaches 1530, I’d cut the position in half; the remaining position’s stop-loss would be raised to the cost basis. My initial stop-loss would be set below the pullback low, keeping the maximum loss per trade at 0.3% of total capital. If price breaks below 1380 first, or if macro facts and capital evidence overturn the premise, I would cancel the plan and immediately close any existing position. If the conditions aren’t triggered, I’ll only record observations and won’t repackage waiting as execution or profit. #USCorePCEEasesTo3%InAugust #ZEC
The above is purely my personal market observations and does not constitute investment advice.
My attitude is cautious and watchful. I won’t slap a “safe-haven asset” label on ZEC just because inflation data is better than some expectations. Binance Square#USCorePCEEasesTo3%InAugust is still trending. The U.S. Bureau of Economic Analysis reported that August’s core PCE year-on-year is about 3.0%—an inflation gauge that excludes food and energy. It can influence rate expectations and market risk appetite, but by itself it does not say that crypto assets have received new policy support. There are still jobs, subsequent inflation, and officials’ judgments between the inflation prints and the Fed’s actual decisions; you can’t write the data release as if rate cuts have already been made.
Why does this relate to ZEC? Privacy-coin trading still relies on market liquidity. If funds increase risk exposure because rate expectations improve, some high-volatility coins may get bought along the way. However, ZEC’s privacy functionality is an on-chain transaction design, not a guarantee of purchasing power in USD, and it won’t automatically generate cash flow when inflation falls. Mixing up “privacy demand” with “macroeconomic hedging” will underestimate ZEC’s exchange availability, liquidity, and regulatory risks. My take is just an analysis of transmission mechanisms—I’m not claiming that institutions have already bought ZEC due to PCE.
The current price also reminds me to control the pace. When I was drafting, Binance’s ZECUSDT was around $1427.27, up about 0.81% in 24 hours, ranging from $1381 to $1494.52. The price is still above the lower end of the range, but it has clearly fallen back from the intraday high. This suggests that macro tailwinds have not turned into an uninterrupted one-way trend. In the same period, Farside’s table of ZEC-related funds still hasn’t provided complete fund-by-fund flow for September 30. The automatically displayed total zero value on the page can’t be explained away as “institutions aren’t trading.” ZEC fund units, spot coin prices, and real on-chain usage are three different indicators—you can’t casually substitute one for another.
I’d rather use price and information together to verify. If around 1450 it repeatedly meets resistance, then chasing price on the short term isn’t worth it. If it breaks above 1495, you still need trading volume and sustained follow-through to count as a true renewed challenge to the highs. Below, around 1380, is a near-term defensive level. If that level is lost, you can’t keep using the old PCE narrative to find an excuse for the decline. If later U.S. data pushes yields higher again, or fund disclosures show that capital is not being passed along, or if trading channels face new restrictions, my cautious assessment will be strengthened. Conversely, only if real inflows arrive and price stabilizes and holds above 1495 will the current wait-and-see view be overturned.
If I were trading for myself, I wouldn’t participate now—and I wouldn’t short impulsively just because it pulled back. Only if ZEC’s one-hour closing price is above $1495, then it pulls back and holds, with clear spot trading volume, would I consider using up to 3% of total capital to add longs in batches. First target: 1530; second target: 1580. If it reaches 1530, I’d cut the position in half; the remaining position’s stop-loss would be raised to the cost basis. My initial stop-loss would be set below the pullback low, keeping the maximum loss per trade at 0.3% of total capital. If price breaks below 1380 first, or if macro facts and capital evidence overturn the premise, I would cancel the plan and immediately close any existing position. If the conditions aren’t triggered, I’ll only record observations and won’t repackage waiting as execution or profit. #USCorePCEEasesTo3%InAugust #ZEC
The above is purely my personal market observations and does not constitute investment advice.

40
·
--
U.S. core PCE returns to 3% and tops the hot list|SOL slips back near $118|I’m only waiting for a second confirmation
My stance is cautious and mostly on the sidelines: improved inflation data can ease worries about interest rates, but it’s not enough to prove that SOL has returned to a one-way uptrend. The market is discussing #USCorePCEEasesTo3%InAugust. That tag refers to the U.S. August year-over-year decline of the core personal consumption expenditures price index to 3%, not to the Fed cutting rates, nor to Solana receiving fresh funding. In the official data the U.S. Bureau of Economic Analysis released on September 30, core PCE rose 0.2% month over month and 3% year over year; overall PCE remains at 3.4% year over year, while real consumer spending increased 0.6% month over month. Writing “core slowdown” as “inflation completely disappears” misses the other half of the reality: overall prices and demand still show resilience.
This affects the crypto market path: first, traders adjust expectations for future policy interest rates and dollar liquidity; then that flows through to the valuation of risk assets. SOL typically depends more on risk appetite than BTC does, so volatility could be amplified. But policy isn’t automatically decided by a single month’s data. The Fed’s official decision on September 16 raised the target range for the federal funds rate to 3.75%–4%; tonight has no new rate decision. Even ADP’s report on 90,000 new private jobs in September can’t replace October 2’s official Nonfarm Payrolls—those two data sets’ demand signals still need to be compared.
The market has shown a “pump first, then pull back,” not a straight-line confirmation. When I was observing, Binance SOL/USDT was around $118.32, with a 24-hour high of $122.83 and a low of $117.36. My previous observation was around $121, and it has already retreated back near $118. Here, we can only say the price changed at different observation timestamps; we can’t attribute the entire pullback to PCE or the employment report alone. In Farside’s SOL fund table, the September 30 field is still incomplete, and we also can’t treat blanks as net outflow or net inflow. More useful is whether subsequent price action can regain and hold above 120 and 122.8, and whether fund disclosures form consistent directional evidence.
If I were trading myself, I wouldn’t participate. My direction would only consider a small-spot long position, without chasing with high leverage. Only if SOL reclaims $120 and holds during the next pullback, and if BTC does not simultaneously break down and lose intraday support, would I place a test trade of 3% of total funds. If it then breaks above $122.8, I’d set the target first at $125: trim one-third around $121.8, trim another one-third near $125, and use a moving take-profit for the rest. After entry, if it breaks below $117.3, I’d cut the position and close at a stop loss without trying to “make up” the loss. If it never returns to $120, the plan won’t trigger and I’ll stay in cash. If official employment is stronger than expected and interest-rate expectations move the other way higher, or if after SOL falls below $117.3 it can’t reclaim, then this bullish observation thesis is invalidated—I’d exit everything and reassess. The above is only my personal market observation and does not constitute investment advice.
U.S. core PCE returns to 3% and tops the hot list|SOL slips back near $118|I’m only waiting for a second confirmation
My stance is cautious and mostly on the sidelines: improved inflation data can ease worries about interest rates, but it’s not enough to prove that SOL has returned to a one-way uptrend. The market is discussing #USCorePCEEasesTo3%InAugust. That tag refers to the U.S. August year-over-year decline of the core personal consumption expenditures price index to 3%, not to the Fed cutting rates, nor to Solana receiving fresh funding. In the official data the U.S. Bureau of Economic Analysis released on September 30, core PCE rose 0.2% month over month and 3% year over year; overall PCE remains at 3.4% year over year, while real consumer spending increased 0.6% month over month. Writing “core slowdown” as “inflation completely disappears” misses the other half of the reality: overall prices and demand still show resilience.
This affects the crypto market path: first, traders adjust expectations for future policy interest rates and dollar liquidity; then that flows through to the valuation of risk assets. SOL typically depends more on risk appetite than BTC does, so volatility could be amplified. But policy isn’t automatically decided by a single month’s data. The Fed’s official decision on September 16 raised the target range for the federal funds rate to 3.75%–4%; tonight has no new rate decision. Even ADP’s report on 90,000 new private jobs in September can’t replace October 2’s official Nonfarm Payrolls—those two data sets’ demand signals still need to be compared.
The market has shown a “pump first, then pull back,” not a straight-line confirmation. When I was observing, Binance SOL/USDT was around $118.32, with a 24-hour high of $122.83 and a low of $117.36. My previous observation was around $121, and it has already retreated back near $118. Here, we can only say the price changed at different observation timestamps; we can’t attribute the entire pullback to PCE or the employment report alone. In Farside’s SOL fund table, the September 30 field is still incomplete, and we also can’t treat blanks as net outflow or net inflow. More useful is whether subsequent price action can regain and hold above 120 and 122.8, and whether fund disclosures form consistent directional evidence.
If I were trading myself, I wouldn’t participate. My direction would only consider a small-spot long position, without chasing with high leverage. Only if SOL reclaims $120 and holds during the next pullback, and if BTC does not simultaneously break down and lose intraday support, would I place a test trade of 3% of total funds. If it then breaks above $122.8, I’d set the target first at $125: trim one-third around $121.8, trim another one-third near $125, and use a moving take-profit for the rest. After entry, if it breaks below $117.3, I’d cut the position and close at a stop loss without trying to “make up” the loss. If it never returns to $120, the plan won’t trigger and I’ll stay in cash. If official employment is stronger than expected and interest-rate expectations move the other way higher, or if after SOL falls below $117.3 it can’t reclaim, then this bullish observation thesis is invalidated—I’d exit everything and reassess. The above is only my personal market observation and does not constitute investment advice.
My stance is cautious and mostly on the sidelines: improved inflation data can ease worries about interest rates, but it’s not enough to prove that SOL has returned to a one-way uptrend. The market is discussing #USCorePCEEasesTo3%InAugust. That tag refers to the U.S. August year-over-year decline of the core personal consumption expenditures price index to 3%, not to the Fed cutting rates, nor to Solana receiving fresh funding. In the official data the U.S. Bureau of Economic Analysis released on September 30, core PCE rose 0.2% month over month and 3% year over year; overall PCE remains at 3.4% year over year, while real consumer spending increased 0.6% month over month. Writing “core slowdown” as “inflation completely disappears” misses the other half of the reality: overall prices and demand still show resilience.
This affects the crypto market path: first, traders adjust expectations for future policy interest rates and dollar liquidity; then that flows through to the valuation of risk assets. SOL typically depends more on risk appetite than BTC does, so volatility could be amplified. But policy isn’t automatically decided by a single month’s data. The Fed’s official decision on September 16 raised the target range for the federal funds rate to 3.75%–4%; tonight has no new rate decision. Even ADP’s report on 90,000 new private jobs in September can’t replace October 2’s official Nonfarm Payrolls—those two data sets’ demand signals still need to be compared.
The market has shown a “pump first, then pull back,” not a straight-line confirmation. When I was observing, Binance SOL/USDT was around $118.32, with a 24-hour high of $122.83 and a low of $117.36. My previous observation was around $121, and it has already retreated back near $118. Here, we can only say the price changed at different observation timestamps; we can’t attribute the entire pullback to PCE or the employment report alone. In Farside’s SOL fund table, the September 30 field is still incomplete, and we also can’t treat blanks as net outflow or net inflow. More useful is whether subsequent price action can regain and hold above 120 and 122.8, and whether fund disclosures form consistent directional evidence.
If I were trading myself, I wouldn’t participate. My direction would only consider a small-spot long position, without chasing with high leverage. Only if SOL reclaims $120 and holds during the next pullback, and if BTC does not simultaneously break down and lose intraday support, would I place a test trade of 3% of total funds. If it then breaks above $122.8, I’d set the target first at $125: trim one-third around $121.8, trim another one-third near $125, and use a moving take-profit for the rest. After entry, if it breaks below $117.3, I’d cut the position and close at a stop loss without trying to “make up” the loss. If it never returns to $120, the plan won’t trigger and I’ll stay in cash. If official employment is stronger than expected and interest-rate expectations move the other way higher, or if after SOL falls below $117.3 it can’t reclaim, then this bullish observation thesis is invalidated—I’d exit everything and reassess. The above is only my personal market observation and does not constitute investment advice.

112
·
--
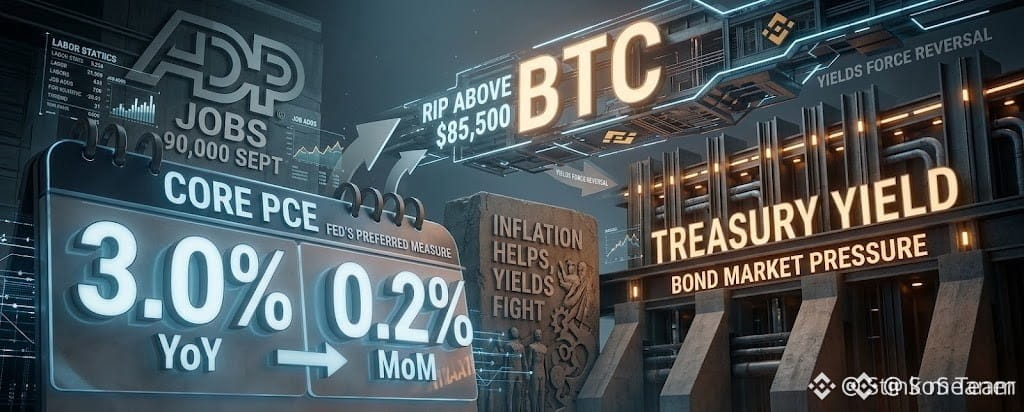
Everyone thinks weak employment data like the US ADP adding only 90,000 jobs is an instant green light for a market-wide rally, but actually, a cooling labor market is a double-edged sword that traps impatient traders.
Most people rush to buy the moment macro news drops, only to watch liquidity dry up and their positions bleed when the market realizes economic slowdowns can quickly trigger risk-off behavior.
Think of macroeconomic reports like the thermostat in a house. When job growth cools down, central banks are pressured to cut interest rates to warm things up, which seems promising for yield protocols like $ENA or lending markets like $AAVE. However, if the room cools too fast, market participants get cautious and park their capital safely in $USDT instead of buying into speculative momentum.
The first reaction on your charts is usually just algorithmic noise shaking out overleveraged traders before a sustainable direction forms. Until the broader market confirms whether this labor cooling is a manageable soft landing or the start of deeper contraction, chasing sudden green candles usually leads to painful drawdowns.
How are you adjusting your spot positions after today's jobs release?
#USADPAdds90000JobsInSeptember #USCorePCEEasesTo3
Everyone thinks weak employment data like the US ADP adding only 90,000 jobs is an instant green light for a market-wide rally, but actually, a cooling labor market is a double-edged sword that traps impatient traders.
Most people rush to buy the moment macro news drops, only to watch liquidity dry up and their positions bleed when the market realizes economic slowdowns can quickly trigger risk-off behavior.
Think of macroeconomic reports like the thermostat in a house. When job growth cools down, central banks are pressured to cut interest rates to warm things up, which seems promising for yield protocols like $ENA or lending markets like $AAVE . However, if the room cools too fast, market participants get cautious and park their capital safely in $USDT instead of buying into speculative momentum.
The first reaction on your charts is usually just algorithmic noise shaking out overleveraged traders before a sustainable direction forms. Until the broader market confirms whether this labor cooling is a manageable soft landing or the start of deeper contraction, chasing sudden green candles usually leads to painful drawdowns.
How are you adjusting your spot positions after today's jobs release?
#USADPAdds90000JobsInSeptember #USCorePCEEasesTo3
Most people rush to buy the moment macro news drops, only to watch liquidity dry up and their positions bleed when the market realizes economic slowdowns can quickly trigger risk-off behavior.
Think of macroeconomic reports like the thermostat in a house. When job growth cools down, central banks are pressured to cut interest rates to warm things up, which seems promising for yield protocols like $ENA or lending markets like $AAVE . However, if the room cools too fast, market participants get cautious and park their capital safely in $USDT instead of buying into speculative momentum.
The first reaction on your charts is usually just algorithmic noise shaking out overleveraged traders before a sustainable direction forms. Until the broader market confirms whether this labor cooling is a manageable soft landing or the start of deeper contraction, chasing sudden green candles usually leads to painful drawdowns.
How are you adjusting your spot positions after today's jobs release?
#USADPAdds90000JobsInSeptember #USCorePCEEasesTo3
273
·
--
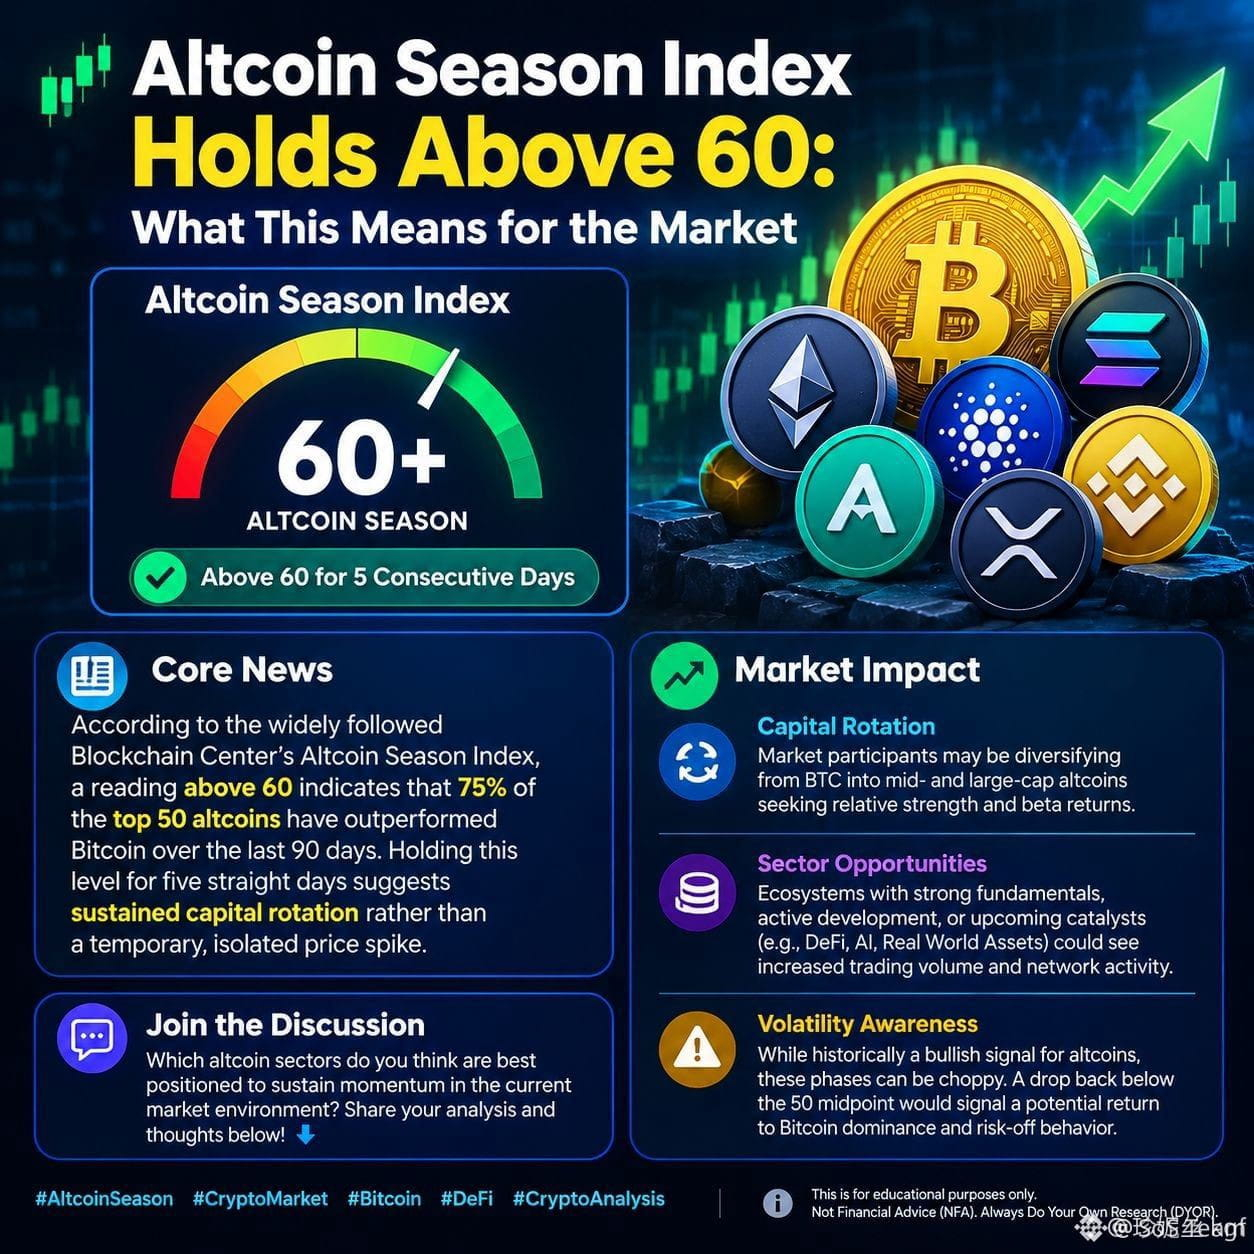
Everyone thinks an extended altseason index reading means it is time to buy every green candle in sight, but actually it is the exact period where most retail traders quietly lose their initial capital. Watching your portfolio underperform while random low-caps multiply creates an unbearable urge to jump between moving coins, usually right before liquidity evaporates and traps your market orders at the top.
Think of market liquidity during these cycles like water pressure in an old house: when pressure builds up, it does not fill every faucet equally, but instead surges through specific pipes before draining fast. With sentiment sitting deep in greed territory, capital is rotating selectively into heavy hitters like $AAVE and DeFi yields like $ENA rather than lifting every project across the board. If you keep rotating out of patient positions just to chase whichever coin had its breakout yesterday, you are effectively paying an exit tax to smarter money.
The real danger right now is mistaking broad market metrics for an individual token guarantee. When index numbers hover above key thresholds, smart market participants use the high volume on assets like $XRP to systematically take profits, not to initiate risky new entries with oversized positions. Surviving these heated phases requires understanding that your cash reserves protect your edge just as much as your winning trades do.
How are you adjusting your profit-taking strategy during this current rotation?
#AltcoinSeasonIndexHoldsAbove60For5Days #BitcoinClears #USCorePCEEasesTo3
Everyone thinks an extended altseason index reading means it is time to buy every green candle in sight, but actually it is the exact period where most retail traders quietly lose their initial capital. Watching your portfolio underperform while random low-caps multiply creates an unbearable urge to jump between moving coins, usually right before liquidity evaporates and traps your market orders at the top.
Think of market liquidity during these cycles like water pressure in an old house: when pressure builds up, it does not fill every faucet equally, but instead surges through specific pipes before draining fast. With sentiment sitting deep in greed territory, capital is rotating selectively into heavy hitters like $AAVE and DeFi yields like $ENA rather than lifting every project across the board. If you keep rotating out of patient positions just to chase whichever coin had its breakout yesterday, you are effectively paying an exit tax to smarter money.
The real danger right now is mistaking broad market metrics for an individual token guarantee. When index numbers hover above key thresholds, smart market participants use the high volume on assets like $XRP to systematically take profits, not to initiate risky new entries with oversized positions. Surviving these heated phases requires understanding that your cash reserves protect your edge just as much as your winning trades do.
How are you adjusting your profit-taking strategy during this current rotation?
#AltcoinSeasonIndexHoldsAbove60For5Days #BitcoinClears #USCorePCEEasesTo3
Think of market liquidity during these cycles like water pressure in an old house: when pressure builds up, it does not fill every faucet equally, but instead surges through specific pipes before draining fast. With sentiment sitting deep in greed territory, capital is rotating selectively into heavy hitters like $AAVE and DeFi yields like $ENA rather than lifting every project across the board. If you keep rotating out of patient positions just to chase whichever coin had its breakout yesterday, you are effectively paying an exit tax to smarter money.
The real danger right now is mistaking broad market metrics for an individual token guarantee. When index numbers hover above key thresholds, smart market participants use the high volume on assets like $XRP to systematically take profits, not to initiate risky new entries with oversized positions. Surviving these heated phases requires understanding that your cash reserves protect your edge just as much as your winning trades do.
How are you adjusting your profit-taking strategy during this current rotation?
#AltcoinSeasonIndexHoldsAbove60For5Days #BitcoinClears #USCorePCEEasesTo3
51
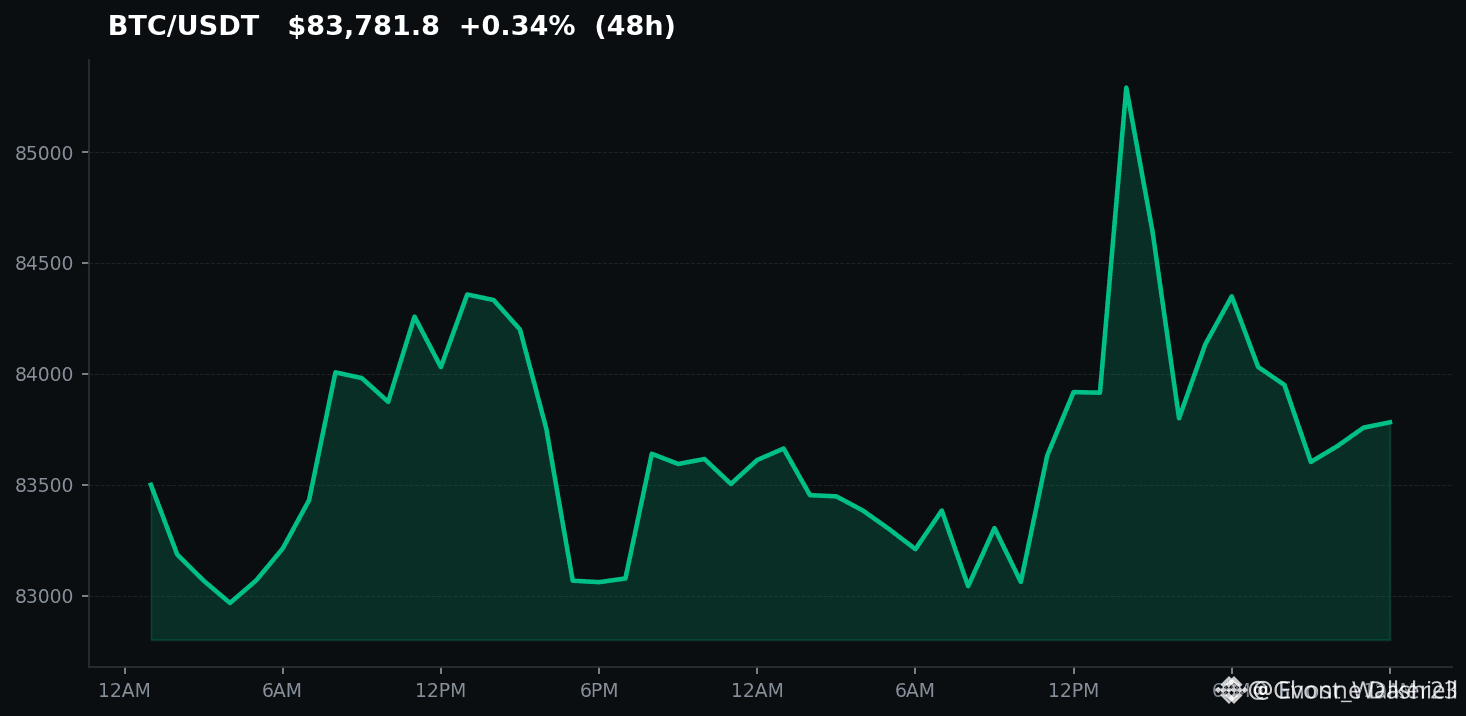
Here's what happened when Bitcoin cleared that last major resistance last week.
A lot of traders treated the breakout as the all-clear and piled in. Getting trapped on a fakeout after a "clear" is one of the more expensive lessons in this market, especially when greed is already elevated.
Most people saw $BTC poke through and assumed the next leg was underway. $XRP and $AAVE even ticked higher for a few hours. What they missed was the quality of the move. Follow-through volume was thin. It looked like genuine demand until you checked the order flow. This was mostly stops getting run in a market already sitting at 68 on the greed scale. We've watched this setup before. A clear without real bid depth often turns into a liquidity event rather than a trend change. The ones that fail tend to reverse quickly and leave the late longs holding the bag.
The risk from here is straightforward. If this was a bull trap, the next grab is usually below the level that just got "cleared." Positions sized as if the breakout must hold are the first to get hurt when it doesn't.
Anyone else watching whether this level actually sticks or if we're setting up for the reversal?
#BitcoinClears #AltcoinSeasonIndexHoldsAbove60For5Days #USCorePCEEasesTo3
Here's what happened when Bitcoin cleared that last major resistance last week.
A lot of traders treated the breakout as the all-clear and piled in. Getting trapped on a fakeout after a "clear" is one of the more expensive lessons in this market, especially when greed is already elevated.
Most people saw $BTC poke through and assumed the next leg was underway. $XRP and $AAVE even ticked higher for a few hours. What they missed was the quality of the move. Follow-through volume was thin. It looked like genuine demand until you checked the order flow. This was mostly stops getting run in a market already sitting at 68 on the greed scale. We've watched this setup before. A clear without real bid depth often turns into a liquidity event rather than a trend change. The ones that fail tend to reverse quickly and leave the late longs holding the bag.
The risk from here is straightforward. If this was a bull trap, the next grab is usually below the level that just got "cleared." Positions sized as if the breakout must hold are the first to get hurt when it doesn't.
Anyone else watching whether this level actually sticks or if we're setting up for the reversal?
#BitcoinClears #AltcoinSeasonIndexHoldsAbove60For5Days #USCorePCEEasesTo3
A lot of traders treated the breakout as the all-clear and piled in. Getting trapped on a fakeout after a "clear" is one of the more expensive lessons in this market, especially when greed is already elevated.
Most people saw $BTC poke through and assumed the next leg was underway. $XRP and $AAVE even ticked higher for a few hours. What they missed was the quality of the move. Follow-through volume was thin. It looked like genuine demand until you checked the order flow. This was mostly stops getting run in a market already sitting at 68 on the greed scale. We've watched this setup before. A clear without real bid depth often turns into a liquidity event rather than a trend change. The ones that fail tend to reverse quickly and leave the late longs holding the bag.
The risk from here is straightforward. If this was a bull trap, the next grab is usually below the level that just got "cleared." Positions sized as if the breakout must hold are the first to get hurt when it doesn't.
Anyone else watching whether this level actually sticks or if we're setting up for the reversal?
#BitcoinClears #AltcoinSeasonIndexHoldsAbove60For5Days #USCorePCEEasesTo3
22
Log in to explore more content
Join global crypto users on Binance Square
⚡️ Get latest and useful information about crypto.
💬 Trusted by the world’s largest crypto exchange.
👍 Discover real insights from verified creators.
Email / Phone number
Trending Topics
1
#IMFApproves$139MDisbursementToElSalvador
0 views
0 Discussing
2
#AnthropicTargetsIPOAsSoonAsMidNovember
330 views
16 Discussing
3
#EtherGains70.9%InQ3
190,056 views
1,250 Discussing
4
#TreasuryLetsStatesFileStablecoinCertificationsEarly
12,956 views
95 Discussing
5
#US10YearYieldNears5.3%
165,909 views
1,204 Discussing
6
#DollarIndexHitsHighestSinceMay2025
51,755 views
668 Discussing
7
#USWeeklyJoblessClaimsFallTo197000
40,309 views
535 Discussing
8
#BitcoinETFsTake$6.34BillionInQ3
10,778 views
77 Discussing
9
#KoreaProposesTokenizingStocksAndBonds
78,153 views
849 Discussing
10
#MetaMaskExitsLidoValidatorsAfterSecurityIncident
178,845 views
1,580 Discussing