

#bitcoinclears
bitcoinclears
2,501 views
63 Discussing
Hot
Latest

Here's what happened when Bitcoin cleared that last major resistance last week.
A lot of traders treated the breakout as the all-clear and piled in. Getting trapped on a fakeout after a "clear" is one of the more expensive lessons in this market, especially when greed is already elevated.
Most people saw $BTC poke through and assumed the next leg was underway. $XRP and $AAVE even ticked higher for a few hours. What they missed was the quality of the move. Follow-through volume was thin. It looked like genuine demand until you checked the order flow. This was mostly stops getting run in a market already sitting at 68 on the greed scale. We've watched this setup before. A clear without real bid depth often turns into a liquidity event rather than a trend change. The ones that fail tend to reverse quickly and leave the late longs holding the bag.
The risk from here is straightforward. If this was a bull trap, the next grab is usually below the level that just got "cleared." Positions sized as if the breakout must hold are the first to get hurt when it doesn't.
Anyone else watching whether this level actually sticks or if we're setting up for the reversal?
#BitcoinClears #AltcoinSeasonIndexHoldsAbove60For5Days #USCorePCEEasesTo3
Here's what happened when Bitcoin cleared that last major resistance last week.
A lot of traders treated the breakout as the all-clear and piled in. Getting trapped on a fakeout after a "clear" is one of the more expensive lessons in this market, especially when greed is already elevated.
Most people saw $BTC poke through and assumed the next leg was underway. $XRP and $AAVE even ticked higher for a few hours. What they missed was the quality of the move. Follow-through volume was thin. It looked like genuine demand until you checked the order flow. This was mostly stops getting run in a market already sitting at 68 on the greed scale. We've watched this setup before. A clear without real bid depth often turns into a liquidity event rather than a trend change. The ones that fail tend to reverse quickly and leave the late longs holding the bag.
The risk from here is straightforward. If this was a bull trap, the next grab is usually below the level that just got "cleared." Positions sized as if the breakout must hold are the first to get hurt when it doesn't.
Anyone else watching whether this level actually sticks or if we're setting up for the reversal?
#BitcoinClears #AltcoinSeasonIndexHoldsAbove60For5Days #USCorePCEEasesTo3
A lot of traders treated the breakout as the all-clear and piled in. Getting trapped on a fakeout after a "clear" is one of the more expensive lessons in this market, especially when greed is already elevated.
Most people saw $BTC poke through and assumed the next leg was underway. $XRP and $AAVE even ticked higher for a few hours. What they missed was the quality of the move. Follow-through volume was thin. It looked like genuine demand until you checked the order flow. This was mostly stops getting run in a market already sitting at 68 on the greed scale. We've watched this setup before. A clear without real bid depth often turns into a liquidity event rather than a trend change. The ones that fail tend to reverse quickly and leave the late longs holding the bag.
The risk from here is straightforward. If this was a bull trap, the next grab is usually below the level that just got "cleared." Positions sized as if the breakout must hold are the first to get hurt when it doesn't.
Anyone else watching whether this level actually sticks or if we're setting up for the reversal?
#BitcoinClears #AltcoinSeasonIndexHoldsAbove60For5Days #USCorePCEEasesTo3
23

·
--
Bitcoin has decisively cleared the $85,200 mark, signaling strong bullish momentum in the market. This significant price action suggests that current market sentiment is highly optimistic, potentially driven by increasing institutional adoption and positive macroeconomic factors. Investors are closely watching to see if this upward trend can be sustained, with many anticipating further gains. The ability of $BTC to hold above this new resistance level will be a key indicator of its future trajectory. This development highlights the dynamic nature of the cryptocurrency market and the potential for rapid price discovery.
Disclaimer: This content is for informational purposes only and does not constitute investment advice.
#BitcoinClears$85200
Bitcoin has decisively cleared the $85,200 mark, signaling strong bullish momentum in the market. This significant price action suggests that current market sentiment is highly optimistic, potentially driven by increasing institutional adoption and positive macroeconomic factors. Investors are closely watching to see if this upward trend can be sustained, with many anticipating further gains. The ability of $BTC to hold above this new resistance level will be a key indicator of its future trajectory. This development highlights the dynamic nature of the cryptocurrency market and the potential for rapid price discovery.
Disclaimer: This content is for informational purposes only and does not constitute investment advice.
#BitcoinClears$85200
Disclaimer: This content is for informational purposes only and does not constitute investment advice.
#BitcoinClears$85200

HarounD_77:
Goood Goood
HarounD_77
1097596652 ID
1
1
2
52

·
--
📰 Why did the buy side clear the BTC $118.21K sell wall? Does it mean bullish in the short term, or is there more going on?
Bitcoin buyers have cleared a massive sell order at $118.21K—an obstacle the market has been watching for a long time. This move may disrupt the current price balance and give the bulls a chance to launch a counterattack. For investors who have been hesitating around the $118.21K level, this is long-awaited good news.
Why is this news important?
The sell wall has been tormenting the bulls for a long time. It’s like a sword of Damocles hanging over their heads. The root cause may be that a large player (possibly a shorting institution or a hedging position) set a huge buy order at $118.21K with the aim of luring shorts with a small uptick. Now that the sell wall has been cleared, it likely means this short-lurer will either cut losses and exit or change tactics. More importantly, it releases suppressed bullish momentum. In the current market environment, clearing such a significant psychological resistance level is often not just a simple technical consolidation—it’s more like a contest of power.
Impact on the market
In the short term, this news will boost market sentiment and give BTC price momentum to rise. After $118.21K is broken, the next key resistance level is $118.21K. If this level can be held, it could trigger a larger upswing. However, it’s important to note whether this breakout can translate into sustained gains depends on subsequent capital inflows. Historically, similar events show that after a sell wall is cleared, the price tends to rise in the short run—but whether it forms a long-term trend still depends on changes in fundamentals and the macro environment. For example, in November 2022, when a sell wall near $18K was cleared, it did indeed trigger a short-term rebound, but the price ultimately stayed below $16K for months.
Trading ideas
💡 Bullish in the short term, but $118.21K is the key level to watch. If $118.21K holds, the price may move toward $118.21K or even $118.21K. If $118.21K breaks down, this bullish view is invalid. If expectations for Fed rate hikes come in above expectations, this view is also invalid.
This article is not sponsored by any project, and the author does not hold any of the assets mentioned
⚠️ Not investment advice; predictions are for reference only
$BTC $ETH #BTC #ETH
⚠️ Not investment advice
#BitcoinClears$85200
📰 Why did the buy side clear the BTC $118.21K sell wall? Does it mean bullish in the short term, or is there more going on?
Bitcoin buyers have cleared a massive sell order at $118.21K—an obstacle the market has been watching for a long time. This move may disrupt the current price balance and give the bulls a chance to launch a counterattack. For investors who have been hesitating around the $118.21K level, this is long-awaited good news.
Why is this news important?
The sell wall has been tormenting the bulls for a long time. It’s like a sword of Damocles hanging over their heads. The root cause may be that a large player (possibly a shorting institution or a hedging position) set a huge buy order at $118.21K with the aim of luring shorts with a small uptick. Now that the sell wall has been cleared, it likely means this short-lurer will either cut losses and exit or change tactics. More importantly, it releases suppressed bullish momentum. In the current market environment, clearing such a significant psychological resistance level is often not just a simple technical consolidation—it’s more like a contest of power.
Impact on the market
In the short term, this news will boost market sentiment and give BTC price momentum to rise. After $118.21K is broken, the next key resistance level is $118.21K. If this level can be held, it could trigger a larger upswing. However, it’s important to note whether this breakout can translate into sustained gains depends on subsequent capital inflows. Historically, similar events show that after a sell wall is cleared, the price tends to rise in the short run—but whether it forms a long-term trend still depends on changes in fundamentals and the macro environment. For example, in November 2022, when a sell wall near $18K was cleared, it did indeed trigger a short-term rebound, but the price ultimately stayed below $16K for months.
Trading ideas
💡 Bullish in the short term, but $118.21K is the key level to watch. If $118.21K holds, the price may move toward $118.21K or even $118.21K. If $118.21K breaks down, this bullish view is invalid. If expectations for Fed rate hikes come in above expectations, this view is also invalid.
This article is not sponsored by any project, and the author does not hold any of the assets mentioned
⚠️ Not investment advice; predictions are for reference only
$BTC $ETH #BTC #ETH
⚠️ Not investment advice
#BitcoinClears$85200
Bitcoin buyers have cleared a massive sell order at $118.21K—an obstacle the market has been watching for a long time. This move may disrupt the current price balance and give the bulls a chance to launch a counterattack. For investors who have been hesitating around the $118.21K level, this is long-awaited good news.
Why is this news important?
The sell wall has been tormenting the bulls for a long time. It’s like a sword of Damocles hanging over their heads. The root cause may be that a large player (possibly a shorting institution or a hedging position) set a huge buy order at $118.21K with the aim of luring shorts with a small uptick. Now that the sell wall has been cleared, it likely means this short-lurer will either cut losses and exit or change tactics. More importantly, it releases suppressed bullish momentum. In the current market environment, clearing such a significant psychological resistance level is often not just a simple technical consolidation—it’s more like a contest of power.
Impact on the market
In the short term, this news will boost market sentiment and give BTC price momentum to rise. After $118.21K is broken, the next key resistance level is $118.21K. If this level can be held, it could trigger a larger upswing. However, it’s important to note whether this breakout can translate into sustained gains depends on subsequent capital inflows. Historically, similar events show that after a sell wall is cleared, the price tends to rise in the short run—but whether it forms a long-term trend still depends on changes in fundamentals and the macro environment. For example, in November 2022, when a sell wall near $18K was cleared, it did indeed trigger a short-term rebound, but the price ultimately stayed below $16K for months.
Trading ideas
💡 Bullish in the short term, but $118.21K is the key level to watch. If $118.21K holds, the price may move toward $118.21K or even $118.21K. If $118.21K breaks down, this bullish view is invalid. If expectations for Fed rate hikes come in above expectations, this view is also invalid.
This article is not sponsored by any project, and the author does not hold any of the assets mentioned
⚠️ Not investment advice; predictions are for reference only
$BTC $ETH #BTC #ETH
⚠️ Not investment advice
#BitcoinClears$85200


198
Inflation cools more than expected; Bitcoin breaks through $85,000; digital assets see their strongest year-to-date inflows
1. Core PCE is far below expectations, and market sentiment turns sharply
According to the latest data released by the U.S. Department of Commerce, in August the core PCE price index rose only 3% year over year, significantly lower than the market expectation of 3.3%, marking the lowest level since February this year. After this data was released, the crypto market and U.S. stock index futures both strengthened in tandem. Bitcoin quickly broke above the $85,000 threshold, while Ethereum reclaimed the $2,700 level.
The upside surprise in the inflation print directly changed market expectations for the Fed’s policy path. CME’s federal funds rate futures show that the probability of a rate hike in October has narrowed to about 47%, down from the market’s prior consensus that the Fed would continue tightening monetary policy within the year. With rate-hike expectations cooling again and rate-cut expectations heating up, risk assets have become the biggest beneficiaries.
2. Large-scale short liquidations, with digital assets recording record inflows
On-chain data monitoring indicates that during this rebound, more than $255 million worth of short positions were forced to close, resulting in a notable adjustment to market leverage structure. Meanwhile, CoinShares’ latest report shows that last week global digital-asset investment products recorded net inflows of as much as $3.55 billion, setting a new one-week high since 2026. Among them, Bitcoin ETFs attracted $742.5 million within seven days, becoming the core force driving this rally.
That said, it is worth noting that Ethereum ETFs saw approximately $15 million of outflows on a single day, suggesting that spot-market demand has not fully caught up with the magnitude of the rebound seen in the futures market. This spot-versus-futures divergence is a signal investors should be wary of; investors should watch whether spot buyers can continue to step in.
3. Traditional finance accelerates its layout in the stablecoin track
Against a backdrop of improving macro conditions, traditional financial institutions are speeding up their entry into digital-asset infrastructure. HSBC has officially named the stablecoin it plans to launch as RedCoin. It intends to first roll out person-to-person transfer and merchant payment features in Hong Kong, and then gradually expand to enterprise and institutional application scenarios. This move signals that major global banks’ recognition of stablecoin infrastructure is rising rapidly.
At the same time, BNB Chain added 985,000 stablecoin holders over the past seven days, indicating strong growth momentum in its on-chain ecosystem. As stablecoins are a core infrastructure in the crypto market, rapid expansion of their user base often foreshadows larger-scale capital entering.
4. Tokenized assets and the RWA track continue to expand
In the tokenized U.S. stock domain, Ripple and Brazil’s largest investment bank, BTG Pactual, have reached a partnership to mirror a portion of investment fund share holdings on the XRP Ledger, directly entering Brazil’s asset-management market with a scale of 2.2 trillion reais. If this collaboration proceeds smoothly, it could later expand into a native issuance model, becoming an important milestone for RWA tokenization.
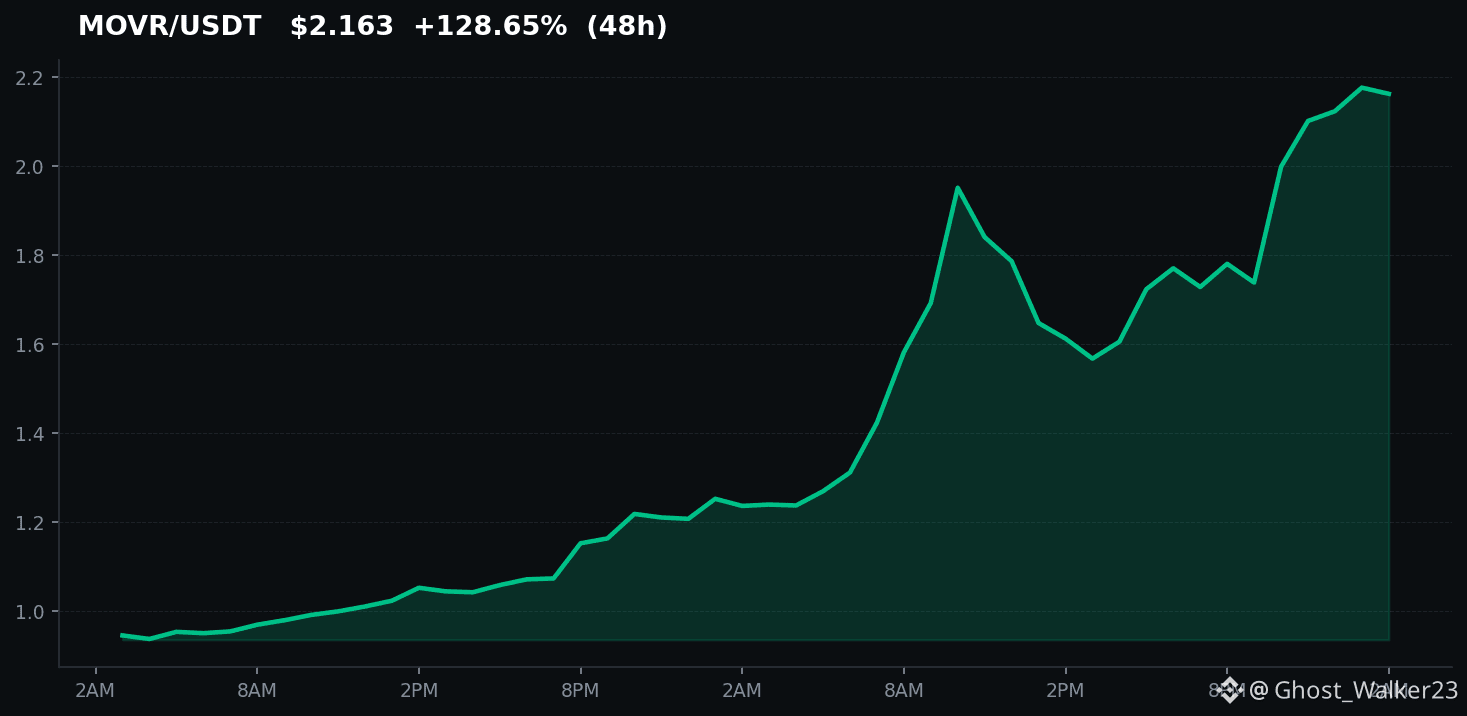
In addition, MOVR surged about 94% in a single day after completing its migration to the Base chain, with whale addresses’ holdings increasing by more than 11%. However, its RSI on an hourly basis has reached 84, placing it in an extremely overbought zone; chasing higher in the short term should be done cautiously.
5. Outlook for the road ahead and risk warnings
The market is currently in a window where multiple positive factors overlap: inflation cooling, record-breaking inflows, and traditional finance accelerating its layout. Together, these factors form strong support for further upside. However, investors still need to watch the following risks: first, on October 6, Hyperliquid will unlock approximately $856 million worth of HYPE tokens, which may bring short-term selling pressure; second, whether Bitcoin spot demand can continue to keep up with the rebound seen in the futures market—if the spot-futures divergence widens further, it could trigger a pullback; third, there remains uncertainty in the Fed’s subsequent statements—if employment data comes in stronger than expected, expectations for rate hikes may rise again.
Overall, market sentiment is bullish in the near term, but in terms of execution it is advisable to control position sizing, watch the gain or loss of key support levels, and avoid chasing prices blindly in overbought conditions.
#BitcoinClears$85200 #CFTCSubmitsTwoEventContractRulesToWhiteHouse # Tokenized U.S. stocks
Inflation cools more than expected; Bitcoin breaks through $85,000; digital assets see their strongest year-to-date inflows
1. Core PCE is far below expectations, and market sentiment turns sharply
According to the latest data released by the U.S. Department of Commerce, in August the core PCE price index rose only 3% year over year, significantly lower than the market expectation of 3.3%, marking the lowest level since February this year. After this data was released, the crypto market and U.S. stock index futures both strengthened in tandem. Bitcoin quickly broke above the $85,000 threshold, while Ethereum reclaimed the $2,700 level.
The upside surprise in the inflation print directly changed market expectations for the Fed’s policy path. CME’s federal funds rate futures show that the probability of a rate hike in October has narrowed to about 47%, down from the market’s prior consensus that the Fed would continue tightening monetary policy within the year. With rate-hike expectations cooling again and rate-cut expectations heating up, risk assets have become the biggest beneficiaries.
2. Large-scale short liquidations, with digital assets recording record inflows
On-chain data monitoring indicates that during this rebound, more than $255 million worth of short positions were forced to close, resulting in a notable adjustment to market leverage structure. Meanwhile, CoinShares’ latest report shows that last week global digital-asset investment products recorded net inflows of as much as $3.55 billion, setting a new one-week high since 2026. Among them, Bitcoin ETFs attracted $742.5 million within seven days, becoming the core force driving this rally.
That said, it is worth noting that Ethereum ETFs saw approximately $15 million of outflows on a single day, suggesting that spot-market demand has not fully caught up with the magnitude of the rebound seen in the futures market. This spot-versus-futures divergence is a signal investors should be wary of; investors should watch whether spot buyers can continue to step in.
3. Traditional finance accelerates its layout in the stablecoin track
Against a backdrop of improving macro conditions, traditional financial institutions are speeding up their entry into digital-asset infrastructure. HSBC has officially named the stablecoin it plans to launch as RedCoin. It intends to first roll out person-to-person transfer and merchant payment features in Hong Kong, and then gradually expand to enterprise and institutional application scenarios. This move signals that major global banks’ recognition of stablecoin infrastructure is rising rapidly.
At the same time, BNB Chain added 985,000 stablecoin holders over the past seven days, indicating strong growth momentum in its on-chain ecosystem. As stablecoins are a core infrastructure in the crypto market, rapid expansion of their user base often foreshadows larger-scale capital entering.
4. Tokenized assets and the RWA track continue to expand
In the tokenized U.S. stock domain, Ripple and Brazil’s largest investment bank, BTG Pactual, have reached a partnership to mirror a portion of investment fund share holdings on the XRP Ledger, directly entering Brazil’s asset-management market with a scale of 2.2 trillion reais. If this collaboration proceeds smoothly, it could later expand into a native issuance model, becoming an important milestone for RWA tokenization.
In addition, MOVR surged about 94% in a single day after completing its migration to the Base chain, with whale addresses’ holdings increasing by more than 11%. However, its RSI on an hourly basis has reached 84, placing it in an extremely overbought zone; chasing higher in the short term should be done cautiously.
5. Outlook for the road ahead and risk warnings
The market is currently in a window where multiple positive factors overlap: inflation cooling, record-breaking inflows, and traditional finance accelerating its layout. Together, these factors form strong support for further upside. However, investors still need to watch the following risks: first, on October 6, Hyperliquid will unlock approximately $856 million worth of HYPE tokens, which may bring short-term selling pressure; second, whether Bitcoin spot demand can continue to keep up with the rebound seen in the futures market—if the spot-futures divergence widens further, it could trigger a pullback; third, there remains uncertainty in the Fed’s subsequent statements—if employment data comes in stronger than expected, expectations for rate hikes may rise again.
Overall, market sentiment is bullish in the near term, but in terms of execution it is advisable to control position sizing, watch the gain or loss of key support levels, and avoid chasing prices blindly in overbought conditions.
#BitcoinClears$85200 #CFTCSubmitsTwoEventContractRulesToWhiteHouse # Tokenized U.S. stocks
1. Core PCE is far below expectations, and market sentiment turns sharply
According to the latest data released by the U.S. Department of Commerce, in August the core PCE price index rose only 3% year over year, significantly lower than the market expectation of 3.3%, marking the lowest level since February this year. After this data was released, the crypto market and U.S. stock index futures both strengthened in tandem. Bitcoin quickly broke above the $85,000 threshold, while Ethereum reclaimed the $2,700 level.
The upside surprise in the inflation print directly changed market expectations for the Fed’s policy path. CME’s federal funds rate futures show that the probability of a rate hike in October has narrowed to about 47%, down from the market’s prior consensus that the Fed would continue tightening monetary policy within the year. With rate-hike expectations cooling again and rate-cut expectations heating up, risk assets have become the biggest beneficiaries.
2. Large-scale short liquidations, with digital assets recording record inflows
On-chain data monitoring indicates that during this rebound, more than $255 million worth of short positions were forced to close, resulting in a notable adjustment to market leverage structure. Meanwhile, CoinShares’ latest report shows that last week global digital-asset investment products recorded net inflows of as much as $3.55 billion, setting a new one-week high since 2026. Among them, Bitcoin ETFs attracted $742.5 million within seven days, becoming the core force driving this rally.
That said, it is worth noting that Ethereum ETFs saw approximately $15 million of outflows on a single day, suggesting that spot-market demand has not fully caught up with the magnitude of the rebound seen in the futures market. This spot-versus-futures divergence is a signal investors should be wary of; investors should watch whether spot buyers can continue to step in.
3. Traditional finance accelerates its layout in the stablecoin track
Against a backdrop of improving macro conditions, traditional financial institutions are speeding up their entry into digital-asset infrastructure. HSBC has officially named the stablecoin it plans to launch as RedCoin. It intends to first roll out person-to-person transfer and merchant payment features in Hong Kong, and then gradually expand to enterprise and institutional application scenarios. This move signals that major global banks’ recognition of stablecoin infrastructure is rising rapidly.
At the same time, BNB Chain added 985,000 stablecoin holders over the past seven days, indicating strong growth momentum in its on-chain ecosystem. As stablecoins are a core infrastructure in the crypto market, rapid expansion of their user base often foreshadows larger-scale capital entering.
4. Tokenized assets and the RWA track continue to expand
In the tokenized U.S. stock domain, Ripple and Brazil’s largest investment bank, BTG Pactual, have reached a partnership to mirror a portion of investment fund share holdings on the XRP Ledger, directly entering Brazil’s asset-management market with a scale of 2.2 trillion reais. If this collaboration proceeds smoothly, it could later expand into a native issuance model, becoming an important milestone for RWA tokenization.
In addition, MOVR surged about 94% in a single day after completing its migration to the Base chain, with whale addresses’ holdings increasing by more than 11%. However, its RSI on an hourly basis has reached 84, placing it in an extremely overbought zone; chasing higher in the short term should be done cautiously.
5. Outlook for the road ahead and risk warnings
The market is currently in a window where multiple positive factors overlap: inflation cooling, record-breaking inflows, and traditional finance accelerating its layout. Together, these factors form strong support for further upside. However, investors still need to watch the following risks: first, on October 6, Hyperliquid will unlock approximately $856 million worth of HYPE tokens, which may bring short-term selling pressure; second, whether Bitcoin spot demand can continue to keep up with the rebound seen in the futures market—if the spot-futures divergence widens further, it could trigger a pullback; third, there remains uncertainty in the Fed’s subsequent statements—if employment data comes in stronger than expected, expectations for rate hikes may rise again.
Overall, market sentiment is bullish in the near term, but in terms of execution it is advisable to control position sizing, watch the gain or loss of key support levels, and avoid chasing prices blindly in overbought conditions.
#BitcoinClears$85200 #CFTCSubmitsTwoEventContractRulesToWhiteHouse # Tokenized U.S. stocks
36
·
--
Bitcoin’s price has successfully broken through the $85,200 mark in the latest wave of gains. This milestone signals a significant increase in market confidence in the asset. According to CoinMarketCap data, the breakout occurred in early December, when Bitcoin’s market cap exceeded $320 billion, up about 60% year to date. Meanwhile, trading volume also surged: on a day in December, daily trading volume topped $20 billion, the highest in nearly three months. Analysis suggests that the main factors supporting Bitcoin’s rise include changes in the global macroeconomic environment and ongoing inflows from institutional investors. For example, a Grayscale trust report shows that during the first three quarters of this year, funds flowing into its Bitcoin trusts exceeded $1 billion. In addition, data from cryptocurrency exchanges also indicates that demand for Bitcoin in the Asian market has increased significantly, especially with frequent trading activity in China and South Korea. Taken together, these data point to Bitcoin entering a new bullish cycle. #BitcoinClears$85200
#BTC $BTC
Bitcoin’s price has successfully broken through the $85,200 mark in the latest wave of gains. This milestone signals a significant increase in market confidence in the asset. According to CoinMarketCap data, the breakout occurred in early December, when Bitcoin’s market cap exceeded $320 billion, up about 60% year to date. Meanwhile, trading volume also surged: on a day in December, daily trading volume topped $20 billion, the highest in nearly three months. Analysis suggests that the main factors supporting Bitcoin’s rise include changes in the global macroeconomic environment and ongoing inflows from institutional investors. For example, a Grayscale trust report shows that during the first three quarters of this year, funds flowing into its Bitcoin trusts exceeded $1 billion. In addition, data from cryptocurrency exchanges also indicates that demand for Bitcoin in the Asian market has increased significantly, especially with frequent trading activity in China and South Korea. Taken together, these data point to Bitcoin entering a new bullish cycle. #BitcoinClears$85200
#BTC $BTC
#BTC $BTC
89

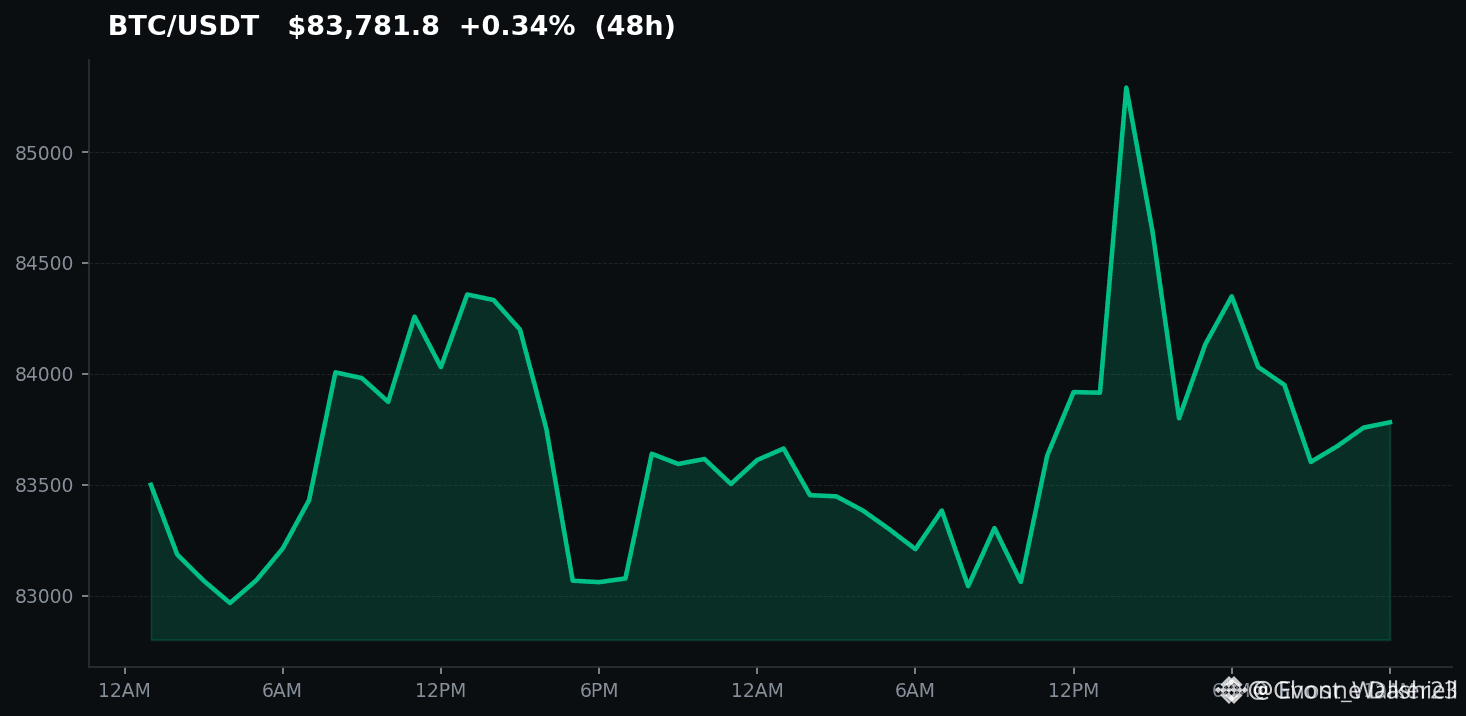
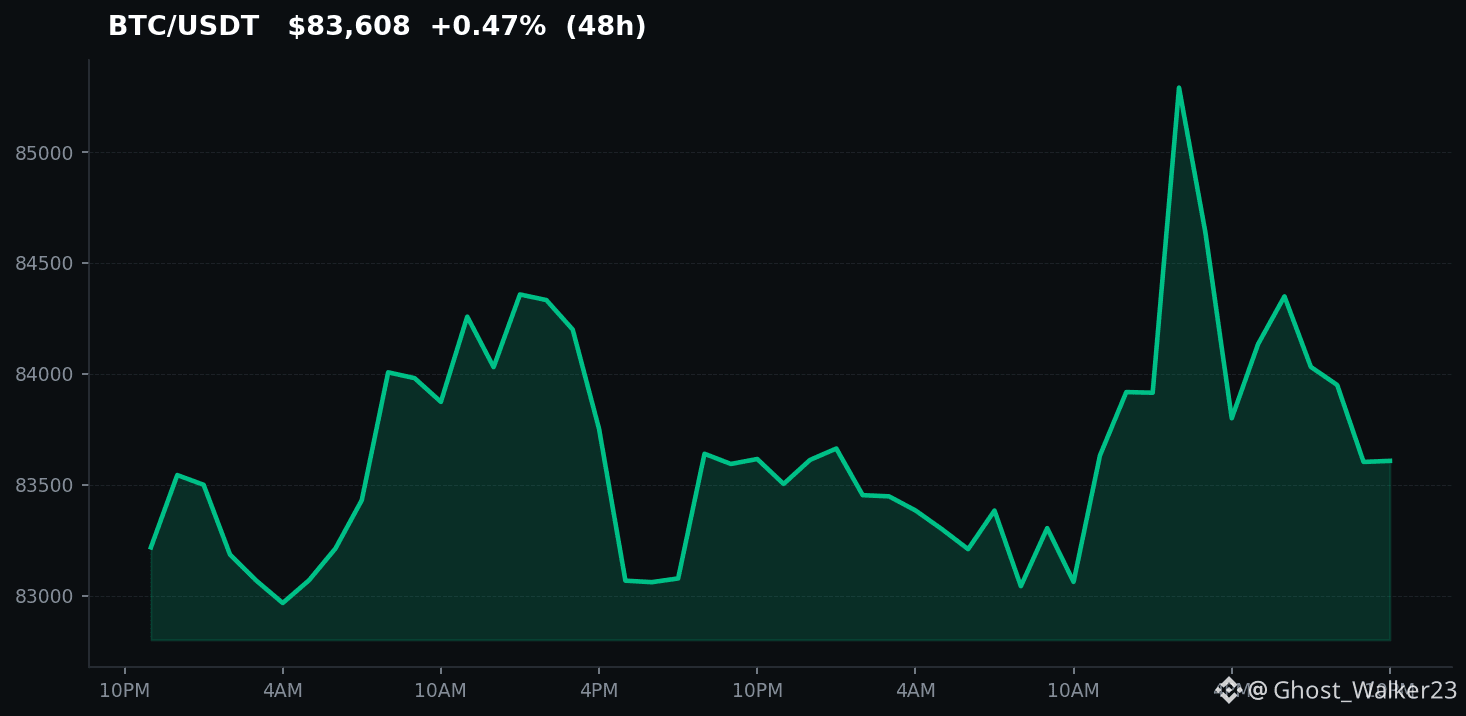
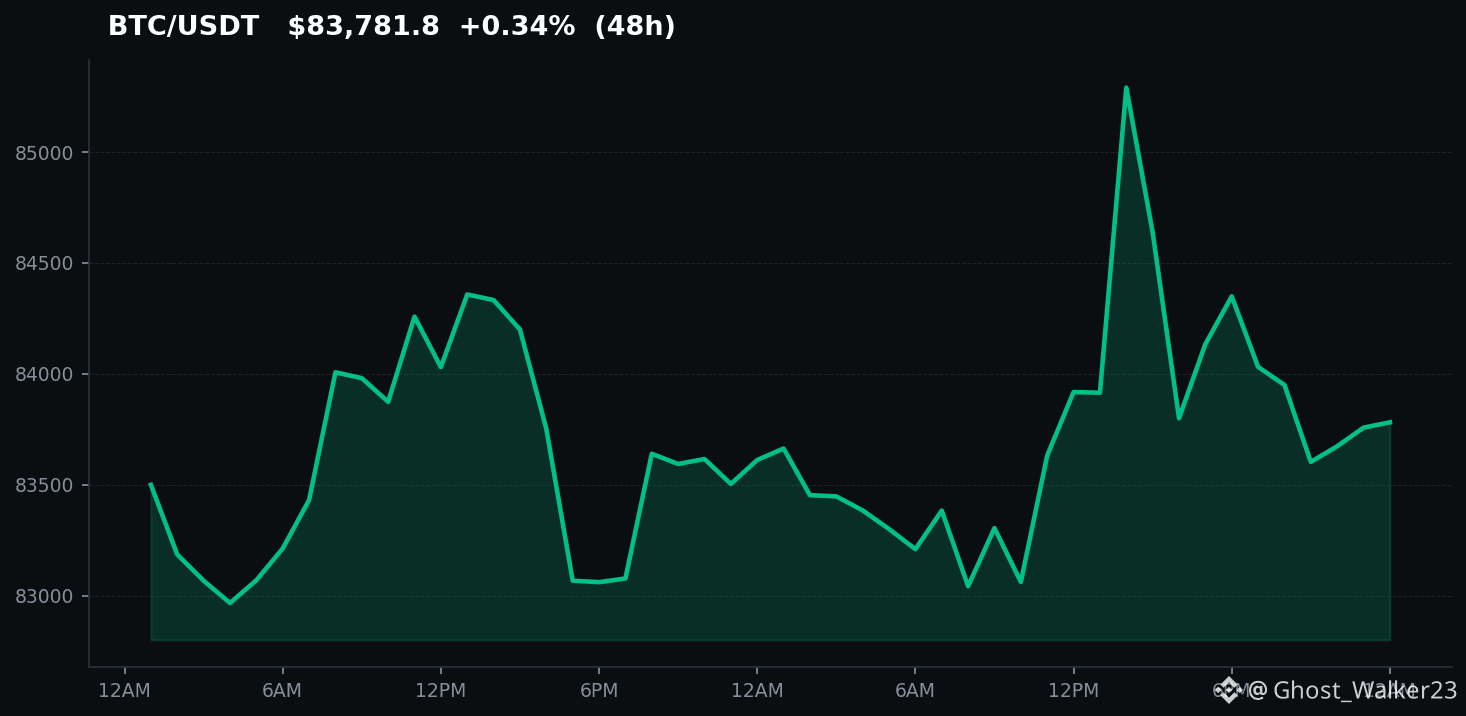
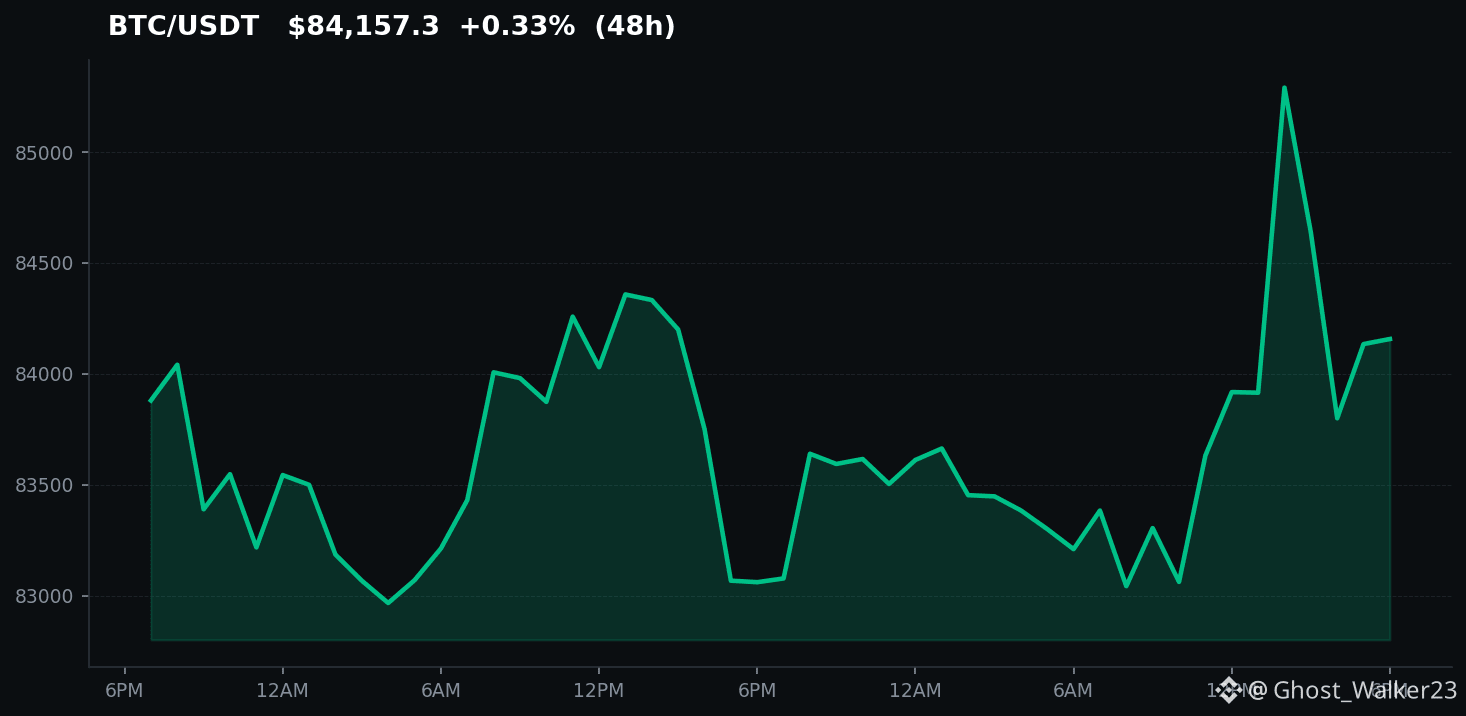
🚀 Exciting times as $BTC clears $85,200! This surge reflects growing market confidence amid bullish sentiment. As seen in the 48h chart below, while $ETH is down slightly, Bitcoin remains resilient. 🌟 Do you think this trend will continue? #BitcoinClears$85200 #cryptotrading
📈 Follow for more real-time market breakdowns!
🚀 Exciting times as $BTC clears $85,200! This surge reflects growing market confidence amid bullish sentiment. As seen in the 48h chart below, while $ETH is down slightly, Bitcoin remains resilient. 🌟 Do you think this trend will continue? #BitcoinClears$85200 #cryptotrading
📈 Follow for more real-time market breakdowns!
📈 Follow for more real-time market breakdowns!
18

·
--
Bitcoin Climb Above $85,200 Tops Trending List|Spot Returns Back Near $84,000|I Only Wait for a Second Confirmation
My stance is to wait first and not chase a single breakout. At the Binance Square Trending Topics right now, it lists #BitcoinClears$85200 at the top, but the topic name only reflects market discussion at a certain moment; it doesn’t guarantee that when you read the post, price is still above $85,200. When I checked Binance BTCUSDT spot, it was around $83,944; the 24-hour high was $85,649.95 and the low was $82,900, with the gain close to zero. In other words, price did indeed break through the topic level during the session, and then fell back below it. The key here isn’t to invent a nice story for up or down—it’s to acknowledge that the breakout hasn’t been verified by subsequent price action.
The fundamental information isn’t blank. The U.S. BEA officially released the August PCE today: the headline inflation index同比 is 3.4% and core is 3.0%; this affects market expectations for the rate path and the valuation of risk assets, but a single data point can’t directly prove that the Fed will definitely cut rates next time. Original data source: https://www.bea.gov/news/2026/personal-income-and-outlays-august-2026 . On the other hand, Farside’s summary shows that on September 29, U.S. spot Bitcoin ETFs had net inflows of about $66.2 million, with IBIT up about $51.1 million and BITB down about $18.1 million; the line for September 30 is still not fully disclosed, so you can’t treat empty fields as zero net inflows today. Fund data: https://farside.co.uk/btc/ . The subscription/redemption stats from the previous trading day also aren’t the same as current spot buy orders every minute.
When you look at these two types of information together, the conclusion isn’t “bullishness is ineffective,” but rather that the information is enough to explain why the market is willing to test the upper area, yet insufficient to prove that the upper level has become support. BTC fell back from the 24-hour high to around $84,000, which tells chase buyers that they need to see follow-through/holding, not use the already-completed surge as a substitute for future confirmation. In the short term, I’m watching the resistance zone of $85,200–$85,650, followed by $86,000; on the downside, first $84,000, then the intraday low at $82,900. If price reclaims $85,200 and continuously holds it, the cautious view can be adjusted; if it breaks below $82,900 and can’t quickly recover, then I won’t discuss upside continuation. Those levels are the current observation points—before executing, you need to re-check the price.
If this were my own trading, I wouldn’t participate myself. I would only consider a light spot long after confirmation, without high leverage. The entry trigger would be an hourly close above $85,650, followed by a pullback to and holding within the $85,200–$85,650 range, while also noting that the ETF’s same-day re-report does not show sustained, clearly continued net outflows. Use at most 3% of total capital, and pre-set the loss on any single trade to no more than 0.4% of total capital. The first target is $86,000; once reached, cut the position by half, then look for $87,500 and exit the remaining position in batches. If price falls back to $84,800, stop loss; or if two consecutive hourly candlesticks close below $85,200, close the position. If it first breaks below $82,900, I cancel this long plan—I won’t present an untriggered plan as if it has already been executed.
Hot topics are reminding us to watch volatility—discipline decides whether you should pay to participate.
#BitcoinClears$85200 #BTC
The above is only my personal market observations and does not constitute investment advice.
Bitcoin Climb Above $85,200 Tops Trending List|Spot Returns Back Near $84,000|I Only Wait for a Second Confirmation
My stance is to wait first and not chase a single breakout. At the Binance Square Trending Topics right now, it lists #BitcoinClears$85200 at the top, but the topic name only reflects market discussion at a certain moment; it doesn’t guarantee that when you read the post, price is still above $85,200. When I checked Binance BTCUSDT spot, it was around $83,944; the 24-hour high was $85,649.95 and the low was $82,900, with the gain close to zero. In other words, price did indeed break through the topic level during the session, and then fell back below it. The key here isn’t to invent a nice story for up or down—it’s to acknowledge that the breakout hasn’t been verified by subsequent price action.
The fundamental information isn’t blank. The U.S. BEA officially released the August PCE today: the headline inflation index同比 is 3.4% and core is 3.0%; this affects market expectations for the rate path and the valuation of risk assets, but a single data point can’t directly prove that the Fed will definitely cut rates next time. Original data source: https://www.bea.gov/news/2026/personal-income-and-outlays-august-2026 . On the other hand, Farside’s summary shows that on September 29, U.S. spot Bitcoin ETFs had net inflows of about $66.2 million, with IBIT up about $51.1 million and BITB down about $18.1 million; the line for September 30 is still not fully disclosed, so you can’t treat empty fields as zero net inflows today. Fund data: https://farside.co.uk/btc/ . The subscription/redemption stats from the previous trading day also aren’t the same as current spot buy orders every minute.
When you look at these two types of information together, the conclusion isn’t “bullishness is ineffective,” but rather that the information is enough to explain why the market is willing to test the upper area, yet insufficient to prove that the upper level has become support. BTC fell back from the 24-hour high to around $84,000, which tells chase buyers that they need to see follow-through/holding, not use the already-completed surge as a substitute for future confirmation. In the short term, I’m watching the resistance zone of $85,200–$85,650, followed by $86,000; on the downside, first $84,000, then the intraday low at $82,900. If price reclaims $85,200 and continuously holds it, the cautious view can be adjusted; if it breaks below $82,900 and can’t quickly recover, then I won’t discuss upside continuation. Those levels are the current observation points—before executing, you need to re-check the price.
If this were my own trading, I wouldn’t participate myself. I would only consider a light spot long after confirmation, without high leverage. The entry trigger would be an hourly close above $85,650, followed by a pullback to and holding within the $85,200–$85,650 range, while also noting that the ETF’s same-day re-report does not show sustained, clearly continued net outflows. Use at most 3% of total capital, and pre-set the loss on any single trade to no more than 0.4% of total capital. The first target is $86,000; once reached, cut the position by half, then look for $87,500 and exit the remaining position in batches. If price falls back to $84,800, stop loss; or if two consecutive hourly candlesticks close below $85,200, close the position. If it first breaks below $82,900, I cancel this long plan—I won’t present an untriggered plan as if it has already been executed.
Hot topics are reminding us to watch volatility—discipline decides whether you should pay to participate.
#BitcoinClears$85200 #BTC
The above is only my personal market observations and does not constitute investment advice.
My stance is to wait first and not chase a single breakout. At the Binance Square Trending Topics right now, it lists #BitcoinClears$85200 at the top, but the topic name only reflects market discussion at a certain moment; it doesn’t guarantee that when you read the post, price is still above $85,200. When I checked Binance BTCUSDT spot, it was around $83,944; the 24-hour high was $85,649.95 and the low was $82,900, with the gain close to zero. In other words, price did indeed break through the topic level during the session, and then fell back below it. The key here isn’t to invent a nice story for up or down—it’s to acknowledge that the breakout hasn’t been verified by subsequent price action.
The fundamental information isn’t blank. The U.S. BEA officially released the August PCE today: the headline inflation index同比 is 3.4% and core is 3.0%; this affects market expectations for the rate path and the valuation of risk assets, but a single data point can’t directly prove that the Fed will definitely cut rates next time. Original data source: https://www.bea.gov/news/2026/personal-income-and-outlays-august-2026 . On the other hand, Farside’s summary shows that on September 29, U.S. spot Bitcoin ETFs had net inflows of about $66.2 million, with IBIT up about $51.1 million and BITB down about $18.1 million; the line for September 30 is still not fully disclosed, so you can’t treat empty fields as zero net inflows today. Fund data: https://farside.co.uk/btc/ . The subscription/redemption stats from the previous trading day also aren’t the same as current spot buy orders every minute.
When you look at these two types of information together, the conclusion isn’t “bullishness is ineffective,” but rather that the information is enough to explain why the market is willing to test the upper area, yet insufficient to prove that the upper level has become support. BTC fell back from the 24-hour high to around $84,000, which tells chase buyers that they need to see follow-through/holding, not use the already-completed surge as a substitute for future confirmation. In the short term, I’m watching the resistance zone of $85,200–$85,650, followed by $86,000; on the downside, first $84,000, then the intraday low at $82,900. If price reclaims $85,200 and continuously holds it, the cautious view can be adjusted; if it breaks below $82,900 and can’t quickly recover, then I won’t discuss upside continuation. Those levels are the current observation points—before executing, you need to re-check the price.
If this were my own trading, I wouldn’t participate myself. I would only consider a light spot long after confirmation, without high leverage. The entry trigger would be an hourly close above $85,650, followed by a pullback to and holding within the $85,200–$85,650 range, while also noting that the ETF’s same-day re-report does not show sustained, clearly continued net outflows. Use at most 3% of total capital, and pre-set the loss on any single trade to no more than 0.4% of total capital. The first target is $86,000; once reached, cut the position by half, then look for $87,500 and exit the remaining position in batches. If price falls back to $84,800, stop loss; or if two consecutive hourly candlesticks close below $85,200, close the position. If it first breaks below $82,900, I cancel this long plan—I won’t present an untriggered plan as if it has already been executed.
Hot topics are reminding us to watch volatility—discipline decides whether you should pay to participate.
#BitcoinClears$85200 #BTC
The above is only my personal market observations and does not constitute investment advice.

1
192
Article
Market Wrap: $BTC Stalls as Gains Emerge in Altcoin SpaceToday’s market session closed with a slightly bearish mood as $BTC hovered at $83,646.10, reflecting a minor dip of 0.05%. Despite this slight downturn, market participants remain optimistic, particularly with the recent rally that saw $BTC clear the impressive mark of $85,200, trending with the hashtag #BitcoinClears$85200. Other major coins like $ETH and BNB exhibited resilience, with $ETH edging up by 0.29% to $2,686.49 and BNB rising by 1.39% to $769.45.
The day’s biggest movers were primarily altcoins, with MOVR leading the pack by skyrocketing 73.2%. This surge appears to have been driven by renewed interest in gaming and DeFi applications, which have attracted considerable investments this week. Other notable gainers included GLMR (+21.9%) and NIGHT (+21.1%), signaling a strong appetite for innovative projects within the ecosystem. The broader altcoin rally speaks to a market increasingly willing to diversify outside the major players.
Amidst this volatility, the trending narrative remains firmly attached to the big moment when $BTC crossed $85,200. This milestone has not only garnered attention from traders looking for potential breakout points but has also sparked discussions about the implications of such a leap for broader market sentiment. The community is abuzz with speculation regarding whether this upward momentum can be sustained in the coming sessions.
Looking ahead, traders and investors will be keenly watching how the market reacts to any potential regulatory news or economic data releases expected tomorrow. The resilient performance of altcoins suggests that there may still be room for bullish sentiment, even if $BTC's recent gains face some consolidation. As always, staying updated will be crucial in navigating the upcoming market fluctuations.
💬 Únete y síguenos, seguimos analizando el mercado por ti.
Market Wrap: $BTC Stalls as Gains Emerge in Altcoin Space
Today’s market session closed with a slightly bearish mood as $BTC hovered at $83,646.10, reflecting a minor dip of 0.05%. Despite this slight downturn, market participants remain optimistic, particularly with the recent rally that saw $BTC clear the impressive mark of $85,200, trending with the hashtag #BitcoinClears$85200. Other major coins like $ETH and BNB exhibited resilience, with $ETH edging up by 0.29% to $2,686.49 and BNB rising by 1.39% to $769.45.
The day’s biggest movers were primarily altcoins, with MOVR leading the pack by skyrocketing 73.2%. This surge appears to have been driven by renewed interest in gaming and DeFi applications, which have attracted considerable investments this week. Other notable gainers included GLMR (+21.9%) and NIGHT (+21.1%), signaling a strong appetite for innovative projects within the ecosystem. The broader altcoin rally speaks to a market increasingly willing to diversify outside the major players.
Amidst this volatility, the trending narrative remains firmly attached to the big moment when $BTC crossed $85,200. This milestone has not only garnered attention from traders looking for potential breakout points but has also sparked discussions about the implications of such a leap for broader market sentiment. The community is abuzz with speculation regarding whether this upward momentum can be sustained in the coming sessions.
Looking ahead, traders and investors will be keenly watching how the market reacts to any potential regulatory news or economic data releases expected tomorrow. The resilient performance of altcoins suggests that there may still be room for bullish sentiment, even if $BTC 's recent gains face some consolidation. As always, staying updated will be crucial in navigating the upcoming market fluctuations.
💬 Únete y síguenos, seguimos analizando el mercado por ti.
The day’s biggest movers were primarily altcoins, with MOVR leading the pack by skyrocketing 73.2%. This surge appears to have been driven by renewed interest in gaming and DeFi applications, which have attracted considerable investments this week. Other notable gainers included GLMR (+21.9%) and NIGHT (+21.1%), signaling a strong appetite for innovative projects within the ecosystem. The broader altcoin rally speaks to a market increasingly willing to diversify outside the major players.
Amidst this volatility, the trending narrative remains firmly attached to the big moment when $BTC crossed $85,200. This milestone has not only garnered attention from traders looking for potential breakout points but has also sparked discussions about the implications of such a leap for broader market sentiment. The community is abuzz with speculation regarding whether this upward momentum can be sustained in the coming sessions.
Looking ahead, traders and investors will be keenly watching how the market reacts to any potential regulatory news or economic data releases expected tomorrow. The resilient performance of altcoins suggests that there may still be room for bullish sentiment, even if $BTC 's recent gains face some consolidation. As always, staying updated will be crucial in navigating the upcoming market fluctuations.
💬 Únete y síguenos, seguimos analizando el mercado por ti.
96
🚀 Bitcoin just cleared $85,200, and it’s a game changer! This surge showcases strong market sentiment, especially as altcoins like Edel and Backpack are gaining momentum. Are we witnessing the start of a new bull run for $BTC? What’s your take? 🤔 #BitcoinClears$85200
👀 Síguenos para estar pendiente de las próximas oportunidades.
🚀 Bitcoin just cleared $85,200, and it’s a game changer! This surge showcases strong market sentiment, especially as altcoins like Edel and Backpack are gaining momentum. Are we witnessing the start of a new bull run for $BTC ? What’s your take? 🤔 #BitcoinClears$85200
👀 Síguenos para estar pendiente de las próximas oportunidades.
👀 Síguenos para estar pendiente de las próximas oportunidades.
9
🚀 Bitcoin just smashed through $85,200! This bullish momentum could signal a new wave of investors jumping in. With #QNT and other altcoins gaining, are we on the brink of a massive crypto rally? 💰 What do you think? #BitcoinClears$85200
$BTC
👀 Síguenos para estar pendiente de las próximas oportunidades.
🚀 Bitcoin just smashed through $85,200! This bullish momentum could signal a new wave of investors jumping in. With #QNT and other altcoins gaining, are we on the brink of a massive crypto rally? 💰 What do you think? #BitcoinClears$85200
$BTC
👀 Síguenos para estar pendiente de las próximas oportunidades.
$BTC
👀 Síguenos para estar pendiente de las próximas oportunidades.
4
·
--
BTC breaks 85,200 and stays on the hot list|Current price is back around 83,600|BNB at 765, I won’t chase
My stance is cautiously bullish, but I only accept conditional participation. Binance Square’s real-time hot list puts “Bitcoin breaks through $85,200” at the top; this refers to a price level that was surpassed during the day, not a level that still stands above now. When I wrote the piece, Binance spot BTC/USDT was about 83,604; over the past 24 hours, the high was about 85,650 and the low about 82,956. BNB/USDT was about 765.27, up about 1.22% over 24 hours, with a range roughly from 754.94 to 779.42. BTC has given back from its highs while BNB is still in positive territory—this is the kind of relative performance you can verify right now—but you still can’t conclude that institutional funds have already rotated from BTC to BNB based on just one day’s change, and you also can’t treat a hot-list headline as the real-time transaction price.
The macro backdrop also needs to be placed in the right context. On September 16, the Federal Reserve formally stated that its target range for the federal funds rate has been raised to 3.75%–4%, and it clearly noted that inflation remains elevated. Higher rates raise the opportunity cost of holding high-volatility assets. Whether Bitcoin can hold after breaking out often affects traders’ risk budget for exchange ecosystem assets like BNB. BNB’s applications, payments, and on-chain transactions may increase long-term demand, but these are frameworks for observation—not causal proof that “since BTC went up once, BNB must rise.” Binance Research recently discussed the differentiation between fund flows and the on-chain market, and its OTC monthly report also emphasized the importance of deal activity and actual fund flows. I care more about whether price can keep holding, and whether spot trading follows through—not just whether a single breakout screenshot exists.
For BNB today, I’m watching three conditions: First, can BTC regain and hold 85,200? If it keeps hovering around 83,600, the Square’s heat for BNB may weaken. Second, can BNB reclaim 770 and break above the 24-hour high at 779.4? Third, will the 24-hour low near 755 be effectively broken down? Above 770 is only the starting point for a return to strength, not permission to add positions unconditionally. If BTC tests back toward 82,950 and BNB breaks below 755, then the earlier cautious-bullish view is overturned.
If I were trading it myself, I would not participate and I would not chase intraday pump moves. I would only consider spot longs with low leverage, or even zero leverage. I’d use 2% of total capital only if BTC returns above 85,200 and stays there for a while, and after BNB breaks through 770 and then retraces without breaking. If BNB confirms the break at 779.4 and trading activity doesn’t clearly fade, then I’d add up to a maximum of 4%. The first target is around 779; once reached, I’ll cut one-third. The second target is around 790, and then I’ll cut another half. The remaining position would be protected by using the area near the entry price as the line. After the trial position, if BNB drops back below 762, I’ll stop out and close the position immediately. If BTC never gets back to 85,200, then even if BNB spikes temporarily, I won’t add—any existing position will be exited before that day’s close. The market offers conditions, not an order that you must act.
#BitcoinClears$85200 #BTC #BNB
The above is only my personal market observation and does not constitute investment advice.
BTC breaks 85,200 and stays on the hot list|Current price is back around 83,600|BNB at 765, I won’t chase
My stance is cautiously bullish, but I only accept conditional participation. Binance Square’s real-time hot list puts “Bitcoin breaks through $85,200” at the top; this refers to a price level that was surpassed during the day, not a level that still stands above now. When I wrote the piece, Binance spot BTC/USDT was about 83,604; over the past 24 hours, the high was about 85,650 and the low about 82,956. BNB/USDT was about 765.27, up about 1.22% over 24 hours, with a range roughly from 754.94 to 779.42. BTC has given back from its highs while BNB is still in positive territory—this is the kind of relative performance you can verify right now—but you still can’t conclude that institutional funds have already rotated from BTC to BNB based on just one day’s change, and you also can’t treat a hot-list headline as the real-time transaction price.
The macro backdrop also needs to be placed in the right context. On September 16, the Federal Reserve formally stated that its target range for the federal funds rate has been raised to 3.75%–4%, and it clearly noted that inflation remains elevated. Higher rates raise the opportunity cost of holding high-volatility assets. Whether Bitcoin can hold after breaking out often affects traders’ risk budget for exchange ecosystem assets like BNB. BNB’s applications, payments, and on-chain transactions may increase long-term demand, but these are frameworks for observation—not causal proof that “since BTC went up once, BNB must rise.” Binance Research recently discussed the differentiation between fund flows and the on-chain market, and its OTC monthly report also emphasized the importance of deal activity and actual fund flows. I care more about whether price can keep holding, and whether spot trading follows through—not just whether a single breakout screenshot exists.
For BNB today, I’m watching three conditions: First, can BTC regain and hold 85,200? If it keeps hovering around 83,600, the Square’s heat for BNB may weaken. Second, can BNB reclaim 770 and break above the 24-hour high at 779.4? Third, will the 24-hour low near 755 be effectively broken down? Above 770 is only the starting point for a return to strength, not permission to add positions unconditionally. If BTC tests back toward 82,950 and BNB breaks below 755, then the earlier cautious-bullish view is overturned.
If I were trading it myself, I would not participate and I would not chase intraday pump moves. I would only consider spot longs with low leverage, or even zero leverage. I’d use 2% of total capital only if BTC returns above 85,200 and stays there for a while, and after BNB breaks through 770 and then retraces without breaking. If BNB confirms the break at 779.4 and trading activity doesn’t clearly fade, then I’d add up to a maximum of 4%. The first target is around 779; once reached, I’ll cut one-third. The second target is around 790, and then I’ll cut another half. The remaining position would be protected by using the area near the entry price as the line. After the trial position, if BNB drops back below 762, I’ll stop out and close the position immediately. If BTC never gets back to 85,200, then even if BNB spikes temporarily, I won’t add—any existing position will be exited before that day’s close. The market offers conditions, not an order that you must act.
#BitcoinClears$85200 #BTC #BNB
The above is only my personal market observation and does not constitute investment advice.
My stance is cautiously bullish, but I only accept conditional participation. Binance Square’s real-time hot list puts “Bitcoin breaks through $85,200” at the top; this refers to a price level that was surpassed during the day, not a level that still stands above now. When I wrote the piece, Binance spot BTC/USDT was about 83,604; over the past 24 hours, the high was about 85,650 and the low about 82,956. BNB/USDT was about 765.27, up about 1.22% over 24 hours, with a range roughly from 754.94 to 779.42. BTC has given back from its highs while BNB is still in positive territory—this is the kind of relative performance you can verify right now—but you still can’t conclude that institutional funds have already rotated from BTC to BNB based on just one day’s change, and you also can’t treat a hot-list headline as the real-time transaction price.
The macro backdrop also needs to be placed in the right context. On September 16, the Federal Reserve formally stated that its target range for the federal funds rate has been raised to 3.75%–4%, and it clearly noted that inflation remains elevated. Higher rates raise the opportunity cost of holding high-volatility assets. Whether Bitcoin can hold after breaking out often affects traders’ risk budget for exchange ecosystem assets like BNB. BNB’s applications, payments, and on-chain transactions may increase long-term demand, but these are frameworks for observation—not causal proof that “since BTC went up once, BNB must rise.” Binance Research recently discussed the differentiation between fund flows and the on-chain market, and its OTC monthly report also emphasized the importance of deal activity and actual fund flows. I care more about whether price can keep holding, and whether spot trading follows through—not just whether a single breakout screenshot exists.
For BNB today, I’m watching three conditions: First, can BTC regain and hold 85,200? If it keeps hovering around 83,600, the Square’s heat for BNB may weaken. Second, can BNB reclaim 770 and break above the 24-hour high at 779.4? Third, will the 24-hour low near 755 be effectively broken down? Above 770 is only the starting point for a return to strength, not permission to add positions unconditionally. If BTC tests back toward 82,950 and BNB breaks below 755, then the earlier cautious-bullish view is overturned.
If I were trading it myself, I would not participate and I would not chase intraday pump moves. I would only consider spot longs with low leverage, or even zero leverage. I’d use 2% of total capital only if BTC returns above 85,200 and stays there for a while, and after BNB breaks through 770 and then retraces without breaking. If BNB confirms the break at 779.4 and trading activity doesn’t clearly fade, then I’d add up to a maximum of 4%. The first target is around 779; once reached, I’ll cut one-third. The second target is around 790, and then I’ll cut another half. The remaining position would be protected by using the area near the entry price as the line. After the trial position, if BNB drops back below 762, I’ll stop out and close the position immediately. If BTC never gets back to 85,200, then even if BNB spikes temporarily, I won’t add—any existing position will be exited before that day’s close. The market offers conditions, not an order that you must act.
#BitcoinClears$85200 #BTC #BNB
The above is only my personal market observation and does not constitute investment advice.

54
Inflation cools down while institutional funds flood in. The crypto market is entering its strongest week of September
1. The U.S. core PCE unexpectedly cools, and market sentiment rebounds sharply
In the last week of September, the U.S. Department of Commerce released the August core PCE price index data. The year-over-year increase fell to 3.0%, below the market’s 3.3% forecast, reaching the lowest level since February. The month-over-month figure was also mild, rising only 0.2%, far under the market expectation of 0.3%. This inflation report—below expectations—was interpreted by the market as a clear dovish signal, prompting traders to quickly raise their expectations that the Federal Reserve could pause rate hikes, or even cut rates.
After the data was released, Bitcoin surged rapidly and broke through the $85,200 mark. Ethereum also regained the $2,700 level. In total, the entire crypto market saw $255 million liquidated within 24 hours, putting enormous pressure on shorts. According to Binance Square, BTC was mentioned more than 4,000 times in the past 24 hours, with bullish sentiment overwhelmingly dominating—shorts accounted for less than 1%.
2. Record-setting inflows of institutional funds: digital assets see weekly net inflow of $3.55 billion
Meanwhile, CoinShares’ latest report shows that global digital asset investment products recorded a net inflow of $3.55 billion last week, the highest weekly figure this year. Of this, Bitcoin ETFs alone attracted $742.5 million over seven days. U.S. spot BTC ETFs also achieved consecutive days of net inflows, with the cumulative size reaching $3.1 billion. This data clearly indicates that institutional investors’ demand for allocating to crypto assets is still accelerating, and market liquidity is strengthening significantly.
From the heat ranking on Binance Square, SOL closely followed BTC with nearly 3,000 mentions, while BNB also received more than 2,500 discussions. Notably, BNB’s bullish-to-bearish ratio stands at 82:2, showing extremely strong community consensus. Although ETH’s mention count is slightly lower, its interaction volume exceeds 6,000 times, suggesting holders’ engagement enthusiasm remains high.
3. The stablecoin track welcomes traditional finance giants en masse
This week saw two landmark events in the stablecoin space. HSBC officially named the stablecoin it is preparing to launch as HSBC RedCoin. Initially, it will target Hong Kong’s point-to-point payments and merchant settlement use cases, and later expand to corporate and institutional applications. This marks an important step by a major traditional global bank into the Asia stablecoin market, directly challenging the current market share of dollar stablecoins.
On the other hand, Open USD issued by Bridge, a Stripe subsidiary, officially went live. The reserve assets are custodied by BlackRock, Lead Bank, and The Bank of New York Mellon. It supports platform integrations such as Mastercard, Stripe, and Visa, and has already been deployed on multiple chains including Base, Ethereum, and Solana. Coinbase will also complete integration on October 1. With these two events combined, they signal that the integration of traditional finance and the crypto ecosystem is moving into a more substantive phase.
4. Tokenized U.S. stocks and emerging ecosystems continue to expand
In the tokenized U.S. stocks space, several U.S. stock tokens—such as Moderna and Linde—are already trading on BSC and Ethereum. Investors can participate in U.S. stock investments via on-chain methods. Meanwhile, MOVR surged about 50% within 24 hours after completing its migration to the Base Layer 2 network. Trading volume peaked at over $18.7 million. Whale addresses’ holdings increased by more than 11%, with net inflows reaching $1.69 million.
In addition, Ripple announced it will collaborate with Brazil infrastructure operator CSD BR to mirror the shares of BTG Pactual’s Brazil investment fund on the XRP Ledger, directly entering Brazil’s financial market of 22 trillion Brazilian reais. Singapore’s crypto economy scaled up 55.4% year over year to $28.4 billion. Institutional platform activity surged even more—up 94%—showing strong growth momentum for the crypto ecosystem across the Asia-Pacific region.
5. Outlook for the future
Overall, the cooling of inflation has created room for the Federal Reserve to adjust its policy direction. The continued influx of institutional funds provides solid liquidity support for the market. At the same time, the accelerated positioning by major traditional financial players in stablecoins and tokenization is helping build a more mature infrastructure for the crypto market. Currently, the altcoin season index has stayed above 60 for five straight days, and market breadth is improving. However, investors still need to watch the non-farm employment data and speeches by Fed officials in early October; short-term volatility risks cannot be ignored.
#BitcoinClears$85200 #AltcoinSeasonIndexHoldsAbove60For5Days # Institutional entry accelerates
Inflation cools down while institutional funds flood in. The crypto market is entering its strongest week of September
1. The U.S. core PCE unexpectedly cools, and market sentiment rebounds sharply
In the last week of September, the U.S. Department of Commerce released the August core PCE price index data. The year-over-year increase fell to 3.0%, below the market’s 3.3% forecast, reaching the lowest level since February. The month-over-month figure was also mild, rising only 0.2%, far under the market expectation of 0.3%. This inflation report—below expectations—was interpreted by the market as a clear dovish signal, prompting traders to quickly raise their expectations that the Federal Reserve could pause rate hikes, or even cut rates.
After the data was released, Bitcoin surged rapidly and broke through the $85,200 mark. Ethereum also regained the $2,700 level. In total, the entire crypto market saw $255 million liquidated within 24 hours, putting enormous pressure on shorts. According to Binance Square, BTC was mentioned more than 4,000 times in the past 24 hours, with bullish sentiment overwhelmingly dominating—shorts accounted for less than 1%.
2. Record-setting inflows of institutional funds: digital assets see weekly net inflow of $3.55 billion
Meanwhile, CoinShares’ latest report shows that global digital asset investment products recorded a net inflow of $3.55 billion last week, the highest weekly figure this year. Of this, Bitcoin ETFs alone attracted $742.5 million over seven days. U.S. spot BTC ETFs also achieved consecutive days of net inflows, with the cumulative size reaching $3.1 billion. This data clearly indicates that institutional investors’ demand for allocating to crypto assets is still accelerating, and market liquidity is strengthening significantly.
From the heat ranking on Binance Square, SOL closely followed BTC with nearly 3,000 mentions, while BNB also received more than 2,500 discussions. Notably, BNB’s bullish-to-bearish ratio stands at 82:2, showing extremely strong community consensus. Although ETH’s mention count is slightly lower, its interaction volume exceeds 6,000 times, suggesting holders’ engagement enthusiasm remains high.
3. The stablecoin track welcomes traditional finance giants en masse
This week saw two landmark events in the stablecoin space. HSBC officially named the stablecoin it is preparing to launch as HSBC RedCoin. Initially, it will target Hong Kong’s point-to-point payments and merchant settlement use cases, and later expand to corporate and institutional applications. This marks an important step by a major traditional global bank into the Asia stablecoin market, directly challenging the current market share of dollar stablecoins.
On the other hand, Open USD issued by Bridge, a Stripe subsidiary, officially went live. The reserve assets are custodied by BlackRock, Lead Bank, and The Bank of New York Mellon. It supports platform integrations such as Mastercard, Stripe, and Visa, and has already been deployed on multiple chains including Base, Ethereum, and Solana. Coinbase will also complete integration on October 1. With these two events combined, they signal that the integration of traditional finance and the crypto ecosystem is moving into a more substantive phase.
4. Tokenized U.S. stocks and emerging ecosystems continue to expand
In the tokenized U.S. stocks space, several U.S. stock tokens—such as Moderna and Linde—are already trading on BSC and Ethereum. Investors can participate in U.S. stock investments via on-chain methods. Meanwhile, MOVR surged about 50% within 24 hours after completing its migration to the Base Layer 2 network. Trading volume peaked at over $18.7 million. Whale addresses’ holdings increased by more than 11%, with net inflows reaching $1.69 million.
In addition, Ripple announced it will collaborate with Brazil infrastructure operator CSD BR to mirror the shares of BTG Pactual’s Brazil investment fund on the XRP Ledger, directly entering Brazil’s financial market of 22 trillion Brazilian reais. Singapore’s crypto economy scaled up 55.4% year over year to $28.4 billion. Institutional platform activity surged even more—up 94%—showing strong growth momentum for the crypto ecosystem across the Asia-Pacific region.
5. Outlook for the future
Overall, the cooling of inflation has created room for the Federal Reserve to adjust its policy direction. The continued influx of institutional funds provides solid liquidity support for the market. At the same time, the accelerated positioning by major traditional financial players in stablecoins and tokenization is helping build a more mature infrastructure for the crypto market. Currently, the altcoin season index has stayed above 60 for five straight days, and market breadth is improving. However, investors still need to watch the non-farm employment data and speeches by Fed officials in early October; short-term volatility risks cannot be ignored.
#BitcoinClears$85200 #AltcoinSeasonIndexHoldsAbove60For5Days # Institutional entry accelerates
1. The U.S. core PCE unexpectedly cools, and market sentiment rebounds sharply
In the last week of September, the U.S. Department of Commerce released the August core PCE price index data. The year-over-year increase fell to 3.0%, below the market’s 3.3% forecast, reaching the lowest level since February. The month-over-month figure was also mild, rising only 0.2%, far under the market expectation of 0.3%. This inflation report—below expectations—was interpreted by the market as a clear dovish signal, prompting traders to quickly raise their expectations that the Federal Reserve could pause rate hikes, or even cut rates.
After the data was released, Bitcoin surged rapidly and broke through the $85,200 mark. Ethereum also regained the $2,700 level. In total, the entire crypto market saw $255 million liquidated within 24 hours, putting enormous pressure on shorts. According to Binance Square, BTC was mentioned more than 4,000 times in the past 24 hours, with bullish sentiment overwhelmingly dominating—shorts accounted for less than 1%.
2. Record-setting inflows of institutional funds: digital assets see weekly net inflow of $3.55 billion
Meanwhile, CoinShares’ latest report shows that global digital asset investment products recorded a net inflow of $3.55 billion last week, the highest weekly figure this year. Of this, Bitcoin ETFs alone attracted $742.5 million over seven days. U.S. spot BTC ETFs also achieved consecutive days of net inflows, with the cumulative size reaching $3.1 billion. This data clearly indicates that institutional investors’ demand for allocating to crypto assets is still accelerating, and market liquidity is strengthening significantly.
From the heat ranking on Binance Square, SOL closely followed BTC with nearly 3,000 mentions, while BNB also received more than 2,500 discussions. Notably, BNB’s bullish-to-bearish ratio stands at 82:2, showing extremely strong community consensus. Although ETH’s mention count is slightly lower, its interaction volume exceeds 6,000 times, suggesting holders’ engagement enthusiasm remains high.
3. The stablecoin track welcomes traditional finance giants en masse
This week saw two landmark events in the stablecoin space. HSBC officially named the stablecoin it is preparing to launch as HSBC RedCoin. Initially, it will target Hong Kong’s point-to-point payments and merchant settlement use cases, and later expand to corporate and institutional applications. This marks an important step by a major traditional global bank into the Asia stablecoin market, directly challenging the current market share of dollar stablecoins.
On the other hand, Open USD issued by Bridge, a Stripe subsidiary, officially went live. The reserve assets are custodied by BlackRock, Lead Bank, and The Bank of New York Mellon. It supports platform integrations such as Mastercard, Stripe, and Visa, and has already been deployed on multiple chains including Base, Ethereum, and Solana. Coinbase will also complete integration on October 1. With these two events combined, they signal that the integration of traditional finance and the crypto ecosystem is moving into a more substantive phase.
4. Tokenized U.S. stocks and emerging ecosystems continue to expand
In the tokenized U.S. stocks space, several U.S. stock tokens—such as Moderna and Linde—are already trading on BSC and Ethereum. Investors can participate in U.S. stock investments via on-chain methods. Meanwhile, MOVR surged about 50% within 24 hours after completing its migration to the Base Layer 2 network. Trading volume peaked at over $18.7 million. Whale addresses’ holdings increased by more than 11%, with net inflows reaching $1.69 million.
In addition, Ripple announced it will collaborate with Brazil infrastructure operator CSD BR to mirror the shares of BTG Pactual’s Brazil investment fund on the XRP Ledger, directly entering Brazil’s financial market of 22 trillion Brazilian reais. Singapore’s crypto economy scaled up 55.4% year over year to $28.4 billion. Institutional platform activity surged even more—up 94%—showing strong growth momentum for the crypto ecosystem across the Asia-Pacific region.
5. Outlook for the future
Overall, the cooling of inflation has created room for the Federal Reserve to adjust its policy direction. The continued influx of institutional funds provides solid liquidity support for the market. At the same time, the accelerated positioning by major traditional financial players in stablecoins and tokenization is helping build a more mature infrastructure for the crypto market. Currently, the altcoin season index has stayed above 60 for five straight days, and market breadth is improving. However, investors still need to watch the non-farm employment data and speeches by Fed officials in early October; short-term volatility risks cannot be ignored.
#BitcoinClears$85200 #AltcoinSeasonIndexHoldsAbove60For5Days # Institutional entry accelerates
272
·
--
BTC breaks through 85200 and the topic is still hot|Current price has pulled back to around 83900|I won’t chase XMR at 545
My attitude is to focus on defense first, then wait for confirmation. On the Binance Square#BitcoinClears$85200 is still on the trending list, but a “previous breakout” and a “current solid stand” are two different things. When I wrote the piece, Binance BTCUSDT was about $83,918; the 24h high/low was $85,649/$82,956. It has already fallen back below 85200. This contrast is more worth attention than the trend-list headline: an intraday spike shows that buy pressure appeared, while the pullback suggests that the support/consolidation above that price level hasn’t been verified. Treating the old breakout as if it is still valid right now can easily lead to misjudging risk appetite in smaller-cap coins.
I’m watching XMR, not because it will mechanically track BTC up. Monero’s use cases, trading venues, and holder structure are all different from BTC, and privacy demand isn’t the same kind of “stock-like” macro hedge promise. In the market, XMR can still be influenced by dollar liquidity, risk budgets, and exchange availability. When BTC surges sharply, funds may first concentrate into the most liquid assets—XMR isn’t guaranteed to move in sync. And when BTC pumps then gives back gains, the thinner order book depth can actually amplify XMR’s short-term volatility. This is my inference about capital transmission, not confirmation that on-chain funds have already been proven to move into or out of XMR.
Check first-hand information: on Monero’s official website, the latest blog still lists the July GUI wallet fix version—there’s no announcement published today, nor a new mainnet upgrade sufficient to explain an immediate change in coin price. On the macro side, the U.S. August core PCE year-over-year at 3.0% announced the previous day is existing data; it shouldn’t be written today again as if it were freshly released. Current prices of BTC and XMR are better treated as reactions to market conditions, rather than forcing every fluctuation to be attributed to some specific old news. Kraken’s XMR/USD is currently around $544.87, with a 24h range of $536.22 to $548.63. It’s still near the upper end of the range, but it hasn’t earned any “breakout guarantee” just because it’s trending.
If it were my own trade, I wouldn’t participate in chasing longs on XMR right now, and I wouldn’t short against the trend either—I’d stay on the sidelines. Only if BTC regains and holds above 85200, and after a pullback it holds, and meanwhile XMR’s 1-hour close is above 549 with improving volume, then I’d consider using up to 4% of total capital to try a long. First target 558, second target 570. At 558, I’d halve; then I’d move the stop loss to around break-even for the remaining position. My initial stop loss would be set below 541, so that loss per trade doesn’t exceed 0.4% of total capital. If BTC falls back below 83900 again, or if XMR breaks below 536, I’d cancel the plan and liquidate any existing position immediately. If it doesn’t trigger, there’s no execution—nor would I turn market heat into profit. The condition that would invalidate this view is: BTC keeps recovering and holding above the prior highs while XMR remains clearly weak. In that case, I’d re-evaluate its independent risk first and not rush to add.
#BitcoinClears$85200 #BTC #XMR
The above is only my personal market observations and does not constitute investment advice.
BTC breaks through 85200 and the topic is still hot|Current price has pulled back to around 83900|I won’t chase XMR at 545
My attitude is to focus on defense first, then wait for confirmation. On the Binance Square#BitcoinClears$85200 is still on the trending list, but a “previous breakout” and a “current solid stand” are two different things. When I wrote the piece, Binance BTCUSDT was about $83,918; the 24h high/low was $85,649/$82,956. It has already fallen back below 85200. This contrast is more worth attention than the trend-list headline: an intraday spike shows that buy pressure appeared, while the pullback suggests that the support/consolidation above that price level hasn’t been verified. Treating the old breakout as if it is still valid right now can easily lead to misjudging risk appetite in smaller-cap coins.
I’m watching XMR, not because it will mechanically track BTC up. Monero’s use cases, trading venues, and holder structure are all different from BTC, and privacy demand isn’t the same kind of “stock-like” macro hedge promise. In the market, XMR can still be influenced by dollar liquidity, risk budgets, and exchange availability. When BTC surges sharply, funds may first concentrate into the most liquid assets—XMR isn’t guaranteed to move in sync. And when BTC pumps then gives back gains, the thinner order book depth can actually amplify XMR’s short-term volatility. This is my inference about capital transmission, not confirmation that on-chain funds have already been proven to move into or out of XMR.
Check first-hand information: on Monero’s official website, the latest blog still lists the July GUI wallet fix version—there’s no announcement published today, nor a new mainnet upgrade sufficient to explain an immediate change in coin price. On the macro side, the U.S. August core PCE year-over-year at 3.0% announced the previous day is existing data; it shouldn’t be written today again as if it were freshly released. Current prices of BTC and XMR are better treated as reactions to market conditions, rather than forcing every fluctuation to be attributed to some specific old news. Kraken’s XMR/USD is currently around $544.87, with a 24h range of $536.22 to $548.63. It’s still near the upper end of the range, but it hasn’t earned any “breakout guarantee” just because it’s trending.
If it were my own trade, I wouldn’t participate in chasing longs on XMR right now, and I wouldn’t short against the trend either—I’d stay on the sidelines. Only if BTC regains and holds above 85200, and after a pullback it holds, and meanwhile XMR’s 1-hour close is above 549 with improving volume, then I’d consider using up to 4% of total capital to try a long. First target 558, second target 570. At 558, I’d halve; then I’d move the stop loss to around break-even for the remaining position. My initial stop loss would be set below 541, so that loss per trade doesn’t exceed 0.4% of total capital. If BTC falls back below 83900 again, or if XMR breaks below 536, I’d cancel the plan and liquidate any existing position immediately. If it doesn’t trigger, there’s no execution—nor would I turn market heat into profit. The condition that would invalidate this view is: BTC keeps recovering and holding above the prior highs while XMR remains clearly weak. In that case, I’d re-evaluate its independent risk first and not rush to add.
#BitcoinClears$85200 #BTC #XMR
The above is only my personal market observations and does not constitute investment advice.
My attitude is to focus on defense first, then wait for confirmation. On the Binance Square#BitcoinClears$85200 is still on the trending list, but a “previous breakout” and a “current solid stand” are two different things. When I wrote the piece, Binance BTCUSDT was about $83,918; the 24h high/low was $85,649/$82,956. It has already fallen back below 85200. This contrast is more worth attention than the trend-list headline: an intraday spike shows that buy pressure appeared, while the pullback suggests that the support/consolidation above that price level hasn’t been verified. Treating the old breakout as if it is still valid right now can easily lead to misjudging risk appetite in smaller-cap coins.
I’m watching XMR, not because it will mechanically track BTC up. Monero’s use cases, trading venues, and holder structure are all different from BTC, and privacy demand isn’t the same kind of “stock-like” macro hedge promise. In the market, XMR can still be influenced by dollar liquidity, risk budgets, and exchange availability. When BTC surges sharply, funds may first concentrate into the most liquid assets—XMR isn’t guaranteed to move in sync. And when BTC pumps then gives back gains, the thinner order book depth can actually amplify XMR’s short-term volatility. This is my inference about capital transmission, not confirmation that on-chain funds have already been proven to move into or out of XMR.
Check first-hand information: on Monero’s official website, the latest blog still lists the July GUI wallet fix version—there’s no announcement published today, nor a new mainnet upgrade sufficient to explain an immediate change in coin price. On the macro side, the U.S. August core PCE year-over-year at 3.0% announced the previous day is existing data; it shouldn’t be written today again as if it were freshly released. Current prices of BTC and XMR are better treated as reactions to market conditions, rather than forcing every fluctuation to be attributed to some specific old news. Kraken’s XMR/USD is currently around $544.87, with a 24h range of $536.22 to $548.63. It’s still near the upper end of the range, but it hasn’t earned any “breakout guarantee” just because it’s trending.
If it were my own trade, I wouldn’t participate in chasing longs on XMR right now, and I wouldn’t short against the trend either—I’d stay on the sidelines. Only if BTC regains and holds above 85200, and after a pullback it holds, and meanwhile XMR’s 1-hour close is above 549 with improving volume, then I’d consider using up to 4% of total capital to try a long. First target 558, second target 570. At 558, I’d halve; then I’d move the stop loss to around break-even for the remaining position. My initial stop loss would be set below 541, so that loss per trade doesn’t exceed 0.4% of total capital. If BTC falls back below 83900 again, or if XMR breaks below 536, I’d cancel the plan and liquidate any existing position immediately. If it doesn’t trigger, there’s no execution—nor would I turn market heat into profit. The condition that would invalidate this view is: BTC keeps recovering and holding above the prior highs while XMR remains clearly weak. In that case, I’d re-evaluate its independent risk first and not rush to add.
#BitcoinClears$85200 #BTC #XMR
The above is only my personal market observations and does not constitute investment advice.

6
Inflation cools down and sparks a market celebration: Bitcoin breaks through $85,000, while tokenized U.S. stocks surge into the spotlight
1. Core PCE unexpectedly cools, driving a strong rebound in the crypto market
Latest data released by the U.S. Department of Commerce shows that in August, the year-over-year increase in the core PCE price index was 3%, below the market’s forecast of 3.3%, reaching the lowest level since February of this year. After the data was released, the crypto market reacted quickly: Bitcoin surged past the $85,200 threshold, and Ethereum reclaimed the $2,700 level. Within just a few hours, more than $255 million worth of short positions were liquidated, significantly boosting bullish sentiment.
The unexpectedly lower inflation reading directly shifted market expectations for the Federal Reserve’s policy path. The probability of a rate hike in October has fallen to around 47%, down from the previously overwhelming expectations. For risk assets, a pivot toward easier monetary policy is undoubtedly the biggest positive catalyst.
2. Institutional capital accelerates into the market, with the biggest weekly inflow in nearly a year
Meanwhile, institutional capital is pouring into the digital-asset space at an unprecedented pace. According to CoinShares’ latest report, global digital-asset investment products saw net inflows of $3.55 billion last week—setting the largest single-week record since 2026. Among them, spot Bitcoin ETFs collectively attracted $742 million over the seven days, maintaining positive inflows for nine consecutive days.
Notably, Ethereum ETFs recorded a small amount of net outflows on a daily basis, indicating that institutions’ risk appetite for different digital assets is diverging. The narrative for Bitcoin as digital gold remains solid, while Ethereum—amid the continued expansion of the Layer2 ecosystem—is also waiting for its own catalyst. Overall, the sustained inflow of institutional capital provides strong price support for the market.
3. Tokenized U.S. stocks rise, and on-chain trading patterns are being rewritten
The most eye-catching structural change in September came from tokenized U.S. stocks. According to data from Binance Research, tokenized U.S. stocks accounted for an average of 11% of DEX trading volume in September, rapidly narrowing the gap with memecoins at 17%. This trend signals a fundamental shift in on-chain trading behavior—moving step by step from speculative memecoin trading toward investment behavior grounded in the value of real-world assets.
In the RWA tokenization track, Avalanche ranked fifth globally with $1.8 billion in total value locked and 807 on-chain assets. At the same time, DTCC, Citibank, and Swift jointly released a whitepaper emphasizing that interoperability is the key to scaling tokenization. Traditional finance giants are moving from observation to deep participation, a signal with far-reaching implications for the entire industry.
4. The BNB ecosystem gathers momentum, as CZ hints at a new round of rally
In trending topics, Binance founder CZ posted a cryptic update on a social platform. He included the caption “Soon” and reshared multiple bullish posts about tokenized U.S. stocks on BNB Chain, which the community widely interpreted as a signal for the next BNB rally. Meanwhile, after a community vote, CEA Industries officially changed its name to BNB Standard Corporation, with its stock ticker updated to BNC—further reinforcing institutional interest in the BNB treasury strategy.
From plaza heat metrics, BTC led the board with 4,450 mentions. SOL and BNB followed with 3,680 and 2,474 mentions respectively. The altcoin season index has remained above 60 for five consecutive days, indicating that market enthusiasm is spreading from Bitcoin to a broader range of asset categories.
5. Stablecoin competition intensifies, while traditional banks accelerate their layouts
In the stablecoin space, HSBC has officially named the stablecoin it plans to launch as HSBC RedCoin. It will first roll out personal-to-person and personal-to-merchant payment features in Hong Kong, then expand into enterprise and institutional scenarios. HSBC’s survey shows that 74% of respondents are open to using stablecoin payments—strongly indicating that traditional financial institutions are accelerating their embrace of blockchain technology.
At the same time, Stripe-backed Bridge-issued and custodied by BlackRock, the OUSD stablecoin has also officially launched. It supports deployments across multiple chains, including Base, Ethereum, and Solana, and can be accessed via the Mastercard, Stripe, and Visa platforms. Competition in the stablecoin track is expanding from crypto-native projects to traditional financial giants, and the future landscape will be more diverse and intense.
#BitcoinClears$85200 #AltcoinSeasonIndexHoldsAbove60For5Days #TokenizedStocksRise
Inflation cools down and sparks a market celebration: Bitcoin breaks through $85,000, while tokenized U.S. stocks surge into the spotlight
1. Core PCE unexpectedly cools, driving a strong rebound in the crypto market
Latest data released by the U.S. Department of Commerce shows that in August, the year-over-year increase in the core PCE price index was 3%, below the market’s forecast of 3.3%, reaching the lowest level since February of this year. After the data was released, the crypto market reacted quickly: Bitcoin surged past the $85,200 threshold, and Ethereum reclaimed the $2,700 level. Within just a few hours, more than $255 million worth of short positions were liquidated, significantly boosting bullish sentiment.
The unexpectedly lower inflation reading directly shifted market expectations for the Federal Reserve’s policy path. The probability of a rate hike in October has fallen to around 47%, down from the previously overwhelming expectations. For risk assets, a pivot toward easier monetary policy is undoubtedly the biggest positive catalyst.
2. Institutional capital accelerates into the market, with the biggest weekly inflow in nearly a year
Meanwhile, institutional capital is pouring into the digital-asset space at an unprecedented pace. According to CoinShares’ latest report, global digital-asset investment products saw net inflows of $3.55 billion last week—setting the largest single-week record since 2026. Among them, spot Bitcoin ETFs collectively attracted $742 million over the seven days, maintaining positive inflows for nine consecutive days.
Notably, Ethereum ETFs recorded a small amount of net outflows on a daily basis, indicating that institutions’ risk appetite for different digital assets is diverging. The narrative for Bitcoin as digital gold remains solid, while Ethereum—amid the continued expansion of the Layer2 ecosystem—is also waiting for its own catalyst. Overall, the sustained inflow of institutional capital provides strong price support for the market.
3. Tokenized U.S. stocks rise, and on-chain trading patterns are being rewritten
The most eye-catching structural change in September came from tokenized U.S. stocks. According to data from Binance Research, tokenized U.S. stocks accounted for an average of 11% of DEX trading volume in September, rapidly narrowing the gap with memecoins at 17%. This trend signals a fundamental shift in on-chain trading behavior—moving step by step from speculative memecoin trading toward investment behavior grounded in the value of real-world assets.
In the RWA tokenization track, Avalanche ranked fifth globally with $1.8 billion in total value locked and 807 on-chain assets. At the same time, DTCC, Citibank, and Swift jointly released a whitepaper emphasizing that interoperability is the key to scaling tokenization. Traditional finance giants are moving from observation to deep participation, a signal with far-reaching implications for the entire industry.
4. The BNB ecosystem gathers momentum, as CZ hints at a new round of rally
In trending topics, Binance founder CZ posted a cryptic update on a social platform. He included the caption “Soon” and reshared multiple bullish posts about tokenized U.S. stocks on BNB Chain, which the community widely interpreted as a signal for the next BNB rally. Meanwhile, after a community vote, CEA Industries officially changed its name to BNB Standard Corporation, with its stock ticker updated to BNC—further reinforcing institutional interest in the BNB treasury strategy.
From plaza heat metrics, BTC led the board with 4,450 mentions. SOL and BNB followed with 3,680 and 2,474 mentions respectively. The altcoin season index has remained above 60 for five consecutive days, indicating that market enthusiasm is spreading from Bitcoin to a broader range of asset categories.
5. Stablecoin competition intensifies, while traditional banks accelerate their layouts
In the stablecoin space, HSBC has officially named the stablecoin it plans to launch as HSBC RedCoin. It will first roll out personal-to-person and personal-to-merchant payment features in Hong Kong, then expand into enterprise and institutional scenarios. HSBC’s survey shows that 74% of respondents are open to using stablecoin payments—strongly indicating that traditional financial institutions are accelerating their embrace of blockchain technology.
At the same time, Stripe-backed Bridge-issued and custodied by BlackRock, the OUSD stablecoin has also officially launched. It supports deployments across multiple chains, including Base, Ethereum, and Solana, and can be accessed via the Mastercard, Stripe, and Visa platforms. Competition in the stablecoin track is expanding from crypto-native projects to traditional financial giants, and the future landscape will be more diverse and intense.
#BitcoinClears$85200 #AltcoinSeasonIndexHoldsAbove60For5Days #TokenizedStocksRise
1. Core PCE unexpectedly cools, driving a strong rebound in the crypto market
Latest data released by the U.S. Department of Commerce shows that in August, the year-over-year increase in the core PCE price index was 3%, below the market’s forecast of 3.3%, reaching the lowest level since February of this year. After the data was released, the crypto market reacted quickly: Bitcoin surged past the $85,200 threshold, and Ethereum reclaimed the $2,700 level. Within just a few hours, more than $255 million worth of short positions were liquidated, significantly boosting bullish sentiment.
The unexpectedly lower inflation reading directly shifted market expectations for the Federal Reserve’s policy path. The probability of a rate hike in October has fallen to around 47%, down from the previously overwhelming expectations. For risk assets, a pivot toward easier monetary policy is undoubtedly the biggest positive catalyst.
2. Institutional capital accelerates into the market, with the biggest weekly inflow in nearly a year
Meanwhile, institutional capital is pouring into the digital-asset space at an unprecedented pace. According to CoinShares’ latest report, global digital-asset investment products saw net inflows of $3.55 billion last week—setting the largest single-week record since 2026. Among them, spot Bitcoin ETFs collectively attracted $742 million over the seven days, maintaining positive inflows for nine consecutive days.
Notably, Ethereum ETFs recorded a small amount of net outflows on a daily basis, indicating that institutions’ risk appetite for different digital assets is diverging. The narrative for Bitcoin as digital gold remains solid, while Ethereum—amid the continued expansion of the Layer2 ecosystem—is also waiting for its own catalyst. Overall, the sustained inflow of institutional capital provides strong price support for the market.
3. Tokenized U.S. stocks rise, and on-chain trading patterns are being rewritten
The most eye-catching structural change in September came from tokenized U.S. stocks. According to data from Binance Research, tokenized U.S. stocks accounted for an average of 11% of DEX trading volume in September, rapidly narrowing the gap with memecoins at 17%. This trend signals a fundamental shift in on-chain trading behavior—moving step by step from speculative memecoin trading toward investment behavior grounded in the value of real-world assets.
In the RWA tokenization track, Avalanche ranked fifth globally with $1.8 billion in total value locked and 807 on-chain assets. At the same time, DTCC, Citibank, and Swift jointly released a whitepaper emphasizing that interoperability is the key to scaling tokenization. Traditional finance giants are moving from observation to deep participation, a signal with far-reaching implications for the entire industry.
4. The BNB ecosystem gathers momentum, as CZ hints at a new round of rally
In trending topics, Binance founder CZ posted a cryptic update on a social platform. He included the caption “Soon” and reshared multiple bullish posts about tokenized U.S. stocks on BNB Chain, which the community widely interpreted as a signal for the next BNB rally. Meanwhile, after a community vote, CEA Industries officially changed its name to BNB Standard Corporation, with its stock ticker updated to BNC—further reinforcing institutional interest in the BNB treasury strategy.
From plaza heat metrics, BTC led the board with 4,450 mentions. SOL and BNB followed with 3,680 and 2,474 mentions respectively. The altcoin season index has remained above 60 for five consecutive days, indicating that market enthusiasm is spreading from Bitcoin to a broader range of asset categories.
5. Stablecoin competition intensifies, while traditional banks accelerate their layouts
In the stablecoin space, HSBC has officially named the stablecoin it plans to launch as HSBC RedCoin. It will first roll out personal-to-person and personal-to-merchant payment features in Hong Kong, then expand into enterprise and institutional scenarios. HSBC’s survey shows that 74% of respondents are open to using stablecoin payments—strongly indicating that traditional financial institutions are accelerating their embrace of blockchain technology.
At the same time, Stripe-backed Bridge-issued and custodied by BlackRock, the OUSD stablecoin has also officially launched. It supports deployments across multiple chains, including Base, Ethereum, and Solana, and can be accessed via the Mastercard, Stripe, and Visa platforms. Competition in the stablecoin track is expanding from crypto-native projects to traditional financial giants, and the future landscape will be more diverse and intense.
#BitcoinClears$85200 #AltcoinSeasonIndexHoldsAbove60For5Days #TokenizedStocksRise
337
Tokenized U.S. equities market value breaks through $3 billion, marking a historic moment for the RWA sector
I. Tokenized U.S. equities see explosive growth
In the third quarter of 2026, the total market capitalization of tokenized U.S. equities surpassed the $3 billion mark, more than quadrupling from the roughly $700 million level at the start of the year, making it the fastest-growing subcategory within the RWA sector. Data shows that in the past 30 days, the DEX trading volume of on-chain stock-like assets reached $20.9 billion, with Uniswap v3 and v4 together accounting for about 60% of market share. Notably, the size of tokenized U.S. equities held on custody on the BNB Chain has reached approximately $1 billion, indicating strong on-chain demand from both institutional capital and retail investors.
At present, the number of tokenized U.S. equities available for trading on-chain continues to expand, covering multiple sectors—from technology giants to biopharmaceuticals. Investors can hold tokenized assets that provide exposure comparable to traditional U.S. equities via on-chain means, enabling round-the-clock trading and seamless transfers across the globe. This model is reshaping the boundary between traditional finance and decentralized finance.
II. Macroeconomic data sends mixed signals
From a macro perspective, the U.S. August core PCE price index rose 3% year over year, below market expectations of 3.3%, reaching the lowest level since February this year. Total PCE year over year was 3.4%, also better than the expected 3.7%. Meanwhile, the advance estimate of Q2 GDP was revised to 2.2%, significantly exceeding the market’s prior forecast of 1.5%.
Cooling inflation coupled with economic growth coming in above expectations has created divergence in market views about the Federal Reserve’s next policy direction. According to data from the CME FedWatch tool, despite the inflation data being relatively mild, the probability of a rate hike in October remains as high as 47.1%. This suggests traders are reevaluating the Fed’s policy path in the context of economic resilience, and the crypto market has likewise maintained a cautious wait-and-see stance.
III. Bitcoin’s quarterly gain hits a new high in nearly two years
Against a backdrop of shifting macro conditions, Bitcoin delivered an impressive performance in the third quarter, with a quarterly rise of 43.1%, the strongest showing since Q4 2024, and also the third-best quarter since the launch of U.S. spot Bitcoin ETFs. On September 29, spot Bitcoin ETFs recorded $66 million in net inflows, with BlackRock’s IBIT leading with $51 million.
The altcoin market also performed well. Total market capitalization rose about 38% since June, reaching $1.6 trillion. Sentiment indicators show the Altcoin Season Index has stayed above 60 for multiple consecutive days, suggesting capital is spreading from Bitcoin to a broader range of crypto assets.
IV. NEAR ETF draws strong demand on its first day of listing
A further step toward the integration of traditional finance and the crypto world. The spot NEAR Protocol ETF launched by Bitwise began trading on September 29 on the NYSE Arca market, and recorded $35.5 million in net inflows on its first day—accounting for 98.6% of its total assets under management of $36 million. This is the first spot NEAR ETF product in the United States.
NEAR’s token price then rose by about 11.6% to $5.32. Since August 2026, it has approached nearly a threefold increase. Bitwise plans to stake the NEAR it holds, which is expected to generate staking yield of about 5%, creating additional returns for ETF holders. This model provides a replicable template for future crypto-asset ETF launches.
V. Outlook and risk warnings
The explosive growth of tokenized U.S. equities, Bitcoin’s strong performance, and ongoing innovation in ETF products together paint a picture of deep integration between traditional finance and crypto assets. However, investors should remain alert to the following risks: rising expectations of Fed rate hikes could put pressure on risk assets, with the yield on the 30-year U.S. Treasury already breaking above 5.6%; there is still uncertainty regarding the safety of on-chain assets and regulatory compliance; and compared with traditional markets, the liquidity of tokenized U.S. equities remains significantly weaker. Embracing innovation while rationally assessing risks and managing position sizing is the path to long-term success.
#代币化美股市值突破30亿 #BitcoinClears$85200 #AltcoinSeasonIndexHoldsAbove60For5Days
Tokenized U.S. equities market value breaks through $3 billion, marking a historic moment for the RWA sector
I. Tokenized U.S. equities see explosive growth
In the third quarter of 2026, the total market capitalization of tokenized U.S. equities surpassed the $3 billion mark, more than quadrupling from the roughly $700 million level at the start of the year, making it the fastest-growing subcategory within the RWA sector. Data shows that in the past 30 days, the DEX trading volume of on-chain stock-like assets reached $20.9 billion, with Uniswap v3 and v4 together accounting for about 60% of market share. Notably, the size of tokenized U.S. equities held on custody on the BNB Chain has reached approximately $1 billion, indicating strong on-chain demand from both institutional capital and retail investors.
At present, the number of tokenized U.S. equities available for trading on-chain continues to expand, covering multiple sectors—from technology giants to biopharmaceuticals. Investors can hold tokenized assets that provide exposure comparable to traditional U.S. equities via on-chain means, enabling round-the-clock trading and seamless transfers across the globe. This model is reshaping the boundary between traditional finance and decentralized finance.
II. Macroeconomic data sends mixed signals
From a macro perspective, the U.S. August core PCE price index rose 3% year over year, below market expectations of 3.3%, reaching the lowest level since February this year. Total PCE year over year was 3.4%, also better than the expected 3.7%. Meanwhile, the advance estimate of Q2 GDP was revised to 2.2%, significantly exceeding the market’s prior forecast of 1.5%.
Cooling inflation coupled with economic growth coming in above expectations has created divergence in market views about the Federal Reserve’s next policy direction. According to data from the CME FedWatch tool, despite the inflation data being relatively mild, the probability of a rate hike in October remains as high as 47.1%. This suggests traders are reevaluating the Fed’s policy path in the context of economic resilience, and the crypto market has likewise maintained a cautious wait-and-see stance.
III. Bitcoin’s quarterly gain hits a new high in nearly two years
Against a backdrop of shifting macro conditions, Bitcoin delivered an impressive performance in the third quarter, with a quarterly rise of 43.1%, the strongest showing since Q4 2024, and also the third-best quarter since the launch of U.S. spot Bitcoin ETFs. On September 29, spot Bitcoin ETFs recorded $66 million in net inflows, with BlackRock’s IBIT leading with $51 million.
The altcoin market also performed well. Total market capitalization rose about 38% since June, reaching $1.6 trillion. Sentiment indicators show the Altcoin Season Index has stayed above 60 for multiple consecutive days, suggesting capital is spreading from Bitcoin to a broader range of crypto assets.
IV. NEAR ETF draws strong demand on its first day of listing
A further step toward the integration of traditional finance and the crypto world. The spot NEAR Protocol ETF launched by Bitwise began trading on September 29 on the NYSE Arca market, and recorded $35.5 million in net inflows on its first day—accounting for 98.6% of its total assets under management of $36 million. This is the first spot NEAR ETF product in the United States.
NEAR’s token price then rose by about 11.6% to $5.32. Since August 2026, it has approached nearly a threefold increase. Bitwise plans to stake the NEAR it holds, which is expected to generate staking yield of about 5%, creating additional returns for ETF holders. This model provides a replicable template for future crypto-asset ETF launches.
V. Outlook and risk warnings
The explosive growth of tokenized U.S. equities, Bitcoin’s strong performance, and ongoing innovation in ETF products together paint a picture of deep integration between traditional finance and crypto assets. However, investors should remain alert to the following risks: rising expectations of Fed rate hikes could put pressure on risk assets, with the yield on the 30-year U.S. Treasury already breaking above 5.6%; there is still uncertainty regarding the safety of on-chain assets and regulatory compliance; and compared with traditional markets, the liquidity of tokenized U.S. equities remains significantly weaker. Embracing innovation while rationally assessing risks and managing position sizing is the path to long-term success.
#代币化美股市值突破30亿 #BitcoinClears$85200 #AltcoinSeasonIndexHoldsAbove60For5Days
I. Tokenized U.S. equities see explosive growth
In the third quarter of 2026, the total market capitalization of tokenized U.S. equities surpassed the $3 billion mark, more than quadrupling from the roughly $700 million level at the start of the year, making it the fastest-growing subcategory within the RWA sector. Data shows that in the past 30 days, the DEX trading volume of on-chain stock-like assets reached $20.9 billion, with Uniswap v3 and v4 together accounting for about 60% of market share. Notably, the size of tokenized U.S. equities held on custody on the BNB Chain has reached approximately $1 billion, indicating strong on-chain demand from both institutional capital and retail investors.
At present, the number of tokenized U.S. equities available for trading on-chain continues to expand, covering multiple sectors—from technology giants to biopharmaceuticals. Investors can hold tokenized assets that provide exposure comparable to traditional U.S. equities via on-chain means, enabling round-the-clock trading and seamless transfers across the globe. This model is reshaping the boundary between traditional finance and decentralized finance.
II. Macroeconomic data sends mixed signals
From a macro perspective, the U.S. August core PCE price index rose 3% year over year, below market expectations of 3.3%, reaching the lowest level since February this year. Total PCE year over year was 3.4%, also better than the expected 3.7%. Meanwhile, the advance estimate of Q2 GDP was revised to 2.2%, significantly exceeding the market’s prior forecast of 1.5%.
Cooling inflation coupled with economic growth coming in above expectations has created divergence in market views about the Federal Reserve’s next policy direction. According to data from the CME FedWatch tool, despite the inflation data being relatively mild, the probability of a rate hike in October remains as high as 47.1%. This suggests traders are reevaluating the Fed’s policy path in the context of economic resilience, and the crypto market has likewise maintained a cautious wait-and-see stance.
III. Bitcoin’s quarterly gain hits a new high in nearly two years
Against a backdrop of shifting macro conditions, Bitcoin delivered an impressive performance in the third quarter, with a quarterly rise of 43.1%, the strongest showing since Q4 2024, and also the third-best quarter since the launch of U.S. spot Bitcoin ETFs. On September 29, spot Bitcoin ETFs recorded $66 million in net inflows, with BlackRock’s IBIT leading with $51 million.
The altcoin market also performed well. Total market capitalization rose about 38% since June, reaching $1.6 trillion. Sentiment indicators show the Altcoin Season Index has stayed above 60 for multiple consecutive days, suggesting capital is spreading from Bitcoin to a broader range of crypto assets.
IV. NEAR ETF draws strong demand on its first day of listing
A further step toward the integration of traditional finance and the crypto world. The spot NEAR Protocol ETF launched by Bitwise began trading on September 29 on the NYSE Arca market, and recorded $35.5 million in net inflows on its first day—accounting for 98.6% of its total assets under management of $36 million. This is the first spot NEAR ETF product in the United States.
NEAR’s token price then rose by about 11.6% to $5.32. Since August 2026, it has approached nearly a threefold increase. Bitwise plans to stake the NEAR it holds, which is expected to generate staking yield of about 5%, creating additional returns for ETF holders. This model provides a replicable template for future crypto-asset ETF launches.
V. Outlook and risk warnings
The explosive growth of tokenized U.S. equities, Bitcoin’s strong performance, and ongoing innovation in ETF products together paint a picture of deep integration between traditional finance and crypto assets. However, investors should remain alert to the following risks: rising expectations of Fed rate hikes could put pressure on risk assets, with the yield on the 30-year U.S. Treasury already breaking above 5.6%; there is still uncertainty regarding the safety of on-chain assets and regulatory compliance; and compared with traditional markets, the liquidity of tokenized U.S. equities remains significantly weaker. Embracing innovation while rationally assessing risks and managing position sizing is the path to long-term success.
#代币化美股市值突破30亿 #BitcoinClears$85200 #AltcoinSeasonIndexHoldsAbove60For5Days
14

·
--
If you're still sitting on the sidelines waiting for Powell to confirm a rate cut, stop now.
That exact hesitation is how traders miss entire cycles. You watch the data come in, overthink the "what if it's a one-off," then FOMO in at the top after the market has already moved 20 percent.
Core PCE easing to 3 percent is the Fed's preferred gauge finally cooperating. We've been here before. In 2023 the same cooling inflation narrative got laughed at as transitory round two, yet it kicked off the rally that took us from the bear market lows.
This time Fear and Greed sits at 68 and alts are stirring. $XRP and $AAVE have been leading the way while $ENA stays in the conversation.
The comparison isn't identical, but the market is pricing the pivot faster than last cycle. Liquidity tends to show up before the official announcement.
Where do you think this PCE print actually takes us from here?
#USCorePCEEasesTo3 #BitcoinClears #AltcoinSeasonIndexHoldsAbove60For5Days
If you're still sitting on the sidelines waiting for Powell to confirm a rate cut, stop now.
That exact hesitation is how traders miss entire cycles. You watch the data come in, overthink the "what if it's a one-off," then FOMO in at the top after the market has already moved 20 percent.
Core PCE easing to 3 percent is the Fed's preferred gauge finally cooperating. We've been here before. In 2023 the same cooling inflation narrative got laughed at as transitory round two, yet it kicked off the rally that took us from the bear market lows.
This time Fear and Greed sits at 68 and alts are stirring. $XRP and $AAVE have been leading the way while $ENA stays in the conversation.
The comparison isn't identical, but the market is pricing the pivot faster than last cycle. Liquidity tends to show up before the official announcement.
Where do you think this PCE print actually takes us from here?
#USCorePCEEasesTo3 #BitcoinClears #AltcoinSeasonIndexHoldsAbove60For5Days
That exact hesitation is how traders miss entire cycles. You watch the data come in, overthink the "what if it's a one-off," then FOMO in at the top after the market has already moved 20 percent.
Core PCE easing to 3 percent is the Fed's preferred gauge finally cooperating. We've been here before. In 2023 the same cooling inflation narrative got laughed at as transitory round two, yet it kicked off the rally that took us from the bear market lows.
This time Fear and Greed sits at 68 and alts are stirring. $XRP and $AAVE have been leading the way while $ENA stays in the conversation.
The comparison isn't identical, but the market is pricing the pivot faster than last cycle. Liquidity tends to show up before the official announcement.
Where do you think this PCE print actually takes us from here?
#USCorePCEEasesTo3 #BitcoinClears #AltcoinSeasonIndexHoldsAbove60For5Days

370
·
--
Here's what happened when the Kospi just logged its worst quarter since the 2020 crash.
Crypto traders I talk to are watching that Korean index bleed and feeling the old correlation fear kick in. Nobody wants to get dumped on if traditional markets drag everything lower, and the temptation to FOMO the dip or panic-sell is sitting right there.
This quarter's Kospi drop was no overnight virus shock. It was a grind from export weakness and semiconductor pressure, even with mixed US data like ADP adding 90,000 jobs and core PCE easing. In 2020 the crash was followed by stimulus and a sharp rebound that crypto rode hard. The setup now looks different. Bitcoin is clearing levels while the altcoin season index has held above 60 for five days, and capital is parking in $USDT but also rotating toward $XRP's payments angle and $AAVE's DeFi yields as Korean stocks digest their pain.
The comparison shows 2020's correlated dump-then-boom playbook may not repeat one-for-one. Crypto is running its own cycle with greed at 68, and on-chain narratives are attracting interest that traditional Asian equities currently lack.
Where do you think Kospi weakness takes crypto from here?
#KospiPostsWorstQuarterSince2020 #BitcoinClears #AltcoinSeasonIndexHoldsAbove60For5Days
Here's what happened when the Kospi just logged its worst quarter since the 2020 crash.
Crypto traders I talk to are watching that Korean index bleed and feeling the old correlation fear kick in. Nobody wants to get dumped on if traditional markets drag everything lower, and the temptation to FOMO the dip or panic-sell is sitting right there.
This quarter's Kospi drop was no overnight virus shock. It was a grind from export weakness and semiconductor pressure, even with mixed US data like ADP adding 90,000 jobs and core PCE easing. In 2020 the crash was followed by stimulus and a sharp rebound that crypto rode hard. The setup now looks different. Bitcoin is clearing levels while the altcoin season index has held above 60 for five days, and capital is parking in $USDT but also rotating toward $XRP 's payments angle and $AAVE 's DeFi yields as Korean stocks digest their pain.
The comparison shows 2020's correlated dump-then-boom playbook may not repeat one-for-one. Crypto is running its own cycle with greed at 68, and on-chain narratives are attracting interest that traditional Asian equities currently lack.
Where do you think Kospi weakness takes crypto from here?
#KospiPostsWorstQuarterSince2020 #BitcoinClears #AltcoinSeasonIndexHoldsAbove60For5Days
Crypto traders I talk to are watching that Korean index bleed and feeling the old correlation fear kick in. Nobody wants to get dumped on if traditional markets drag everything lower, and the temptation to FOMO the dip or panic-sell is sitting right there.
This quarter's Kospi drop was no overnight virus shock. It was a grind from export weakness and semiconductor pressure, even with mixed US data like ADP adding 90,000 jobs and core PCE easing. In 2020 the crash was followed by stimulus and a sharp rebound that crypto rode hard. The setup now looks different. Bitcoin is clearing levels while the altcoin season index has held above 60 for five days, and capital is parking in $USDT but also rotating toward $XRP 's payments angle and $AAVE 's DeFi yields as Korean stocks digest their pain.
The comparison shows 2020's correlated dump-then-boom playbook may not repeat one-for-one. Crypto is running its own cycle with greed at 68, and on-chain narratives are attracting interest that traditional Asian equities currently lack.
Where do you think Kospi weakness takes crypto from here?
#KospiPostsWorstQuarterSince2020 #BitcoinClears #AltcoinSeasonIndexHoldsAbove60For5Days
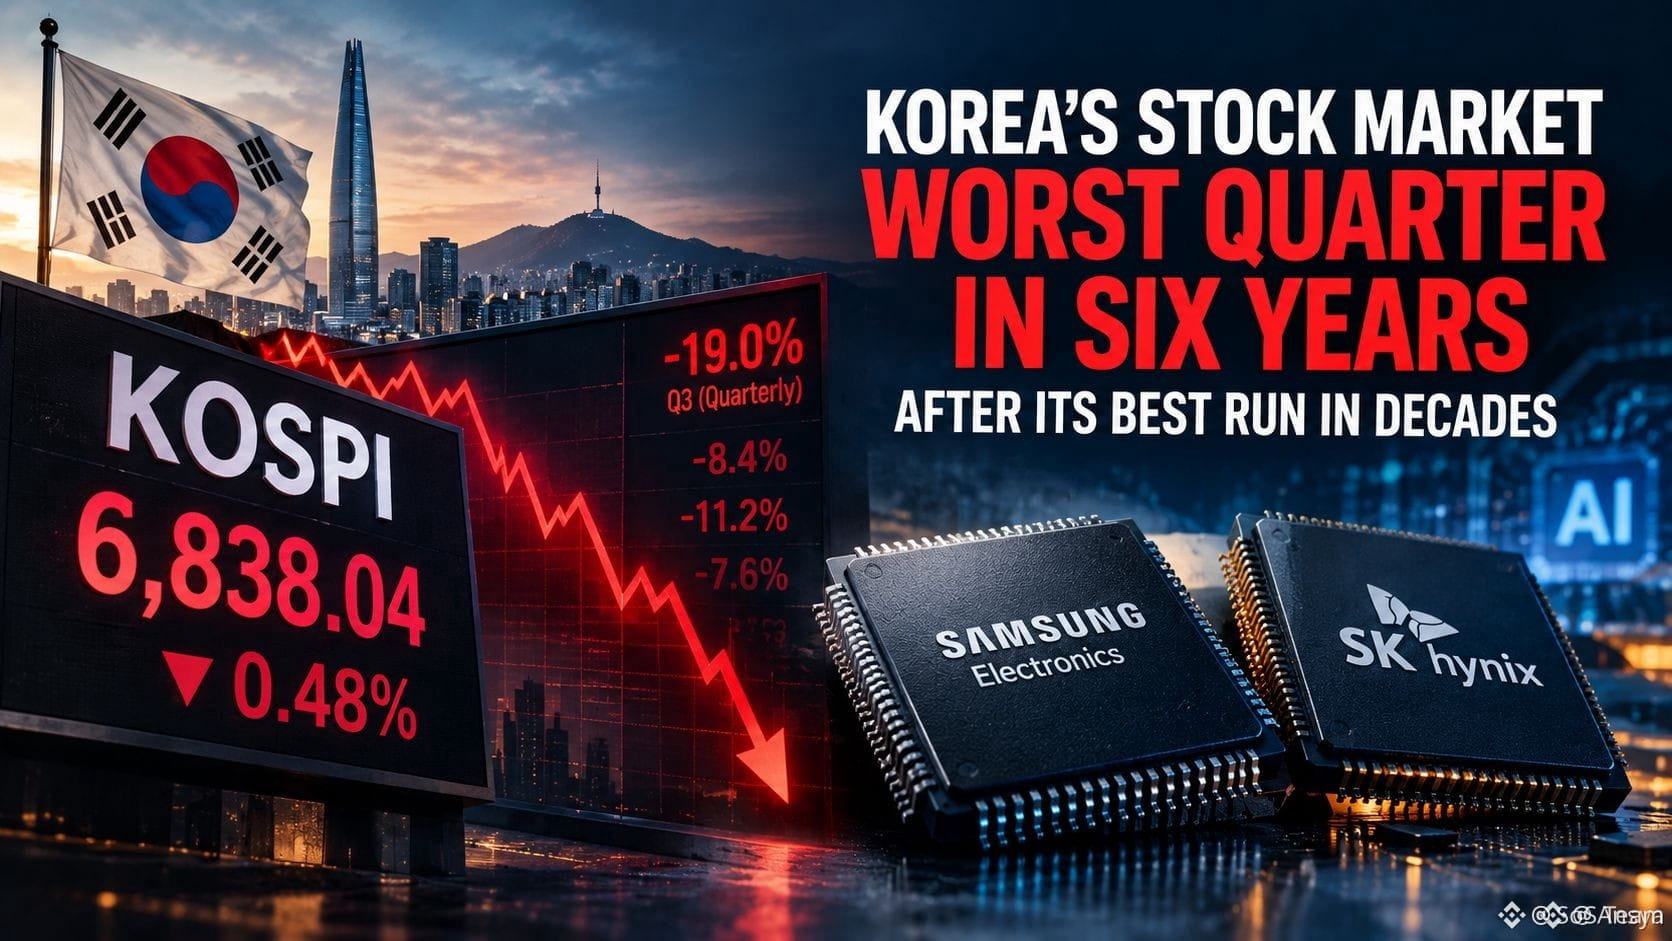
63

·
--
Day 11/45: Just make today a little better than yesterday
Day 11/45. Today I look back at the number 11 days that have passed and ask myself: is my version today calmer than my version yesterday? Not compared to anyone else—just compared to myself from the day before.
As with every day, I consistently buy an extra 50u worth of Bitcoin. Today $BTC nudged slightly up +0.41% in 24 hours—nothing to celebrate, and nothing to worry about. I buy because it’s something I have to do, not because the price is green or red.
I realized this: comparing myself to others only makes me tired and uneasy. But comparing myself today to myself yesterday, I can clearly see I’ve opened the app less often every 10 minutes, and I feel my heart racing less when the candle turns red. That’s what I’m truly building.
This post is only a personal journal to practice discipline—not investment advice. Read for fun, and decide for yourself the way you like.
#45ngaytudotaichinh #BitcoinClears$85200
Day 11/45: Just make today a little better than yesterday
Day 11/45. Today I look back at the number 11 days that have passed and ask myself: is my version today calmer than my version yesterday? Not compared to anyone else—just compared to myself from the day before.
As with every day, I consistently buy an extra 50u worth of Bitcoin. Today $BTC nudged slightly up +0.41% in 24 hours—nothing to celebrate, and nothing to worry about. I buy because it’s something I have to do, not because the price is green or red.
I realized this: comparing myself to others only makes me tired and uneasy. But comparing myself today to myself yesterday, I can clearly see I’ve opened the app less often every 10 minutes, and I feel my heart racing less when the candle turns red. That’s what I’m truly building.
This post is only a personal journal to practice discipline—not investment advice. Read for fun, and decide for yourself the way you like.
#45ngaytudotaichinh #BitcoinClears$85200
Day 11/45. Today I look back at the number 11 days that have passed and ask myself: is my version today calmer than my version yesterday? Not compared to anyone else—just compared to myself from the day before.
As with every day, I consistently buy an extra 50u worth of Bitcoin. Today $BTC nudged slightly up +0.41% in 24 hours—nothing to celebrate, and nothing to worry about. I buy because it’s something I have to do, not because the price is green or red.
I realized this: comparing myself to others only makes me tired and uneasy. But comparing myself today to myself yesterday, I can clearly see I’ve opened the app less often every 10 minutes, and I feel my heart racing less when the candle turns red. That’s what I’m truly building.
This post is only a personal journal to practice discipline—not investment advice. Read for fun, and decide for yourself the way you like.
#45ngaytudotaichinh #BitcoinClears$85200
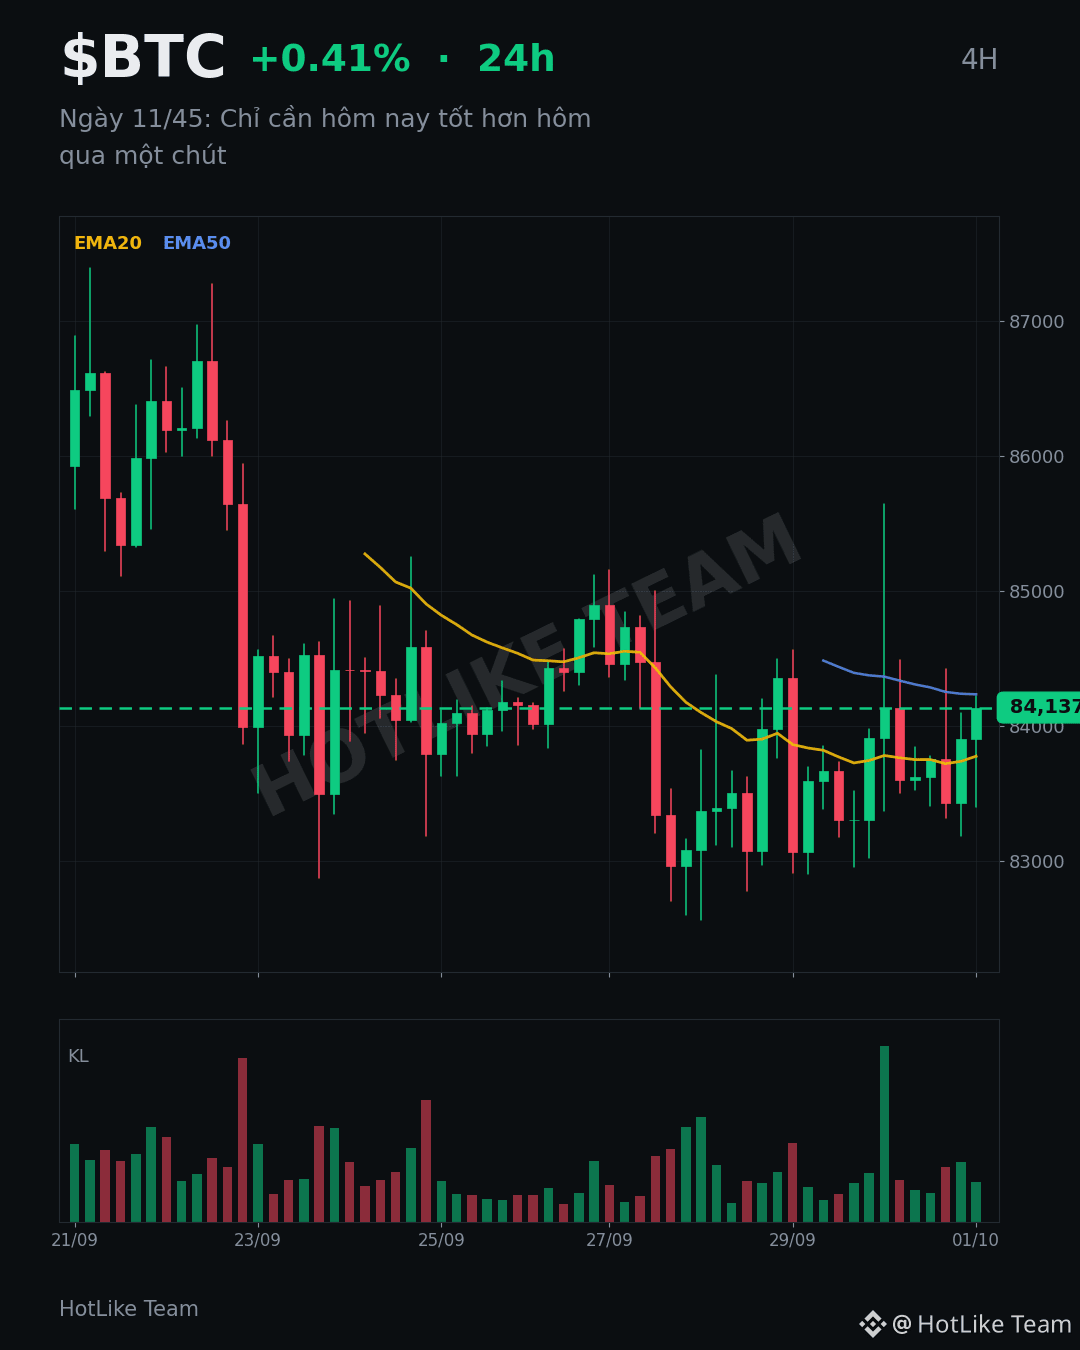
117
·
--
Strategy plans to convert preferred shares to daily interest accrual|still pending shareholder approval|BTC around $84,000 not chasing
My take: This is an institutional update worth understanding the capital structure for. It’s not an announcement that “Strategy just bought more Bitcoin.” Strategy’s website outlines a proposal to make the four U.S.-listed preferred shares, STRF, STRC, STRK, and STRD, accrue dividends on a cumulative basis for each calendar day. Dividends would be counted on weekends and holidays as well, and then paid on the next business day. The company lists improved liquidity and shortening the reinvestment waiting period as expected benefits; these are the company’s plan and expectations—not realized returns.
The preliminary proxy statement filed on September 25 also notes that an extraordinary general meeting on October 28 will consider the relevant provisions. The final proxy statement is expected to be submitted on October 5, but “expected” is not the same as already approved. The dividend itself still depends on a board declaration and legally distributable funds.
Why does this indirectly affect BTC? Strategy wants to make its preferred-share financing instrument more attractive to improve fundraising efficiency, and then use capital-market channels for a Bitcoin treasury strategy. At least several hurdles sit between investor demand, issuance terms, company decision-making, and actual BTC purchase disclosures. Daily preferred-share dividends are not interest generated on-chain in Bitcoin, and they’re not something you get daily just for holding BTC. I also won’t directly translate a potential improvement in financing capacity into future buying demand, nor will I infer increased holdings from Saylor’s personal picture posts or market speculation.
Market reaction should be evaluated separately. At the time of writing, Binance BTC/USDT is about $83,959, with a 24-hour range of $83,186 to $85,649. Price briefly surged intraday but has already pulled back to around $84,000. Square is still showing #BitcoinClears$85200 on the board, but that tag describes a prior sweep—it doesn’t mean it’s still holding above $85,200 right now. The price drop is an observable fact, and it can’t prove that this old proposal is the cause. Likewise, the existence of the proposal doesn’t replace verification of spot-fund net flows and trading volume. According to Farside’s summary of U.S. spot BTC funds as of September 30, net outflows were about $148.7 million—another reported datapoint that shouldn’t be lumped together with the preferred-share scheme as if it were the same pool of money.
If I were trading this myself: I would not chase longs now, and I would not short—position size is zero. Only if price reclaims $85,200 and, after a one-hour pullback test, continues to hold that level—and if volume does not visibly shrink—I’d consider trying a spot long, with total capital capped at 3%. First target: around $85,650; when hit, I’d cut the position in half. Second target: around $86,500; the remaining position would be managed with a trailing stop.
If, one hour after entering, the candle closes again below $84,800, I would stop out and close the position, not “use an institutional positive” as a reason to hold through. Conversely, if price breaks down first below $83,180, I would cancel the breakout plan above and wait for the new structure to form. If Strategy’s official documents don’t match the existing proposal, my view should be re-evaluated immediately. Discipline-wise, the four items—proposal, vote, financing, and actual BTC purchases—must be verified one by one.
Source: Strategy website daily dividend proposal and preliminary proxy statement; Farside fund daily report; Binance BTC/USDT market data. #BitcoinClears$85200 #BTC
The above is for personal market observation only and does not constitute investment advice.
Strategy plans to convert preferred shares to daily interest accrual|still pending shareholder approval|BTC around $84,000 not chasing
My take: This is an institutional update worth understanding the capital structure for. It’s not an announcement that “Strategy just bought more Bitcoin.” Strategy’s website outlines a proposal to make the four U.S.-listed preferred shares, STRF, STRC, STRK, and STRD, accrue dividends on a cumulative basis for each calendar day. Dividends would be counted on weekends and holidays as well, and then paid on the next business day. The company lists improved liquidity and shortening the reinvestment waiting period as expected benefits; these are the company’s plan and expectations—not realized returns.
The preliminary proxy statement filed on September 25 also notes that an extraordinary general meeting on October 28 will consider the relevant provisions. The final proxy statement is expected to be submitted on October 5, but “expected” is not the same as already approved. The dividend itself still depends on a board declaration and legally distributable funds.
Why does this indirectly affect BTC? Strategy wants to make its preferred-share financing instrument more attractive to improve fundraising efficiency, and then use capital-market channels for a Bitcoin treasury strategy. At least several hurdles sit between investor demand, issuance terms, company decision-making, and actual BTC purchase disclosures. Daily preferred-share dividends are not interest generated on-chain in Bitcoin, and they’re not something you get daily just for holding BTC. I also won’t directly translate a potential improvement in financing capacity into future buying demand, nor will I infer increased holdings from Saylor’s personal picture posts or market speculation.
Market reaction should be evaluated separately. At the time of writing, Binance BTC/USDT is about $83,959, with a 24-hour range of $83,186 to $85,649. Price briefly surged intraday but has already pulled back to around $84,000. Square is still showing #BitcoinClears$85200 on the board, but that tag describes a prior sweep—it doesn’t mean it’s still holding above $85,200 right now. The price drop is an observable fact, and it can’t prove that this old proposal is the cause. Likewise, the existence of the proposal doesn’t replace verification of spot-fund net flows and trading volume. According to Farside’s summary of U.S. spot BTC funds as of September 30, net outflows were about $148.7 million—another reported datapoint that shouldn’t be lumped together with the preferred-share scheme as if it were the same pool of money.
If I were trading this myself: I would not chase longs now, and I would not short—position size is zero. Only if price reclaims $85,200 and, after a one-hour pullback test, continues to hold that level—and if volume does not visibly shrink—I’d consider trying a spot long, with total capital capped at 3%. First target: around $85,650; when hit, I’d cut the position in half. Second target: around $86,500; the remaining position would be managed with a trailing stop.
If, one hour after entering, the candle closes again below $84,800, I would stop out and close the position, not “use an institutional positive” as a reason to hold through. Conversely, if price breaks down first below $83,180, I would cancel the breakout plan above and wait for the new structure to form. If Strategy’s official documents don’t match the existing proposal, my view should be re-evaluated immediately. Discipline-wise, the four items—proposal, vote, financing, and actual BTC purchases—must be verified one by one.
Source: Strategy website daily dividend proposal and preliminary proxy statement; Farside fund daily report; Binance BTC/USDT market data. #BitcoinClears$85200 #BTC
The above is for personal market observation only and does not constitute investment advice.
My take: This is an institutional update worth understanding the capital structure for. It’s not an announcement that “Strategy just bought more Bitcoin.” Strategy’s website outlines a proposal to make the four U.S.-listed preferred shares, STRF, STRC, STRK, and STRD, accrue dividends on a cumulative basis for each calendar day. Dividends would be counted on weekends and holidays as well, and then paid on the next business day. The company lists improved liquidity and shortening the reinvestment waiting period as expected benefits; these are the company’s plan and expectations—not realized returns.
The preliminary proxy statement filed on September 25 also notes that an extraordinary general meeting on October 28 will consider the relevant provisions. The final proxy statement is expected to be submitted on October 5, but “expected” is not the same as already approved. The dividend itself still depends on a board declaration and legally distributable funds.
Why does this indirectly affect BTC? Strategy wants to make its preferred-share financing instrument more attractive to improve fundraising efficiency, and then use capital-market channels for a Bitcoin treasury strategy. At least several hurdles sit between investor demand, issuance terms, company decision-making, and actual BTC purchase disclosures. Daily preferred-share dividends are not interest generated on-chain in Bitcoin, and they’re not something you get daily just for holding BTC. I also won’t directly translate a potential improvement in financing capacity into future buying demand, nor will I infer increased holdings from Saylor’s personal picture posts or market speculation.
Market reaction should be evaluated separately. At the time of writing, Binance BTC/USDT is about $83,959, with a 24-hour range of $83,186 to $85,649. Price briefly surged intraday but has already pulled back to around $84,000. Square is still showing #BitcoinClears$85200 on the board, but that tag describes a prior sweep—it doesn’t mean it’s still holding above $85,200 right now. The price drop is an observable fact, and it can’t prove that this old proposal is the cause. Likewise, the existence of the proposal doesn’t replace verification of spot-fund net flows and trading volume. According to Farside’s summary of U.S. spot BTC funds as of September 30, net outflows were about $148.7 million—another reported datapoint that shouldn’t be lumped together with the preferred-share scheme as if it were the same pool of money.
If I were trading this myself: I would not chase longs now, and I would not short—position size is zero. Only if price reclaims $85,200 and, after a one-hour pullback test, continues to hold that level—and if volume does not visibly shrink—I’d consider trying a spot long, with total capital capped at 3%. First target: around $85,650; when hit, I’d cut the position in half. Second target: around $86,500; the remaining position would be managed with a trailing stop.
If, one hour after entering, the candle closes again below $84,800, I would stop out and close the position, not “use an institutional positive” as a reason to hold through. Conversely, if price breaks down first below $83,180, I would cancel the breakout plan above and wait for the new structure to form. If Strategy’s official documents don’t match the existing proposal, my view should be re-evaluated immediately. Discipline-wise, the four items—proposal, vote, financing, and actual BTC purchases—must be verified one by one.
Source: Strategy website daily dividend proposal and preliminary proxy statement; Farside fund daily report; Binance BTC/USDT market data. #BitcoinClears$85200 #BTC
The above is for personal market observation only and does not constitute investment advice.

1
·
--
September 30 BTC fund table turns negative | IBIT also sees $9.5 million outflows | I won’t chase a second wave near 84,300
My stance is neutral-to-cautious: when a price rebound and fund flows are both negative at the same time, wait to see which one gets verified first—don’t use a single figure to make a conclusion for yourself. Farside’s U.S. spot Bitcoin ETF page has just updated the IBIT entries for September 30: net outflow of $9.5 million. The previously reported FBTC is net outflow of $125.6 million, and BITB is net outflow of $13.6 million; the page’s total column now shows net outflow of $148.7 million. On September 29, the total column was still net inflow of $66.2 million. Here I’m only saying what the “Farside page currently displays,” not claiming that the final subscription/redemption data for all issuers won’t be revised. Also, the 0.0 values for other products in the table aren’t worth interpreting as proof that every institution had no trading.
More important than the numbers themselves is the structure: the first three items were all negative. Even IBIT—which previously helped drive inflows—turned into a small outflow, indicating that the fund buying on that day at month-end was indeed weaker than it was last week. Binance OTC’s weekly observation released today described recent ETF inflows as “positive but slowing,” suggesting more could be absorbing sell pressure. But that was an exchange desk analysis written during the data update process; you can’t treat it as a substitute for the final September 30 settlement. My independent judgment is: negative fund flows won’t mechanically make the spot price drop immediately, and spot could also rise due to short-covering or other off-exchange buying. However, if the next two consecutive days are negative and the price still can’t reclaim the prior high, the rebound quality will clearly decline.
The market reaction has two sides. In Binance BTCUSDT queries, it’s around $84,316, up about 1.04% over 24 hours. The past 24 hours’ high was $85,650 and the low was $82,956. On the plaza, #BitcoinClears$85200 is still on the hot list—about a real intraday breakout that happened. It doesn’t mean the current price is still holding above $85,200. The ETF fund records correspond to the U.S. trading day of September 30, while the current price corresponds to this moment—these aren’t on the same clock. I also won’t say this outflow “caused” every single candlestick. First, look to see whether 85,200—85,650 can regain and hold. Below, watch 83,800 first, then around 83,000. If the next round of ETF fund data turns back to net inflow and spot volume recovers 85,650, that would overturn my cautious judgment. If it breaks below 83,000 and the retest fails, then the bullish plan fails.
If this were my own trading: I wouldn’t chase the price. I’d only consider a small long position in the spot, risking at most 2% of total funds per trade. The entry triggers are: after a pullback to 83,800—84,100, reclaim above 84,300; or, alternatively, a breakout above 85,650 with volume, followed by a retest that doesn’t break. You execute only one of the two. First target: 85,200 minus one-third. Second target: 85,650 minus another one-third. The remaining position would look toward 87,000, protected with a moving take-profit. If you choose the breakout plan, the first target becomes 87,000 and you reduce positions in batches accordingly. Place one unified stop-loss about 1% below the trigger level; the account’s pre-set maximum loss would not exceed 0.3%. If the daily closes below 83,000, the fund situation keeps worsening, or after a breakout the price quickly falls back into the range, I’ll主动平仓 (close positions early). If conditions aren’t met, I’ll keep the account in cash—don’t write the plan as an order.
Source: Farside BTC daily fund table; Binance OTC October 1 weekly observation; Binance BTCUSDT market snapshot. #BitcoinClears$85200 #BTC
The above is only personal market observation and does not constitute investment advice.
September 30 BTC fund table turns negative | IBIT also sees $9.5 million outflows | I won’t chase a second wave near 84,300
My stance is neutral-to-cautious: when a price rebound and fund flows are both negative at the same time, wait to see which one gets verified first—don’t use a single figure to make a conclusion for yourself. Farside’s U.S. spot Bitcoin ETF page has just updated the IBIT entries for September 30: net outflow of $9.5 million. The previously reported FBTC is net outflow of $125.6 million, and BITB is net outflow of $13.6 million; the page’s total column now shows net outflow of $148.7 million. On September 29, the total column was still net inflow of $66.2 million. Here I’m only saying what the “Farside page currently displays,” not claiming that the final subscription/redemption data for all issuers won’t be revised. Also, the 0.0 values for other products in the table aren’t worth interpreting as proof that every institution had no trading.
More important than the numbers themselves is the structure: the first three items were all negative. Even IBIT—which previously helped drive inflows—turned into a small outflow, indicating that the fund buying on that day at month-end was indeed weaker than it was last week. Binance OTC’s weekly observation released today described recent ETF inflows as “positive but slowing,” suggesting more could be absorbing sell pressure. But that was an exchange desk analysis written during the data update process; you can’t treat it as a substitute for the final September 30 settlement. My independent judgment is: negative fund flows won’t mechanically make the spot price drop immediately, and spot could also rise due to short-covering or other off-exchange buying. However, if the next two consecutive days are negative and the price still can’t reclaim the prior high, the rebound quality will clearly decline.
The market reaction has two sides. In Binance BTCUSDT queries, it’s around $84,316, up about 1.04% over 24 hours. The past 24 hours’ high was $85,650 and the low was $82,956. On the plaza, #BitcoinClears$85200 is still on the hot list—about a real intraday breakout that happened. It doesn’t mean the current price is still holding above $85,200. The ETF fund records correspond to the U.S. trading day of September 30, while the current price corresponds to this moment—these aren’t on the same clock. I also won’t say this outflow “caused” every single candlestick. First, look to see whether 85,200—85,650 can regain and hold. Below, watch 83,800 first, then around 83,000. If the next round of ETF fund data turns back to net inflow and spot volume recovers 85,650, that would overturn my cautious judgment. If it breaks below 83,000 and the retest fails, then the bullish plan fails.
If this were my own trading: I wouldn’t chase the price. I’d only consider a small long position in the spot, risking at most 2% of total funds per trade. The entry triggers are: after a pullback to 83,800—84,100, reclaim above 84,300; or, alternatively, a breakout above 85,650 with volume, followed by a retest that doesn’t break. You execute only one of the two. First target: 85,200 minus one-third. Second target: 85,650 minus another one-third. The remaining position would look toward 87,000, protected with a moving take-profit. If you choose the breakout plan, the first target becomes 87,000 and you reduce positions in batches accordingly. Place one unified stop-loss about 1% below the trigger level; the account’s pre-set maximum loss would not exceed 0.3%. If the daily closes below 83,000, the fund situation keeps worsening, or after a breakout the price quickly falls back into the range, I’ll主动平仓 (close positions early). If conditions aren’t met, I’ll keep the account in cash—don’t write the plan as an order.
Source: Farside BTC daily fund table; Binance OTC October 1 weekly observation; Binance BTCUSDT market snapshot. #BitcoinClears$85200 #BTC
The above is only personal market observation and does not constitute investment advice.
My stance is neutral-to-cautious: when a price rebound and fund flows are both negative at the same time, wait to see which one gets verified first—don’t use a single figure to make a conclusion for yourself. Farside’s U.S. spot Bitcoin ETF page has just updated the IBIT entries for September 30: net outflow of $9.5 million. The previously reported FBTC is net outflow of $125.6 million, and BITB is net outflow of $13.6 million; the page’s total column now shows net outflow of $148.7 million. On September 29, the total column was still net inflow of $66.2 million. Here I’m only saying what the “Farside page currently displays,” not claiming that the final subscription/redemption data for all issuers won’t be revised. Also, the 0.0 values for other products in the table aren’t worth interpreting as proof that every institution had no trading.
More important than the numbers themselves is the structure: the first three items were all negative. Even IBIT—which previously helped drive inflows—turned into a small outflow, indicating that the fund buying on that day at month-end was indeed weaker than it was last week. Binance OTC’s weekly observation released today described recent ETF inflows as “positive but slowing,” suggesting more could be absorbing sell pressure. But that was an exchange desk analysis written during the data update process; you can’t treat it as a substitute for the final September 30 settlement. My independent judgment is: negative fund flows won’t mechanically make the spot price drop immediately, and spot could also rise due to short-covering or other off-exchange buying. However, if the next two consecutive days are negative and the price still can’t reclaim the prior high, the rebound quality will clearly decline.
The market reaction has two sides. In Binance BTCUSDT queries, it’s around $84,316, up about 1.04% over 24 hours. The past 24 hours’ high was $85,650 and the low was $82,956. On the plaza, #BitcoinClears$85200 is still on the hot list—about a real intraday breakout that happened. It doesn’t mean the current price is still holding above $85,200. The ETF fund records correspond to the U.S. trading day of September 30, while the current price corresponds to this moment—these aren’t on the same clock. I also won’t say this outflow “caused” every single candlestick. First, look to see whether 85,200—85,650 can regain and hold. Below, watch 83,800 first, then around 83,000. If the next round of ETF fund data turns back to net inflow and spot volume recovers 85,650, that would overturn my cautious judgment. If it breaks below 83,000 and the retest fails, then the bullish plan fails.
If this were my own trading: I wouldn’t chase the price. I’d only consider a small long position in the spot, risking at most 2% of total funds per trade. The entry triggers are: after a pullback to 83,800—84,100, reclaim above 84,300; or, alternatively, a breakout above 85,650 with volume, followed by a retest that doesn’t break. You execute only one of the two. First target: 85,200 minus one-third. Second target: 85,650 minus another one-third. The remaining position would look toward 87,000, protected with a moving take-profit. If you choose the breakout plan, the first target becomes 87,000 and you reduce positions in batches accordingly. Place one unified stop-loss about 1% below the trigger level; the account’s pre-set maximum loss would not exceed 0.3%. If the daily closes below 83,000, the fund situation keeps worsening, or after a breakout the price quickly falls back into the range, I’ll主动平仓 (close positions early). If conditions aren’t met, I’ll keep the account in cash—don’t write the plan as an order.
Source: Farside BTC daily fund table; Binance OTC October 1 weekly observation; Binance BTCUSDT market snapshot. #BitcoinClears$85200 #BTC
The above is only personal market observation and does not constitute investment advice.

9
Log in to explore more content
Join global crypto users on Binance Square
⚡️ Get latest and useful information about crypto.
💬 Trusted by the world’s largest crypto exchange.
👍 Discover real insights from verified creators.
Email / Phone number
Trending Topics
1
#NFPWatch
10.6M views
18,226 Discussing
2
#BitcoinFundingRateTriplesTo10%
26,748 views
460 Discussing
3
#BitcoinSurpasses$86KUp2.99%
8,335 views
53 Discussing
4
#ZcashFalls21%FromSeptemberPeak
23,896 views
419 Discussing
5
#USSeptemberPayrollsAdd29KUnemploymentRises4.2%
18,232 views
225 Discussing
6
#XRPPostsFirstThreeGreenMonthsInQ3
21,323 views
426 Discussing
7
#BNBChainTokenizedStocksTop$1BAt30%Share
912 views
26 Discussing
8
#BitcoinRisesToward$85K
63,674 views
130 Discussing
9
#AmazonPlansToSell$8BNvidiaChips
6,339 views
82 Discussing
10
#NEARFallsToAround$4.70Down14%
42,088 views
107 Discussing