

#moodysassignsrlusda2longtermdepositrating
moodysassignsrlusda2longtermdepositrating
Hot
Latest

Verified
#moodysassignsrlusda2longtermdepositrating
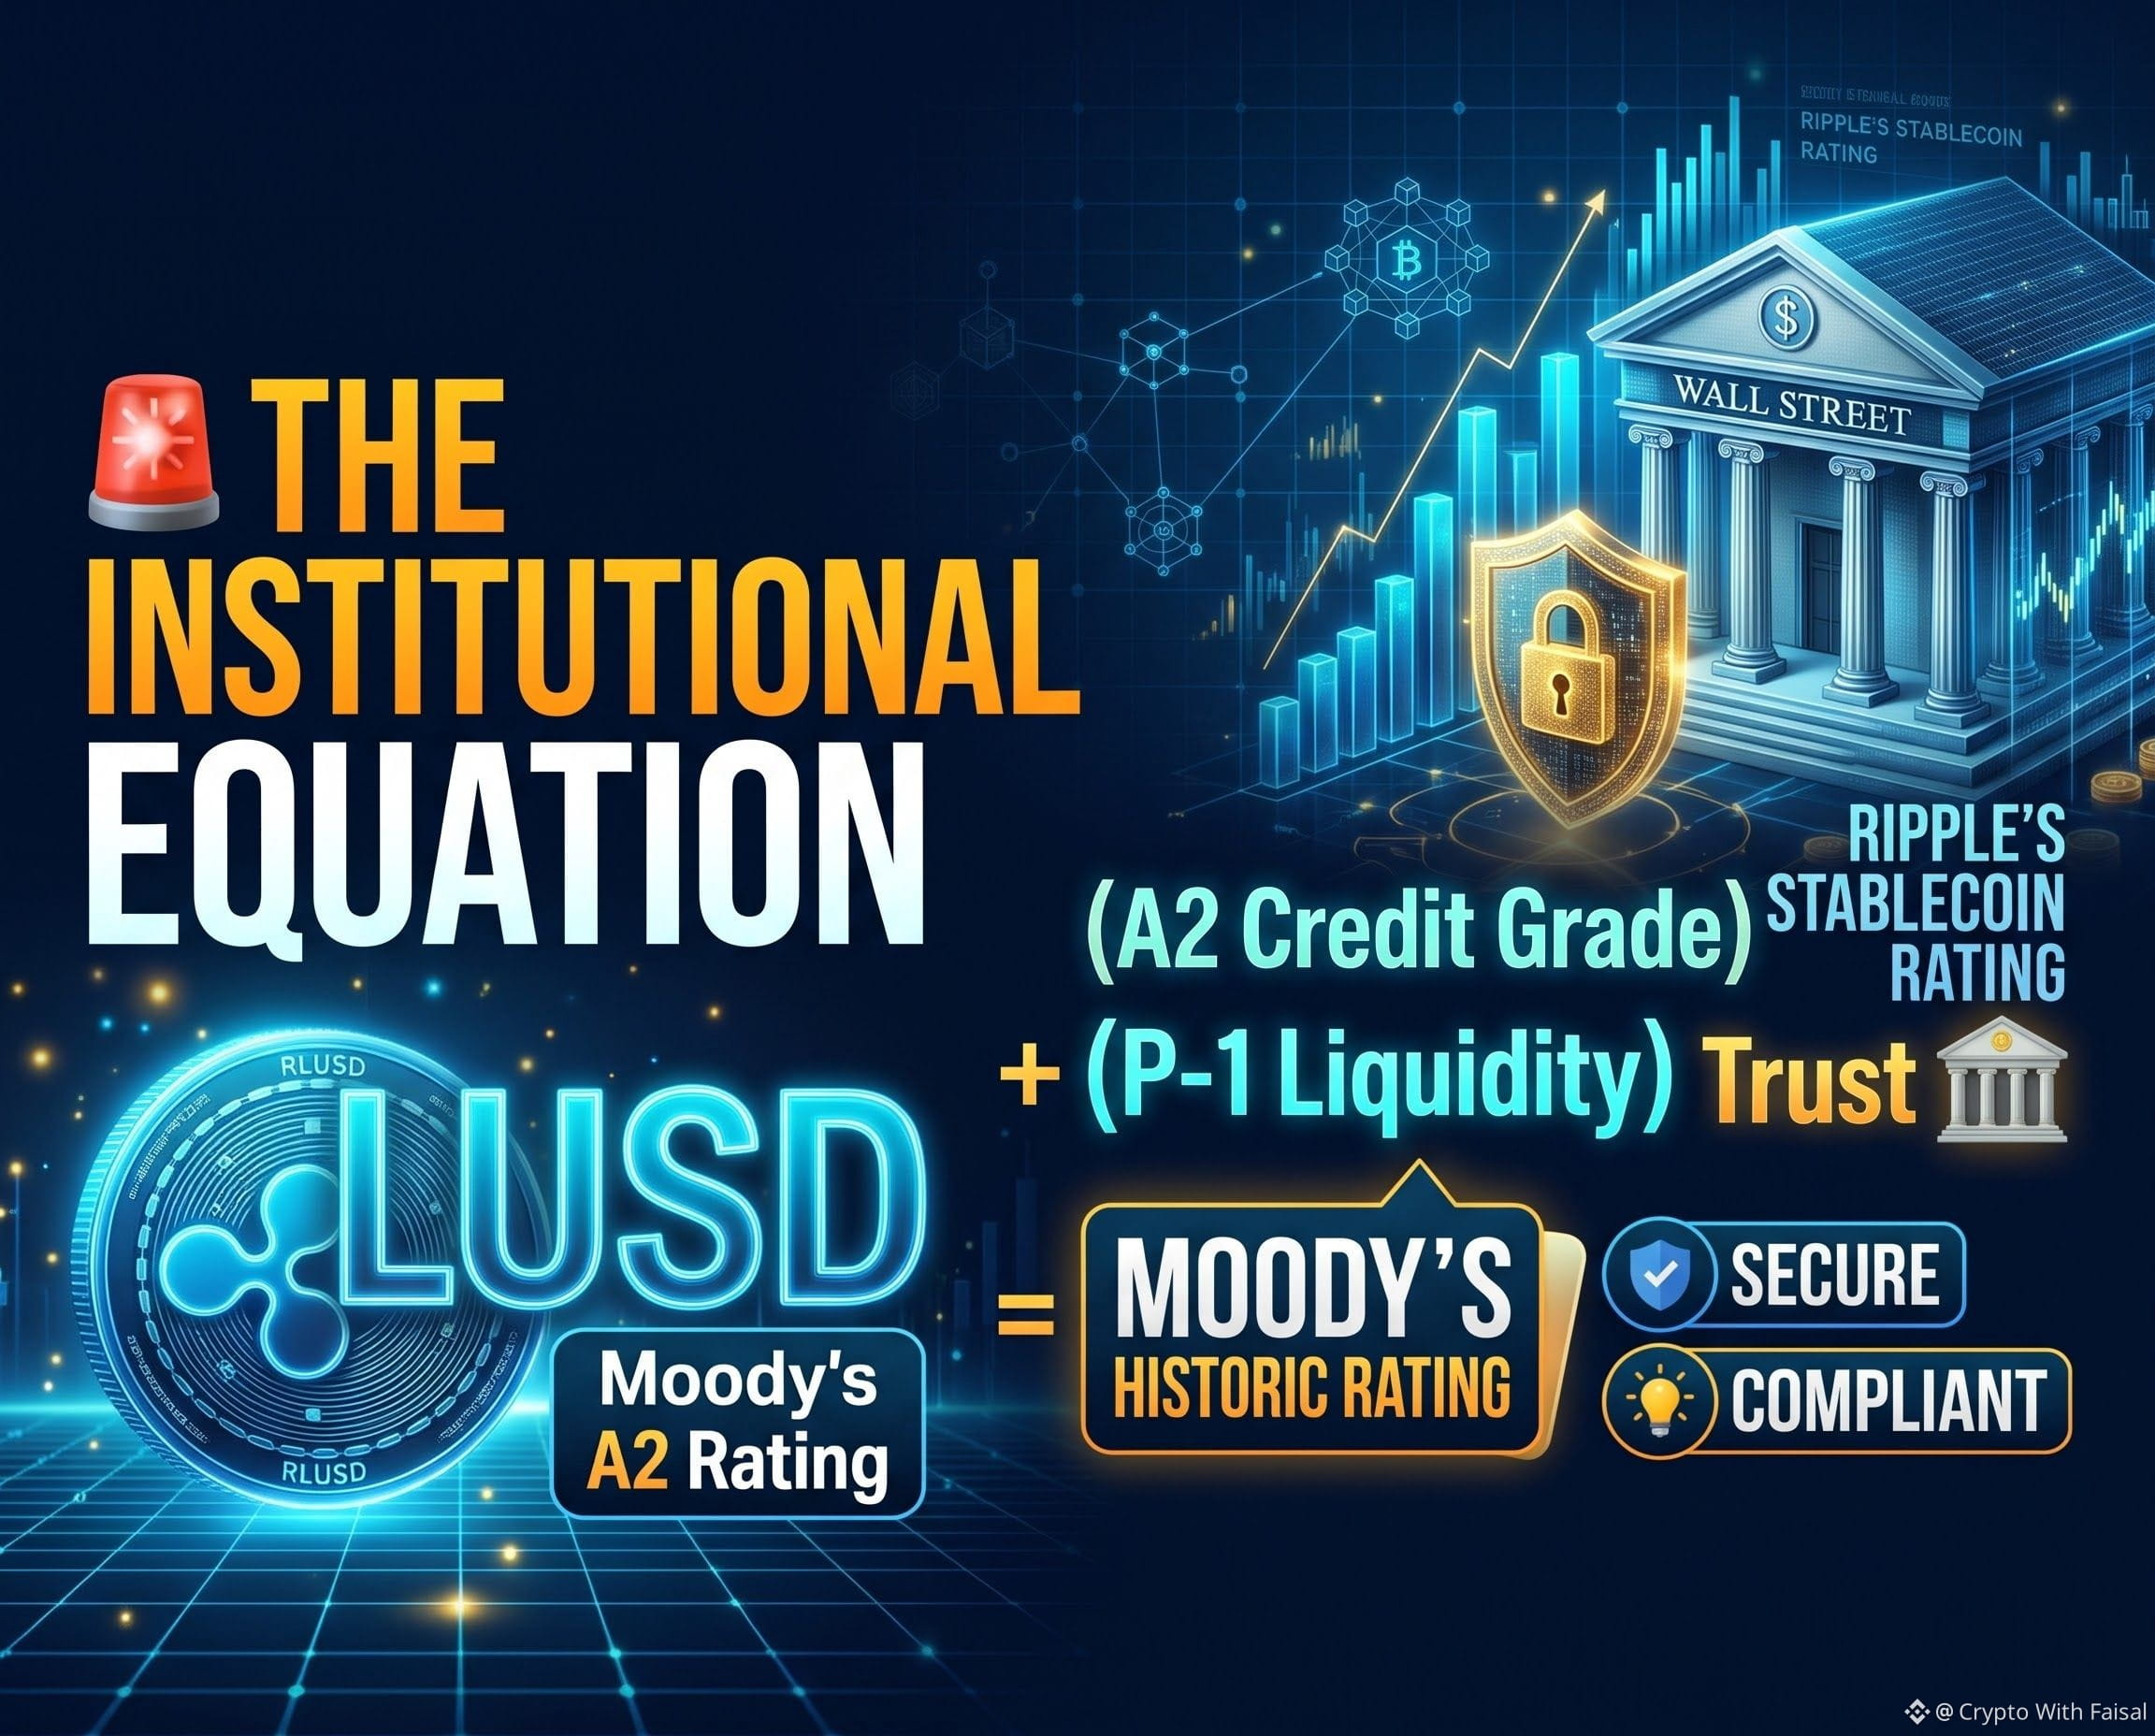
🚨 THE INSTITUTIONAL EQUATION: RIPPLE'S STABLECOIN RATING 🚨
A massive milestone just legitimized the stablecoin sector for Wall Street! Let’s break down Moody's latest move on Ripple's RLUSD using pure math 🧮👇
(A2 Credit Grade) + (P-1 Liquidity) = Institutional Trust 🏦
Here is the exact formula behind this historic regulatory win:
The Credit Input:
(The Rating) = Moody's has officially assigned Ripple's native RLUSD stablecoin an A2 long-term deposit rating and a P-1 short-term rating. This marks one of the first formal credit ratings ever issued for a blockchain-native stablecoin.
The Key Deliverable:
(Risk Mitigation) ➔ An A2 rating signals low long-term credit risk, while P-1 proves top-tier short-term liquidity. Moody's cited RLUSD's highly liquid reserves and strict redemption controls as the primary drivers, while also factoring in protections against issuer bankruptcy.
The Breakdown:
Traditional finance requires standardized risk metrics before deploying billions in capital. By securing a prime-grade rating from a "Big Three" agency, Ripple is aggressively positioning RLUSD (operating on both the XRP Ledger and Ethereum) as the ultimate institutional-grade digital dollar. This directly challenges existing stablecoin monopolies by offering TradFi players a heavily vetted, compliant alternative for cross-border settlements and DeFi yield generation.
Will RLUSD eventually flip USDTandUSDC? Let's debate! 👇💬
$XRP
{future}(XRPUSDT)
#RLUSD #XRP #Stablecoins #Ripple
#moodysassignsrlusda2longtermdepositrating
🚨 THE INSTITUTIONAL EQUATION: RIPPLE'S STABLECOIN RATING 🚨
A massive milestone just legitimized the stablecoin sector for Wall Street! Let’s break down Moody's latest move on Ripple's RLUSD using pure math 🧮👇
(A2 Credit Grade) + (P-1 Liquidity) = Institutional Trust 🏦
Here is the exact formula behind this historic regulatory win:
The Credit Input:
(The Rating) = Moody's has officially assigned Ripple's native RLUSD stablecoin an A2 long-term deposit rating and a P-1 short-term rating. This marks one of the first formal credit ratings ever issued for a blockchain-native stablecoin.
The Key Deliverable:
(Risk Mitigation) ➔ An A2 rating signals low long-term credit risk, while P-1 proves top-tier short-term liquidity. Moody's cited RLUSD's highly liquid reserves and strict redemption controls as the primary drivers, while also factoring in protections against issuer bankruptcy.
The Breakdown:
Traditional finance requires standardized risk metrics before deploying billions in capital. By securing a prime-grade rating from a "Big Three" agency, Ripple is aggressively positioning RLUSD (operating on both the XRP Ledger and Ethereum) as the ultimate institutional-grade digital dollar. This directly challenges existing stablecoin monopolies by offering TradFi players a heavily vetted, compliant alternative for cross-border settlements and DeFi yield generation.
Will RLUSD eventually flip USDTandUSDC? Let's debate! 👇💬
$XRP
#RLUSD #XRP #Stablecoins #Ripple
1
1.5k

·
--
#moodysassignsrlusda2longtermdepositrating
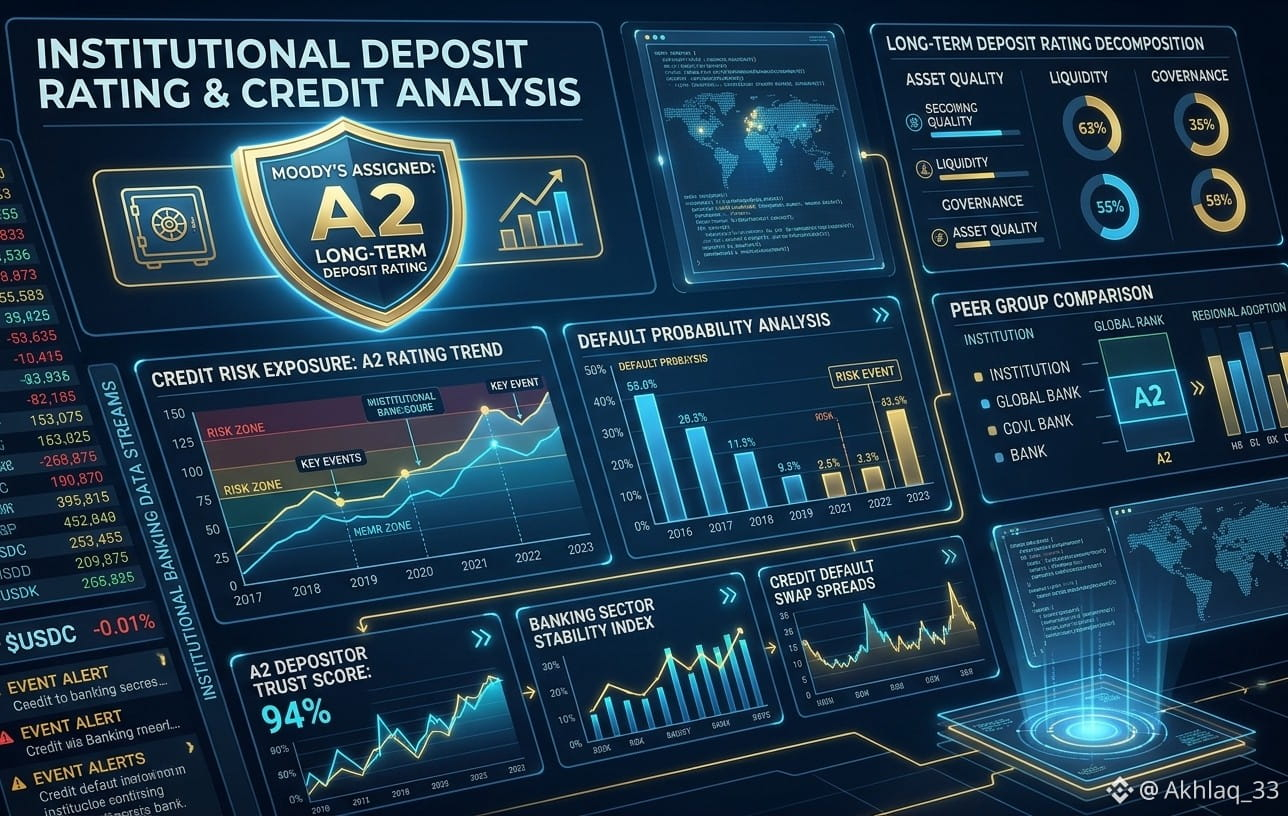
🏛️ Institutional Credit Integrity: Moody’s Assigns A2 Long-Term Deposit Ratings! 📊
As traditional finance and digital asset rails continue to converge, institutional-grade creditworthiness and risk assessment have never been more critical for long-term stability.
Here is what you need to know about recent benchmark credit actions:
The Rating Definition: An A2 long-term rating from Moody's places financial institutions and digital-asset-backed structures firmly in the upper-medium grade category, reflecting low credit risk and robust balance sheet resilience.
The Stability Factor: Rating actions and assigned deposit outlooks (such as recent stable affirmations across major international banking and structured finance vehicles) provide institutional participants with the confidence required for large-scale capital deployment.
Why It Matters for Web3: As regulated institutions, tokenized funds, and stablecoin-backed yield products integrate into mainstream finance, clear third-party credit ratings bridge the gap between traditional banking compliance and decentralized liquidity.
My Take: Robust credit frameworks and transparent ratings are essential building blocks for bringing institutional capital safely into the digital asset ecosystem. Trust and compliance are paving the way for the next wave of adoption.
👇 How important do you think traditional credit metrics and institutional ratings are for the future growth of crypto and tokenized finance? Drop your thoughts below! 💬
#CreditRating #TradFiVsDeFi #Institution #BinanceSquare $NVDAB $AAPLB
1
339

·
--
Verified
#moodysassignsrlusda2longtermdepositrating
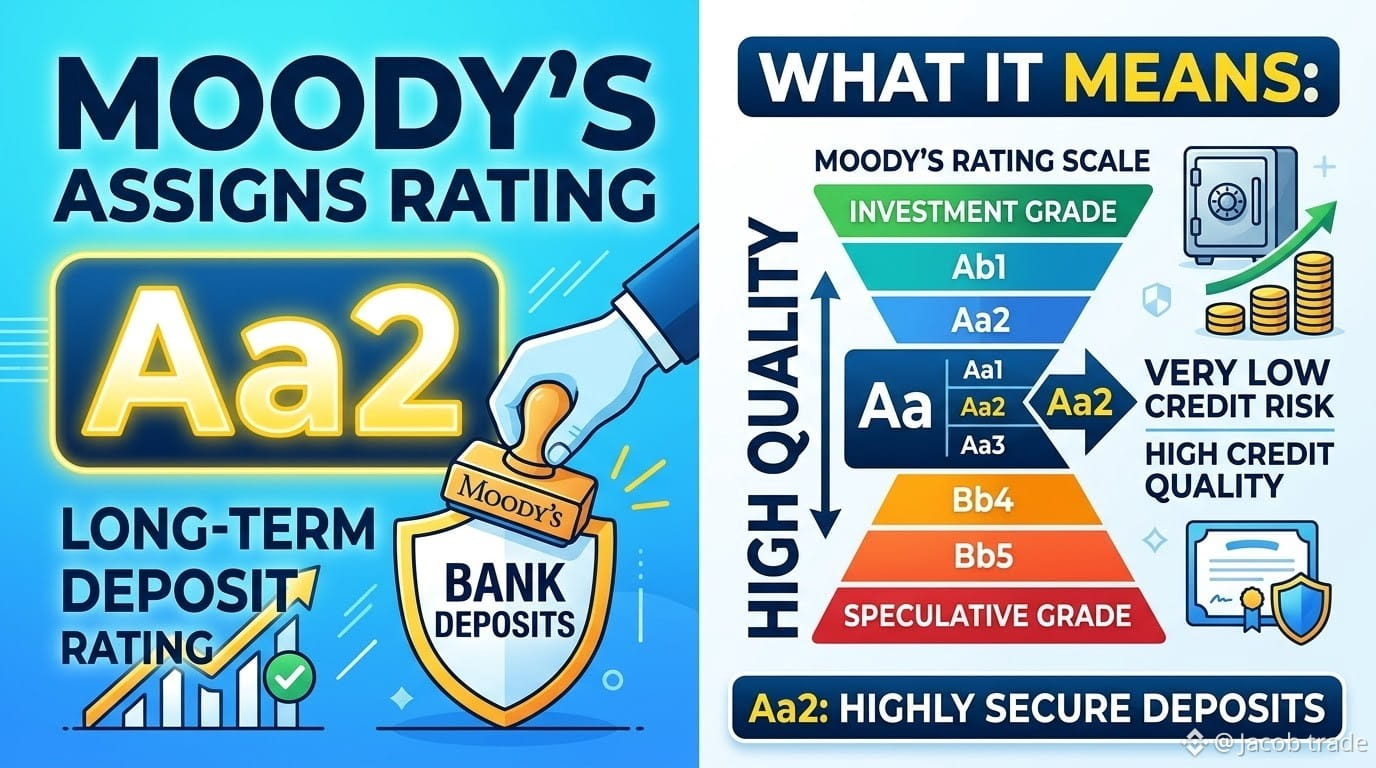
Institutional Credit Integrity: Moody’s Assigns A2 Long-Term Deposit Ratings! 📊
As traditional finance and digital asset infrastructure continue to converge, institutional-grade creditworthiness and risk assessment have never been more crucial to ensuring long-term stability.
Here’s what you need to know about recent benchmark rating decisions:
Rating definition: A long-term A2 rating assigned by Moody’s places financial institutions and digital asset-backed structures in the upper-medium-grade category, reflecting low credit risk and strong balance sheets.
Stability factor: Deposit ratings and outlooks (such as recent confirmations of stable outlooks for major international banks and structured finance vehicles) give institutional players the confidence they need to deploy capital at scale.
Why this matters for Web3: As regulated institutions, tokenized funds, and stablecoin-backed yield products integrate with traditional finance, clear, independent credit ratings bridge the gap between traditional banking compliance requirements and decentralized liquidity.
My take: Strong credit frameworks and transparent ratings are essential to enabling institutional capital to safely enter the digital asset ecosystem. Trust and compliance pave the way for the next wave of adoption.
👇 How important do you think traditional credit indicators and institutional ratings will be to the future growth of crypto and tokenized finance?
$EVAA
{future}(EVAAUSDT)
$BEAT
{future}(BEATUSDT)
$BTW
{future}(BTWUSDT)
#moodysassignsrlusda2longtermdepositrating
Institutional Credit Integrity: Moody’s Assigns A2 Long-Term Deposit Ratings! 📊
As traditional finance and digital asset infrastructure continue to converge, institutional-grade creditworthiness and risk assessment have never been more crucial to ensuring long-term stability.
Here’s what you need to know about recent benchmark rating decisions:
Rating definition: A long-term A2 rating assigned by Moody’s places financial institutions and digital asset-backed structures in the upper-medium-grade category, reflecting low credit risk and strong balance sheets.
Stability factor: Deposit ratings and outlooks (such as recent confirmations of stable outlooks for major international banks and structured finance vehicles) give institutional players the confidence they need to deploy capital at scale.
Why this matters for Web3: As regulated institutions, tokenized funds, and stablecoin-backed yield products integrate with traditional finance, clear, independent credit ratings bridge the gap between traditional banking compliance requirements and decentralized liquidity.
My take: Strong credit frameworks and transparent ratings are essential to enabling institutional capital to safely enter the digital asset ecosystem. Trust and compliance pave the way for the next wave of adoption.
👇 How important do you think traditional credit indicators and institutional ratings will be to the future growth of crypto and tokenized finance?
$EVAA
$BEAT
$BTW
1.2k


·
--
Bullish
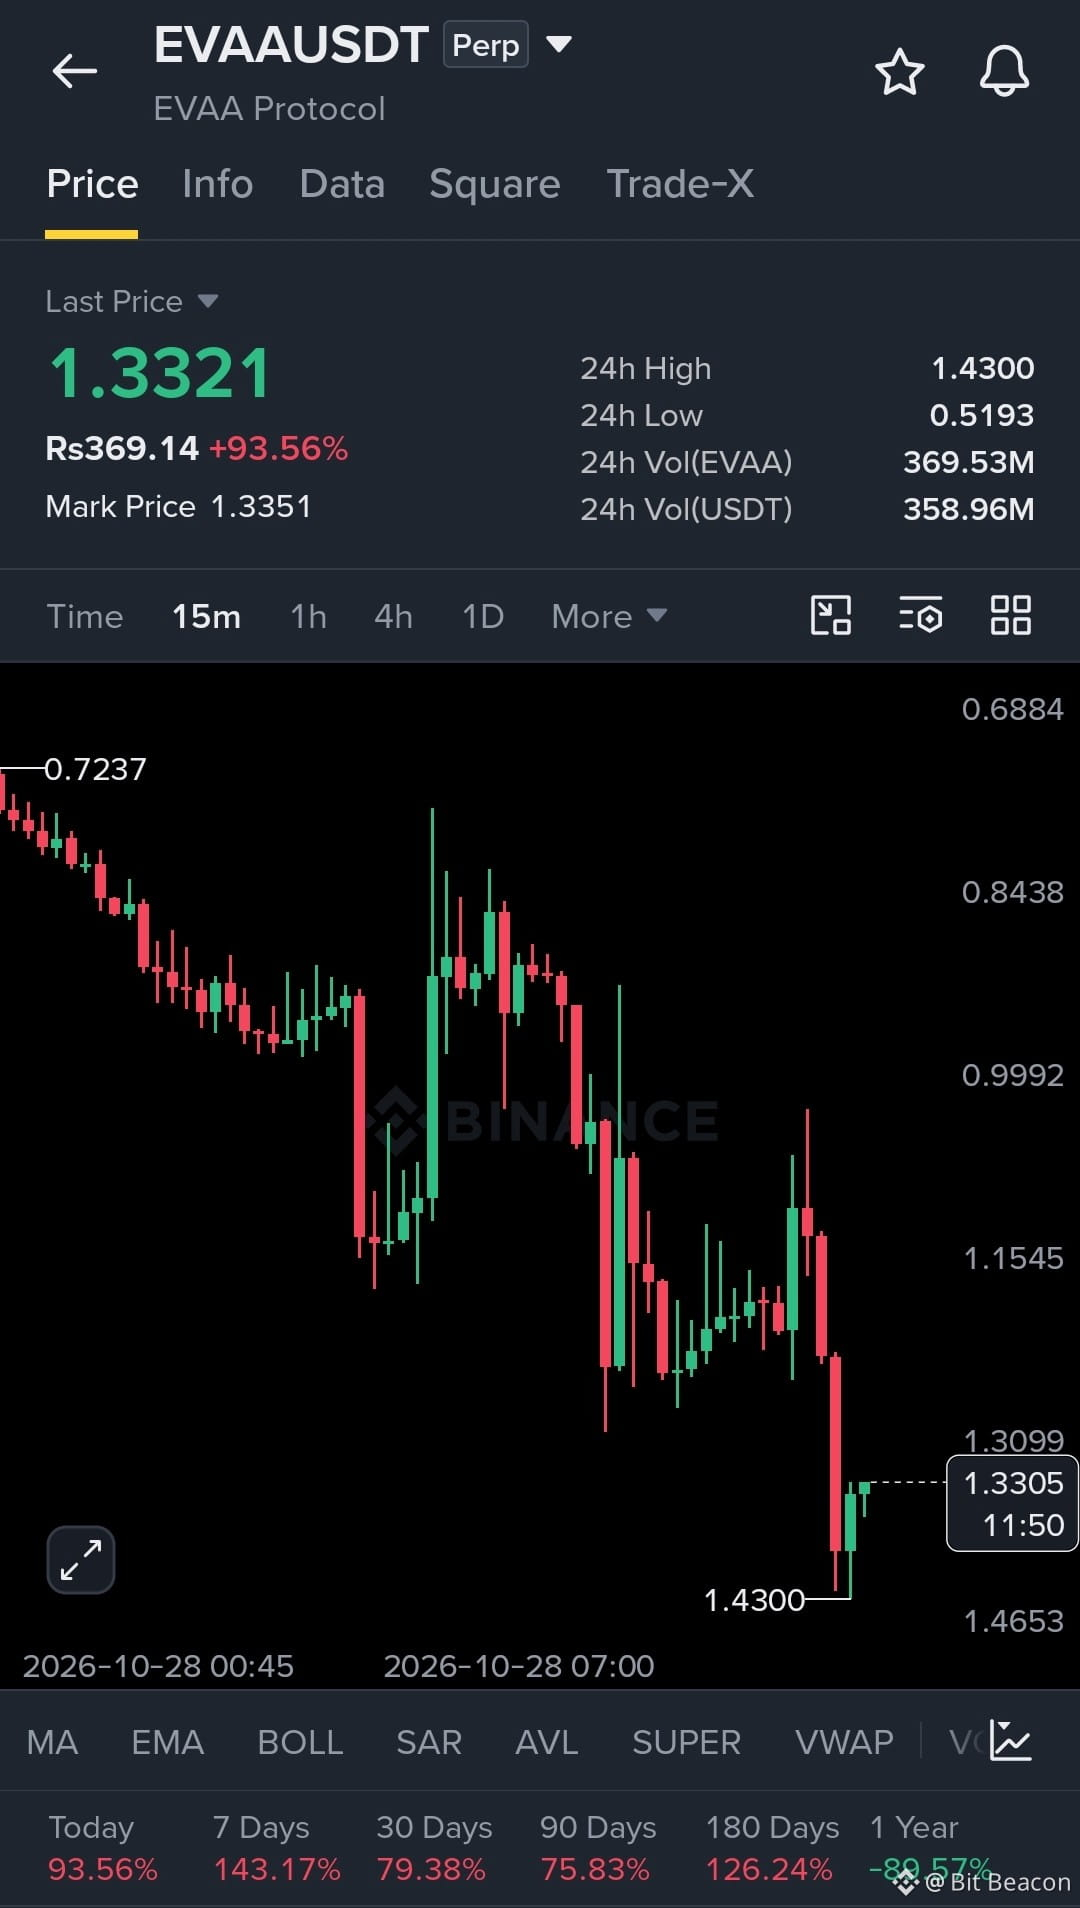
$EVAA USDT — Momentum is explosive, but sellers are still defending higher levels after the sharp rejection from 1.4300. Looking for a controlled rebound and resistance reclaim before the next move.
Entry: 1.3000–1.3300
Stop Loss: 1.2700
TP1: 1.3700
TP2: 1.4100
TP3: 1.4500
Volume is elevated, but volatility is extreme after the massive run-up. Watch for buyer strength around the entry zone and avoid chasing if price loses support. A clean reclaim of resistance is key to bullish continuation.
Risk managed. Eyes on the targets. Let's go $EVAA
{future}(EVAAUSDT)
#CanMicrosoftDeliverOnAI #EarningsSeason #CanGoogleDefindItsCore #FOMCWatch #MoodysAssignsRLUSDA2LongTermDepositRating
$EVAA USDT — Momentum is explosive, but sellers are still defending higher levels after the sharp rejection from 1.4300. Looking for a controlled rebound and resistance reclaim before the next move.
Entry: 1.3000–1.3300
Stop Loss: 1.2700
TP1: 1.3700
TP2: 1.4100
TP3: 1.4500
Volume is elevated, but volatility is extreme after the massive run-up. Watch for buyer strength around the entry zone and avoid chasing if price loses support. A clean reclaim of resistance is key to bullish continuation.
Risk managed. Eyes on the targets. Let's go $EVAA
#CanMicrosoftDeliverOnAI #EarningsSeason #CanGoogleDefindItsCore #FOMCWatch #MoodysAssignsRLUSDA2LongTermDepositRating
1
324

·
--
-🚀 TOP 3 CRYPTO GAINERS: WHAT’S NEXT?
🔥 $EVAA USDT (+126.67%) Price: $1.1796 Buy Zone: $1.08–$1.13 🎯 T1: $1.23 | T2: $1.30 | T3: $1.40 🛑 Stop Loss: $1.03
⚡ $APR USDT (+48.62%) Price: $0.05114 Buy Zone: $0.0485–$0.0500 🎯 T1: $0.053 | T2: $0.056 | T3: $0.060 🛑 Stop Loss: $0.0465
🔥 $XAN USDT (+45.69%) Price: $0.011441 Buy Zone: $0.0108–$0.0111 🎯 T1: $0.0119 | T2: $0.0125 | T3: $0.0132 🛑 Stop Loss: $0.0103
My Strategy: Wait for a pullback and bullish confirmation before entering. Take partial profits at each target, use low leverage, and never chase a sudden pump. These levels are estimates, not guarantees. Protect your capital first!#OSMOPlansToBurn100MTokensFromCommunityPool #MoodysAssignsRLUSDA2LongTermDepositRating #FOMCWatch #CanMicrosoftDeliverOnAI
{future}(EVAAUSDT)
{future}(APRUSDT)
{future}(XANUSDT)
-🚀 TOP 3 CRYPTO GAINERS: WHAT’S NEXT?
🔥 $EVAA USDT (+126.67%) Price: $1.1796 Buy Zone: $1.08–$1.13 🎯 T1: $1.23 | T2: $1.30 | T3: $1.40 🛑 Stop Loss: $1.03
⚡ $APR USDT (+48.62%) Price: $0.05114 Buy Zone: $0.0485–$0.0500 🎯 T1: $0.053 | T2: $0.056 | T3: $0.060 🛑 Stop Loss: $0.0465
🔥 $XAN USDT (+45.69%) Price: $0.011441 Buy Zone: $0.0108–$0.0111 🎯 T1: $0.0119 | T2: $0.0125 | T3: $0.0132 🛑 Stop Loss: $0.0103
My Strategy: Wait for a pullback and bullish confirmation before entering. Take partial profits at each target, use low leverage, and never chase a sudden pump. These levels are estimates, not guarantees. Protect your capital first!#OSMOPlansToBurn100MTokensFromCommunityPool #MoodysAssignsRLUSDA2LongTermDepositRating #FOMCWatch #CanMicrosoftDeliverOnAI
1
516

🚨 WALL STREET WATCH | SNDK SHORTS UNDER FIRE! 🟢
💣 $176,000 SHORT LIQUIDATION — $1,373.05
SanDisk is back in the spotlight! A reported $176K in short positions has been liquidated around $1,373.05, putting traders on alert for a potential momentum shift in this high-volatility semiconductor stock.
━━━━━━━━━━━━━━━━━━
📊 THE NUMBERS THAT MATTER
🔹 Ticker: $SNDK
🔹 Asset: SanDisk Corporation
🔹 Reported Short Liquidation: $176,000
🔹 Alert Price: $1,373.05
🔹 Upcoming Catalyst: Earnings report expected October 29
📈 LATEST MARKET SNAPSHOT
💵 Recent close: $1,304.84
🟢 Daily increase: +$49.26 (+3.92%)
📊 After-hours reference: $1,309.79
━━━━━━━━━━━━━━━━━━
🎯 TRADE MAP | NEXT MOVE
🟢 BULLISH BREAKOUT
A sustained move above $1,369 could strengthen the recovery.
🚀 Target 1: $1,400
🚀 Target 2: $1,422
🚀 Target 3: $1,450
🔴 BEARISH REVERSAL
If momentum fades and support breaks, sellers could regain control.
⚠️ Support 1: $1,289
⚠️ Support 2: $1,252
⚠️ Support 3: $1,199
━━━━━━━━━━━━━━━━━━
🧠 MY MARKET VERDICT
Short-term bias: Cautiously bullish, but confirmation is essential.
A short squeeze can accelerate an upward move, yet the $1,373 area needs to be reclaimed before a stronger breakout case develops.
📌 Trading strategy:
✔️ Wait for price confirmation and strong volume.
✔️ Watch earnings volatility closely.
✔️ Define your stop-loss before entry.
❌ Avoid chasing a sudden price spike.
🔥 NEXT KEY EVENT: EARNINGS — OCTOBER 29!
Will SNDK reclaim $1,373, or will sellers reject the recovery?
#CanMicrosoftDeliverOnAI #CanGoogleDefindItsCore
#EarningsSeason
#FOMCWatch #MoodysAssignsRLUSDA2LongTermDepositRating
{stock_us}(WAL.US)
🚨 WALL STREET WATCH | SNDK SHORTS UNDER FIRE! 🟢
💣 $176,000 SHORT LIQUIDATION — $1,373.05
SanDisk is back in the spotlight! A reported $176K in short positions has been liquidated around $1,373.05, putting traders on alert for a potential momentum shift in this high-volatility semiconductor stock.
━━━━━━━━━━━━━━━━━━
📊 THE NUMBERS THAT MATTER
🔹 Ticker: $SNDK
🔹 Asset: SanDisk Corporation
🔹 Reported Short Liquidation: $176,000
🔹 Alert Price: $1,373.05
🔹 Upcoming Catalyst: Earnings report expected October 29
📈 LATEST MARKET SNAPSHOT
💵 Recent close: $1,304.84
🟢 Daily increase: +$49.26 (+3.92%)
📊 After-hours reference: $1,309.79
━━━━━━━━━━━━━━━━━━
🎯 TRADE MAP | NEXT MOVE
🟢 BULLISH BREAKOUT
A sustained move above $1,369 could strengthen the recovery.
🚀 Target 1: $1,400
🚀 Target 2: $1,422
🚀 Target 3: $1,450
🔴 BEARISH REVERSAL
If momentum fades and support breaks, sellers could regain control.
⚠️ Support 1: $1,289
⚠️ Support 2: $1,252
⚠️ Support 3: $1,199
━━━━━━━━━━━━━━━━━━
🧠 MY MARKET VERDICT
Short-term bias: Cautiously bullish, but confirmation is essential.
A short squeeze can accelerate an upward move, yet the $1,373 area needs to be reclaimed before a stronger breakout case develops.
📌 Trading strategy:
✔️ Wait for price confirmation and strong volume.
✔️ Watch earnings volatility closely.
✔️ Define your stop-loss before entry.
❌ Avoid chasing a sudden price spike.
🔥 NEXT KEY EVENT: EARNINGS — OCTOBER 29!
Will SNDK reclaim $1,373, or will sellers reject the recovery?
#CanMicrosoftDeliverOnAI #CanGoogleDefindItsCore
#EarningsSeason
#FOMCWatch #MoodysAssignsRLUSDA2LongTermDepositRating
SNDK+8.01%
WALUS-0.10%
6

·
--
Bullish
I’m watching $ETH closely 👀🔥 A $20.37K short liquidation near $2,360.19 caught my attention! If buyers keep pushing, ETH could attempt another leg higher. I’m waiting for confirmation before entering.
🟢 ETH/USDT — LONG WATCH
🎯 Entry Zone: $2,355–$2,365 🥇 TP1: $2,380 🥈 TP2: $2,400 🚀 TP3: $2,425 🛑 Stop Loss: $2,335
💡 Pro Tip: Watch volume and resistance for breakout confirmation. Short liquidations can fuel momentum, but reversals happen fast. Keep leverage low and protect your capital.
⚠️ Illustrative setup, not a live-verified signal. Check current market conditions before trading.
#CanGoogleDefindItsCore #EarningsSeason #FOMCWatch #MoodysAssignsRLUSDA2LongTermDepositRating #OSMOPlansToBurn100MTokensFromCommunityPool $ETH
{future}(ETHUSDT)
I’m watching $ETH closely 👀🔥 A $20.37K short liquidation near $2,360.19 caught my attention! If buyers keep pushing, ETH could attempt another leg higher. I’m waiting for confirmation before entering.
🟢 ETH/USDT — LONG WATCH
🎯 Entry Zone: $2,355–$2,365 🥇 TP1: $2,380 🥈 TP2: $2,400 🚀 TP3: $2,425 🛑 Stop Loss: $2,335
💡 Pro Tip: Watch volume and resistance for breakout confirmation. Short liquidations can fuel momentum, but reversals happen fast. Keep leverage low and protect your capital.
⚠️ Illustrative setup, not a live-verified signal. Check current market conditions before trading.
#CanGoogleDefindItsCore #EarningsSeason #FOMCWatch #MoodysAssignsRLUSDA2LongTermDepositRating #OSMOPlansToBurn100MTokensFromCommunityPool $ETH
18

·
--
Bullish
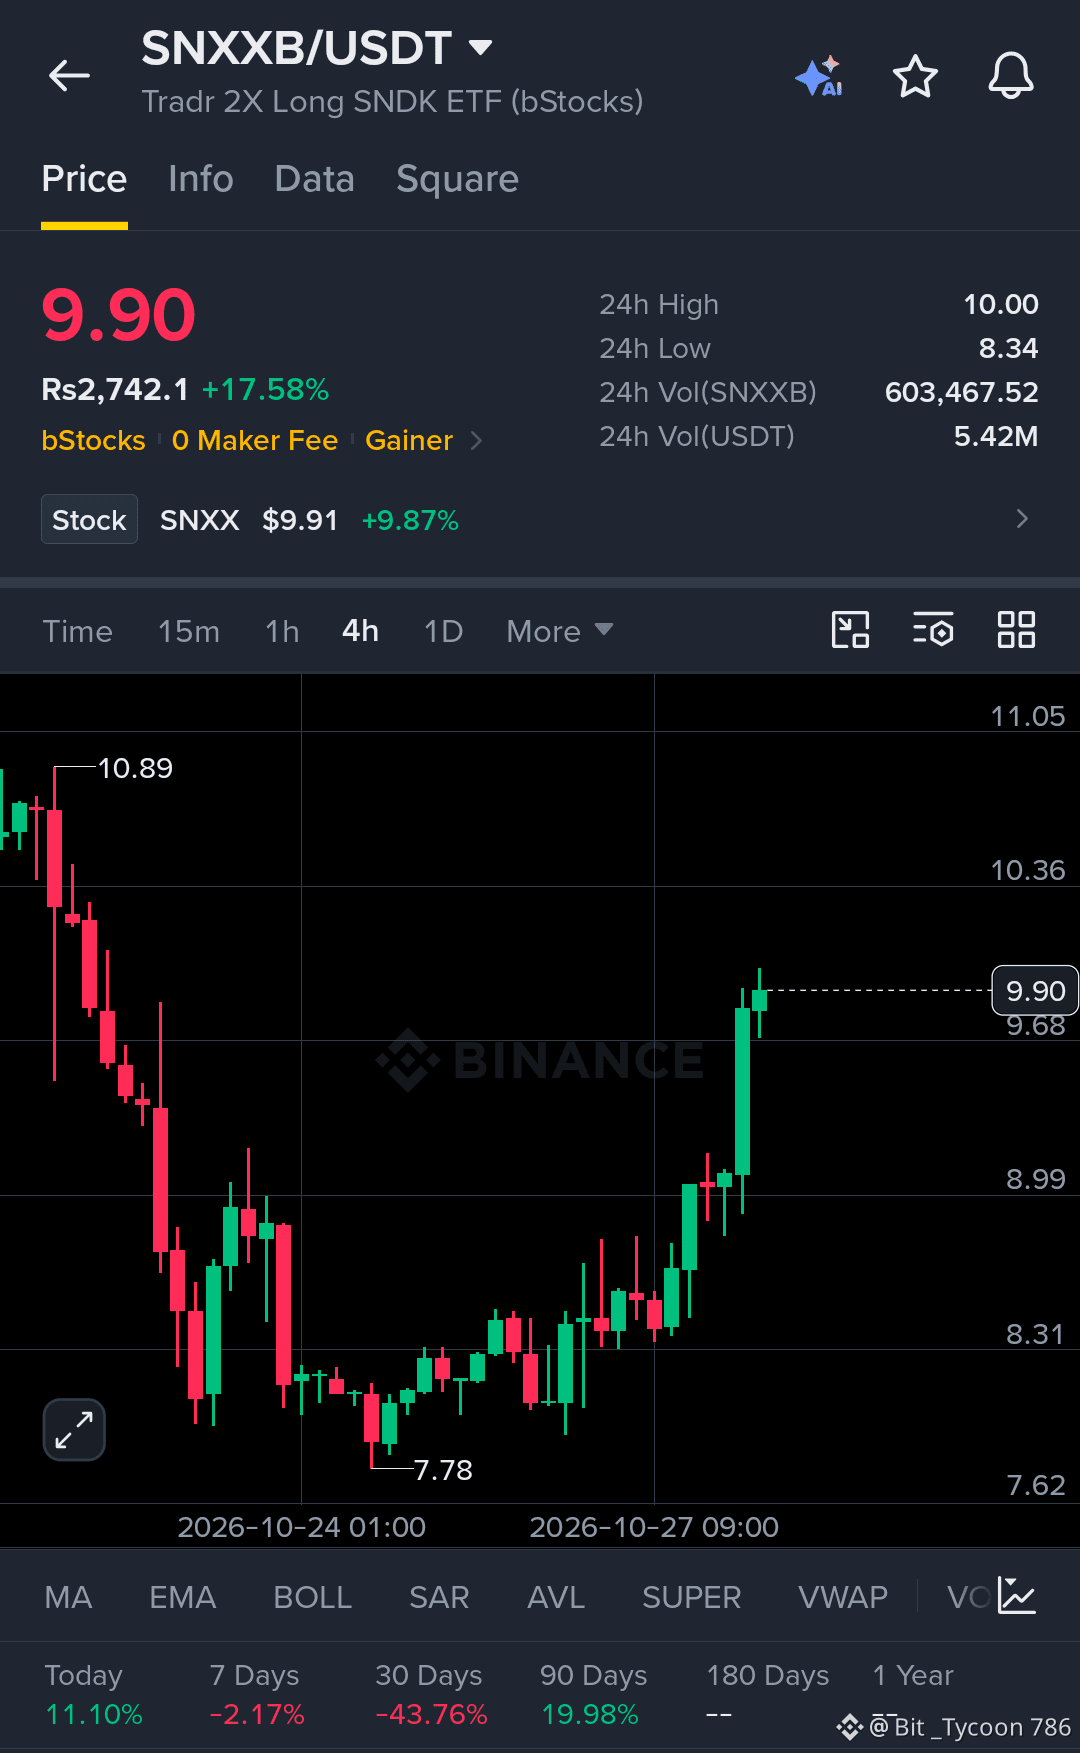
$SNXXB is showing a strong recovery after falling to the $7.78 area. The 4-hour chart now shows a sharp move toward $9.90, putting price close to the $10.00 resistance zone. Buyers have regained short-term momentum, but holding above the recent breakout area will be important for continuation.
The immediate level to watch is $9.68. If SNXXB maintains support above this zone, another attempt at $10.00 could follow, with a sustained break potentially opening room toward $10.36. However, rejection near $10.00 could trigger a pullback toward $9.00 or the $8.30 support region.
SNXXB is up 17.58% over 24 hours, with reported trading volume of 5.42 million USDT. The recovery is notable, but after such a steep move, confirmation matters more than chasing the current price. Watch the $9.68 support and $10.00 resistance for the next directional signal.
{spot}(SNXXBUSDT)
#CanMicrosoftDeliverOnAI #CanGoogleDefindItsCore #FOMCWatch #MoodysAssignsRLUSDA2LongTermDepositRating #OSMOPlansToBurn100MTokensFromCommunityPool
$SNXXB is showing a strong recovery after falling to the $7.78 area. The 4-hour chart now shows a sharp move toward $9.90, putting price close to the $10.00 resistance zone. Buyers have regained short-term momentum, but holding above the recent breakout area will be important for continuation.
The immediate level to watch is $9.68. If SNXXB maintains support above this zone, another attempt at $10.00 could follow, with a sustained break potentially opening room toward $10.36. However, rejection near $10.00 could trigger a pullback toward $9.00 or the $8.30 support region.
SNXXB is up 17.58% over 24 hours, with reported trading volume of 5.42 million USDT. The recovery is notable, but after such a steep move, confirmation matters more than chasing the current price. Watch the $9.68 support and $10.00 resistance for the next directional signal.
#CanMicrosoftDeliverOnAI #CanGoogleDefindItsCore #FOMCWatch #MoodysAssignsRLUSDA2LongTermDepositRating #OSMOPlansToBurn100MTokensFromCommunityPool
70

·
--
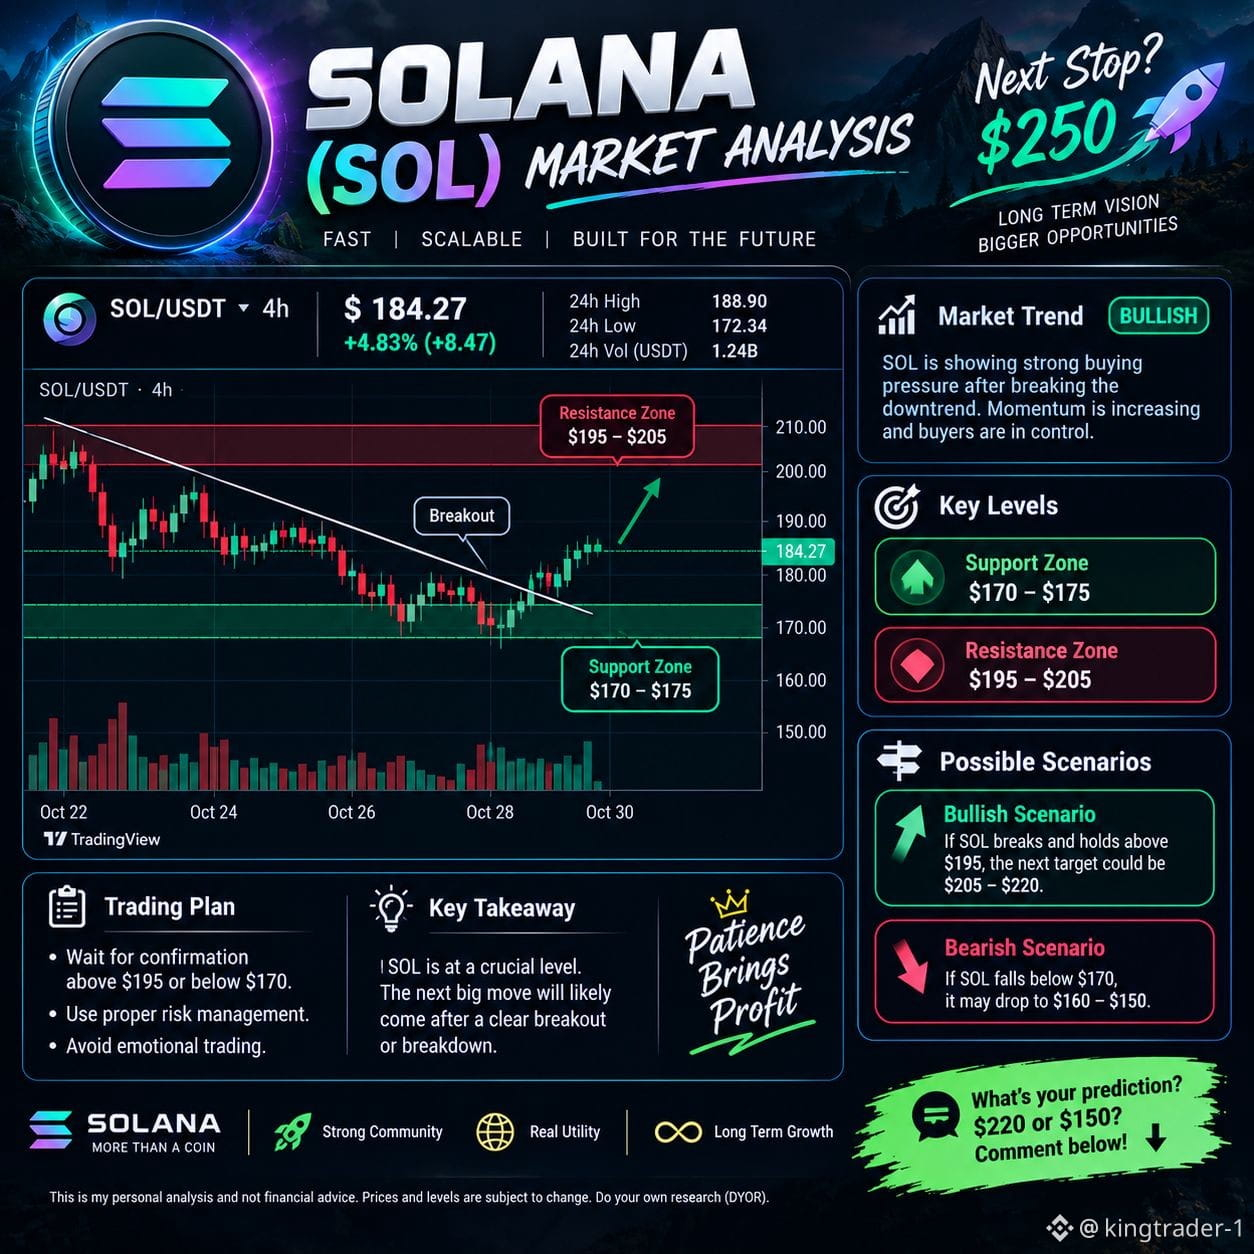
🚀 SOLANA ($SOL ) — BREAKOUT OR REVERSAL? 📊
🟢 Market Trend: Bullish momentum
💰 Price shown in chart: $184.27
🟢 Support Zone: $170–$175
🔴 Resistance Zone: $195–$205
📈 Bullish Scenario: If SOL breaks above $195 and holds, the next potential target is $205–$220.
📉 Bearish Scenario: If SOL drops below $170, the price could move toward $160–$150.
🎯 My View: SOL is approaching a key decision zone. Watch for confirmation before assuming the next move.
💬 Your prediction: SOL to $220 or down to $150? Comment below! 👇#MoodysAssignsRLUSDA2LongTermDepositRating
{spot}(SOLUSDT)
🚀 SOLANA ($SOL ) — BREAKOUT OR REVERSAL? 📊
🟢 Market Trend: Bullish momentum
💰 Price shown in chart: $184.27
🟢 Support Zone: $170–$175
🔴 Resistance Zone: $195–$205
📈 Bullish Scenario: If SOL breaks above $195 and holds, the next potential target is $205–$220.
📉 Bearish Scenario: If SOL drops below $170, the price could move toward $160–$150.
🎯 My View: SOL is approaching a key decision zone. Watch for confirmation before assuming the next move.
💬 Your prediction: SOL to $220 or down to $150? Comment below! 👇#MoodysAssignsRLUSDA2LongTermDepositRating
72

$AIN 🚀 AIN Crypto Analysis — 28 October 2026
Assuming you mean Infinity Ground (AIN), the AI-focused crypto token.
📊 Latest Market Outlook
🚀 Strong rally: AIN reportedly surged around 40.7% in 24 hours and 282.3% over seven days in a market report published today.
🧠 AI narrative: The project focuses on using AI to build applications and blockchain products.
🐂 Bullish momentum: Price has broken above several major daily moving averages, suggesting strong buying pressure.
⚠️ Correction risk: After such a rapid rise, profit-taking and sharp pullbacks are possible.$AIN
🎯 Key levels: Support near $0.1423; resistance near $0.1758. A breakout or breakdown needs confirmation.
📈 Upside watch: A sustained move above $0.1758 could strengthen the bullish setup, while a fall below $0.1423 may signal weakening momentum.$AIN
💡 Strategy: Watch volume, market sentiment, and project updates before entering a trade; AIN offers high-risk, high-volatility exposure, so use caution and do your own research.
#CanMicrosoftDeliverOnAI #CanGoogleDefindItsCore #MoodysAssignsRLUSDA2LongTermDepositRating #EarningsSeason #OSMOPlansToBurn100MTokensFromCommunityPool
{alpha}(560x9558a9254890b2a8b057a789f413631b9084f4a3)
$AIN 🚀 AIN Crypto Analysis — 28 October 2026
Assuming you mean Infinity Ground (AIN), the AI-focused crypto token.
📊 Latest Market Outlook
🚀 Strong rally: AIN reportedly surged around 40.7% in 24 hours and 282.3% over seven days in a market report published today.
🧠 AI narrative: The project focuses on using AI to build applications and blockchain products.
🐂 Bullish momentum: Price has broken above several major daily moving averages, suggesting strong buying pressure.
⚠️ Correction risk: After such a rapid rise, profit-taking and sharp pullbacks are possible.$AIN
🎯 Key levels: Support near $0.1423; resistance near $0.1758. A breakout or breakdown needs confirmation.
📈 Upside watch: A sustained move above $0.1758 could strengthen the bullish setup, while a fall below $0.1423 may signal weakening momentum.$AIN
💡 Strategy: Watch volume, market sentiment, and project updates before entering a trade; AIN offers high-risk, high-volatility exposure, so use caution and do your own research.
#CanMicrosoftDeliverOnAI #CanGoogleDefindItsCore #MoodysAssignsRLUSDA2LongTermDepositRating #EarningsSeason #OSMOPlansToBurn100MTokensFromCommunityPool

413

🚨 $MU SHORT SQUEEZE ALERT — BEARS UNDER PRESSURE! 🟢
💥 Micron Technology (#MU) just recorded a $109,000 short liquidation at $947.05 — a notable sign of pressure on bearish traders.
📊 LIQUIDATION BREAKDOWN
- 🟢 Event: Short positions liquidated
- 💰 Liquidation Value: $109K
- 🎯 Reported Price: $947.05
- ⚡ Market Signal: Potential bullish momentum if buyers maintain control
🔥 WHAT COULD HAPPEN NEXT?
If MU holds above the liquidation area and buying volume continues to build, another upward push could develop as remaining short sellers face pressure. However, if momentum fades and the price falls back below nearby support, a pullback or consolidation may follow.
🎯 PRO TRADER'S TAKE
Bias: Cautiously bullish — confirmation required.
Watch price action, trading volume, and nearby support and resistance before considering an entry. A short liquidation alone does not guarantee a continued rally.
#MU #Micron #StockMarket #ShortSqueeze #Liquidations #TradingSignals
#CanMicrosoftDeliverOnAI #CanGoogleDefindItsCore
#MoodysAssignsRLUSDA2LongTermDepositRating #FOMCWatch
{future}(MUUSDT)
🚨 $MU SHORT SQUEEZE ALERT — BEARS UNDER PRESSURE! 🟢
💥 Micron Technology (#MU) just recorded a $109,000 short liquidation at $947.05 — a notable sign of pressure on bearish traders.
📊 LIQUIDATION BREAKDOWN
- 🟢 Event: Short positions liquidated
- 💰 Liquidation Value: $109K
- 🎯 Reported Price: $947.05
- ⚡ Market Signal: Potential bullish momentum if buyers maintain control
🔥 WHAT COULD HAPPEN NEXT?
If MU holds above the liquidation area and buying volume continues to build, another upward push could develop as remaining short sellers face pressure. However, if momentum fades and the price falls back below nearby support, a pullback or consolidation may follow.
🎯 PRO TRADER'S TAKE
Bias: Cautiously bullish — confirmation required.
Watch price action, trading volume, and nearby support and resistance before considering an entry. A short liquidation alone does not guarantee a continued rally.
#MU #Micron #StockMarket #ShortSqueeze #Liquidations #TradingSignals
#CanMicrosoftDeliverOnAI #CanGoogleDefindItsCore
#MoodysAssignsRLUSDA2LongTermDepositRating #FOMCWatch
12

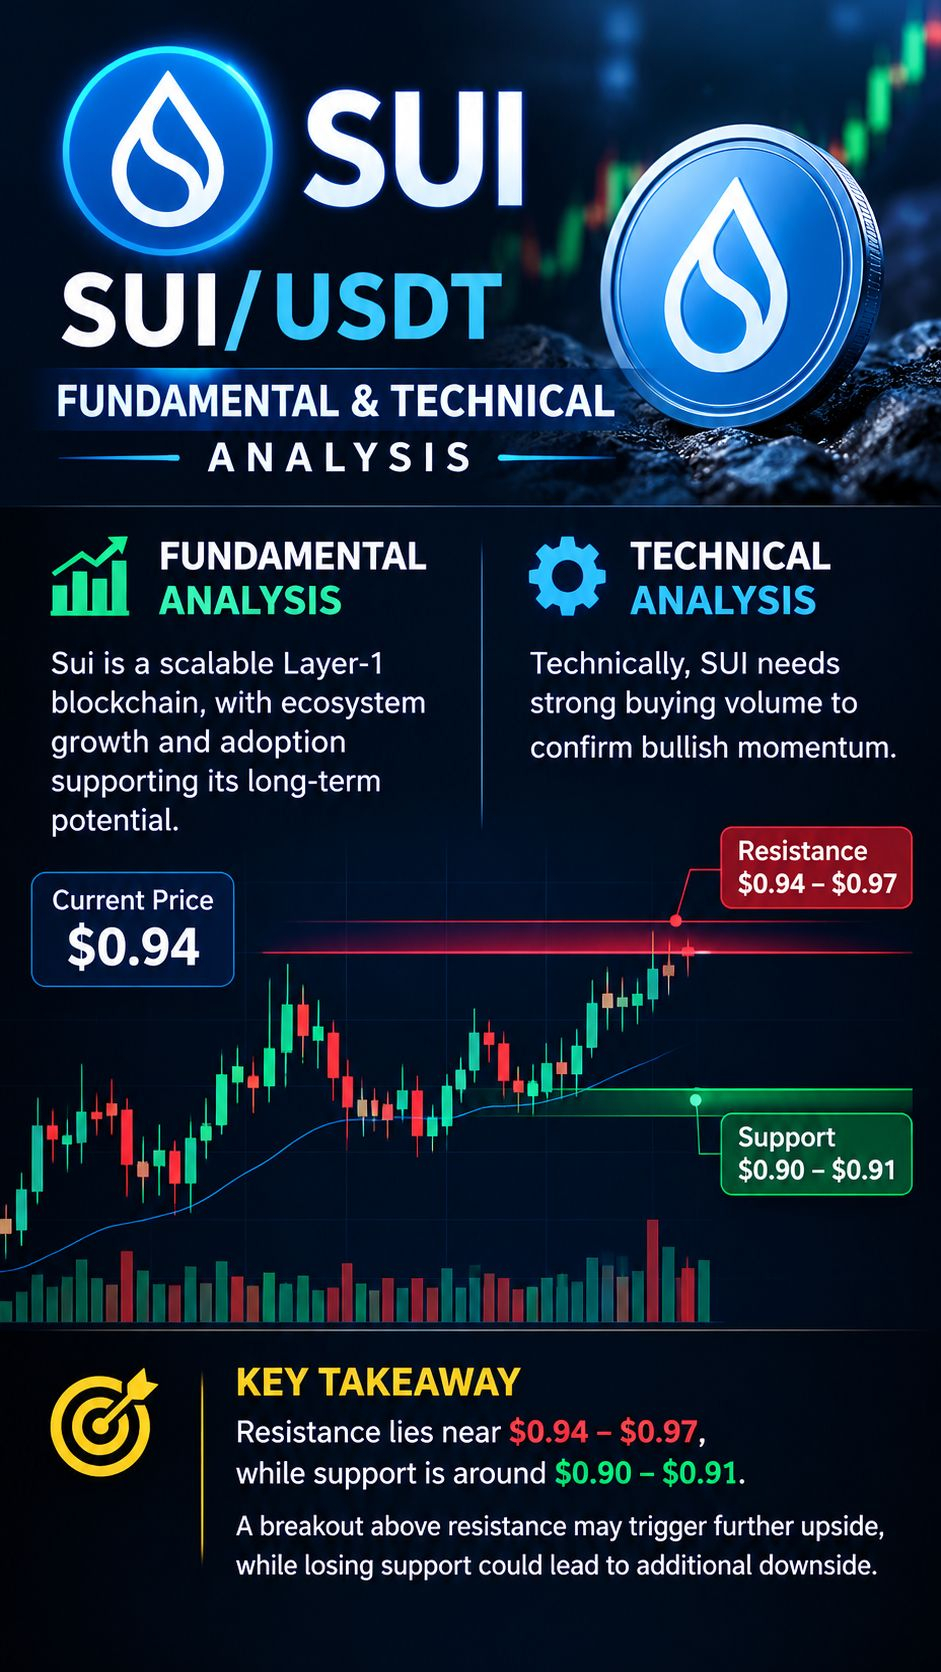
$SUI is a scalable Layer-1 blockchain, with ecosystem growth and adoption supporting its long-term potential. Technically, SUI needs strong buying volume to confirm bullish momentum. Resistance lies near $0.94–$0.97, while support is around $0.90–$0.91. A breakout above resistance may trigger further upside, while losing support could lead to additional downside.
{spot}(SUIUSDT)
#MoodysAssignsRLUSDA2LongTermDepositRating
$SUI is a scalable Layer-1 blockchain, with ecosystem growth and adoption supporting its long-term potential. Technically, SUI needs strong buying volume to confirm bullish momentum. Resistance lies near $0.94–$0.97, while support is around $0.90–$0.91. A breakout above resistance may trigger further upside, while losing support could lead to additional downside.
#MoodysAssignsRLUSDA2LongTermDepositRating
#MoodysAssignsRLUSDA2LongTermDepositRating
84
·
--
Bullish
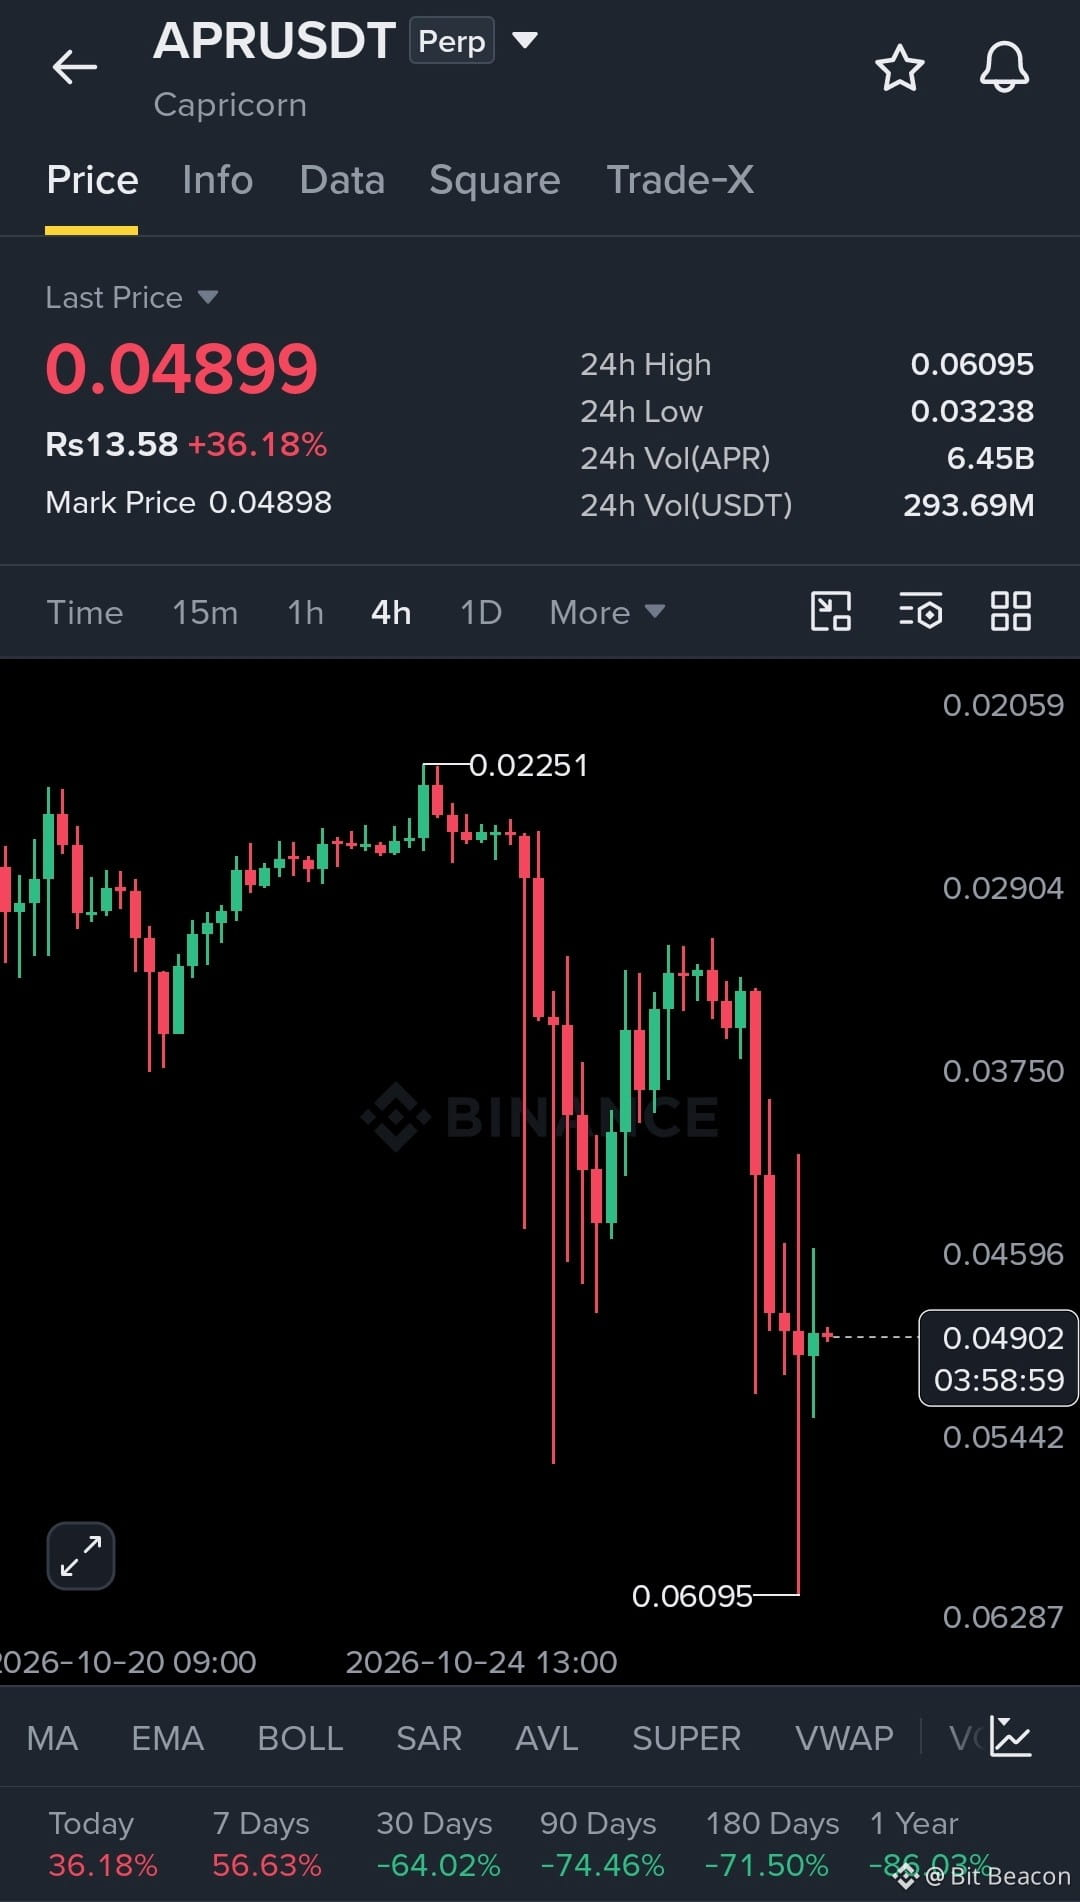
$APR USDT — Sharp volatility, strong volume expansion, and a potential rebound setup after a steep sell-off. Buyers need to reclaim resistance before bullish continuation gets confirmation.
Entry: 0.0475–0.0495
Stop Loss: 0.0450
TP1: 0.0520
TP2: 0.0560
TP3: 0.0600
APR is showing aggressive price movement, but the broader 4H structure remains volatile. A sustained move above 0.0500 could strengthen recovery momentum, while a loss of support risks another leg down. Wait for confirmation and manage leverage carefully.
Risk managed. Eyes on the targets. Let's go $APR
{future}(APRUSDT)
#CanMicrosoftDeliverOnAI #CanGoogleDefindItsCore #EarningsSeason #FOMCWatch #MoodysAssignsRLUSDA2LongTermDepositRating
$APR USDT — Sharp volatility, strong volume expansion, and a potential rebound setup after a steep sell-off. Buyers need to reclaim resistance before bullish continuation gets confirmation.
Entry: 0.0475–0.0495
Stop Loss: 0.0450
TP1: 0.0520
TP2: 0.0560
TP3: 0.0600
APR is showing aggressive price movement, but the broader 4H structure remains volatile. A sustained move above 0.0500 could strengthen recovery momentum, while a loss of support risks another leg down. Wait for confirmation and manage leverage carefully.
Risk managed. Eyes on the targets. Let's go $APR
#CanMicrosoftDeliverOnAI #CanGoogleDefindItsCore #EarningsSeason #FOMCWatch #MoodysAssignsRLUSDA2LongTermDepositRating
66

·
--
🚨 SNDK SHORT SQUEEZE ALERT — BEARS UNDER PRESSURE! ⚡
🟢 #SNDK Liquidated Short: $243K at $1,310.49
💥 The squeeze is heating up! A $243K short liquidation event at $1,310.49 signals that bearish traders are facing pressure as the price moves against their positions. If buying momentum continues, more short sellers could be forced to close, potentially adding fuel to an upside move.
📊 What Comes Next?
🟢 Bullish Scenario: If SNDK holds above $1,310 and builds stronger momentum, buyers may attempt to push the price toward higher resistance zones.
🔴 Bearish Scenario: If the price fails to sustain its strength, profit-taking could trigger a pullback and expose late buyers to downside risk.
🎯 Professional Trading View: Watch price action around $1,310.49 for confirmation. A sustained move higher with strong volume would favor bullish continuation, while rejection could signal a short-term reversal.
⚠️ Risk Management: Liquidations reveal leveraged positioning, not guaranteed future direction. Wait for confirmation, manage position size, and always use a clear stop-loss strategy.
🔥 Will SNDK extend the squeeze, or will sellers reclaim control?
#SNDK #StockMarket #TradingSignals #ShortSqueeze #MarketAnalysis
Add a clearer entry and invalidation plan
Tighten the post for faster mobile reading
Separate the liquidation fact from speculation
#MoodysAssignsRLUSDA2LongTermDepositRating #OSMOPlansToBurn100MTokensFromCommunityPool #CanGoogleDefindItsCore #CanMicrosoftDeliverOnAI #MoodysAssignsRLUSDA2LongTermDepositRating
{stock_us}(SNDK.US)
🚨 SNDK SHORT SQUEEZE ALERT — BEARS UNDER PRESSURE! ⚡
🟢 #SNDK Liquidated Short: $243K at $1,310.49
💥 The squeeze is heating up! A $243K short liquidation event at $1,310.49 signals that bearish traders are facing pressure as the price moves against their positions. If buying momentum continues, more short sellers could be forced to close, potentially adding fuel to an upside move.
📊 What Comes Next?
🟢 Bullish Scenario: If SNDK holds above $1,310 and builds stronger momentum, buyers may attempt to push the price toward higher resistance zones.
🔴 Bearish Scenario: If the price fails to sustain its strength, profit-taking could trigger a pullback and expose late buyers to downside risk.
🎯 Professional Trading View: Watch price action around $1,310.49 for confirmation. A sustained move higher with strong volume would favor bullish continuation, while rejection could signal a short-term reversal.
⚠️ Risk Management: Liquidations reveal leveraged positioning, not guaranteed future direction. Wait for confirmation, manage position size, and always use a clear stop-loss strategy.
🔥 Will SNDK extend the squeeze, or will sellers reclaim control?
#SNDK #StockMarket #TradingSignals #ShortSqueeze #MarketAnalysis
Add a clearer entry and invalidation plan
Tighten the post for faster mobile reading
Separate the liquidation fact from speculation
#MoodysAssignsRLUSDA2LongTermDepositRating #OSMOPlansToBurn100MTokensFromCommunityPool #CanGoogleDefindItsCore #CanMicrosoftDeliverOnAI #MoodysAssignsRLUSDA2LongTermDepositRating
SNDKUS+4.39%
1

·
--
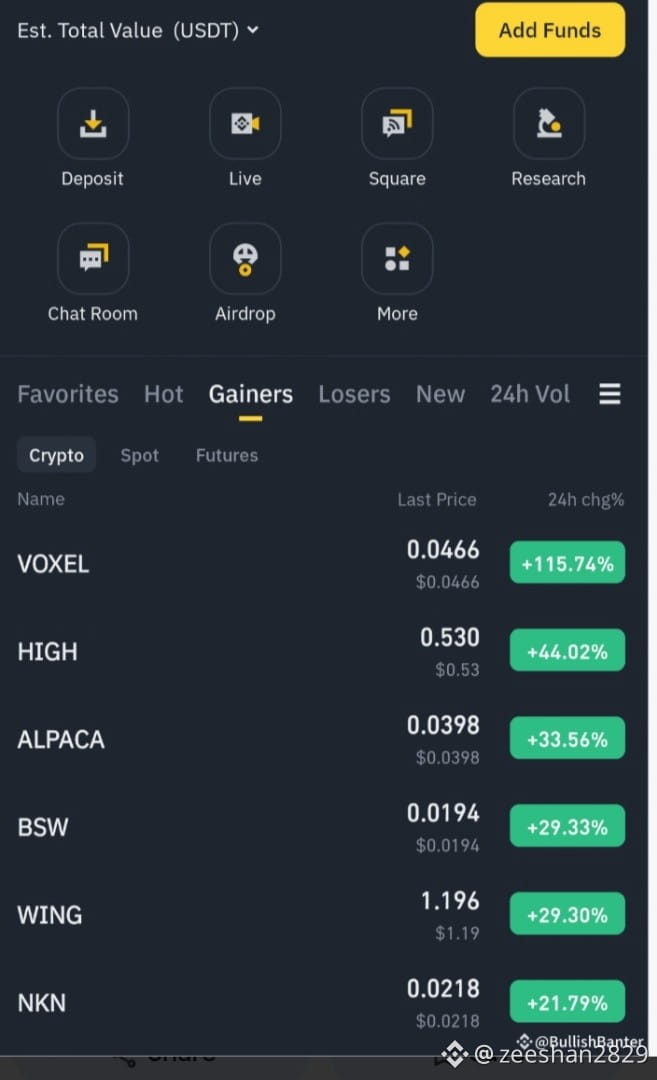
$VOXEL leads with an impressive +115.74%, followed by HIGH at +44.02% and $ALPACA at +33.56%. $BSW , WING, and NKN are also showing strong momentum. 🔥 These sharp rallies offer opportunities to watch, but sudden reversals remain possible. Monitor volume, support, and resistance before trading. FOLLOW ME NOW for daily crypto predictions, trending coins, and market insights! 💎 DYOR!#CanMicrosoftDeliverOnAI #EarningsSeason #MoodysAssignsRLUSDA2LongTermDepositRating
$VOXEL leads with an impressive +115.74%, followed by HIGH at +44.02% and $ALPACA at +33.56%. $BSW , WING, and NKN are also showing strong momentum. 🔥 These sharp rallies offer opportunities to watch, but sudden reversals remain possible. Monitor volume, support, and resistance before trading. FOLLOW ME NOW for daily crypto predictions, trending coins, and market insights! 💎 DYOR!#CanMicrosoftDeliverOnAI #EarningsSeason #MoodysAssignsRLUSDA2LongTermDepositRating
·
--
🚨 SNDK SHORT SQUEEZE ALERT — BEARS UNDER PRESSURE! 🟢
💥 Short Liquidation: $81.7K 🎯 Liquidation Price: $1,323.00
SNDK is delivering another warning to bearish traders! A $81.7K short liquidation at $1,323.00 highlights the risk of betting against a sudden upward move. When short positions get squeezed, buyers can gain momentum as forced closures add to the pressure.
📊 TRADER'S OUTLOOK — WHAT COMES NEXT?
🟢 Bullish Scenario: If SNDK holds above $1,323 and buying volume expands, another upward push could develop.
🔴 Bearish Scenario: If price fails to maintain momentum and slips back below this level, a pullback or consolidation may follow.
🎯 Key Signal: Watch price action around $1,323, trading volume, and the next candle confirmation before taking a position.
⚠️ Professional Risk Note: One liquidation event does not confirm a trend reversal. Wait for confirmation, manage leverage carefully, and always use a defined stop-loss.
#SNDK #ShortSqueeze #LiquidationAlert #TradingSignals #MarketWatch
Tighten the post for faster reading
Add a stronger action-focused opening
Make the outlook more technically precise
#EarningsSeason #MoodysAssignsRLUSDA2LongTermDepositRating #OSMOPlansToBurn100MTokensFromCommunityPool #CanGoogleDefindItsCore #CanMicrosoftDeliverOnAI
{future}(MUUSDT)
🚨 SNDK SHORT SQUEEZE ALERT — BEARS UNDER PRESSURE! 🟢
💥 Short Liquidation: $81.7K 🎯 Liquidation Price: $1,323.00
SNDK is delivering another warning to bearish traders! A $81.7K short liquidation at $1,323.00 highlights the risk of betting against a sudden upward move. When short positions get squeezed, buyers can gain momentum as forced closures add to the pressure.
📊 TRADER'S OUTLOOK — WHAT COMES NEXT?
🟢 Bullish Scenario: If SNDK holds above $1,323 and buying volume expands, another upward push could develop.
🔴 Bearish Scenario: If price fails to maintain momentum and slips back below this level, a pullback or consolidation may follow.
🎯 Key Signal: Watch price action around $1,323, trading volume, and the next candle confirmation before taking a position.
⚠️ Professional Risk Note: One liquidation event does not confirm a trend reversal. Wait for confirmation, manage leverage carefully, and always use a defined stop-loss.
#SNDK #ShortSqueeze #LiquidationAlert #TradingSignals #MarketWatch
Tighten the post for faster reading
Add a stronger action-focused opening
Make the outlook more technically precise
#EarningsSeason #MoodysAssignsRLUSDA2LongTermDepositRating #OSMOPlansToBurn100MTokensFromCommunityPool #CanGoogleDefindItsCore #CanMicrosoftDeliverOnAI
·
--
🚨 MU SHORT SQUEEZE ALERT — BULLS ARE FIGHTING BACK! 🟢
⚡ Asset: #MU
💥 Liquidated Position: Short
💰 Liquidation Value: $54.5K
📍 Reported Price: $952.18
🔥 THE BEARS ARE UNDER PRESSURE!
A $54.5K short liquidation at $952.18 signals that bearish traders faced a forced exit. If MU continues pushing higher, additional short covering could add fuel to the rally. However, one liquidation event alone does not confirm a sustained bullish trend.
📊 NEXT MOVE — MY MARKET OUTLOOK
🟢 Bullish Scenario: If MU holds above $952.18 and builds upward momentum, buyers could attempt another leg higher.
🔴 Bearish Scenario: If price rejects higher levels and falls back below the liquidation zone, a pullback or consolidation may follow.
🎯 SIGNAL PROVIDER'S TAKE: Watch price acceptance around $952.18, trading volume, and the next candle confirmations before choosing a direction. A breakout without strong follow-through could turn into a fakeout.
⚠️ Risk Management: Wait for confirmation, define your stop-loss, and avoid excessive leverage. Liquidation data shows positioning pressure—not a guaranteed price direction.
🚀 Will MU squeeze higher, or will bears reclaim control?
#MU #TradingSignals #ShortSqueeze #LiquidationAlert #MarketAnalysis #CryptoAndStocks #RiskManagement
Tighten the opening headline
Make the market outlook more decisive
Reduce repeated risk disclaimers
#MoodysAssignsRLUSDA2LongTermDepositRating #OSMOPlansToBurn100MTokensFromCommunityPool #CanGoogleDefindItsCore #CanMicrosoftDeliverOnAI #FOMCWatch
{future}(MUUSDT)
🚨 MU SHORT SQUEEZE ALERT — BULLS ARE FIGHTING BACK! 🟢
⚡ Asset: #MU
💥 Liquidated Position: Short
💰 Liquidation Value: $54.5K
📍 Reported Price: $952.18
🔥 THE BEARS ARE UNDER PRESSURE!
A $54.5K short liquidation at $952.18 signals that bearish traders faced a forced exit. If MU continues pushing higher, additional short covering could add fuel to the rally. However, one liquidation event alone does not confirm a sustained bullish trend.
📊 NEXT MOVE — MY MARKET OUTLOOK
🟢 Bullish Scenario: If MU holds above $952.18 and builds upward momentum, buyers could attempt another leg higher.
🔴 Bearish Scenario: If price rejects higher levels and falls back below the liquidation zone, a pullback or consolidation may follow.
🎯 SIGNAL PROVIDER'S TAKE: Watch price acceptance around $952.18, trading volume, and the next candle confirmations before choosing a direction. A breakout without strong follow-through could turn into a fakeout.
⚠️ Risk Management: Wait for confirmation, define your stop-loss, and avoid excessive leverage. Liquidation data shows positioning pressure—not a guaranteed price direction.
🚀 Will MU squeeze higher, or will bears reclaim control?
#MU #TradingSignals #ShortSqueeze #LiquidationAlert #MarketAnalysis #CryptoAndStocks #RiskManagement
Tighten the opening headline
Make the market outlook more decisive
Reduce repeated risk disclaimers
#MoodysAssignsRLUSDA2LongTermDepositRating #OSMOPlansToBurn100MTokensFromCommunityPool #CanGoogleDefindItsCore #CanMicrosoftDeliverOnAI #FOMCWatch
·
--
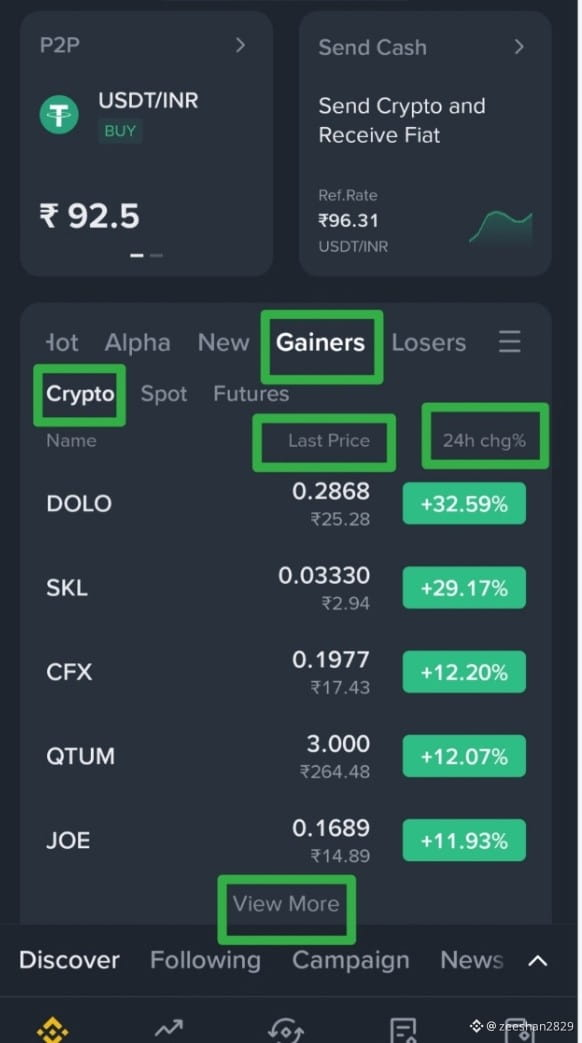
DOLO leads the board with +32.59%, followed by SKL at +29.17%. $CFX , $QTUM , and $JOE are also showing #CanMicrosoftDeliverOnAI #MoodysAssignsRLUSDA2LongTermDepositRating #CanGoogleDefindItsCore #EarningsSeason strong 24-hour gains. Momentum is attracting attention, but sharp rallies can reverse quickly. Watch trading volume, support, and resistance before entering. 🔥 FOLLOW ME NOW for daily crypto predictions, trending coins, and market insights. Trade smart—profits are never guaranteed! 💎
DOLO leads the board with +32.59%, followed by SKL at +29.17%. $CFX , $QTUM , and $JOE are also showing #CanMicrosoftDeliverOnAI #MoodysAssignsRLUSDA2LongTermDepositRating #CanGoogleDefindItsCore #EarningsSeason strong 24-hour gains. Momentum is attracting attention, but sharp rallies can reverse quickly. Watch trading volume, support, and resistance before entering. 🔥 FOLLOW ME NOW for daily crypto predictions, trending coins, and market insights. Trade smart—profits are never guaranteed! 💎
16
·
--
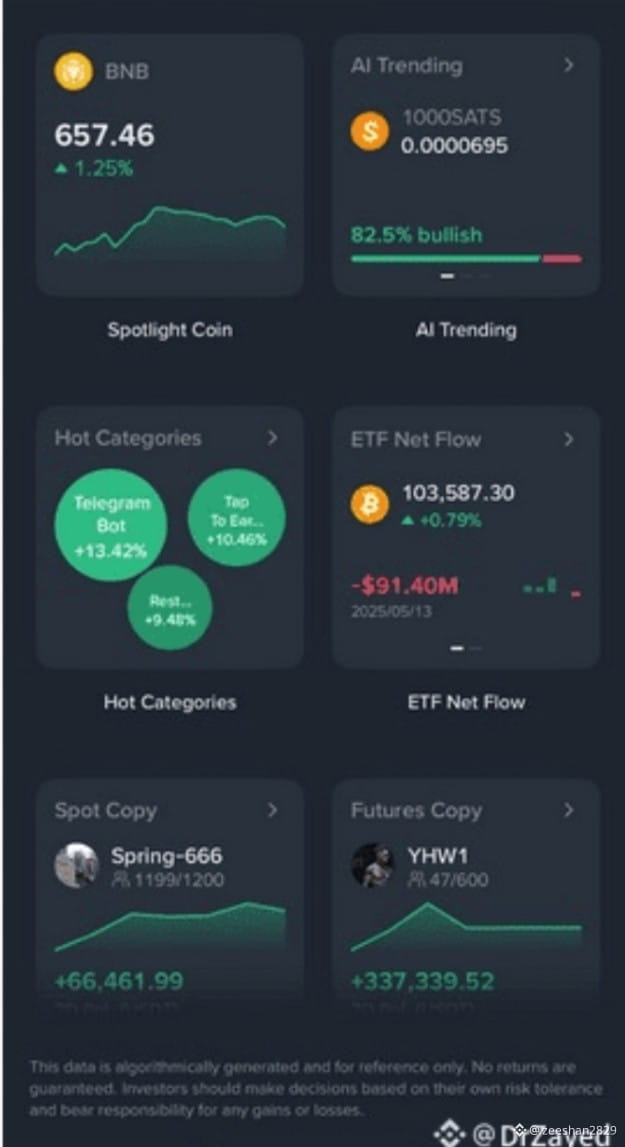
#CanMicrosoftDeliverOnAI #MoodysAssignsRLUSDA2LongTermDepositRating $BNB is showing positive momentum at $657.46, up 1.25%, while AI indicators show 82.5% bullish sentiment for 1000SATS. Hot categories are gaining attention, but Bitcoin ETF outflows signal caution. 🔥 Watch market trends, volume, and price action before trading. FOLLOW ME NOW for daily crypto predictions, trending coins, and valuable market insights! 💎#CanGoogleDefindItsCore #EarningsSeason #MoodysAssignsRLUSDA2LongTermDepositRating
#CanMicrosoftDeliverOnAI #MoodysAssignsRLUSDA2LongTermDepositRating $BNB is showing positive momentum at $657.46, up 1.25%, while AI indicators show 82.5% bullish sentiment for 1000SATS. Hot categories are gaining attention, but Bitcoin ETF outflows signal caution. 🔥 Watch market trends, volume, and price action before trading. FOLLOW ME NOW for daily crypto predictions, trending coins, and valuable market insights! 💎#CanGoogleDefindItsCore #EarningsSeason #MoodysAssignsRLUSDA2LongTermDepositRating
17
·
--
🚨 BITCOIN ALERT: BEARS ARE GETTING SQUEEZED! 🟢⚡
Bitcoin just recorded a $74.1K short liquidation at $80,909.01 — a sign that bearish traders are being forced out of their positions.
📊 BTC Market Breakdown
💥 Liquidation: $74,100 in short positions
🎯 Price Level: $80,909.01
🟢 Market Signal: Potential short-term bullish pressure
⚡ Key Factor: Can buyers sustain the momentum?
📈 What’s the Next Move for BTC?
Bullish Setup: If BTC holds above the $80,909 area and buying volume increases, the price could attempt a move toward nearby resistance. A stronger breakout may trigger additional short liquidations.
Bearish Risk: If buyers fail to maintain control and BTC drops back below this level, the move could lose momentum and lead to a downside retest.
🎯 Trader’s Verdict: The liquidation event gives bulls a reason to watch closely, but it is not enough to confirm a breakout. Look for a decisive candle close, rising volume, and confirmation from the broader market before entering a trade.
🛡️ Manage leverage carefully. Protect your capital, set a stop-loss, and never chase a move without confirmation.
#BTC #Bitcoin #CryptoSignals #LiquidationAlert #BitcoinAnalysis #CryptoTrading
#CanGoogleDefindItsCore #CanMicrosoftDeliverOnAI #MoodysAssignsRLUSDA2LongTermDepositRating #OSMOPlansToBurn100MTokensFromCommunityPool
{spot}(BTCUSDT)
🚨 BITCOIN ALERT: BEARS ARE GETTING SQUEEZED! 🟢⚡
Bitcoin just recorded a $74.1K short liquidation at $80,909.01 — a sign that bearish traders are being forced out of their positions.
📊 BTC Market Breakdown
💥 Liquidation: $74,100 in short positions
🎯 Price Level: $80,909.01
🟢 Market Signal: Potential short-term bullish pressure
⚡ Key Factor: Can buyers sustain the momentum?
📈 What’s the Next Move for BTC?
Bullish Setup: If BTC holds above the $80,909 area and buying volume increases, the price could attempt a move toward nearby resistance. A stronger breakout may trigger additional short liquidations.
Bearish Risk: If buyers fail to maintain control and BTC drops back below this level, the move could lose momentum and lead to a downside retest.
🎯 Trader’s Verdict: The liquidation event gives bulls a reason to watch closely, but it is not enough to confirm a breakout. Look for a decisive candle close, rising volume, and confirmation from the broader market before entering a trade.
🛡️ Manage leverage carefully. Protect your capital, set a stop-loss, and never chase a move without confirmation.
#BTC #Bitcoin #CryptoSignals #LiquidationAlert #BitcoinAnalysis #CryptoTrading
#CanGoogleDefindItsCore #CanMicrosoftDeliverOnAI #MoodysAssignsRLUSDA2LongTermDepositRating #OSMOPlansToBurn100MTokensFromCommunityPool
2
Log in to explore more content
Join global crypto users on Binance Square
⚡️ Get latest and useful information about crypto.
💬 Trusted by the world’s largest crypto exchange.
👍 Discover real insights from verified creators.
Email / Phone number
Trending Topics
1
#CanMicrosoftDeliverOnAI
201,102 views
1,725 Discussing
2
#CanGoogleDefindItsCore
108,322 views
1,254 Discussing
3
#EarningsSeason
5.8M views
27,660 Discussing
4
#FOMCWatch
9.2M views
28,969 Discussing
5
#HKPlacesTokenizedFundSecondaryTradingUnderETFLikeFramework
222 views
18 Discussing
6
#USGovSellsFTXLinkedAnthropicSharesFor$627M
525 views
25 Discussing
7
#MoodysAssignsRLUSDA2LongTermDepositRating
2,530 views
166 Discussing
8
#SKHynixUnveils$45BShareholderReturns
907 views
24 Discussing
9
#OSMOPlansToBurn100MTokensFromCommunityPool
11,003 views
351 Discussing
10
#EthereumDropsBelow$2300
13,358 views
176 Discussing