
子轩 — Zǐ Xuān
22.9k Posts

子轩 — Zǐ Xuān
 Square Verified
Report
Block User
2.0K+ Following
30.4K+ Followers
22.8K+ Liked
Posts
All
Quotes
Live
·
--
🚀 $KOR/USDT – Massive 248% Rally!
KOR is showing explosive momentum, currently trading at $0.017419, up 248.38%. This sharp move indicates strong buying interest, but after such a massive pump, sudden corrections and profit-taking are possible. I would avoid chasing the current green candle. Watch for a healthy pullback and bullish confirmation before entering. If buyers maintain momentum and volume supports the move, another upward push could follow. Trade carefully, protect your capital, and avoid excessive leverage. Patience is more important than chasing a fast-moving market.
Buy Zone: $0.01550–$0.01650
Target 1: $0.01850
Target 2: $0.02000
Target 3: $0.02200
Stop Loss: $0.01450
#BinanceIncidentReport #USOctoberNFP-AreRateCutsStillPossible #USMidterms-WhatAreMarketsExpecting? #Binance98PercentReplenished
🚀 $KOR/USDT – Massive 248% Rally!
KOR is showing explosive momentum, currently trading at $0.017419, up 248.38%. This sharp move indicates strong buying interest, but after such a massive pump, sudden corrections and profit-taking are possible. I would avoid chasing the current green candle. Watch for a healthy pullback and bullish confirmation before entering. If buyers maintain momentum and volume supports the move, another upward push could follow. Trade carefully, protect your capital, and avoid excessive leverage. Patience is more important than chasing a fast-moving market.
Buy Zone: $0.01550–$0.01650
Target 1: $0.01850
Target 2: $0.02000
Target 3: $0.02200
Stop Loss: $0.01450
#BinanceIncidentReport #USOctoberNFP-AreRateCutsStillPossible #USMidterms-WhatAreMarketsExpecting? #Binance98PercentReplenished
KOR is showing explosive momentum, currently trading at $0.017419, up 248.38%. This sharp move indicates strong buying interest, but after such a massive pump, sudden corrections and profit-taking are possible. I would avoid chasing the current green candle. Watch for a healthy pullback and bullish confirmation before entering. If buyers maintain momentum and volume supports the move, another upward push could follow. Trade carefully, protect your capital, and avoid excessive leverage. Patience is more important than chasing a fast-moving market.
Buy Zone: $0.01550–$0.01650
Target 1: $0.01850
Target 2: $0.02000
Target 3: $0.02200
Stop Loss: $0.01450
#BinanceIncidentReport #USOctoberNFP-AreRateCutsStillPossible #USMidterms-WhatAreMarketsExpecting? #Binance98PercentReplenished
112
·
--
🚀 $ELSA
USDT: Bulls Are Taking Control!
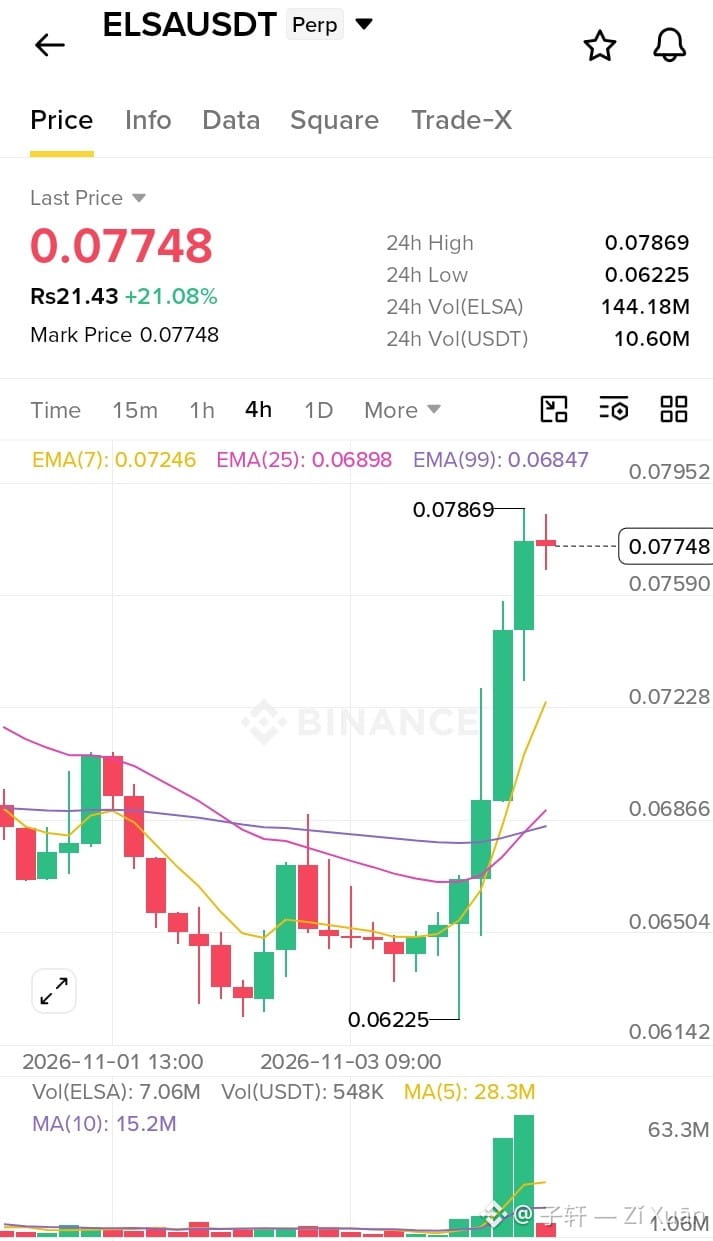
ELSA is showing strong momentum, trading at $0.07748, up 21.08%. Buyers have pushed the price close to its 24-hour high of $0.07869, with strong trading volume supporting the move. EMA 7 ($0.07246) is above EMA 25 and EMA 99, showing a bullish short-term structure. However, chasing this sharp pump can be risky. I would watch for a pullback and bullish confirmation before entering. A clean breakout above resistance with volume could bring another upward move. Stay patient, manage risk, and avoid high leverage.
Buy Zone: $0.07400–$0.07600
Target 1: $0.07900
Target 2: $0.08200
Target 3: $0.08500
Stop Loss: $0.07150
#CircleQ3Revenue865M #AMDBeatsExpectations-AINarrativeContinues #USMidterms-WhatAreMarketsExpecting?
{future}(ELSAUSDT)
🚀 $ELSA
USDT: Bulls Are Taking Control!
ELSA is showing strong momentum, trading at $0.07748, up 21.08%. Buyers have pushed the price close to its 24-hour high of $0.07869, with strong trading volume supporting the move. EMA 7 ($0.07246) is above EMA 25 and EMA 99, showing a bullish short-term structure. However, chasing this sharp pump can be risky. I would watch for a pullback and bullish confirmation before entering. A clean breakout above resistance with volume could bring another upward move. Stay patient, manage risk, and avoid high leverage.
Buy Zone: $0.07400–$0.07600
Target 1: $0.07900
Target 2: $0.08200
Target 3: $0.08500
Stop Loss: $0.07150
#CircleQ3Revenue865M #AMDBeatsExpectations-AINarrativeContinues #USMidterms-WhatAreMarketsExpecting?
USDT: Bulls Are Taking Control!
ELSA is showing strong momentum, trading at $0.07748, up 21.08%. Buyers have pushed the price close to its 24-hour high of $0.07869, with strong trading volume supporting the move. EMA 7 ($0.07246) is above EMA 25 and EMA 99, showing a bullish short-term structure. However, chasing this sharp pump can be risky. I would watch for a pullback and bullish confirmation before entering. A clean breakout above resistance with volume could bring another upward move. Stay patient, manage risk, and avoid high leverage.
Buy Zone: $0.07400–$0.07600
Target 1: $0.07900
Target 2: $0.08200
Target 3: $0.08500
Stop Loss: $0.07150
#CircleQ3Revenue865M #AMDBeatsExpectations-AINarrativeContinues #USMidterms-WhatAreMarketsExpecting?
272
·
--
Bitcoin Beyond the Price: The Trader’s Real Story of Execution Liquidity, and Trust@BTC- $BTC #BTC
I’ve had trades where my market direction was correct, but my execution was completely wrong. A position looked profitable on the chart, yet by the time my order filled, the spread had widened, liquidity had disappeared, and the price had already moved against me. That is the part of trading that frustrates me most. Being right about direction does not automatically mean making money.
Bitcoin has taught me that lesson repeatedly. I don't care how impressive a green candle looks if I cannot enter or exit a position at a reasonable price. During volatile sessions, execution quality becomes more important than the excitement surrounding a price move.
That is why I look at BTC through two separate lenses: market direction and market structure. The first tells me where price is moving. The second tells me how difficult it might be to trade that movement.
Bitcoin is currently trading around $80,728, up 4.33% over 24 hours according to the market snapshot. The interesting question is not simply why BTC is rising. I want to understand whether the market has enough liquidity and participation to support the move without creating unnecessary execution risk.
2. Current Market Snapshot
Bitcoin is trading around $80,728.10, showing a 24-hour gain of 4.33%. Its reported 24-hour high is $81,195.70, while the low stands at $75,725.30. Bybit reports approximately $1.21 billion in 24-hour turnover.
The moving averages also provide useful context. MA7 is around $79,344.60, MA14 is approximately $78,827.10, and MA28 stands near $78,673.60.
BTC is currently trading above all three moving averages, suggesting that short-term momentum has improved. However, I would not treat this as confirmation of a sustainable trend.
The $81,195 area is the immediate resistance I am watching. On the downside, the $79,300 to $78,600 region is worth monitoring if the market experiences a pullback.
For broader market context, I also compare Bitcoin's market capitalization, circulating supply and global trading volume through platforms such as CoinMarketCap and CoinGecko rather than relying on one exchange's figures.
3. What Bitcoin Is Actually Trying to Do
Bitcoin has a relatively straightforward purpose. It allows people to transfer and hold value without depending on a central institution to maintain the transaction ledger.
Its architecture is different from many modern smart contract platforms.
Bitcoin uses Proof of Work, SHA-256 mining and a UTXO-based transaction model. Miners compete to produce valid blocks, while independent full nodes check whether those blocks follow the network's rules.
The distinction between miners and nodes matters.
Miners help order transactions and produce blocks. Full nodes independently verify those blocks. Having more mining power does not automatically give someone permission to change Bitcoin's monetary rules.
From my perspective as a trader, this design prioritizes predictable rules and settlement security rather than ultra-fast transaction execution.
Bitcoin also has a relatively limited scripting environment compared with general-purpose smart contract platforms. This means complex financial applications often depend on additional layers and external infrastructure.
I see this as a deliberate design choice, not necessarily a weakness. However, traders should understand that Bitcoin's base layer is not designed to behave like a high-speed derivatives exchange.
4. Performance Numbers and Their Real Meaning
Bitcoin's mainnet launched in January 2009. Its target block interval is approximately 10 minutes, and its current block reward is 3.125 BTC following the April 2024 halving.
I don't judge Bitcoin by a single TPS number because actual transaction throughput depends on transaction size, block weight and transaction format.
The more important metric is settlement confidence.
One confirmation means a transaction has entered a block. Additional confirmations make reversing that transaction increasingly difficult. Six confirmations are commonly used as a conservative settlement reference, although the appropriate waiting period depends on transaction size and risk.
There is an important psychological difference here.
On a derivatives exchange, I expect an order to execute quickly. On Bitcoin's base layer, I accept that settlement takes longer because the network is designed around a different security model.
That trade-off makes sense to me. However, I would never confuse fast exchange execution with fast Bitcoin network settlement.
5. Design Tradeoffs and Risks
Bitcoin's architecture has strengths, but I don't believe any network should be evaluated without examining its weaknesses.
The first issue is mining concentration.
Although anyone can theoretically run a full node, mining requires substantial hardware, electricity and operational resources. Mining pools help smaller miners participate, but they can also concentrate block-production coordination.
I watch pool distribution, mining-pool changes and geographic concentration because these factors influence the practical decentralization of the network.
The second issue is scalability.
Bitcoin's base layer has limited block space. When transaction demand increases, users compete through fees. This can create delays for transactions offering lower fees.
The third issue is operational resilience.
A serious mining disruption, connectivity problem, software bug or concentrated infrastructure failure could affect transaction processing. Bitcoin has demonstrated considerable resilience, but historical reliability does not guarantee flawless performance during every future stress event.
I also pay attention to the energy economics of mining. If market conditions change substantially, miners with higher operating costs can face pressure, potentially affecting the distribution of mining power.
My conclusion is simple. Bitcoin's security model deserves attention, but its economic and operational dependencies deserve equal scrutiny.
6. The Retention Problem
One thing I have noticed about crypto users is that they rarely leave an application because of just one problem.
They leave because small frustrations accumulate.
A wallet requires repeated signatures. A transaction takes longer than expected. Network fees suddenly increase. A bridge introduces another waiting period. An application displays a successful transaction while the next stage remains incomplete.
Eventually, people stop using the product.
Bitcoin's base layer does not solve every one of these problems directly. Its limited scripting and slower settlement create challenges for applications that need frequent interactions.
The Lightning Network and other Bitcoin-related scaling approaches attempt to address some of these limitations by moving suitable activity away from individual base-layer transactions.
For me, the important question is whether these solutions actually make everyday usage easier without introducing unacceptable custody, liquidity or routing risks.
A better interface is useful, but it means very little if the underlying transaction becomes unreliable when demand increases.
7. Real Trading Scenario
Imagine Bitcoin is trading around $80,700 during a volatile session.
Suddenly, aggressive selling pushes BTC below $80,000. Perpetual funding starts moving, leveraged positions approach liquidation levels, and market makers widen their spreads to manage inventory risk.
I enter a long position expecting a recovery.
My first problem is execution. I submit a market order, but the available liquidity changes before the order is fully filled. My average entry becomes worse than the price I originally saw.
Then Bitcoin briefly recovers, only to experience another wave of selling.
I try to cancel part of my position and discover that the exchange interface is taking longer than expected to reflect the cancellation.
At this point, my problem is no longer simply market direction. It is managing exposure while the market is moving faster than my execution process.
This example highlights an important distinction. Bitcoin's base layer provides a settlement system, not an exchange matching engine.
Its approximately 10-minute block target cannot solve exchange-side slippage, liquidation delays or order cancellation problems.
However, Bitcoin's security and settlement properties matter when I eventually move funds between platforms or settle transactions on-chain. Layer 2 solutions may improve certain payment experiences, but they introduce their own liquidity and operational considerations.
I would rather understand these boundaries than attribute every trading problem to the underlying blockchain.
8. What to Watch Going Forward
These are the areas I would monitor before making stronger conclusions about Bitcoin's market structure and trading environment.
First, liquidity quality. Is BTC supported by genuine spot activity or mainly leveraged derivatives?
Second, slippage under volatility. How much does execution cost during sudden market moves?
Third, cancellation reliability. Are exchange orders cancelled and confirmed consistently?
Fourth, uptime and incidents. Are exchanges, wallets and Bitcoin infrastructure operating reliably?
Fifth, mining distribution. Are mining pools becoming more concentrated or diversified?
Sixth, node participation. Bitcoin uses miners and full nodes rather than a conventional validator structure, so I monitor both independently.
Finally, user retention. Are Lightning and other Bitcoin applications becoming habitual tools rather than occasional experiments?
I also want to see whether the market can hold above its short-term moving averages after the initial volatility settles.
9. Practical Engagement Framework
My approach to Bitcoin is based on verification rather than excitement.
I would start by comparing exchange data with CoinMarketCap, CoinGecko and on-chain information from mempool.space. Then I would examine Bitcoin's documentation to understand how transactions, fees, confirmations and mining actually work.
For trading, I would test order execution with small positions, measure slippage, compare limit and market orders, and observe how cancellation behaves during active sessions.
I would also paper-trade volatile conditions before increasing exposure. A strategy that performs well during quiet hours may behave very differently when liquidity disappears.
Most importantly, I separate three things: Bitcoin's underlying security, exchange execution quality and short-term market direction. They influence each other, but they are not interchangeable.
My Final Thought
Bitcoin does not need to promise instant execution to remain important. What matters to me is whether its settlement model continues to provide credible security while the surrounding trading infrastructure becomes more reliable.
At $80,728, I am interested in how the market handles resistance around $81,195, but I am more interested in the quality of participation behind that move.
I would rather miss a fast candle than enter a position without understanding the risks.
#USMidterms-WhatAreMarketsExpecting? #ADPUSPrivateEmployersAdd86000JobsInOctober
{spot}(BTCUSDT)
$CAP
{future}(CAPUSDT)
$CLANKER
{future}(CLANKERUSDT)
Bitcoin Beyond the Price: The Trader’s Real Story of Execution Liquidity, and Trust
@BTC - $BTC #BTC
I’ve had trades where my market direction was correct, but my execution was completely wrong. A position looked profitable on the chart, yet by the time my order filled, the spread had widened, liquidity had disappeared, and the price had already moved against me. That is the part of trading that frustrates me most. Being right about direction does not automatically mean making money.
Bitcoin has taught me that lesson repeatedly. I don't care how impressive a green candle looks if I cannot enter or exit a position at a reasonable price. During volatile sessions, execution quality becomes more important than the excitement surrounding a price move.
That is why I look at BTC through two separate lenses: market direction and market structure. The first tells me where price is moving. The second tells me how difficult it might be to trade that movement.
Bitcoin is currently trading around $80,728, up 4.33% over 24 hours according to the market snapshot. The interesting question is not simply why BTC is rising. I want to understand whether the market has enough liquidity and participation to support the move without creating unnecessary execution risk.
2. Current Market Snapshot
Bitcoin is trading around $80,728.10, showing a 24-hour gain of 4.33%. Its reported 24-hour high is $81,195.70, while the low stands at $75,725.30. Bybit reports approximately $1.21 billion in 24-hour turnover.
The moving averages also provide useful context. MA7 is around $79,344.60, MA14 is approximately $78,827.10, and MA28 stands near $78,673.60.
BTC is currently trading above all three moving averages, suggesting that short-term momentum has improved. However, I would not treat this as confirmation of a sustainable trend.
The $81,195 area is the immediate resistance I am watching. On the downside, the $79,300 to $78,600 region is worth monitoring if the market experiences a pullback.
For broader market context, I also compare Bitcoin's market capitalization, circulating supply and global trading volume through platforms such as CoinMarketCap and CoinGecko rather than relying on one exchange's figures.
3. What Bitcoin Is Actually Trying to Do
Bitcoin has a relatively straightforward purpose. It allows people to transfer and hold value without depending on a central institution to maintain the transaction ledger.
Its architecture is different from many modern smart contract platforms.
Bitcoin uses Proof of Work, SHA-256 mining and a UTXO-based transaction model. Miners compete to produce valid blocks, while independent full nodes check whether those blocks follow the network's rules.
The distinction between miners and nodes matters.
Miners help order transactions and produce blocks. Full nodes independently verify those blocks. Having more mining power does not automatically give someone permission to change Bitcoin's monetary rules.
From my perspective as a trader, this design prioritizes predictable rules and settlement security rather than ultra-fast transaction execution.
Bitcoin also has a relatively limited scripting environment compared with general-purpose smart contract platforms. This means complex financial applications often depend on additional layers and external infrastructure.
I see this as a deliberate design choice, not necessarily a weakness. However, traders should understand that Bitcoin's base layer is not designed to behave like a high-speed derivatives exchange.
4. Performance Numbers and Their Real Meaning
Bitcoin's mainnet launched in January 2009. Its target block interval is approximately 10 minutes, and its current block reward is 3.125 BTC following the April 2024 halving.
I don't judge Bitcoin by a single TPS number because actual transaction throughput depends on transaction size, block weight and transaction format.
The more important metric is settlement confidence.
One confirmation means a transaction has entered a block. Additional confirmations make reversing that transaction increasingly difficult. Six confirmations are commonly used as a conservative settlement reference, although the appropriate waiting period depends on transaction size and risk.
There is an important psychological difference here.
On a derivatives exchange, I expect an order to execute quickly. On Bitcoin's base layer, I accept that settlement takes longer because the network is designed around a different security model.
That trade-off makes sense to me. However, I would never confuse fast exchange execution with fast Bitcoin network settlement.
5. Design Tradeoffs and Risks
Bitcoin's architecture has strengths, but I don't believe any network should be evaluated without examining its weaknesses.
The first issue is mining concentration.
Although anyone can theoretically run a full node, mining requires substantial hardware, electricity and operational resources. Mining pools help smaller miners participate, but they can also concentrate block-production coordination.
I watch pool distribution, mining-pool changes and geographic concentration because these factors influence the practical decentralization of the network.
The second issue is scalability.
Bitcoin's base layer has limited block space. When transaction demand increases, users compete through fees. This can create delays for transactions offering lower fees.
The third issue is operational resilience.
A serious mining disruption, connectivity problem, software bug or concentrated infrastructure failure could affect transaction processing. Bitcoin has demonstrated considerable resilience, but historical reliability does not guarantee flawless performance during every future stress event.
I also pay attention to the energy economics of mining. If market conditions change substantially, miners with higher operating costs can face pressure, potentially affecting the distribution of mining power.
My conclusion is simple. Bitcoin's security model deserves attention, but its economic and operational dependencies deserve equal scrutiny.
6. The Retention Problem
One thing I have noticed about crypto users is that they rarely leave an application because of just one problem.
They leave because small frustrations accumulate.
A wallet requires repeated signatures. A transaction takes longer than expected. Network fees suddenly increase. A bridge introduces another waiting period. An application displays a successful transaction while the next stage remains incomplete.
Eventually, people stop using the product.
Bitcoin's base layer does not solve every one of these problems directly. Its limited scripting and slower settlement create challenges for applications that need frequent interactions.
The Lightning Network and other Bitcoin-related scaling approaches attempt to address some of these limitations by moving suitable activity away from individual base-layer transactions.
For me, the important question is whether these solutions actually make everyday usage easier without introducing unacceptable custody, liquidity or routing risks.
A better interface is useful, but it means very little if the underlying transaction becomes unreliable when demand increases.
7. Real Trading Scenario
Imagine Bitcoin is trading around $80,700 during a volatile session.
Suddenly, aggressive selling pushes BTC below $80,000. Perpetual funding starts moving, leveraged positions approach liquidation levels, and market makers widen their spreads to manage inventory risk.
I enter a long position expecting a recovery.
My first problem is execution. I submit a market order, but the available liquidity changes before the order is fully filled. My average entry becomes worse than the price I originally saw.
Then Bitcoin briefly recovers, only to experience another wave of selling.
I try to cancel part of my position and discover that the exchange interface is taking longer than expected to reflect the cancellation.
At this point, my problem is no longer simply market direction. It is managing exposure while the market is moving faster than my execution process.
This example highlights an important distinction. Bitcoin's base layer provides a settlement system, not an exchange matching engine.
Its approximately 10-minute block target cannot solve exchange-side slippage, liquidation delays or order cancellation problems.
However, Bitcoin's security and settlement properties matter when I eventually move funds between platforms or settle transactions on-chain. Layer 2 solutions may improve certain payment experiences, but they introduce their own liquidity and operational considerations.
I would rather understand these boundaries than attribute every trading problem to the underlying blockchain.
8. What to Watch Going Forward
These are the areas I would monitor before making stronger conclusions about Bitcoin's market structure and trading environment.
First, liquidity quality. Is BTC supported by genuine spot activity or mainly leveraged derivatives?
Second, slippage under volatility. How much does execution cost during sudden market moves?
Third, cancellation reliability. Are exchange orders cancelled and confirmed consistently?
Fourth, uptime and incidents. Are exchanges, wallets and Bitcoin infrastructure operating reliably?
Fifth, mining distribution. Are mining pools becoming more concentrated or diversified?
Sixth, node participation. Bitcoin uses miners and full nodes rather than a conventional validator structure, so I monitor both independently.
Finally, user retention. Are Lightning and other Bitcoin applications becoming habitual tools rather than occasional experiments?
I also want to see whether the market can hold above its short-term moving averages after the initial volatility settles.
9. Practical Engagement Framework
My approach to Bitcoin is based on verification rather than excitement.
I would start by comparing exchange data with CoinMarketCap, CoinGecko and on-chain information from mempool.space. Then I would examine Bitcoin's documentation to understand how transactions, fees, confirmations and mining actually work.
For trading, I would test order execution with small positions, measure slippage, compare limit and market orders, and observe how cancellation behaves during active sessions.
I would also paper-trade volatile conditions before increasing exposure. A strategy that performs well during quiet hours may behave very differently when liquidity disappears.
Most importantly, I separate three things: Bitcoin's underlying security, exchange execution quality and short-term market direction. They influence each other, but they are not interchangeable.
My Final Thought
Bitcoin does not need to promise instant execution to remain important. What matters to me is whether its settlement model continues to provide credible security while the surrounding trading infrastructure becomes more reliable.
At $80,728, I am interested in how the market handles resistance around $81,195, but I am more interested in the quality of participation behind that move.
I would rather miss a fast candle than enter a position without understanding the risks.
#USMidterms-WhatAreMarketsExpecting? #ADPUSPrivateEmployersAdd86000JobsInOctober
$CAP
$CLANKER
I’ve had trades where my market direction was correct, but my execution was completely wrong. A position looked profitable on the chart, yet by the time my order filled, the spread had widened, liquidity had disappeared, and the price had already moved against me. That is the part of trading that frustrates me most. Being right about direction does not automatically mean making money.
Bitcoin has taught me that lesson repeatedly. I don't care how impressive a green candle looks if I cannot enter or exit a position at a reasonable price. During volatile sessions, execution quality becomes more important than the excitement surrounding a price move.
That is why I look at BTC through two separate lenses: market direction and market structure. The first tells me where price is moving. The second tells me how difficult it might be to trade that movement.
Bitcoin is currently trading around $80,728, up 4.33% over 24 hours according to the market snapshot. The interesting question is not simply why BTC is rising. I want to understand whether the market has enough liquidity and participation to support the move without creating unnecessary execution risk.
2. Current Market Snapshot
Bitcoin is trading around $80,728.10, showing a 24-hour gain of 4.33%. Its reported 24-hour high is $81,195.70, while the low stands at $75,725.30. Bybit reports approximately $1.21 billion in 24-hour turnover.
The moving averages also provide useful context. MA7 is around $79,344.60, MA14 is approximately $78,827.10, and MA28 stands near $78,673.60.
BTC is currently trading above all three moving averages, suggesting that short-term momentum has improved. However, I would not treat this as confirmation of a sustainable trend.
The $81,195 area is the immediate resistance I am watching. On the downside, the $79,300 to $78,600 region is worth monitoring if the market experiences a pullback.
For broader market context, I also compare Bitcoin's market capitalization, circulating supply and global trading volume through platforms such as CoinMarketCap and CoinGecko rather than relying on one exchange's figures.
3. What Bitcoin Is Actually Trying to Do
Bitcoin has a relatively straightforward purpose. It allows people to transfer and hold value without depending on a central institution to maintain the transaction ledger.
Its architecture is different from many modern smart contract platforms.
Bitcoin uses Proof of Work, SHA-256 mining and a UTXO-based transaction model. Miners compete to produce valid blocks, while independent full nodes check whether those blocks follow the network's rules.
The distinction between miners and nodes matters.
Miners help order transactions and produce blocks. Full nodes independently verify those blocks. Having more mining power does not automatically give someone permission to change Bitcoin's monetary rules.
From my perspective as a trader, this design prioritizes predictable rules and settlement security rather than ultra-fast transaction execution.
Bitcoin also has a relatively limited scripting environment compared with general-purpose smart contract platforms. This means complex financial applications often depend on additional layers and external infrastructure.
I see this as a deliberate design choice, not necessarily a weakness. However, traders should understand that Bitcoin's base layer is not designed to behave like a high-speed derivatives exchange.
4. Performance Numbers and Their Real Meaning
Bitcoin's mainnet launched in January 2009. Its target block interval is approximately 10 minutes, and its current block reward is 3.125 BTC following the April 2024 halving.
I don't judge Bitcoin by a single TPS number because actual transaction throughput depends on transaction size, block weight and transaction format.
The more important metric is settlement confidence.
One confirmation means a transaction has entered a block. Additional confirmations make reversing that transaction increasingly difficult. Six confirmations are commonly used as a conservative settlement reference, although the appropriate waiting period depends on transaction size and risk.
There is an important psychological difference here.
On a derivatives exchange, I expect an order to execute quickly. On Bitcoin's base layer, I accept that settlement takes longer because the network is designed around a different security model.
That trade-off makes sense to me. However, I would never confuse fast exchange execution with fast Bitcoin network settlement.
5. Design Tradeoffs and Risks
Bitcoin's architecture has strengths, but I don't believe any network should be evaluated without examining its weaknesses.
The first issue is mining concentration.
Although anyone can theoretically run a full node, mining requires substantial hardware, electricity and operational resources. Mining pools help smaller miners participate, but they can also concentrate block-production coordination.
I watch pool distribution, mining-pool changes and geographic concentration because these factors influence the practical decentralization of the network.
The second issue is scalability.
Bitcoin's base layer has limited block space. When transaction demand increases, users compete through fees. This can create delays for transactions offering lower fees.
The third issue is operational resilience.
A serious mining disruption, connectivity problem, software bug or concentrated infrastructure failure could affect transaction processing. Bitcoin has demonstrated considerable resilience, but historical reliability does not guarantee flawless performance during every future stress event.
I also pay attention to the energy economics of mining. If market conditions change substantially, miners with higher operating costs can face pressure, potentially affecting the distribution of mining power.
My conclusion is simple. Bitcoin's security model deserves attention, but its economic and operational dependencies deserve equal scrutiny.
6. The Retention Problem
One thing I have noticed about crypto users is that they rarely leave an application because of just one problem.
They leave because small frustrations accumulate.
A wallet requires repeated signatures. A transaction takes longer than expected. Network fees suddenly increase. A bridge introduces another waiting period. An application displays a successful transaction while the next stage remains incomplete.
Eventually, people stop using the product.
Bitcoin's base layer does not solve every one of these problems directly. Its limited scripting and slower settlement create challenges for applications that need frequent interactions.
The Lightning Network and other Bitcoin-related scaling approaches attempt to address some of these limitations by moving suitable activity away from individual base-layer transactions.
For me, the important question is whether these solutions actually make everyday usage easier without introducing unacceptable custody, liquidity or routing risks.
A better interface is useful, but it means very little if the underlying transaction becomes unreliable when demand increases.
7. Real Trading Scenario
Imagine Bitcoin is trading around $80,700 during a volatile session.
Suddenly, aggressive selling pushes BTC below $80,000. Perpetual funding starts moving, leveraged positions approach liquidation levels, and market makers widen their spreads to manage inventory risk.
I enter a long position expecting a recovery.
My first problem is execution. I submit a market order, but the available liquidity changes before the order is fully filled. My average entry becomes worse than the price I originally saw.
Then Bitcoin briefly recovers, only to experience another wave of selling.
I try to cancel part of my position and discover that the exchange interface is taking longer than expected to reflect the cancellation.
At this point, my problem is no longer simply market direction. It is managing exposure while the market is moving faster than my execution process.
This example highlights an important distinction. Bitcoin's base layer provides a settlement system, not an exchange matching engine.
Its approximately 10-minute block target cannot solve exchange-side slippage, liquidation delays or order cancellation problems.
However, Bitcoin's security and settlement properties matter when I eventually move funds between platforms or settle transactions on-chain. Layer 2 solutions may improve certain payment experiences, but they introduce their own liquidity and operational considerations.
I would rather understand these boundaries than attribute every trading problem to the underlying blockchain.
8. What to Watch Going Forward
These are the areas I would monitor before making stronger conclusions about Bitcoin's market structure and trading environment.
First, liquidity quality. Is BTC supported by genuine spot activity or mainly leveraged derivatives?
Second, slippage under volatility. How much does execution cost during sudden market moves?
Third, cancellation reliability. Are exchange orders cancelled and confirmed consistently?
Fourth, uptime and incidents. Are exchanges, wallets and Bitcoin infrastructure operating reliably?
Fifth, mining distribution. Are mining pools becoming more concentrated or diversified?
Sixth, node participation. Bitcoin uses miners and full nodes rather than a conventional validator structure, so I monitor both independently.
Finally, user retention. Are Lightning and other Bitcoin applications becoming habitual tools rather than occasional experiments?
I also want to see whether the market can hold above its short-term moving averages after the initial volatility settles.
9. Practical Engagement Framework
My approach to Bitcoin is based on verification rather than excitement.
I would start by comparing exchange data with CoinMarketCap, CoinGecko and on-chain information from mempool.space. Then I would examine Bitcoin's documentation to understand how transactions, fees, confirmations and mining actually work.
For trading, I would test order execution with small positions, measure slippage, compare limit and market orders, and observe how cancellation behaves during active sessions.
I would also paper-trade volatile conditions before increasing exposure. A strategy that performs well during quiet hours may behave very differently when liquidity disappears.
Most importantly, I separate three things: Bitcoin's underlying security, exchange execution quality and short-term market direction. They influence each other, but they are not interchangeable.
My Final Thought
Bitcoin does not need to promise instant execution to remain important. What matters to me is whether its settlement model continues to provide credible security while the surrounding trading infrastructure becomes more reliable.
At $80,728, I am interested in how the market handles resistance around $81,195, but I am more interested in the quality of participation behind that move.
I would rather miss a fast candle than enter a position without understanding the risks.
#USMidterms-WhatAreMarketsExpecting? #ADPUSPrivateEmployersAdd86000JobsInOctober
$CAP
$CLANKER
51
·
--
🔥 4 HOT ALTCOINS TO WATCH – MOMENTUM IS BUILDING!
Several altcoins are showing strong moves today. CLANKER is leading with a 60% gain, while CAP, ARX and CYPHUSDT are also attracting attention. The key now is finding a smart entry instead of chasing the rally.
$CLANKER/USDT (+60.41%)
Current Price: $18.72
Buy Zone: $17.80–$18.30
Target 1: $19.50
Target 2: $20.50
Target 3: $22.00
Stop Loss: $17.20
⚡ $CAP /USDT (+27.66%)
Current Price: $0.09451
Buy Zone: $0.0900–$0.0925
Target 1: $0.0980
Target 2: $0.1020
Target 3: $0.1080
Stop Loss: $0.0870
🔥 $ARX /USDT (+24.31%)
Current Price: $0.2710
Buy Zone: $0.2580–$0.2650
Target 1: $0.2800
Target 2: $0.2920
Target 3: $0.3100
Stop Loss: $0.2490
💥 $CYPH /USDT (+19.43%)
Current Price: $3.042
Buy Zone: $2.90–$2.98
Target 1: $3.15
Target 2: $3.30
Target 3: $3.50
Stop Loss: $2.82
My Trading Strategy: Don't enter just because a coin is already pumping. Wait for a pullback, watch volume, and look for bullish confirmation before taking a position. Keep leverage low and use strict risk management.
The goal is not to catch every pump; it's to enter when the risk makes sense.#37thQuarterlyBNBBurnRemoves1.64MillionBNB #AMDBeatsExpectations-AINarrativeContinues #USMidterms-WhatAreMarketsExpecting? #CircleQ3Revenue865M
{future}(CLANKERUSDT)
{future}(CAPUSDT)
{future}(ARXUSDT)
🔥 4 HOT ALTCOINS TO WATCH – MOMENTUM IS BUILDING!
Several altcoins are showing strong moves today. CLANKER is leading with a 60% gain, while CAP, ARX and CYPHUSDT are also attracting attention. The key now is finding a smart entry instead of chasing the rally.
$CLANKER/USDT (+60.41%)
Current Price: $18.72
Buy Zone: $17.80–$18.30
Target 1: $19.50
Target 2: $20.50
Target 3: $22.00
Stop Loss: $17.20
⚡ $CAP /USDT (+27.66%)
Current Price: $0.09451
Buy Zone: $0.0900–$0.0925
Target 1: $0.0980
Target 2: $0.1020
Target 3: $0.1080
Stop Loss: $0.0870
🔥 $ARX /USDT (+24.31%)
Current Price: $0.2710
Buy Zone: $0.2580–$0.2650
Target 1: $0.2800
Target 2: $0.2920
Target 3: $0.3100
Stop Loss: $0.2490
💥 $CYPH /USDT (+19.43%)
Current Price: $3.042
Buy Zone: $2.90–$2.98
Target 1: $3.15
Target 2: $3.30
Target 3: $3.50
Stop Loss: $2.82
My Trading Strategy: Don't enter just because a coin is already pumping. Wait for a pullback, watch volume, and look for bullish confirmation before taking a position. Keep leverage low and use strict risk management.
The goal is not to catch every pump; it's to enter when the risk makes sense.#37thQuarterlyBNBBurnRemoves1.64MillionBNB #AMDBeatsExpectations-AINarrativeContinues #USMidterms-WhatAreMarketsExpecting? #CircleQ3Revenue865M
Several altcoins are showing strong moves today. CLANKER is leading with a 60% gain, while CAP, ARX and CYPHUSDT are also attracting attention. The key now is finding a smart entry instead of chasing the rally.
$CLANKER/USDT (+60.41%)
Current Price: $18.72
Buy Zone: $17.80–$18.30
Target 1: $19.50
Target 2: $20.50
Target 3: $22.00
Stop Loss: $17.20
⚡ $CAP /USDT (+27.66%)
Current Price: $0.09451
Buy Zone: $0.0900–$0.0925
Target 1: $0.0980
Target 2: $0.1020
Target 3: $0.1080
Stop Loss: $0.0870
🔥 $ARX /USDT (+24.31%)
Current Price: $0.2710
Buy Zone: $0.2580–$0.2650
Target 1: $0.2800
Target 2: $0.2920
Target 3: $0.3100
Stop Loss: $0.2490
💥 $CYPH /USDT (+19.43%)
Current Price: $3.042
Buy Zone: $2.90–$2.98
Target 1: $3.15
Target 2: $3.30
Target 3: $3.50
Stop Loss: $2.82
My Trading Strategy: Don't enter just because a coin is already pumping. Wait for a pullback, watch volume, and look for bullish confirmation before taking a position. Keep leverage low and use strict risk management.
The goal is not to catch every pump; it's to enter when the risk makes sense.#37thQuarterlyBNBBurnRemoves1.64MillionBNB #AMDBeatsExpectations-AINarrativeContinues #USMidterms-WhatAreMarketsExpecting? #CircleQ3Revenue865M
CLANKER,💖💝🪻💪🕺
CAP💪💖🪻🕺
ARX💪🪻🌹
CYPH🪻💙💖
17 hr(s) left
1.5k
·
--
🔥 3 HOT PERPETUAL TRADING OPPORTUNITIES – WATCH THESE MOVES!
The market is showing strong momentum, and three tokens are attracting attention. But after sharp green moves, smart entries matter more than chasing price.
🚀 $CLANKER /USDT – $15.79 (+36.47%)
Buy Zone: $15.00–$15.40
Target 1: $16.30
Target 2: $17.00
Target 3: $17.80
Stop Loss: $14.40
⚡ $JCT /USDT – $0.005562 (+24.35%)
Buy Zone: $0.00535–$0.00548
Target 1: $0.00575
Target 2: $0.00595
Target 3: $0.00620
Stop Loss: $0.00518
🔥 $AIO /USDT – $0.03834 (+23.48%)
Buy Zone: $0.03680–$0.03770
Target 1: $0.03950
Target 2: $0.04080
Target 3: $0.04250
Stop Loss: $0.03550
My Strategy: Wait for a healthy pullback and bullish confirmation before entering. Avoid chasing fast green candles, manage leverage carefully, and protect your capital.
Remember: A good entry is more important than a fast entry.
#CLANKER🚀🚀🚀 #JCTSetup #AIO #CryptoTrading. #Altcoins!
{future}(CLANKERUSDT)
{future}(JCTUSDT)
{future}(AIOUSDT)
🔥 3 HOT PERPETUAL TRADING OPPORTUNITIES – WATCH THESE MOVES!
The market is showing strong momentum, and three tokens are attracting attention. But after sharp green moves, smart entries matter more than chasing price.
🚀 $CLANKER /USDT – $15.79 (+36.47%)
Buy Zone: $15.00–$15.40
Target 1: $16.30
Target 2: $17.00
Target 3: $17.80
Stop Loss: $14.40
⚡ $JCT /USDT – $0.005562 (+24.35%)
Buy Zone: $0.00535–$0.00548
Target 1: $0.00575
Target 2: $0.00595
Target 3: $0.00620
Stop Loss: $0.00518
🔥 $AIO /USDT – $0.03834 (+23.48%)
Buy Zone: $0.03680–$0.03770
Target 1: $0.03950
Target 2: $0.04080
Target 3: $0.04250
Stop Loss: $0.03550
My Strategy: Wait for a healthy pullback and bullish confirmation before entering. Avoid chasing fast green candles, manage leverage carefully, and protect your capital.
Remember: A good entry is more important than a fast entry.
#CLANKER🚀🚀🚀 #JCTSetup #AIO #CryptoTrading. #Altcoins!
The market is showing strong momentum, and three tokens are attracting attention. But after sharp green moves, smart entries matter more than chasing price.
🚀 $CLANKER /USDT – $15.79 (+36.47%)
Buy Zone: $15.00–$15.40
Target 1: $16.30
Target 2: $17.00
Target 3: $17.80
Stop Loss: $14.40
⚡ $JCT /USDT – $0.005562 (+24.35%)
Buy Zone: $0.00535–$0.00548
Target 1: $0.00575
Target 2: $0.00595
Target 3: $0.00620
Stop Loss: $0.00518
🔥 $AIO /USDT – $0.03834 (+23.48%)
Buy Zone: $0.03680–$0.03770
Target 1: $0.03950
Target 2: $0.04080
Target 3: $0.04250
Stop Loss: $0.03550
My Strategy: Wait for a healthy pullback and bullish confirmation before entering. Avoid chasing fast green candles, manage leverage carefully, and protect your capital.
Remember: A good entry is more important than a fast entry.
#CLANKER🚀🚀🚀 #JCTSetup #AIO #CryptoTrading. #Altcoins!
CLANKER💪🪻💙💖
JCT💖🌹🪻💪
AIO🪻💪💝
16 hr(s) left
2
2.7k
·
--
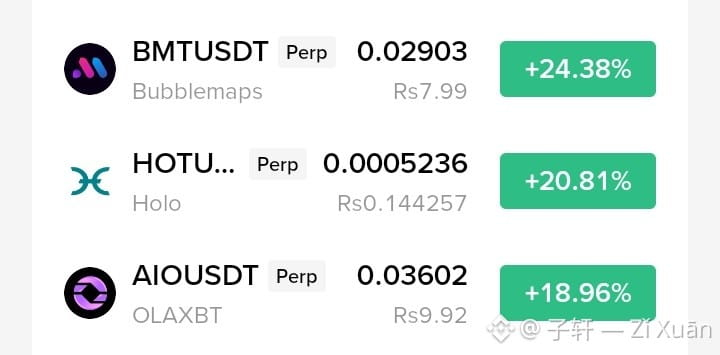
$BMT , $HOT and $AIO are showing strong momentum today, gaining 24.38%, 20.81% and 18.96%, respectively. These moves could create trading opportunities, but chasing green candles is risky. I would wait for a small pullback and bullish confirmation before entering.
BMTUSDT
Buy Zone: 0.0275–0.0285
Targets: 0.0305 / 0.0320 / 0.0340
Stop Loss: 0.0260
HOTUSDT
Buy Zone: 0.000495–0.000510
Targets: 0.000535 / 0.000550 / 0.000570
Stop Loss: 0.000480
AIOUSDT
Buy Zone: 0.0345–0.0355
Targets: 0.0375 / 0.0390 / 0.0410
Stop Loss: 0.0330
Trade with low leverage, manage risk, and wait for confirmation. These are estimated setups, not guaranteed signals.#HongKongToLicenseVirtualAssetCustodyAndAdvisory #BinanceIncidentReport #USOctoberNFP-AreRateCutsStillPossible #USMidterms-WhatAreMarketsExpecting?
{spot}(BMTUSDT)
{future}(AIOUSDT)
{spot}(HOTUSDT)
$BMT , $HOT and $AIO are showing strong momentum today, gaining 24.38%, 20.81% and 18.96%, respectively. These moves could create trading opportunities, but chasing green candles is risky. I would wait for a small pullback and bullish confirmation before entering.
BMTUSDT
Buy Zone: 0.0275–0.0285
Targets: 0.0305 / 0.0320 / 0.0340
Stop Loss: 0.0260
HOTUSDT
Buy Zone: 0.000495–0.000510
Targets: 0.000535 / 0.000550 / 0.000570
Stop Loss: 0.000480
AIOUSDT
Buy Zone: 0.0345–0.0355
Targets: 0.0375 / 0.0390 / 0.0410
Stop Loss: 0.0330
Trade with low leverage, manage risk, and wait for confirmation. These are estimated setups, not guaranteed signals.#HongKongToLicenseVirtualAssetCustodyAndAdvisory #BinanceIncidentReport #USOctoberNFP-AreRateCutsStillPossible #USMidterms-WhatAreMarketsExpecting?
BMTUSDT
Buy Zone: 0.0275–0.0285
Targets: 0.0305 / 0.0320 / 0.0340
Stop Loss: 0.0260
HOTUSDT
Buy Zone: 0.000495–0.000510
Targets: 0.000535 / 0.000550 / 0.000570
Stop Loss: 0.000480
AIOUSDT
Buy Zone: 0.0345–0.0355
Targets: 0.0375 / 0.0390 / 0.0410
Stop Loss: 0.0330
Trade with low leverage, manage risk, and wait for confirmation. These are estimated setups, not guaranteed signals.#HongKongToLicenseVirtualAssetCustodyAndAdvisory #BinanceIncidentReport #USOctoberNFP-AreRateCutsStillPossible #USMidterms-WhatAreMarketsExpecting?
1
495
·
--
🔥 TOP 3 GAINERS: $CLANKER , $BMT & $AIO – WHAT'S NEXT?
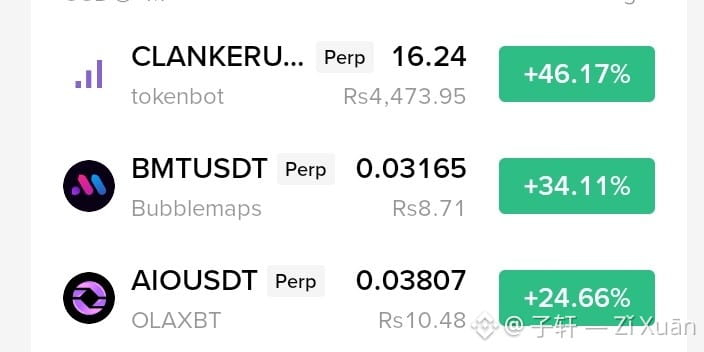
The market is showing strong momentum, and three coins are attracting attention. But after a sharp rally, the next entry matters more than chasing green candles.
CLANKER (Tokenbot)
Price: $16.24 | +46.17%
Buy Zone: $15.20–$15.80
Target 1: $17.00
Target 2: $18.20
Target 3: $19.50
Stop Loss: $14.60
BMT (Bubblemaps)
Price: $0.03165 | +34.11%
Buy Zone: $0.02980–$0.03080
Target 1: $0.03300
Target 2: $0.03480
Target 3: $0.03650
Stop Loss: $0.02890
AIO
Price: $0.03807 | +24.66%
Buy Zone: $0.03650–$0.03730
Target 1: $0.03950
Target 2: $0.04100
Target 3: $0.04300
Stop Loss: $0.03550
My Strategy: Don't rush into these moves. Wait for a healthy pullback and bullish confirmation before entering. If volume supports the next breakout, momentum could continue. Keep leverage low and manage risk carefully.
These are estimated trading levels, not guaranteed signals. Always confirm with your live chart.#HongKongToLicenseVirtualAssetCustodyAndAdvisory #AMDBeatsExpectations-AINarrativeContinues #USOctoberNFP-AreRateCutsStillPossible #USMidterms-WhatAreMarketsExpecting?
{future}(CLANKERUSDT)
{spot}(BMTUSDT)
{future}(AIOUSDT)
🔥 TOP 3 GAINERS: $CLANKER , $BMT & $AIO – WHAT'S NEXT?
The market is showing strong momentum, and three coins are attracting attention. But after a sharp rally, the next entry matters more than chasing green candles.
CLANKER (Tokenbot)
Price: $16.24 | +46.17%
Buy Zone: $15.20–$15.80
Target 1: $17.00
Target 2: $18.20
Target 3: $19.50
Stop Loss: $14.60
BMT (Bubblemaps)
Price: $0.03165 | +34.11%
Buy Zone: $0.02980–$0.03080
Target 1: $0.03300
Target 2: $0.03480
Target 3: $0.03650
Stop Loss: $0.02890
AIO
Price: $0.03807 | +24.66%
Buy Zone: $0.03650–$0.03730
Target 1: $0.03950
Target 2: $0.04100
Target 3: $0.04300
Stop Loss: $0.03550
My Strategy: Don't rush into these moves. Wait for a healthy pullback and bullish confirmation before entering. If volume supports the next breakout, momentum could continue. Keep leverage low and manage risk carefully.
These are estimated trading levels, not guaranteed signals. Always confirm with your live chart.#HongKongToLicenseVirtualAssetCustodyAndAdvisory #AMDBeatsExpectations-AINarrativeContinues #USOctoberNFP-AreRateCutsStillPossible #USMidterms-WhatAreMarketsExpecting?
The market is showing strong momentum, and three coins are attracting attention. But after a sharp rally, the next entry matters more than chasing green candles.
CLANKER (Tokenbot)
Price: $16.24 | +46.17%
Buy Zone: $15.20–$15.80
Target 1: $17.00
Target 2: $18.20
Target 3: $19.50
Stop Loss: $14.60
BMT (Bubblemaps)
Price: $0.03165 | +34.11%
Buy Zone: $0.02980–$0.03080
Target 1: $0.03300
Target 2: $0.03480
Target 3: $0.03650
Stop Loss: $0.02890
AIO
Price: $0.03807 | +24.66%
Buy Zone: $0.03650–$0.03730
Target 1: $0.03950
Target 2: $0.04100
Target 3: $0.04300
Stop Loss: $0.03550
My Strategy: Don't rush into these moves. Wait for a healthy pullback and bullish confirmation before entering. If volume supports the next breakout, momentum could continue. Keep leverage low and manage risk carefully.
These are estimated trading levels, not guaranteed signals. Always confirm with your live chart.#HongKongToLicenseVirtualAssetCustodyAndAdvisory #AMDBeatsExpectations-AINarrativeContinues #USOctoberNFP-AreRateCutsStillPossible #USMidterms-WhatAreMarketsExpecting?
2
523
·
--
🔥 TOP 3 GAINERS TO WATCH – $CLANKER , $BMT & $IDOL
The market is showing strong momentum, and these three altcoins are attracting attention.
CLANKER/USDT – $15.10 (+35.06%)
Buy Zone: $14.40–$14.80
Target 1: $15.80
Target 2: $16.50
Target 3: $17.50
Stop Loss: $13.90
BMT/USDT – $0.02903 (+26.22%)
Buy Zone: $0.02750–$0.02850
Target 1: $0.03050
Target 2: $0.03200
Target 3: $0.03400
Stop Loss: $0.02650
IDOL/USDT – $0.021385 (+20.61%)
Buy Zone: $0.02000–$0.02080
Target 1: $0.02250
Target 2: $0.02350
Target 3: $0.02500
Stop Loss: $0.01920
My Strategy: Don't chase sudden green candles. Wait for a pullback and bullish confirmation before entering. Keep leverage low and manage risk carefully. These levels are estimated setups, not guaranteed targets.#BinanceHourlyDepositsExceedWithdrawals #AMDBeatsExpectations-AINarrativeContinues #USMidterms-WhatAreMarketsExpecting? #BinanceIncidentReport
{alpha}(84530x1bc0c42215582d5a085795f4badbac3ff36d1bcb)
{spot}(BMTUSDT)
{future}(IDOLUSDT)
🔥 TOP 3 GAINERS TO WATCH – $CLANKER , $BMT & $IDOL
The market is showing strong momentum, and these three altcoins are attracting attention.
CLANKER/USDT – $15.10 (+35.06%)
Buy Zone: $14.40–$14.80
Target 1: $15.80
Target 2: $16.50
Target 3: $17.50
Stop Loss: $13.90
BMT/USDT – $0.02903 (+26.22%)
Buy Zone: $0.02750–$0.02850
Target 1: $0.03050
Target 2: $0.03200
Target 3: $0.03400
Stop Loss: $0.02650
IDOL/USDT – $0.021385 (+20.61%)
Buy Zone: $0.02000–$0.02080
Target 1: $0.02250
Target 2: $0.02350
Target 3: $0.02500
Stop Loss: $0.01920
My Strategy: Don't chase sudden green candles. Wait for a pullback and bullish confirmation before entering. Keep leverage low and manage risk carefully. These levels are estimated setups, not guaranteed targets.#BinanceHourlyDepositsExceedWithdrawals #AMDBeatsExpectations-AINarrativeContinues #USMidterms-WhatAreMarketsExpecting? #BinanceIncidentReport
The market is showing strong momentum, and these three altcoins are attracting attention.
CLANKER/USDT – $15.10 (+35.06%)
Buy Zone: $14.40–$14.80
Target 1: $15.80
Target 2: $16.50
Target 3: $17.50
Stop Loss: $13.90
BMT/USDT – $0.02903 (+26.22%)
Buy Zone: $0.02750–$0.02850
Target 1: $0.03050
Target 2: $0.03200
Target 3: $0.03400
Stop Loss: $0.02650
IDOL/USDT – $0.021385 (+20.61%)
Buy Zone: $0.02000–$0.02080
Target 1: $0.02250
Target 2: $0.02350
Target 3: $0.02500
Stop Loss: $0.01920
My Strategy: Don't chase sudden green candles. Wait for a pullback and bullish confirmation before entering. Keep leverage low and manage risk carefully. These levels are estimated setups, not guaranteed targets.#BinanceHourlyDepositsExceedWithdrawals #AMDBeatsExpectations-AINarrativeContinues #USMidterms-WhatAreMarketsExpecting? #BinanceIncidentReport
CLANKER💝💪🪻🌹
BMT,🪻🌹💖
IDOL🪻💝💪
6 hr(s) left
1.8k
·
--
🔥 $AGT /USDT – Strong Bullish Momentum!
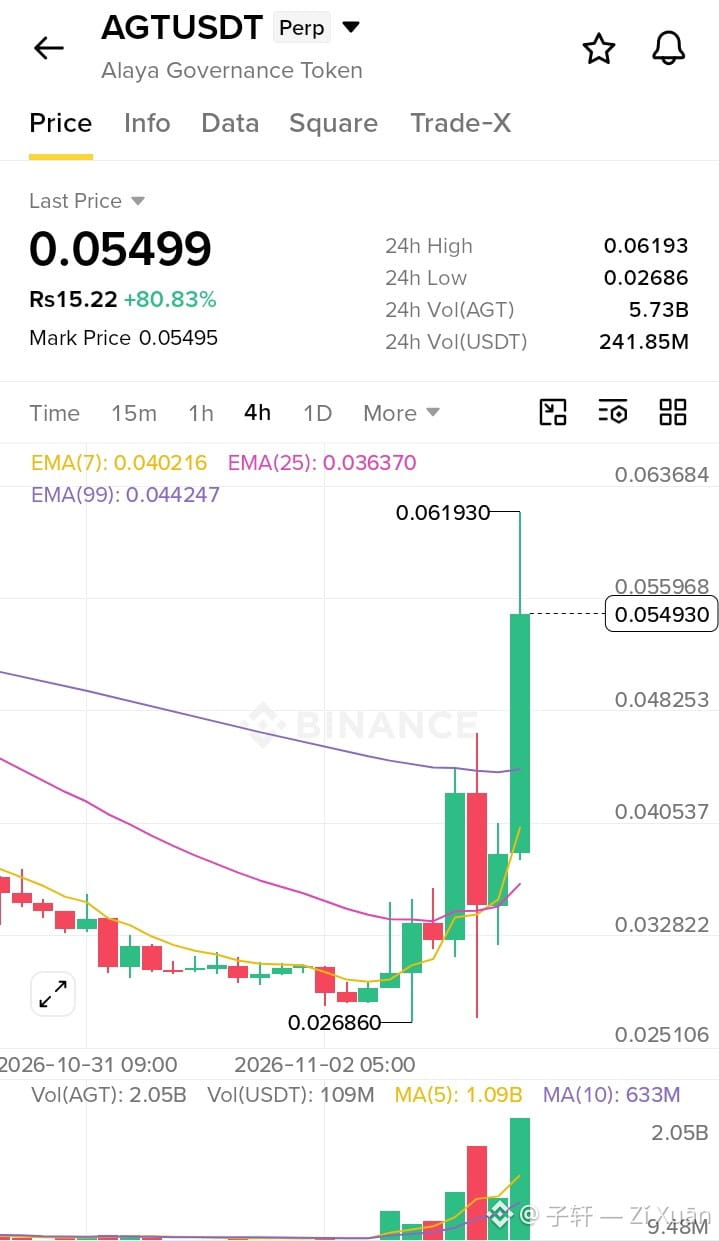
AGT is trading at $0.05499, up 80.83%, with impressive trading volume of 5.73B AGT. The price is above EMA 7, EMA 25 and EMA 99, showing strong bullish momentum. However, after this sharp rally, a pullback is possible. Avoid chasing the pump and wait for confirmation before entering.
Buy Zone: $0.05100–$0.05300
Target 1: $0.05700
Target 2: $0.06100
Target 3: $0.06400
Stop Loss: $0.04750
Resistance: $0.06193
Support: $0.04825
A strong breakout above $0.06193 with volume could open the door to further gains. Watch the support levels carefully and manage risk with low leverage.#FrenchAssemblyRejectsTwoCryptoExitTaxProposals #AppleReportsMixedResults #BinanceReopensWithdrawalsForMoreAssets #BinanceIncidentReport
{future}(AGTUSDT)
🔥 $AGT /USDT – Strong Bullish Momentum!
AGT is trading at $0.05499, up 80.83%, with impressive trading volume of 5.73B AGT. The price is above EMA 7, EMA 25 and EMA 99, showing strong bullish momentum. However, after this sharp rally, a pullback is possible. Avoid chasing the pump and wait for confirmation before entering.
Buy Zone: $0.05100–$0.05300
Target 1: $0.05700
Target 2: $0.06100
Target 3: $0.06400
Stop Loss: $0.04750
Resistance: $0.06193
Support: $0.04825
A strong breakout above $0.06193 with volume could open the door to further gains. Watch the support levels carefully and manage risk with low leverage.#FrenchAssemblyRejectsTwoCryptoExitTaxProposals #AppleReportsMixedResults #BinanceReopensWithdrawalsForMoreAssets #BinanceIncidentReport
AGT is trading at $0.05499, up 80.83%, with impressive trading volume of 5.73B AGT. The price is above EMA 7, EMA 25 and EMA 99, showing strong bullish momentum. However, after this sharp rally, a pullback is possible. Avoid chasing the pump and wait for confirmation before entering.
Buy Zone: $0.05100–$0.05300
Target 1: $0.05700
Target 2: $0.06100
Target 3: $0.06400
Stop Loss: $0.04750
Resistance: $0.06193
Support: $0.04825
A strong breakout above $0.06193 with volume could open the door to further gains. Watch the support levels carefully and manage risk with low leverage.#FrenchAssemblyRejectsTwoCryptoExitTaxProposals #AppleReportsMixedResults #BinanceReopensWithdrawalsForMoreAssets #BinanceIncidentReport
2
387
·
--
🔥 Top 5 Crypto Gainers – Trading Opportunities!
$AGT ($0.05395, +73.58%) is leading with strong momentum. Buy: $0.0510–$0.0525 | Targets: $0.0560, $0.0585, $0.0610 | SL: $0.0485.
$IDOL ($0.020842, +38.85%): Buy $0.0197–$0.0203 | Targets $0.0218, $0.0228, $0.0240 | SL $0.0188.
$ICNT ($0.2304, +38.71%): Buy $0.218–$0.224 | Targets $0.240, $0.250, $0.263 | SL $0.208.
$HOT ($0.0005275, +35.05%): Buy $0.000500–$0.000515 | Targets $0.000545, $0.000565, $0.000590 | SL $0.000480.
$BMT$ ($0.02627, +25.57%): Buy $0.0249–$0.0256 | Targets $0.0274, $0.0286, $0.0300 | SL $0.0238.
Wait for pullbacks and bullish confirmation. Avoid chasing pumps and manage risk carefully.#Nasdaq100EntersCorrection #FrenchAssemblyRejectsTwoCryptoExitTaxProposals #BinanceHourlyDepositsExceedWithdrawals #BinanceReopensWithdrawalsForMoreAssets
{future}(AGTUSDT)
{future}(IDOLUSDT)
{future}(ICNTUSDT)
🔥 Top 5 Crypto Gainers – Trading Opportunities!
$AGT ($0.05395, +73.58%) is leading with strong momentum. Buy: $0.0510–$0.0525 | Targets: $0.0560, $0.0585, $0.0610 | SL: $0.0485.
$IDOL ($0.020842, +38.85%): Buy $0.0197–$0.0203 | Targets $0.0218, $0.0228, $0.0240 | SL $0.0188.
$ICNT ($0.2304, +38.71%): Buy $0.218–$0.224 | Targets $0.240, $0.250, $0.263 | SL $0.208.
$HOT ($0.0005275, +35.05%): Buy $0.000500–$0.000515 | Targets $0.000545, $0.000565, $0.000590 | SL $0.000480.
$BMT$ ($0.02627, +25.57%): Buy $0.0249–$0.0256 | Targets $0.0274, $0.0286, $0.0300 | SL $0.0238.
Wait for pullbacks and bullish confirmation. Avoid chasing pumps and manage risk carefully.#Nasdaq100EntersCorrection #FrenchAssemblyRejectsTwoCryptoExitTaxProposals #BinanceHourlyDepositsExceedWithdrawals #BinanceReopensWithdrawalsForMoreAssets
$AGT ($0.05395, +73.58%) is leading with strong momentum. Buy: $0.0510–$0.0525 | Targets: $0.0560, $0.0585, $0.0610 | SL: $0.0485.
$IDOL ($0.020842, +38.85%): Buy $0.0197–$0.0203 | Targets $0.0218, $0.0228, $0.0240 | SL $0.0188.
$ICNT ($0.2304, +38.71%): Buy $0.218–$0.224 | Targets $0.240, $0.250, $0.263 | SL $0.208.
$HOT ($0.0005275, +35.05%): Buy $0.000500–$0.000515 | Targets $0.000545, $0.000565, $0.000590 | SL $0.000480.
$BMT$ ($0.02627, +25.57%): Buy $0.0249–$0.0256 | Targets $0.0274, $0.0286, $0.0300 | SL $0.0238.
Wait for pullbacks and bullish confirmation. Avoid chasing pumps and manage risk carefully.#Nasdaq100EntersCorrection #FrenchAssemblyRejectsTwoCryptoExitTaxProposals #BinanceHourlyDepositsExceedWithdrawals #BinanceReopensWithdrawalsForMoreAssets
AGT💪🪻💝💖
35%
IDOL,💪💝🪻🌹
15%
ICNT🪻🌹💚
35%
HOT🪻🕺💐
15%
26 votes • Voting closed
2
1.9k
·
--
🔥 3 Trending Perpetual Coins: $HOT U, $ICNT & $AGT – Trading Opportunities!
The market is showing strong momentum, but chasing a big green candle can be risky. Here are three coins worth watching for a possible entry.
HOTU/USDT – $0.0005417 (+43.04%)
Buy Zone: $0.000515–$0.000530
Target 1: $0.000560
Target 2: $0.000580
Target 3: $0.000610
Stop Loss: $0.000495
ICNT/USDT – $0.2277 (+37.00%)
Buy Zone: $0.2180–$0.2230
Target 1: $0.2350
Target 2: $0.2450
Target 3: $0.2600
Stop Loss: $0.2080
AGT/USDT – $0.03842 (+31.13%)
Buy Zone: $0.03680–$0.03770
Target 1: $0.04000
Target 2: $0.04150
Target 3: $0.04350
Stop Loss: $0.03550
My Strategy: Wait for a pullback and bullish confirmation before entering. Watch volume carefully, avoid chasing sudden pumps, and use low leverage. If support breaks, skip the trade rather than forcing an entry.
These levels are estimated setups, not guaranteed outcomes. Always manage your risk.#USOctoberNFP-AreRateCutsStillPossible #USMidtermElections #AppleReportsMixedResults #BinanceReopensWithdrawalsForMoreAssets
{spot}(HOTUSDT)
{future}(ICNTUSDT)
{future}(AGTUSDT)
🔥 3 Trending Perpetual Coins: $HOT U, $ICNT & $AGT – Trading Opportunities!
The market is showing strong momentum, but chasing a big green candle can be risky. Here are three coins worth watching for a possible entry.
HOTU/USDT – $0.0005417 (+43.04%)
Buy Zone: $0.000515–$0.000530
Target 1: $0.000560
Target 2: $0.000580
Target 3: $0.000610
Stop Loss: $0.000495
ICNT/USDT – $0.2277 (+37.00%)
Buy Zone: $0.2180–$0.2230
Target 1: $0.2350
Target 2: $0.2450
Target 3: $0.2600
Stop Loss: $0.2080
AGT/USDT – $0.03842 (+31.13%)
Buy Zone: $0.03680–$0.03770
Target 1: $0.04000
Target 2: $0.04150
Target 3: $0.04350
Stop Loss: $0.03550
My Strategy: Wait for a pullback and bullish confirmation before entering. Watch volume carefully, avoid chasing sudden pumps, and use low leverage. If support breaks, skip the trade rather than forcing an entry.
These levels are estimated setups, not guaranteed outcomes. Always manage your risk.#USOctoberNFP-AreRateCutsStillPossible #USMidtermElections #AppleReportsMixedResults #BinanceReopensWithdrawalsForMoreAssets
The market is showing strong momentum, but chasing a big green candle can be risky. Here are three coins worth watching for a possible entry.
HOTU/USDT – $0.0005417 (+43.04%)
Buy Zone: $0.000515–$0.000530
Target 1: $0.000560
Target 2: $0.000580
Target 3: $0.000610
Stop Loss: $0.000495
ICNT/USDT – $0.2277 (+37.00%)
Buy Zone: $0.2180–$0.2230
Target 1: $0.2350
Target 2: $0.2450
Target 3: $0.2600
Stop Loss: $0.2080
AGT/USDT – $0.03842 (+31.13%)
Buy Zone: $0.03680–$0.03770
Target 1: $0.04000
Target 2: $0.04150
Target 3: $0.04350
Stop Loss: $0.03550
My Strategy: Wait for a pullback and bullish confirmation before entering. Watch volume carefully, avoid chasing sudden pumps, and use low leverage. If support breaks, skip the trade rather than forcing an entry.
These levels are estimated setups, not guaranteed outcomes. Always manage your risk.#USOctoberNFP-AreRateCutsStillPossible #USMidtermElections #AppleReportsMixedResults #BinanceReopensWithdrawalsForMoreAssets
HOT💪💝🕺🪻
56%
ICNT💙💚🌹
22%
AGT💐🪻🕺
22%
18 votes • Voting closed
2
1.2k
·
--
Bullish
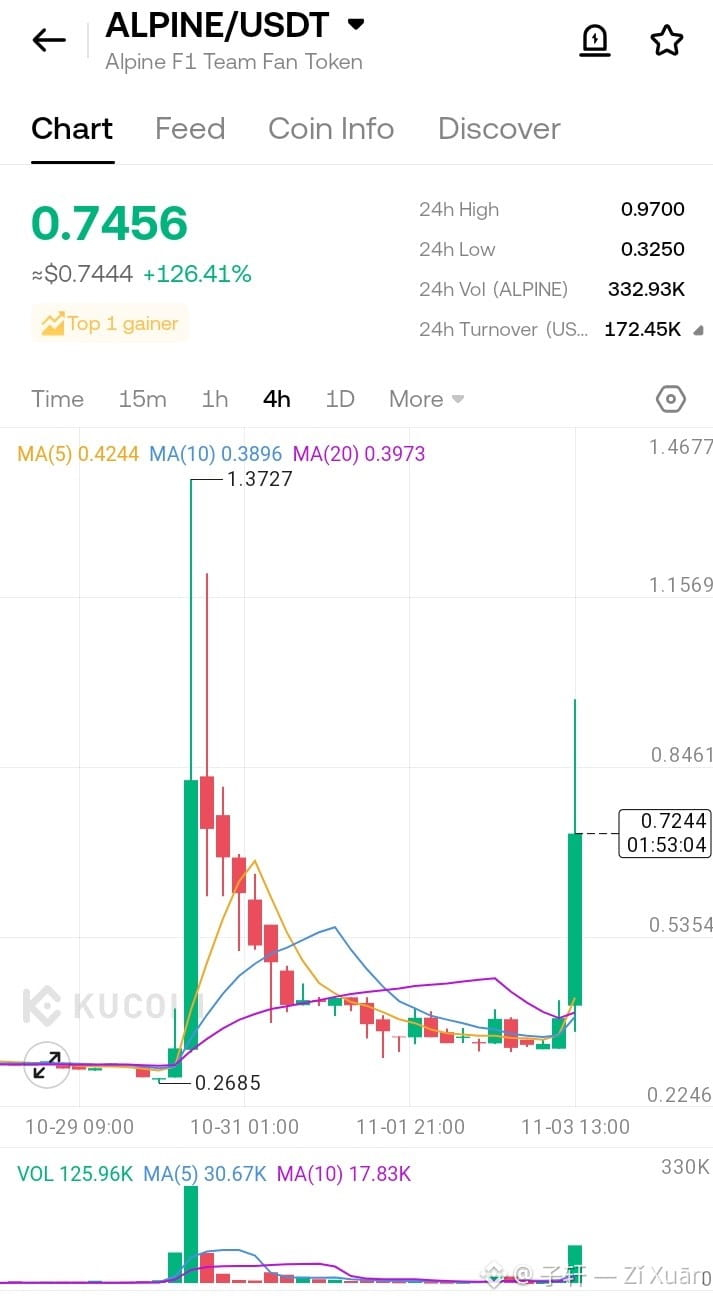
🔥 $ALPINE /USDT: A Massive 124% Rally!
ALPINE is making a strong move, currently around $0.74, with an impressive gain of 124.71%.
But after such a sharp rally, chasing the price can be dangerous. I would prefer waiting for consolidation and a healthy pullback before considering an entry.
📍 Trading Plan
🟢 Buy Zone: $0.68–$0.72
🎯 Target 1: $0.78
🎯 Target 2: $0.83
🎯 Target 3: $0.90
🛑 Stop Loss: $0.65
My Strategy: Watch for buying volume and support confirmation. If the price loses support, avoid forcing a trade. Protect profits and keep leverage low.
Momentum is exciting, but risk management matters more. DYOR.#Verify1to1BinanceReserves #BinanceHourlyDepositsExceedWithdrawals #BinanceReopensWithdrawalsForMoreAssets #SBIFirstHalfCryptoRevenueFalls30.1%
{future}(ALPINEUSDT)
🔥 $ALPINE /USDT: A Massive 124% Rally!
ALPINE is making a strong move, currently around $0.74, with an impressive gain of 124.71%.
But after such a sharp rally, chasing the price can be dangerous. I would prefer waiting for consolidation and a healthy pullback before considering an entry.
📍 Trading Plan
🟢 Buy Zone: $0.68–$0.72
🎯 Target 1: $0.78
🎯 Target 2: $0.83
🎯 Target 3: $0.90
🛑 Stop Loss: $0.65
My Strategy: Watch for buying volume and support confirmation. If the price loses support, avoid forcing a trade. Protect profits and keep leverage low.
Momentum is exciting, but risk management matters more. DYOR.#Verify1to1BinanceReserves #BinanceHourlyDepositsExceedWithdrawals #BinanceReopensWithdrawalsForMoreAssets #SBIFirstHalfCryptoRevenueFalls30.1%
ALPINE is making a strong move, currently around $0.74, with an impressive gain of 124.71%.
But after such a sharp rally, chasing the price can be dangerous. I would prefer waiting for consolidation and a healthy pullback before considering an entry.
📍 Trading Plan
🟢 Buy Zone: $0.68–$0.72
🎯 Target 1: $0.78
🎯 Target 2: $0.83
🎯 Target 3: $0.90
🛑 Stop Loss: $0.65
My Strategy: Watch for buying volume and support confirmation. If the price loses support, avoid forcing a trade. Protect profits and keep leverage low.
Momentum is exciting, but risk management matters more. DYOR.#Verify1to1BinanceReserves #BinanceHourlyDepositsExceedWithdrawals #BinanceReopensWithdrawalsForMoreAssets #SBIFirstHalfCryptoRevenueFalls30.1%
2
3
567
·
--
🔥 Top 3 Gainers: Watch These Trading Opportunities!
$AGT /USDT – $0.03569 (+24.88%) Buy Zone: $0.03450–$0.03530 Target 1: $0.03680 Target 2: $0.03800 Target 3: $0.03950 Stop Loss: $0.03370
$JCT /USDT – $0.005018 (+23.63%) Buy Zone: $0.00485–$0.00498 Target 1: $0.00520 Target 2: $0.00538 Target 3: $0.00560 Stop Loss: $0.00472
$ICNT /USDT – $0.2001 (+20.77%) Buy Zone: $0.1940–$0.1980 Target 1: $0.2060 Target 2: $0.2130 Target 3: $0.2220 Stop Loss: $0.1890
My Strategy: Wait for pullbacks, confirm buying volume, and avoid chasing sudden pumps. Use low leverage and protect your capital.#USOctoberNFP-AreRateCutsStillPossible #BinanceHourlyDepositsExceedWithdrawals #BinanceReopensWithdrawalsForMoreAssets #Verify1to1BinanceReserves
{future}(AGTUSDT)
{future}(JCTUSDT)
{future}(ICNTUSDT)
🔥 Top 3 Gainers: Watch These Trading Opportunities!
$AGT /USDT – $0.03569 (+24.88%) Buy Zone: $0.03450–$0.03530 Target 1: $0.03680 Target 2: $0.03800 Target 3: $0.03950 Stop Loss: $0.03370
$JCT /USDT – $0.005018 (+23.63%) Buy Zone: $0.00485–$0.00498 Target 1: $0.00520 Target 2: $0.00538 Target 3: $0.00560 Stop Loss: $0.00472
$ICNT /USDT – $0.2001 (+20.77%) Buy Zone: $0.1940–$0.1980 Target 1: $0.2060 Target 2: $0.2130 Target 3: $0.2220 Stop Loss: $0.1890
My Strategy: Wait for pullbacks, confirm buying volume, and avoid chasing sudden pumps. Use low leverage and protect your capital.#USOctoberNFP-AreRateCutsStillPossible #BinanceHourlyDepositsExceedWithdrawals #BinanceReopensWithdrawalsForMoreAssets #Verify1to1BinanceReserves
$AGT /USDT – $0.03569 (+24.88%) Buy Zone: $0.03450–$0.03530 Target 1: $0.03680 Target 2: $0.03800 Target 3: $0.03950 Stop Loss: $0.03370
$JCT /USDT – $0.005018 (+23.63%) Buy Zone: $0.00485–$0.00498 Target 1: $0.00520 Target 2: $0.00538 Target 3: $0.00560 Stop Loss: $0.00472
$ICNT /USDT – $0.2001 (+20.77%) Buy Zone: $0.1940–$0.1980 Target 1: $0.2060 Target 2: $0.2130 Target 3: $0.2220 Stop Loss: $0.1890
My Strategy: Wait for pullbacks, confirm buying volume, and avoid chasing sudden pumps. Use low leverage and protect your capital.#USOctoberNFP-AreRateCutsStillPossible #BinanceHourlyDepositsExceedWithdrawals #BinanceReopensWithdrawalsForMoreAssets #Verify1to1BinanceReserves
AGT🪻🕺💝💪
26%
JCT💪💚💙
45%
ICNT🕺💝
29%
42 votes • Voting closed
1
3.8k
·
--
The market is showing strong momentum, and these three contracts deserve attention. However, smart entries matter more than chasing fast pumps.
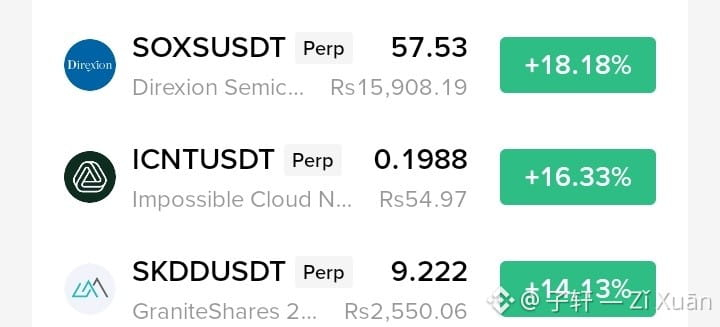
$SOXSB USDT – $57.53 (+18.18%) Buy Zone: $55.50–56.50 Targets: $59.00 / $61.00 / $63.00 Stop Loss: $53.80
$ICNT USDT – $0.1988 (+16.33%) Buy Zone: $0.1920–0.1960 Targets: $0.2040 / $0.2110 / $0.2200 Stop Loss: $0.1860
$SKDD
{future}(SKDDUSDT)
USDT – $9.222 (+14.13%) Buy Zone: $8.90–9.10 Targets: $9.50 / $9.85 / $10.20 Stop Loss: $8.65
Wait for bullish confirmation before entry. Avoid high leverage and protect your capital. These are estimated setups, not guaranteed targets.#Verify1to1BinanceReserves #USMidtermElections #AppleReportsMixedResults #BinanceReopensWithdrawalsForMoreAssets
{spot}(SOXSBUSDT)
{future}(ICNTUSDT)
The market is showing strong momentum, and these three contracts deserve attention. However, smart entries matter more than chasing fast pumps.
$SOXSB USDT – $57.53 (+18.18%) Buy Zone: $55.50–56.50 Targets: $59.00 / $61.00 / $63.00 Stop Loss: $53.80
$ICNT USDT – $0.1988 (+16.33%) Buy Zone: $0.1920–0.1960 Targets: $0.2040 / $0.2110 / $0.2200 Stop Loss: $0.1860
$SKDD
USDT – $9.222 (+14.13%) Buy Zone: $8.90–9.10 Targets: $9.50 / $9.85 / $10.20 Stop Loss: $8.65
Wait for bullish confirmation before entry. Avoid high leverage and protect your capital. These are estimated setups, not guaranteed targets.#Verify1to1BinanceReserves #USMidtermElections #AppleReportsMixedResults #BinanceReopensWithdrawalsForMoreAssets
$SOXSB USDT – $57.53 (+18.18%) Buy Zone: $55.50–56.50 Targets: $59.00 / $61.00 / $63.00 Stop Loss: $53.80
$ICNT USDT – $0.1988 (+16.33%) Buy Zone: $0.1920–0.1960 Targets: $0.2040 / $0.2110 / $0.2200 Stop Loss: $0.1860
$SKDD
USDT – $9.222 (+14.13%) Buy Zone: $8.90–9.10 Targets: $9.50 / $9.85 / $10.20 Stop Loss: $8.65
Wait for bullish confirmation before entry. Avoid high leverage and protect your capital. These are estimated setups, not guaranteed targets.#Verify1to1BinanceReserves #USMidtermElections #AppleReportsMixedResults #BinanceReopensWithdrawalsForMoreAssets
1
450
·
--
$AGT USDT – Alaya Governance
Price: $0.04422 (+53.33%)
AGT is leading the rally with strong momentum. Watch for a pullback before entering.
Buy Zone: $0.0415–$0.0430
Target 1: $0.0460
Target 2: $0.0485
Target 3: $0.0520
Stop Loss: $0.0395
$ARIA USDT – AriaAI
Price: $0.11500 (+37.82%)
ARIA is showing strong buying interest, but volatility remains high.
Buy Zone: $0.1080–$0.1120
Target 1: $0.1190
Target 2: $0.1240
Target 3: $0.1300
Stop Loss: $0.1030
$EVAA USDT – EVAA Protocol
Price: $1.4793 (+21.50%)
EVAA is gaining attention and may continue higher if buyers defend support.
Buy Zone: $1.420–$1.455
Target 1: $1.510
Target 2: $1.560
Target 3: $1.630
Stop Loss: $1.385
My strategy: Wait for pullbacks and bullish confirmation. Never chase a sudden pump. Protect your capital first.#Verify1to1BinanceReserves #USMidtermElections #BinanceReopensWithdrawalsForMoreAssets #AppleReportsMixedResults
{future}(AGTUSDT)
{future}(ARIAUSDT)
{future}(EVAAUSDT)
$AGT USDT – Alaya Governance
Price: $0.04422 (+53.33%)
AGT is leading the rally with strong momentum. Watch for a pullback before entering.
Buy Zone: $0.0415–$0.0430
Target 1: $0.0460
Target 2: $0.0485
Target 3: $0.0520
Stop Loss: $0.0395
$ARIA USDT – AriaAI
Price: $0.11500 (+37.82%)
ARIA is showing strong buying interest, but volatility remains high.
Buy Zone: $0.1080–$0.1120
Target 1: $0.1190
Target 2: $0.1240
Target 3: $0.1300
Stop Loss: $0.1030
$EVAA USDT – EVAA Protocol
Price: $1.4793 (+21.50%)
EVAA is gaining attention and may continue higher if buyers defend support.
Buy Zone: $1.420–$1.455
Target 1: $1.510
Target 2: $1.560
Target 3: $1.630
Stop Loss: $1.385
My strategy: Wait for pullbacks and bullish confirmation. Never chase a sudden pump. Protect your capital first.#Verify1to1BinanceReserves #USMidtermElections #BinanceReopensWithdrawalsForMoreAssets #AppleReportsMixedResults
Price: $0.04422 (+53.33%)
AGT is leading the rally with strong momentum. Watch for a pullback before entering.
Buy Zone: $0.0415–$0.0430
Target 1: $0.0460
Target 2: $0.0485
Target 3: $0.0520
Stop Loss: $0.0395
$ARIA USDT – AriaAI
Price: $0.11500 (+37.82%)
ARIA is showing strong buying interest, but volatility remains high.
Buy Zone: $0.1080–$0.1120
Target 1: $0.1190
Target 2: $0.1240
Target 3: $0.1300
Stop Loss: $0.1030
$EVAA USDT – EVAA Protocol
Price: $1.4793 (+21.50%)
EVAA is gaining attention and may continue higher if buyers defend support.
Buy Zone: $1.420–$1.455
Target 1: $1.510
Target 2: $1.560
Target 3: $1.630
Stop Loss: $1.385
My strategy: Wait for pullbacks and bullish confirmation. Never chase a sudden pump. Protect your capital first.#Verify1to1BinanceReserves #USMidtermElections #BinanceReopensWithdrawalsForMoreAssets #AppleReportsMixedResults
AGTUSDT💙🕺🪻
72%
EVAAUSDT,💪💚💙🕺
28%
ARIAUSDT💝🕺💙
0%
32 votes • Voting closed
2
3.5k
·
--
🔥 $ARIA USDT: A Powerful 40% Rally – Is Another Breakout Coming?
ARIA is showing strong buying pressure, currently trading at $0.11686, up 40.10%. The volume is impressive, with $202.66M in 24-hour turnover.
The EMA structure is bullish:
- EMA 7: $0.10305
- EMA 25: $0.09082
- EMA 99: $0.07383
All three EMAs are aligned positively, suggesting buyers still have control. However, after such a sharp rally, a short pullback would not be surprising.
My Trading Plan:
🟢 Buy Zone: $0.10800 – $0.11300
🎯 Target 1: $0.12300
🎯 Target 2: $0.13480
🎯 Target 3: $0.13780
🔴 Stop Loss: $0.10200
What Next?
A strong breakout above $0.12300 with volume could open the way toward $0.13487. If price loses $0.10800, buyers may need more time to rebuild momentum.
My strategy is simple: wait for a healthy pullback or confirmed breakout. Don't chase a 40% green candle.
Trade smart. Protect your capital. Let confirmation lead your decisions.#BinanceRestores28FiatWithdrawals #AppleEarningsAhead-CanStockHitNewHigh #BinanceWithdrawalScamWarning
{alpha}(560x5d3a12c42e5372b2cc3264ab3cdcf660a1555238)
🔥 $ARIA USDT: A Powerful 40% Rally – Is Another Breakout Coming?
ARIA is showing strong buying pressure, currently trading at $0.11686, up 40.10%. The volume is impressive, with $202.66M in 24-hour turnover.
The EMA structure is bullish:
- EMA 7: $0.10305
- EMA 25: $0.09082
- EMA 99: $0.07383
All three EMAs are aligned positively, suggesting buyers still have control. However, after such a sharp rally, a short pullback would not be surprising.
My Trading Plan:
🟢 Buy Zone: $0.10800 – $0.11300
🎯 Target 1: $0.12300
🎯 Target 2: $0.13480
🎯 Target 3: $0.13780
🔴 Stop Loss: $0.10200
What Next?
A strong breakout above $0.12300 with volume could open the way toward $0.13487. If price loses $0.10800, buyers may need more time to rebuild momentum.
My strategy is simple: wait for a healthy pullback or confirmed breakout. Don't chase a 40% green candle.
Trade smart. Protect your capital. Let confirmation lead your decisions.#BinanceRestores28FiatWithdrawals #AppleEarningsAhead-CanStockHitNewHigh #BinanceWithdrawalScamWarning
ARIA is showing strong buying pressure, currently trading at $0.11686, up 40.10%. The volume is impressive, with $202.66M in 24-hour turnover.
The EMA structure is bullish:
- EMA 7: $0.10305
- EMA 25: $0.09082
- EMA 99: $0.07383
All three EMAs are aligned positively, suggesting buyers still have control. However, after such a sharp rally, a short pullback would not be surprising.
My Trading Plan:
🟢 Buy Zone: $0.10800 – $0.11300
🎯 Target 1: $0.12300
🎯 Target 2: $0.13480
🎯 Target 3: $0.13780
🔴 Stop Loss: $0.10200
What Next?
A strong breakout above $0.12300 with volume could open the way toward $0.13487. If price loses $0.10800, buyers may need more time to rebuild momentum.
My strategy is simple: wait for a healthy pullback or confirmed breakout. Don't chase a 40% green candle.
Trade smart. Protect your capital. Let confirmation lead your decisions.#BinanceRestores28FiatWithdrawals #AppleEarningsAhead-CanStockHitNewHigh #BinanceWithdrawalScamWarning
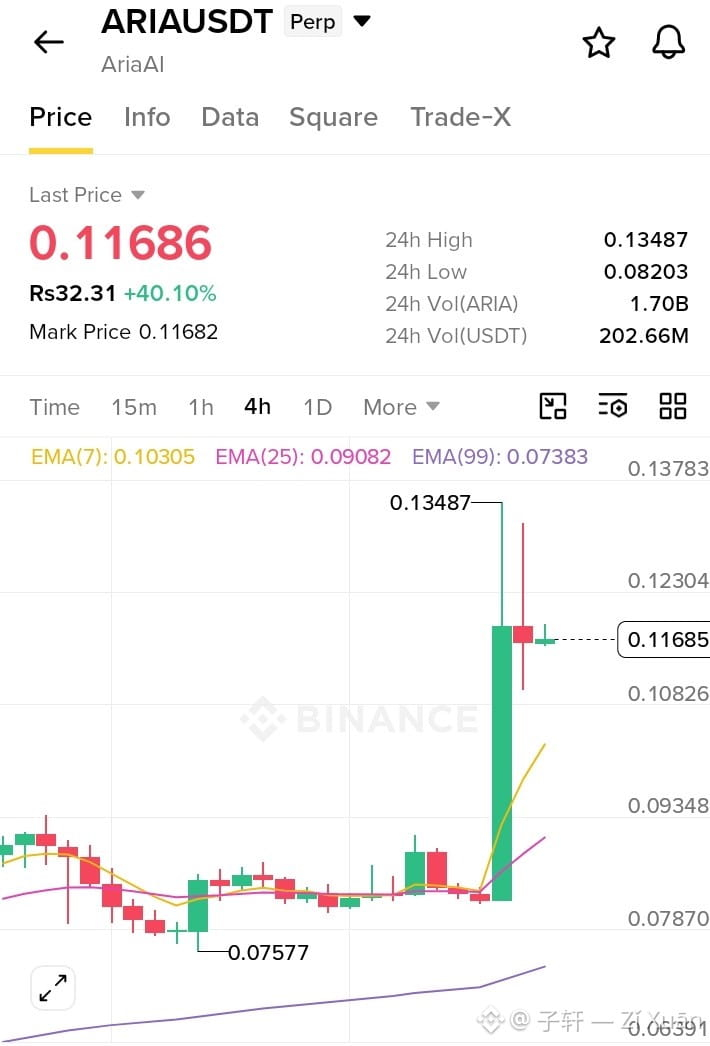
3
511
·
--
$ARIA USDT – Strongest Momentum
Price: $0.11992 (+44.00%)
Buy Zone: $0.1160–$0.1190
Target 1: $0.1240
Target 2: $0.1300
Target 3: $0.1380
Stop Loss: $0.1115
$LYN USDT – Watch for Continuation
Price: $0.01860 (+25.76%)
Buy Zone: $0.0180–$0.0184
Target 1: $0.0192
Target 2: $0.0200
Target 3: $0.0210
Stop Loss: $0.0173
. $EVAA USDT – Bullish Momentum
Price: $1.4282 (+19.10%)
Buy Zone: $1.390–$1.415
Target 1: $1.480
Target 2: $1.540
Target 3: $1.620
Stop Loss: $1.340
My first choice is ARIA because of its stronger momentum. Avoid chasing pumps. Wait for a pullback and bullish confirmation before entering. Use low leverage and manage risk carefully.
#CryptoTrading #Futures #Binance
{future}(ARIAUSDT)
{future}(LYNUSDT)
{future}(EVAAUSDT)
$ARIA USDT – Strongest Momentum
Price: $0.11992 (+44.00%)
Buy Zone: $0.1160–$0.1190
Target 1: $0.1240
Target 2: $0.1300
Target 3: $0.1380
Stop Loss: $0.1115
$LYN USDT – Watch for Continuation
Price: $0.01860 (+25.76%)
Buy Zone: $0.0180–$0.0184
Target 1: $0.0192
Target 2: $0.0200
Target 3: $0.0210
Stop Loss: $0.0173
. $EVAA USDT – Bullish Momentum
Price: $1.4282 (+19.10%)
Buy Zone: $1.390–$1.415
Target 1: $1.480
Target 2: $1.540
Target 3: $1.620
Stop Loss: $1.340
My first choice is ARIA because of its stronger momentum. Avoid chasing pumps. Wait for a pullback and bullish confirmation before entering. Use low leverage and manage risk carefully.
#CryptoTrading #Futures #Binance
Price: $0.11992 (+44.00%)
Buy Zone: $0.1160–$0.1190
Target 1: $0.1240
Target 2: $0.1300
Target 3: $0.1380
Stop Loss: $0.1115
$LYN USDT – Watch for Continuation
Price: $0.01860 (+25.76%)
Buy Zone: $0.0180–$0.0184
Target 1: $0.0192
Target 2: $0.0200
Target 3: $0.0210
Stop Loss: $0.0173
. $EVAA USDT – Bullish Momentum
Price: $1.4282 (+19.10%)
Buy Zone: $1.390–$1.415
Target 1: $1.480
Target 2: $1.540
Target 3: $1.620
Stop Loss: $1.340
My first choice is ARIA because of its stronger momentum. Avoid chasing pumps. Wait for a pullback and bullish confirmation before entering. Use low leverage and manage risk carefully.
#CryptoTrading #Futures #Binance
ARIAUSDT💪💚💙🕺🪻
66%
LYNUSDT💚💙🪻
17%
EVAAUSDT🪻💙💚
17%
6 votes • Voting closed
1
734
·
--
$BNB
{spot}(BNBUSDT)
-261113-680-P: Is a Recovery Move Coming?
This BNB options contract is trading around 12.0, while its last price is 13.8. Short-term momentum looks weak because the mark price is below EMA 7 at 15.3. Buyers need to push the contract back above this level to improve the outlook. I would avoid rushing into a position and wait for stronger buying volume and confirmation. If momentum returns, a recovery toward 13.5 and 15.0 could become possible. Risk management is especially important with options contracts.
Buy Zone: 11.5–12.0
Target 1: 13.5
Target 2: 15.0
Target 3: 17.0
Stop Loss: 10.5
Trade carefully and avoid excessive leverage.#IndiaRBIAndFIUReviewOverseasCryptoCards #HongKongEnablesRoundTheClockTokenizedSettlement #ETHFalls16.1%InOctober #BinanceRestores28FiatWithdrawals $BTC
{spot}(BTCUSDT)
$BNB
-261113-680-P: Is a Recovery Move Coming?
This BNB options contract is trading around 12.0, while its last price is 13.8. Short-term momentum looks weak because the mark price is below EMA 7 at 15.3. Buyers need to push the contract back above this level to improve the outlook. I would avoid rushing into a position and wait for stronger buying volume and confirmation. If momentum returns, a recovery toward 13.5 and 15.0 could become possible. Risk management is especially important with options contracts.
Buy Zone: 11.5–12.0
Target 1: 13.5
Target 2: 15.0
Target 3: 17.0
Stop Loss: 10.5
Trade carefully and avoid excessive leverage.#IndiaRBIAndFIUReviewOverseasCryptoCards #HongKongEnablesRoundTheClockTokenizedSettlement #ETHFalls16.1%InOctober #BinanceRestores28FiatWithdrawals $BTC
-261113-680-P: Is a Recovery Move Coming?
This BNB options contract is trading around 12.0, while its last price is 13.8. Short-term momentum looks weak because the mark price is below EMA 7 at 15.3. Buyers need to push the contract back above this level to improve the outlook. I would avoid rushing into a position and wait for stronger buying volume and confirmation. If momentum returns, a recovery toward 13.5 and 15.0 could become possible. Risk management is especially important with options contracts.
Buy Zone: 11.5–12.0
Target 1: 13.5
Target 2: 15.0
Target 3: 17.0
Stop Loss: 10.5
Trade carefully and avoid excessive leverage.#IndiaRBIAndFIUReviewOverseasCryptoCards #HongKongEnablesRoundTheClockTokenizedSettlement #ETHFalls16.1%InOctober #BinanceRestores28FiatWithdrawals $BTC
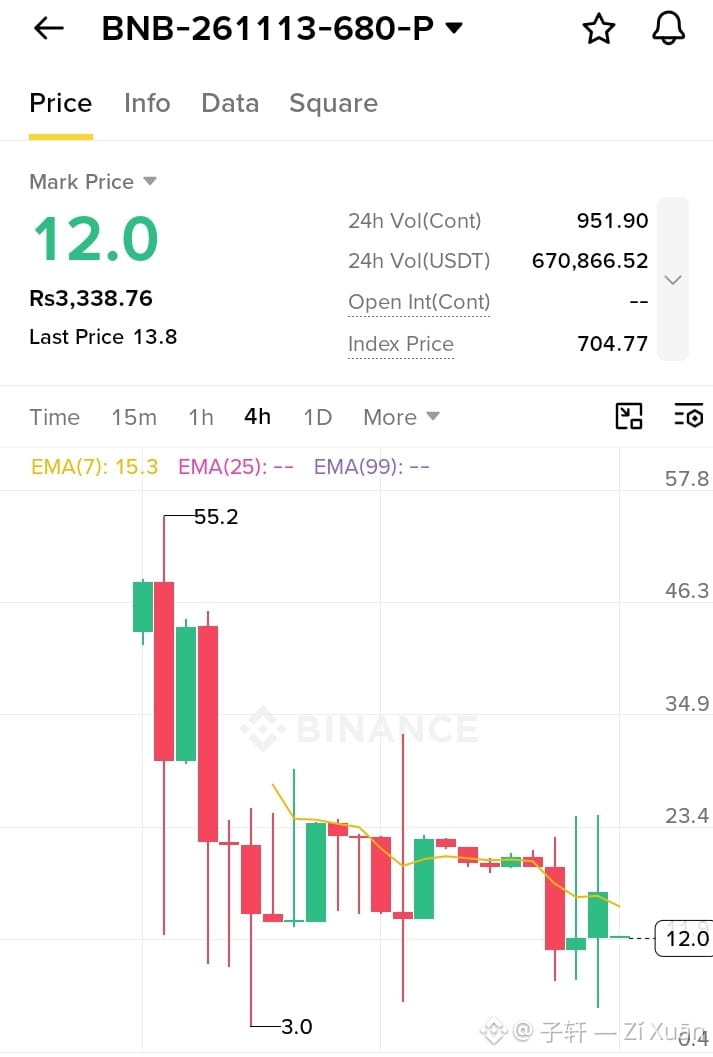
1
79
·
--
🚀 Top 3 Crypto Futures Gainers – What's Next
The market is showing strong momentum, with ARIA taking the lead. IDOL and LYN are also attracting attention. Here is the updated trading watchlist.
Coin Price 24h Change
$ARIA $0.13026 +52.73%
$IDOL $0.026368 +39.24%
$LYN $0.01880 +32.49%
My trading strategy: ARIA is currently leading, but its sharp rally makes chasing risky. IDOL could offer another opportunity after a healthy pullback. LYN is worth watching if buyers defend its support. I would wait for confirmation, monitor trading volume, and avoid high leverage. Protecting capital matters more than catching every green candle.
Estimated trade setups
ARIA: Buy $0.1230–$0.1270 | Targets $0.1350 / $0.1420 / $0.1500 | SL $0.1180
IDOL: Buy $0.0250–$0.0257 | Targets $0.0275 / $0.0288 / $0.0300 | SL $0.0242
LYN: Buy $0.0179–$0.0184 | Targets $0.0195 / $0.0205 / $0.0218 | SL $0.0172
Levels are estimates, not verified technical signals. Always confirm with the live chart before entering.#BTCPayServerUrgesOperatorsToShutDownInstances #BrazilVirtualAssetLicenseDeadlineDrawsAbout40Firms #BitcoinClosesAbove50WeekMAFor7thStraightWeek #BTCPayServerUrgesOperatorsToShutDownInstances
{future}(ARIAUSDT)
{future}(IDOLUSDT)
{future}(LYNUSDT)
🚀 Top 3 Crypto Futures Gainers – What's Next
The market is showing strong momentum, with ARIA taking the lead. IDOL and LYN are also attracting attention. Here is the updated trading watchlist.
Coin Price 24h Change
$ARIA $0.13026 +52.73%
$IDOL $0.026368 +39.24%
$LYN $0.01880 +32.49%
My trading strategy: ARIA is currently leading, but its sharp rally makes chasing risky. IDOL could offer another opportunity after a healthy pullback. LYN is worth watching if buyers defend its support. I would wait for confirmation, monitor trading volume, and avoid high leverage. Protecting capital matters more than catching every green candle.
Estimated trade setups
ARIA: Buy $0.1230–$0.1270 | Targets $0.1350 / $0.1420 / $0.1500 | SL $0.1180
IDOL: Buy $0.0250–$0.0257 | Targets $0.0275 / $0.0288 / $0.0300 | SL $0.0242
LYN: Buy $0.0179–$0.0184 | Targets $0.0195 / $0.0205 / $0.0218 | SL $0.0172
Levels are estimates, not verified technical signals. Always confirm with the live chart before entering.#BTCPayServerUrgesOperatorsToShutDownInstances #BrazilVirtualAssetLicenseDeadlineDrawsAbout40Firms #BitcoinClosesAbove50WeekMAFor7thStraightWeek #BTCPayServerUrgesOperatorsToShutDownInstances
The market is showing strong momentum, with ARIA taking the lead. IDOL and LYN are also attracting attention. Here is the updated trading watchlist.
Coin Price 24h Change
$ARIA $0.13026 +52.73%
$IDOL $0.026368 +39.24%
$LYN $0.01880 +32.49%
My trading strategy: ARIA is currently leading, but its sharp rally makes chasing risky. IDOL could offer another opportunity after a healthy pullback. LYN is worth watching if buyers defend its support. I would wait for confirmation, monitor trading volume, and avoid high leverage. Protecting capital matters more than catching every green candle.
Estimated trade setups
ARIA: Buy $0.1230–$0.1270 | Targets $0.1350 / $0.1420 / $0.1500 | SL $0.1180
IDOL: Buy $0.0250–$0.0257 | Targets $0.0275 / $0.0288 / $0.0300 | SL $0.0242
LYN: Buy $0.0179–$0.0184 | Targets $0.0195 / $0.0205 / $0.0218 | SL $0.0172
Levels are estimates, not verified technical signals. Always confirm with the live chart before entering.#BTCPayServerUrgesOperatorsToShutDownInstances #BrazilVirtualAssetLicenseDeadlineDrawsAbout40Firms #BitcoinClosesAbove50WeekMAFor7thStraightWeek #BTCPayServerUrgesOperatorsToShutDownInstances
ARIA💪🪻💙💚
57%
IDOL💚💙🪻
29%
LYN🪻💙💪
14%
21 votes • Voting closed
1
2.3k
·
--
NEXT NORTH KOREA?
:
The U.S.,
South Korea, and Japan have issued their first joint statement regarding the complete denuclearization of North Korea, following a record-high increase in trilateral defense treaties, missiles, weapons, and ground forces.
Are the U.S., Japan, and South Korea preparing to launch their first ground offensive against North Korea over weapons of mass destruction?
$ESPORTS
{future}(ESPORTSUSDT)
$ZAMA $MITO
{spot}(MITOUSDT)
NEXT NORTH KOREA?
:
The U.S.,
South Korea, and Japan have issued their first joint statement regarding the complete denuclearization of North Korea, following a record-high increase in trilateral defense treaties, missiles, weapons, and ground forces.
Are the U.S., Japan, and South Korea preparing to launch their first ground offensive against North Korea over weapons of mass destruction?
$ESPORTS
$ZAMA $MITO
:
The U.S.,
South Korea, and Japan have issued their first joint statement regarding the complete denuclearization of North Korea, following a record-high increase in trilateral defense treaties, missiles, weapons, and ground forces.
Are the U.S., Japan, and South Korea preparing to launch their first ground offensive against North Korea over weapons of mass destruction?
$ESPORTS
$ZAMA $MITO


1
210
Log in to explore more content
Join global crypto users on Binance Square
⚡️ Get latest and useful information about crypto.
💬 Trusted by the world’s largest crypto exchange.
👍 Discover real insights from verified creators.
Email / Phone number
Trending Topics
BTCRebounds80K
28,606 views
540 Discussing
BITCOIN UPDATE I’M STILL BEARISH, AND HERE’S WHY! 🚨⚠️
As you all witnessed, BTC bounced back from the $75,700 area and touched $81K. First, the market trapped long traders, and then it trapped short traders.
I’m still bearish. First of all, as everyone knows, Democrats won today’s US midterm elections, and in my view, this outcome is bearish for the market.
The market can remain volatile in the short term and trap as many traders as it wants, but that doesn’t change the overall market outlook.
There are several important upcoming events, including US Non Farm Payrolls (November 6), US CPI Inflation (November 10), US PPI (November 13), US Retail Sales (November 17), FOMC Meeting Minutes (November 18), US PCE Inflation (November 25), Federal Reserve interest rate expectations, the US Dollar Index (DXY), Treasury Yields, Nasdaq performance, Bitcoin ETF flows, and ongoing( Iran ) Israel geopolitical developments. All of these could have a significant impact on Bitcoin and the overall crypto market.
But don’t get too carried away by Bitcoin’s recent movement. Technically speaking, there hasn’t been any major bullish move yet. Yesterday, BTC was trading between $80K and $82K, and even today, it’s still around the same range.
If you want to turn bullish, that’s entirely your choice.
In my previous post, I clearly explained that BTC had technical support in the $75K / $76K zone, and the price bounced from that support and made its way back towards $80K. But this wasn’t something I had failed to mention before. In fact, I repeatedly mentioned in my posts that BTC could move towards $80K, $81K, or even $82K.
Despite that, I’m still bearish.
And I don’t have just one reason to support my bearish outlook. I have several reasons, which I’ve already explained in my previous posts.
For now, I’ll continue to wait for BTC to drop below $74K, which I believe could happen very soon. In my view, such a correction is also necessary for the market.
Anyone looking for crypto guidance just let me know.
#BTCRebounds80K
Strategic Adviser
·2 Likes
·619 views
Binance98PercentReplenished
25,513 views
473 Discussing
USMidterms-WhatAreMarketsExpecting?
297,315 views
1,961 Discussing