
World Of Crypto
360 Posts

World Of Crypto
Report
Block User
Open Trade
Frequent Trader
2.3 Years
5 Following
18 Followers
101 Liked
Posts
Portfolio
All
Quotes
$JCT /USDT – Explosive 212% Pump!
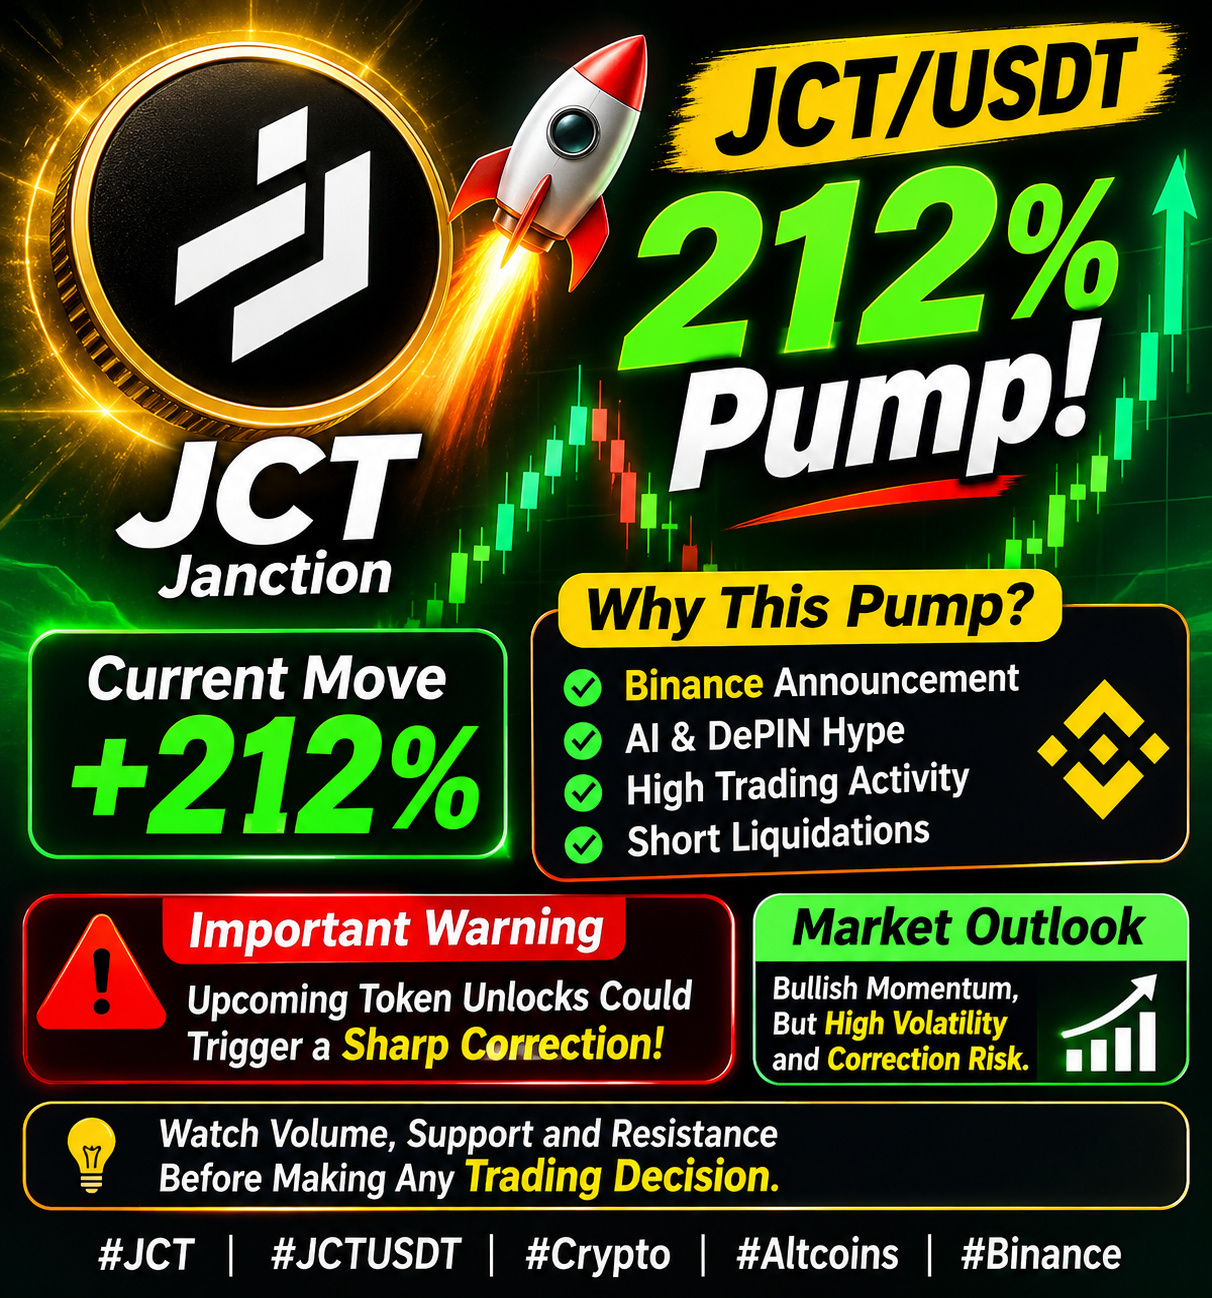
JCT/USDT is showing massive bullish momentum, with price reportedly surging over 212%. The rally is attracting attention due to AI and DePIN narratives, increased trading activity, and speculative market demand. However, traders should remain cautious as extreme volatility, profit-taking, and upcoming token unlocks could trigger sharp price corrections. Watch volume, support, and resistance before making any trading decision.
Market Outlook: Bullish momentum, but high volatility and correction risk.
#JCT
{future}(JCTUSDT)
#JobsReportRaisesHikeOdds
$JCT /USDT – Explosive 212% Pump!
JCT/USDT is showing massive bullish momentum, with price reportedly surging over 212%. The rally is attracting attention due to AI and DePIN narratives, increased trading activity, and speculative market demand. However, traders should remain cautious as extreme volatility, profit-taking, and upcoming token unlocks could trigger sharp price corrections. Watch volume, support, and resistance before making any trading decision.
Market Outlook: Bullish momentum, but high volatility and correction risk.
#JCT
#JobsReportRaisesHikeOdds
JCT/USDT is showing massive bullish momentum, with price reportedly surging over 212%. The rally is attracting attention due to AI and DePIN narratives, increased trading activity, and speculative market demand. However, traders should remain cautious as extreme volatility, profit-taking, and upcoming token unlocks could trigger sharp price corrections. Watch volume, support, and resistance before making any trading decision.
Market Outlook: Bullish momentum, but high volatility and correction risk.
#JCT
#JobsReportRaisesHikeOdds
325
$ETH /USDT – Ethereum Market Analysis
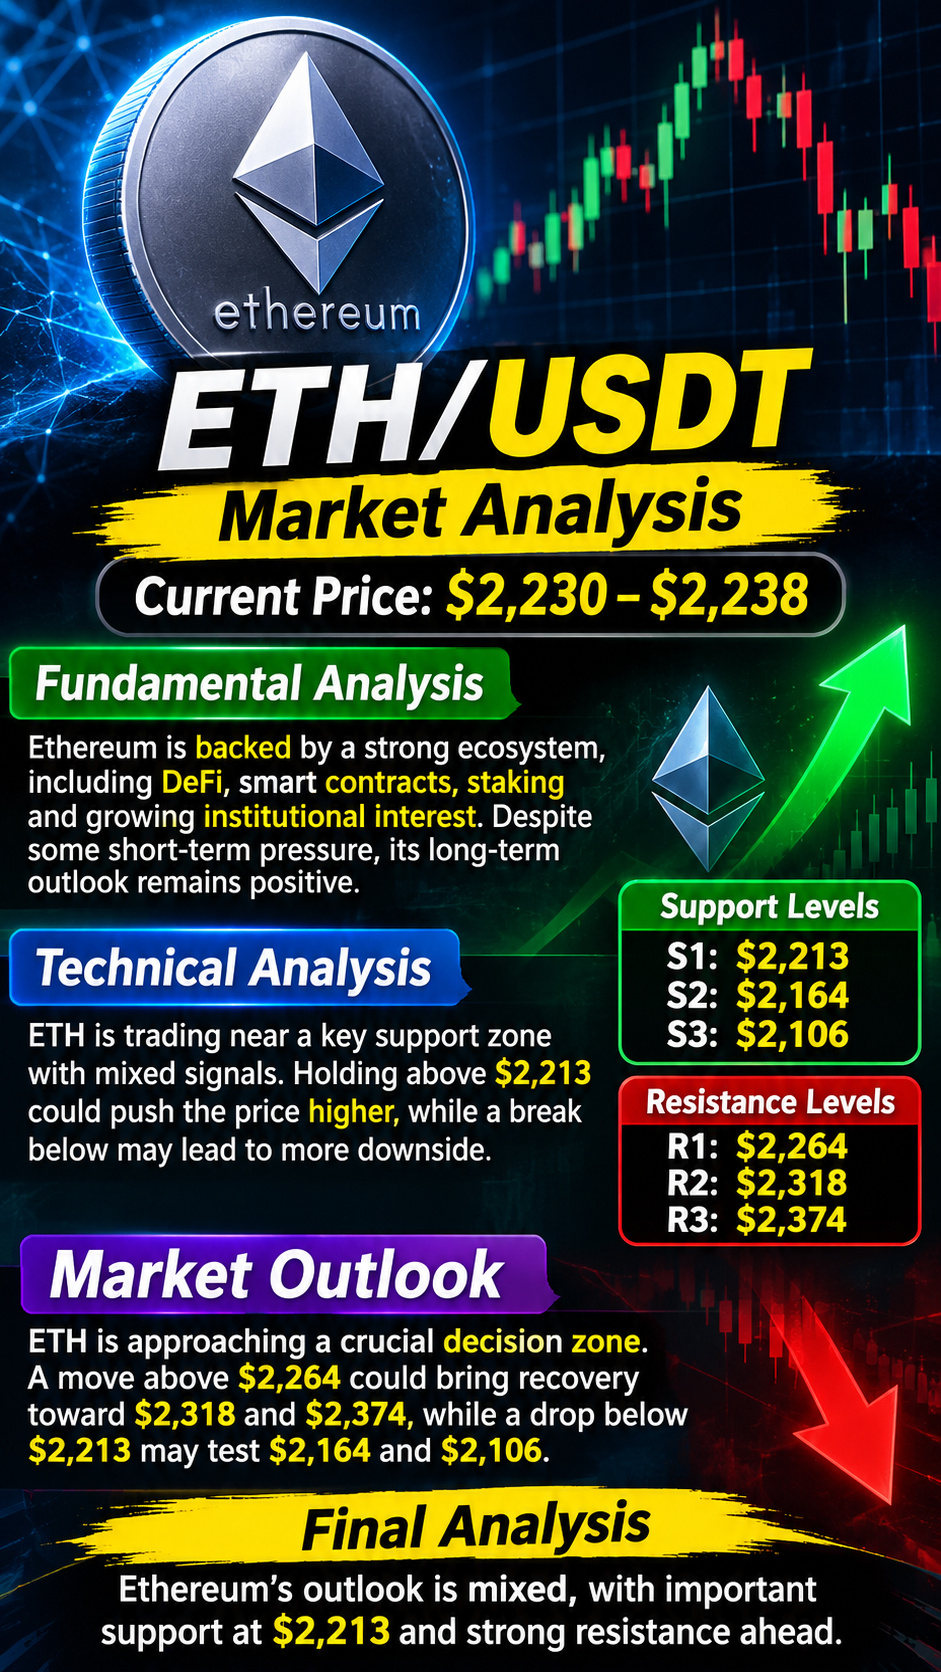
Ethereum is showing mixed market signals, with short-term bearish pressure creating an important battle around the $2,213 support zone. Fundamental strength remains supported by Ethereum's growing ecosystem, DeFi adoption, staking, and institutional interest. Technically, holding above $2,213 could trigger a recovery toward $2,264, $2,318, and $2,374, while a breakdown below support may expose $2,164 and $2,106. Traders should watch for confirmation before entering a position. Overall, ETH is approaching a crucial decision zone that could determine its next major move.
{spot}(ETHUSDT)
#WillAnthropicListOnTime
$ETH /USDT – Ethereum Market Analysis
Ethereum is showing mixed market signals, with short-term bearish pressure creating an important battle around the $2,213 support zone. Fundamental strength remains supported by Ethereum's growing ecosystem, DeFi adoption, staking, and institutional interest. Technically, holding above $2,213 could trigger a recovery toward $2,264, $2,318, and $2,374, while a breakdown below support may expose $2,164 and $2,106. Traders should watch for confirmation before entering a position. Overall, ETH is approaching a crucial decision zone that could determine its next major move.
#WillAnthropicListOnTime
Ethereum is showing mixed market signals, with short-term bearish pressure creating an important battle around the $2,213 support zone. Fundamental strength remains supported by Ethereum's growing ecosystem, DeFi adoption, staking, and institutional interest. Technically, holding above $2,213 could trigger a recovery toward $2,264, $2,318, and $2,374, while a breakdown below support may expose $2,164 and $2,106. Traders should watch for confirmation before entering a position. Overall, ETH is approaching a crucial decision zone that could determine its next major move.
#WillAnthropicListOnTime
35
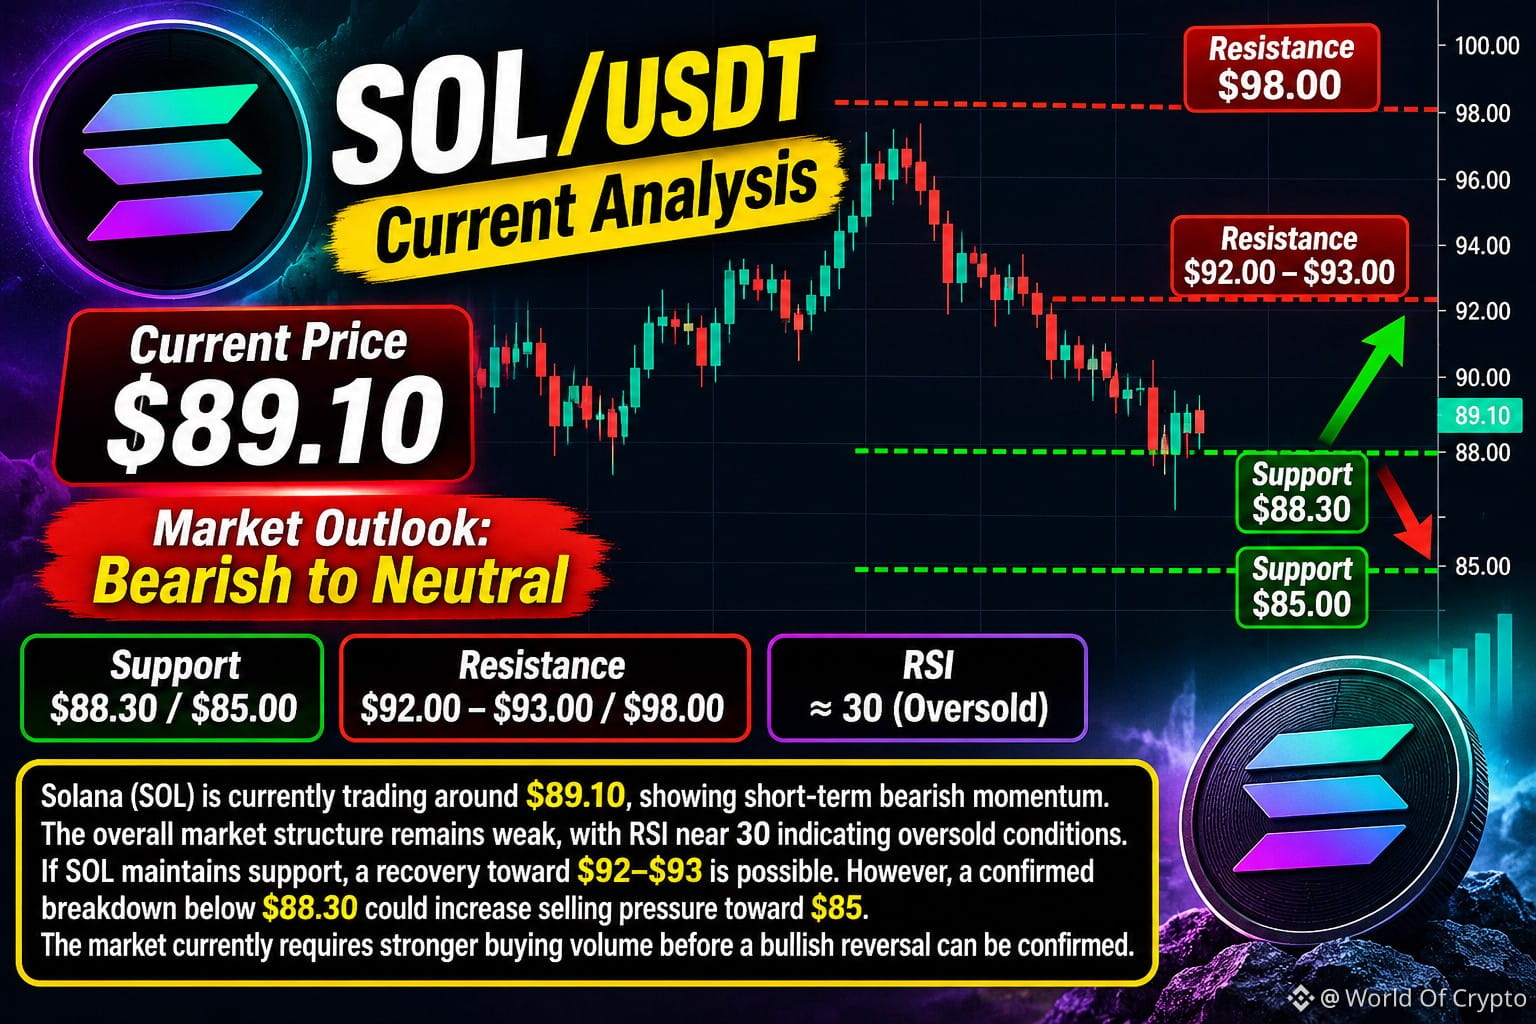
Solana ($SOL ) is currently trading around $89.10, showing short-term bearish momentum. The overall market structure remains weak, with RSI near 30 indicating oversold conditions. Key support is positioned around $88.30, while resistance stands near $92–$93, followed by a stronger resistance zone around $98. If SOL maintains support, a recovery toward $92–$93 is possible. However, a confirmed breakdown below $88.30 could increase selling pressure toward $85. The market currently requires stronger buying volume before a bullish reversal can be confirmed.
{spot}(SOLUSDT)
#JobsReportRaisesHikeOdds
Solana ($SOL ) is currently trading around $89.10, showing short-term bearish momentum. The overall market structure remains weak, with RSI near 30 indicating oversold conditions. Key support is positioned around $88.30, while resistance stands near $92–$93, followed by a stronger resistance zone around $98. If SOL maintains support, a recovery toward $92–$93 is possible. However, a confirmed breakdown below $88.30 could increase selling pressure toward $85. The market currently requires stronger buying volume before a bullish reversal can be confirmed.
#JobsReportRaisesHikeOdds
#JobsReportRaisesHikeOdds
67
$BTC /USDT – Market Analysis | November 8, 2026
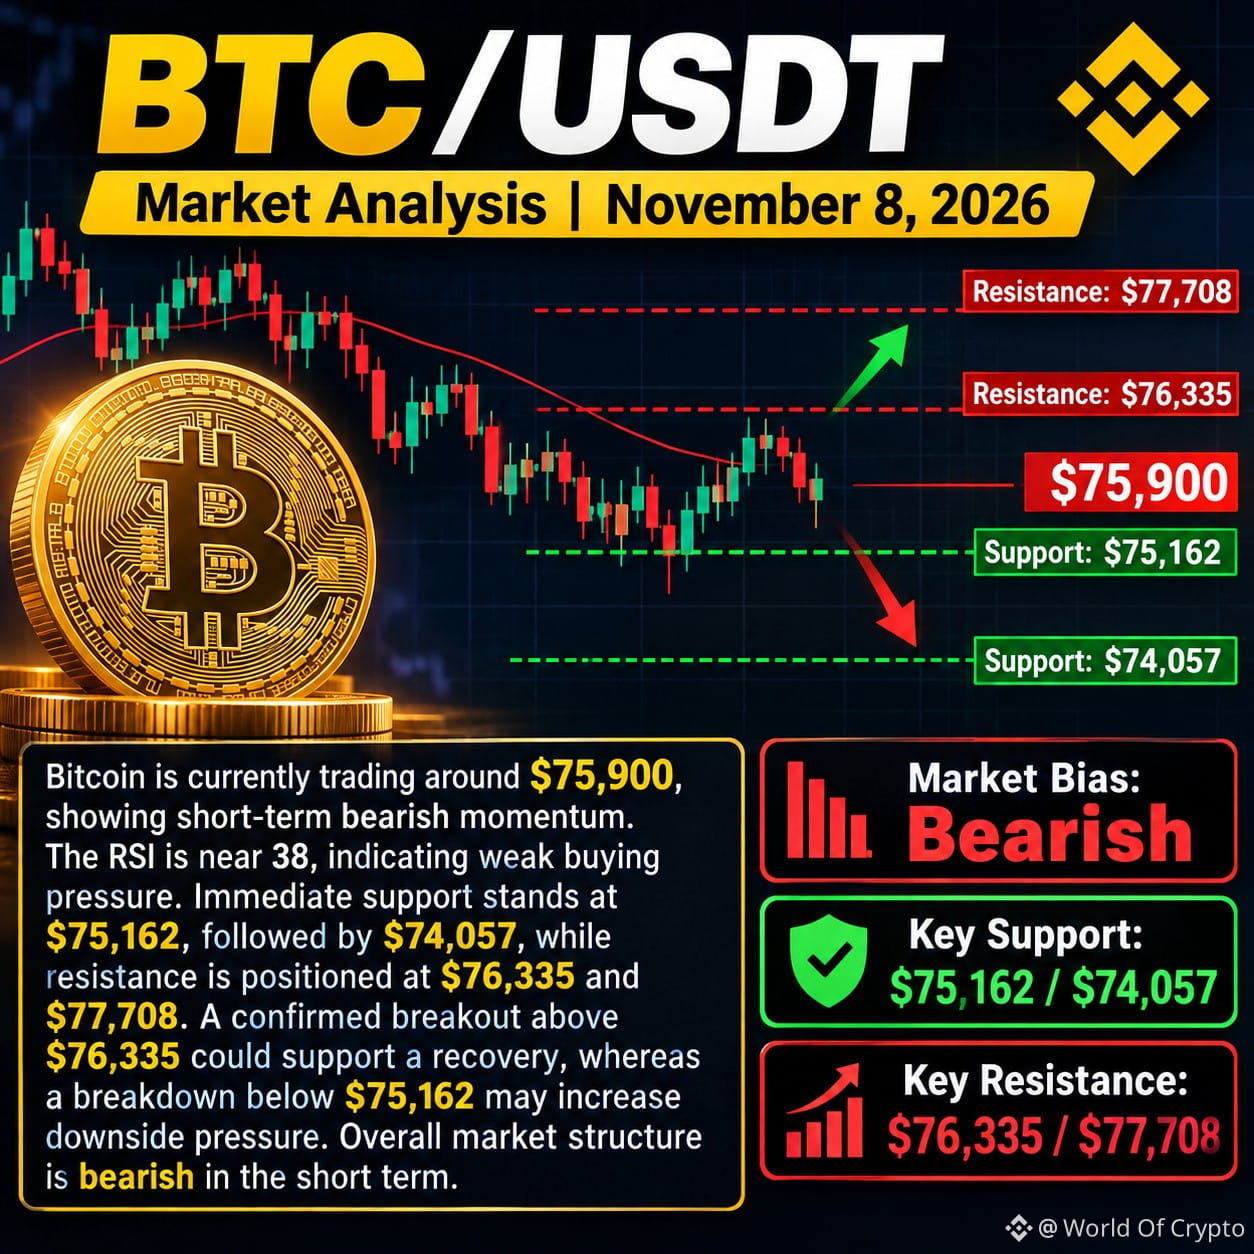
Bitcoin is currently trading around $75,900, showing short-term bearish momentum. The RSI is near 38, indicating weak buying pressure. Immediate support stands at $75,162, followed by $74,057, while resistance is positioned at $76,335 and $77,708. A confirmed breakout above $76,335 could support a recovery, whereas a breakdown below $75,162 may increase downside pressure. Overall market structure remains bearish in the short term.
Market Bias: Bearish
Key Support: $75,162 / $74,057
Key Resistance: $76,335 / $77,708
#BTC
{spot}(BTCUSDT)
$BTC /USDT – Market Analysis | November 8, 2026
Bitcoin is currently trading around $75,900, showing short-term bearish momentum. The RSI is near 38, indicating weak buying pressure. Immediate support stands at $75,162, followed by $74,057, while resistance is positioned at $76,335 and $77,708. A confirmed breakout above $76,335 could support a recovery, whereas a breakdown below $75,162 may increase downside pressure. Overall market structure remains bearish in the short term.
Market Bias: Bearish
Key Support: $75,162 / $74,057
Key Resistance: $76,335 / $77,708
#BTC
Bitcoin is currently trading around $75,900, showing short-term bearish momentum. The RSI is near 38, indicating weak buying pressure. Immediate support stands at $75,162, followed by $74,057, while resistance is positioned at $76,335 and $77,708. A confirmed breakout above $76,335 could support a recovery, whereas a breakdown below $75,162 may increase downside pressure. Overall market structure remains bearish in the short term.
Market Bias: Bearish
Key Support: $75,162 / $74,057
Key Resistance: $76,335 / $77,708
#BTC
57
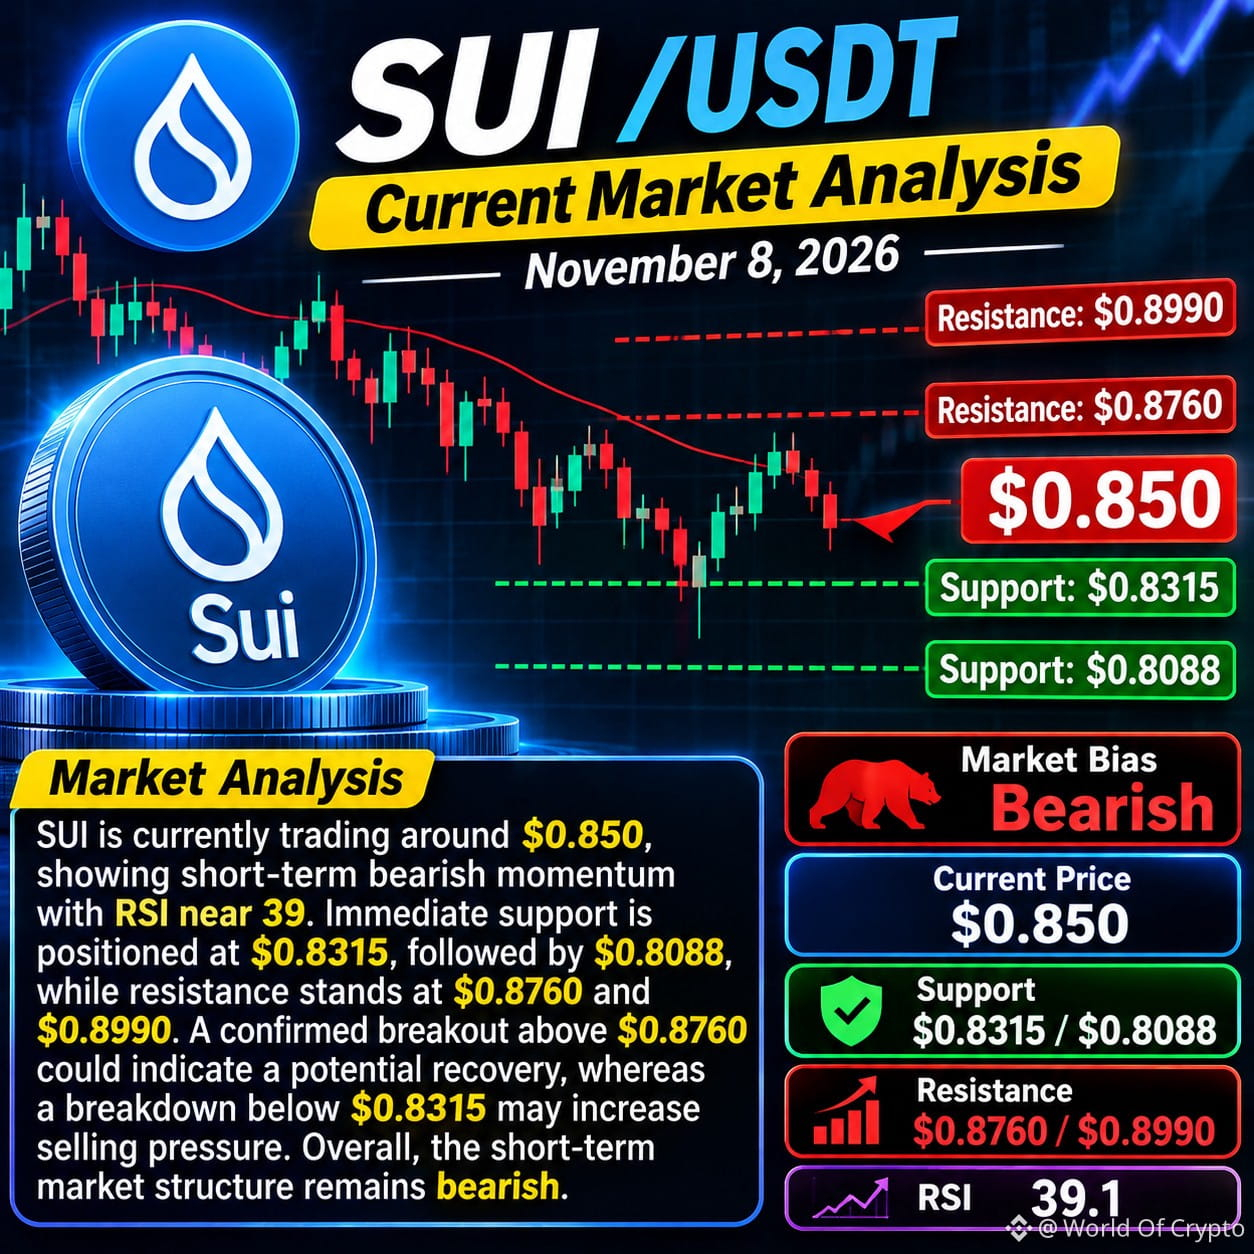
$SUI /USDT – Current Market Analysis | November 8, 2026
SUI is currently trading around $0.850, showing short-term bearish momentum with RSI near 39. Immediate support is positioned at $0.8315, followed by $0.8088, while resistance stands at $0.8760 and $0.8990. A confirmed breakout above $0.8760 could indicate a potential recovery, whereas a breakdown below $0.8315 may increase selling pressure. Overall, the short-term market structure remains bearish, and confirmation is important before identifying a trend reversal.
Market Bias: Bearish
Current Price: $0.850
Support: $0.8315 / $0.8088
Resistance: $0.8760 / $0.8990
RSI: 39.1
#SUIUSDT
$SUI /USDT – Current Market Analysis | November 8, 2026
SUI is currently trading around $0.850, showing short-term bearish momentum with RSI near 39. Immediate support is positioned at $0.8315, followed by $0.8088, while resistance stands at $0.8760 and $0.8990. A confirmed breakout above $0.8760 could indicate a potential recovery, whereas a breakdown below $0.8315 may increase selling pressure. Overall, the short-term market structure remains bearish, and confirmation is important before identifying a trend reversal.
Market Bias: Bearish
Current Price: $0.850
Support: $0.8315 / $0.8088
Resistance: $0.8760 / $0.8990
RSI: 39.1
#SUIUSDT
SUI is currently trading around $0.850, showing short-term bearish momentum with RSI near 39. Immediate support is positioned at $0.8315, followed by $0.8088, while resistance stands at $0.8760 and $0.8990. A confirmed breakout above $0.8760 could indicate a potential recovery, whereas a breakdown below $0.8315 may increase selling pressure. Overall, the short-term market structure remains bearish, and confirmation is important before identifying a trend reversal.
Market Bias: Bearish
Current Price: $0.850
Support: $0.8315 / $0.8088
Resistance: $0.8760 / $0.8990
RSI: 39.1
#SUIUSDT
187
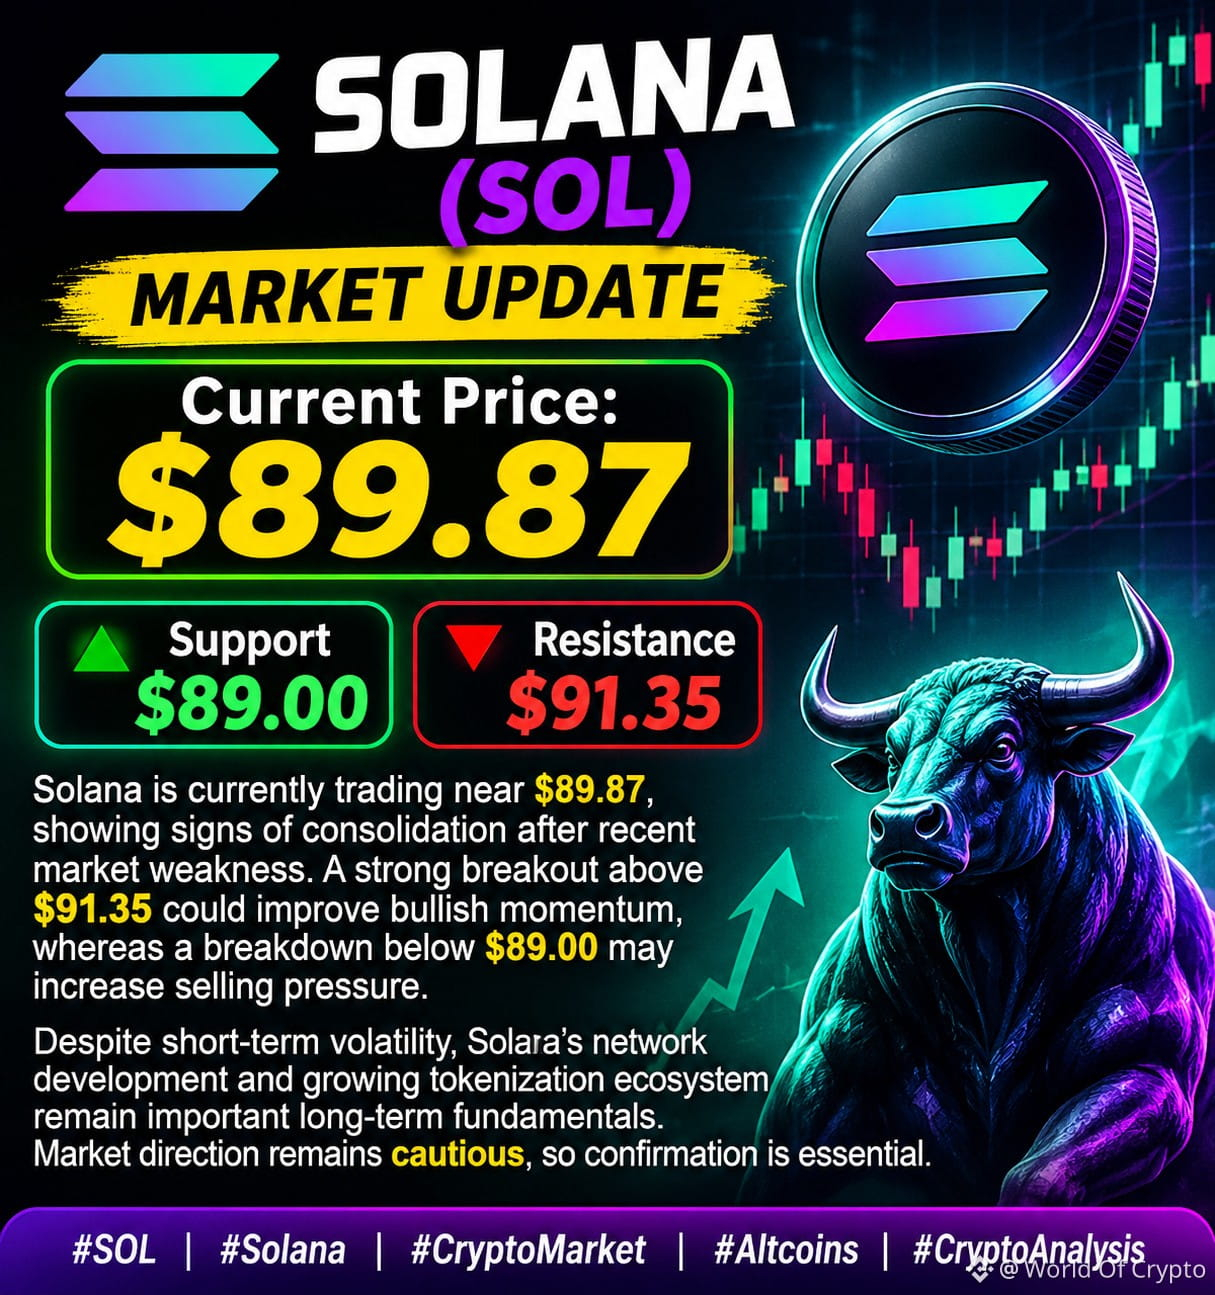
SOLANA ($SOL ) – MARKET UPDATE
Current Price: $89.87
Solana is currently trading near $89.87, showing signs of consolidation after recent market weakness. The immediate support zone is around $89.00, while resistance stands near $91.35. A strong breakout above resistance could improve bullish momentum, whereas a breakdown below support may increase selling pressure. Despite short-term volatility, Solana's network development and growing tokenization ecosystem remain important long-term fundamentals. Market direction remains cautious, so confirmation is essential.
{spot}(SOLUSDT)
#SOL
SOLANA ($SOL ) – MARKET UPDATE
Current Price: $89.87
Solana is currently trading near $89.87, showing signs of consolidation after recent market weakness. The immediate support zone is around $89.00, while resistance stands near $91.35. A strong breakout above resistance could improve bullish momentum, whereas a breakdown below support may increase selling pressure. Despite short-term volatility, Solana's network development and growing tokenization ecosystem remain important long-term fundamentals. Market direction remains cautious, so confirmation is essential.
#SOL
Current Price: $89.87
Solana is currently trading near $89.87, showing signs of consolidation after recent market weakness. The immediate support zone is around $89.00, while resistance stands near $91.35. A strong breakout above resistance could improve bullish momentum, whereas a breakdown below support may increase selling pressure. Despite short-term volatility, Solana's network development and growing tokenization ecosystem remain important long-term fundamentals. Market direction remains cautious, so confirmation is essential.
#SOL
52
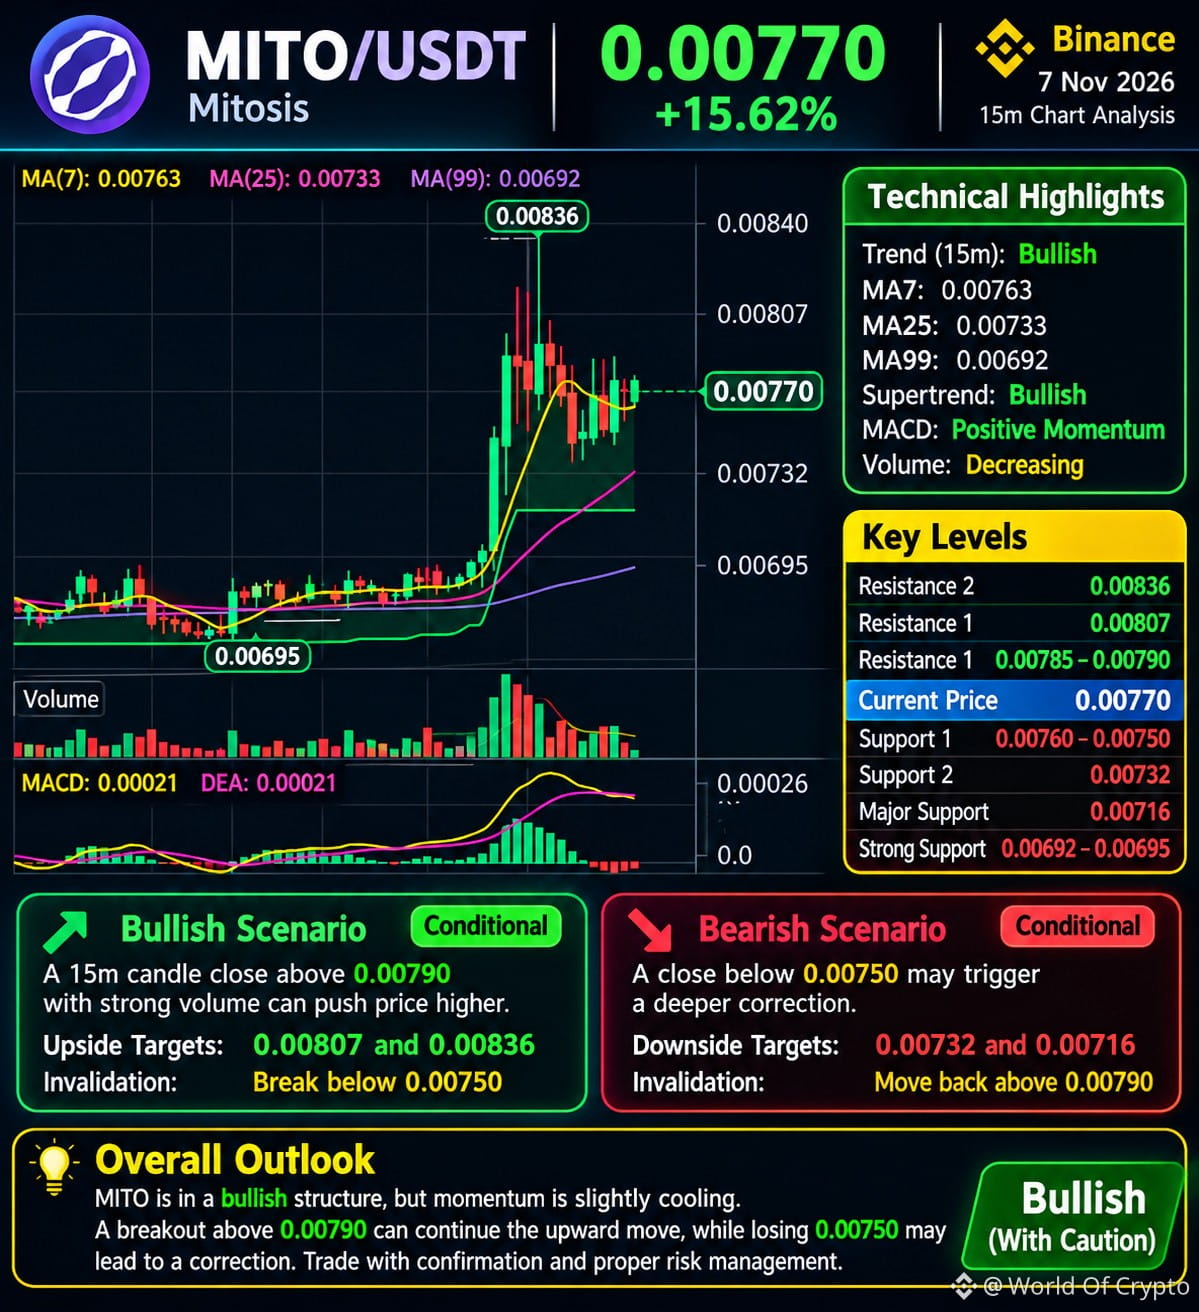
$MITO /USDT is showing strong bullish momentum, currently trading around 0.00770 with a 15.62% gain. Price is consolidating after a strong breakout, while key support remains at 0.00750–0.00732. A confirmed breakout above 0.00790 could open the way toward 0.00807 and 0.00836. However, declining volume suggests caution. Watch for confirmation before entering.
#MITO
$MITO /USDT is showing strong bullish momentum, currently trading around 0.00770 with a 15.62% gain. Price is consolidating after a strong breakout, while key support remains at 0.00750–0.00732. A confirmed breakout above 0.00790 could open the way toward 0.00807 and 0.00836. However, declining volume suggests caution. Watch for confirmation before entering.
#MITO
#MITO
298
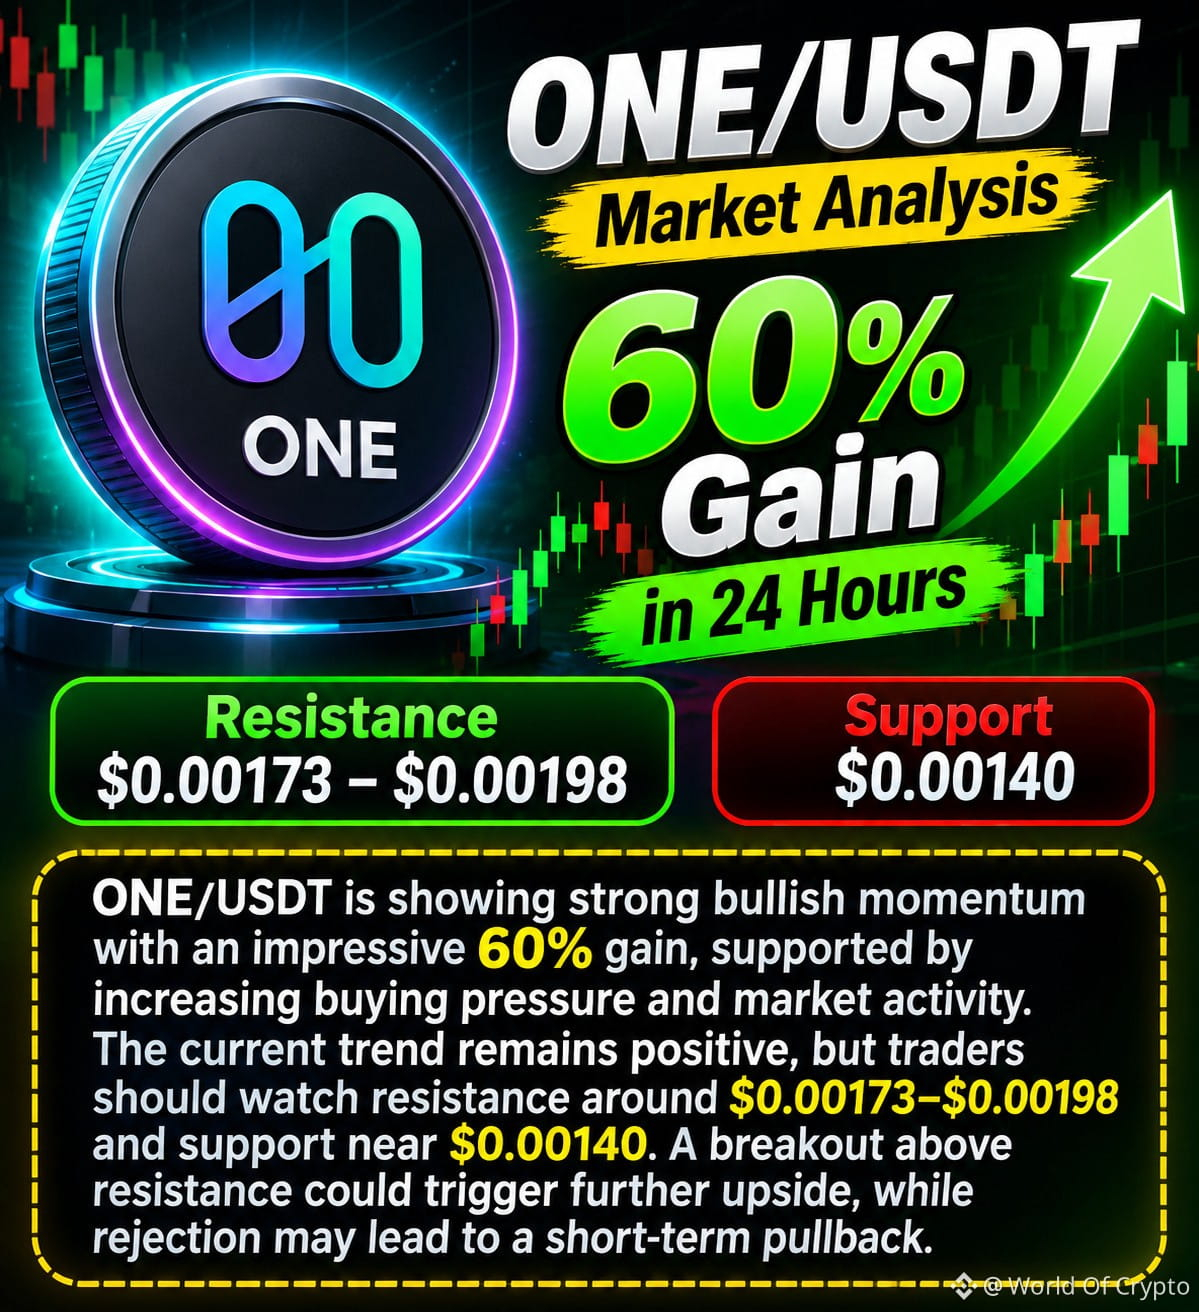
$ONE /USDT is showing strong bullish momentum with an impressive 60% gain, supported by increasing buying pressure and market activity. The current trend remains positive, but traders should watch resistance around $0.00173–$0.00198 and support near $0.00140. A breakout above resistance could trigger further upside, while rejection may lead to a short-term pullback.
{spot}(ONEUSDT)
#JobsReportRaisesHikeOdds
$ONE /USDT is showing strong bullish momentum with an impressive 60% gain, supported by increasing buying pressure and market activity. The current trend remains positive, but traders should watch resistance around $0.00173–$0.00198 and support near $0.00140. A breakout above resistance could trigger further upside, while rejection may lead to a short-term pullback.
#JobsReportRaisesHikeOdds
#JobsReportRaisesHikeOdds
278
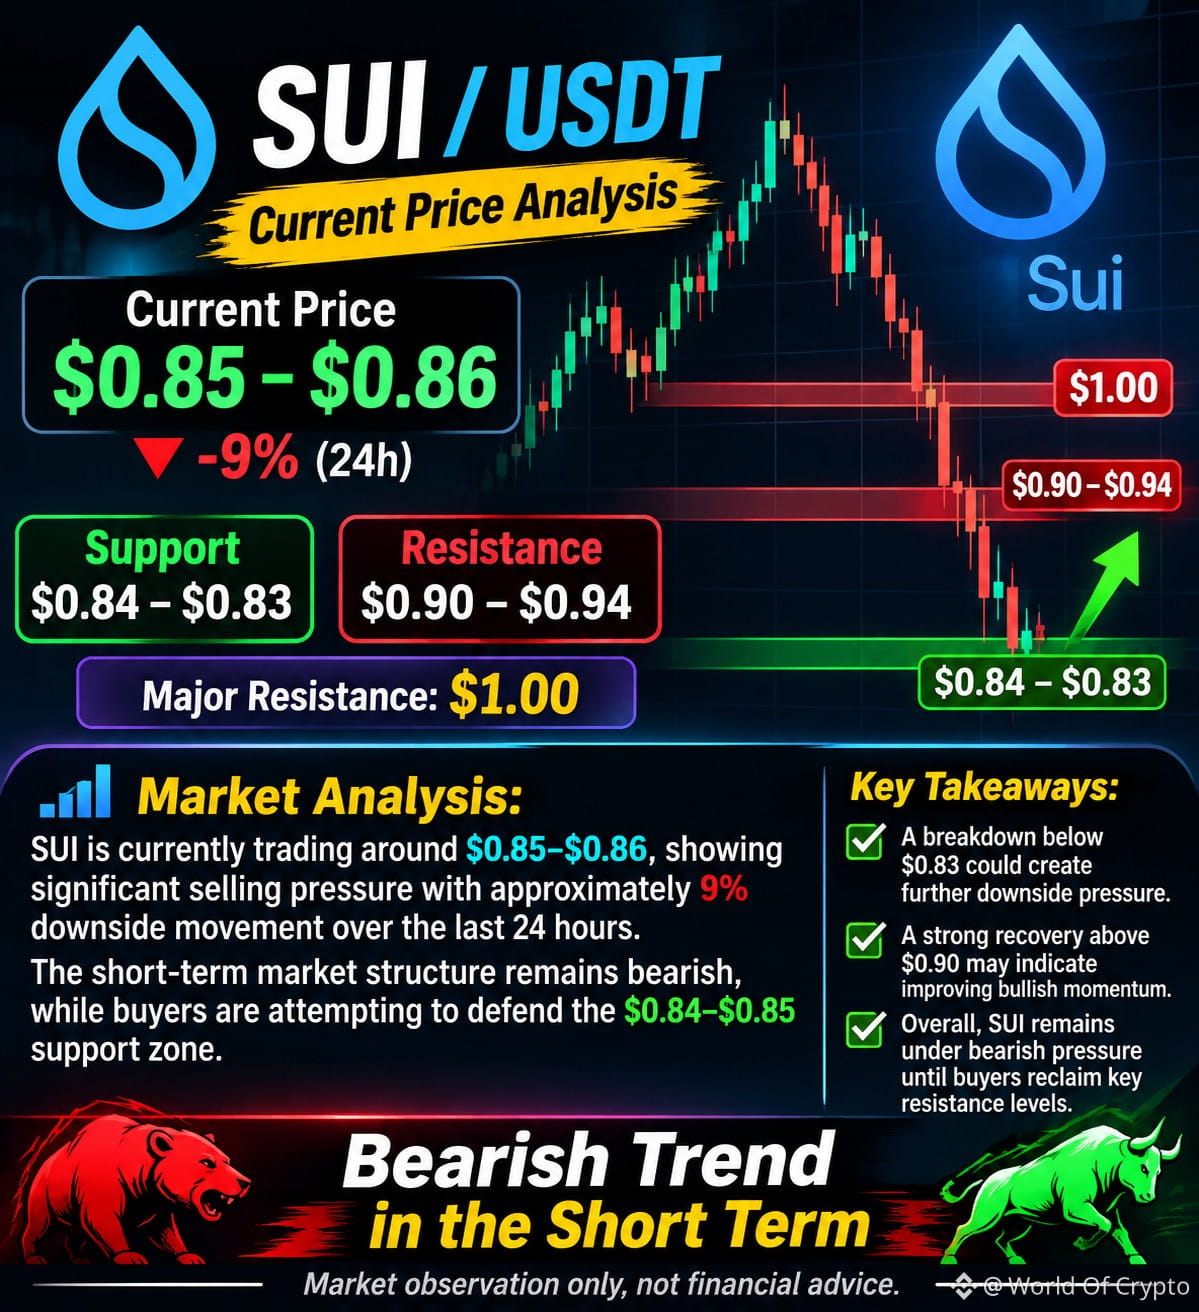
$SUI is currently trading around $0.85–$0.86, showing significant selling pressure with approximately 9% downside movement over the last 24 hours. The short-term market structure remains bearish, while buyers are attempting to defend the $0.84–$0.85 support zone.
Support: $0.84 – $0.83
Resistance: $0.90 – $0.94
Major Resistance: $1.00
{spot}(SUIUSDT)
#sui链
$SUI is currently trading around $0.85–$0.86, showing significant selling pressure with approximately 9% downside movement over the last 24 hours. The short-term market structure remains bearish, while buyers are attempting to defend the $0.84–$0.85 support zone.
Support: $0.84 – $0.83
Resistance: $0.90 – $0.94
Major Resistance: $1.00
#sui链
Support: $0.84 – $0.83
Resistance: $0.90 – $0.94
Major Resistance: $1.00
#sui链
106
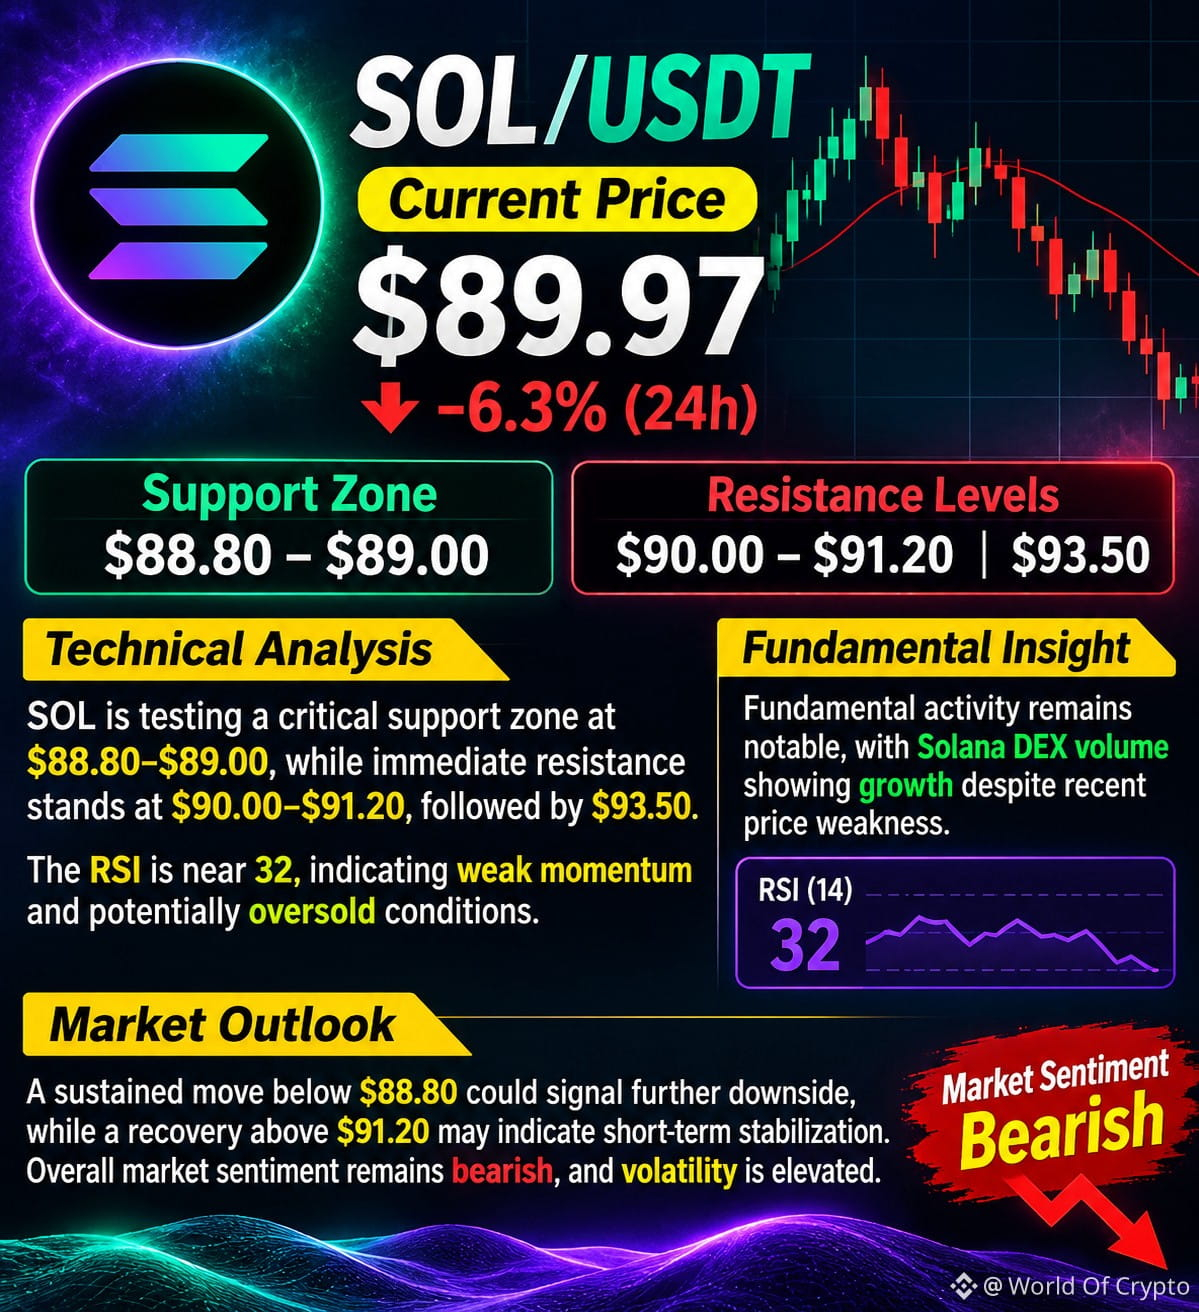
Solana ($SOL ) is currently trading around $89.97, down approximately 6.3% in the last 24 hours, reflecting strong bearish market pressure. Technically, SOL is testing a critical support zone at $88.80–$89.00, while immediate resistance stands at $90.00–$91.20, followed by $93.50. The RSI is near 32, indicating weak momentum and potentially oversold conditions. Fundamental activity remains notable, with Solana DEX volume showing growth despite recent price weakness. A sustained move below $88.80 could signal further downside, while a recovery above $91.20 may indicate short-term stabilization. Overall market sentiment remains bearish, and volatility is elevated.
{spot}(SOLUSDT)
#BinanceReopensWithdrawalsForMoreAssets
Solana ($SOL ) is currently trading around $89.97, down approximately 6.3% in the last 24 hours, reflecting strong bearish market pressure. Technically, SOL is testing a critical support zone at $88.80–$89.00, while immediate resistance stands at $90.00–$91.20, followed by $93.50. The RSI is near 32, indicating weak momentum and potentially oversold conditions. Fundamental activity remains notable, with Solana DEX volume showing growth despite recent price weakness. A sustained move below $88.80 could signal further downside, while a recovery above $91.20 may indicate short-term stabilization. Overall market sentiment remains bearish, and volatility is elevated.
#BinanceReopensWithdrawalsForMoreAssets
#BinanceReopensWithdrawalsForMoreAssets
59
$HYPE USDT – Market Update
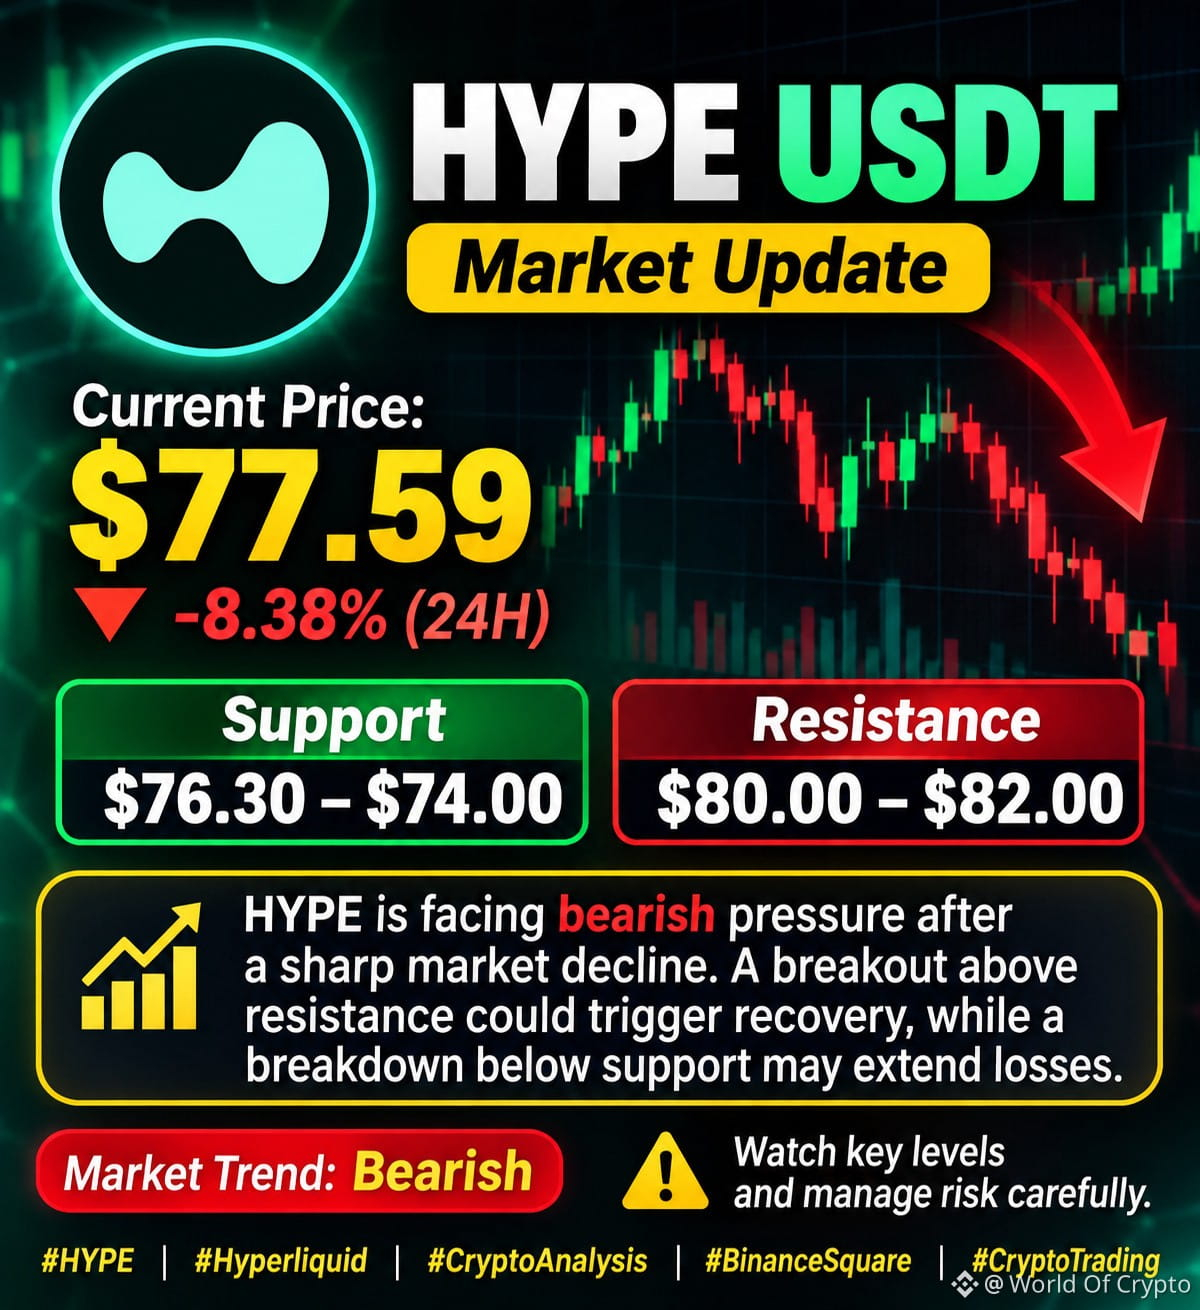
Current Price: $77.59
HYPE is facing bearish pressure after a sharp market decline. Support is at $76.30–$74.00, while resistance stands at $80.00–$82.00. A breakout above resistance could trigger recovery, while a breakdown below support may extend losses.
Market Trend: Bearish
Watch key levels and manage risk carefully.
#HYPE
{spot}(HYPEUSDT)
#USStocksSufferSteepestRoutSince2020
$HYPE USDT – Market Update
Current Price: $77.59
HYPE is facing bearish pressure after a sharp market decline. Support is at $76.30–$74.00, while resistance stands at $80.00–$82.00. A breakout above resistance could trigger recovery, while a breakdown below support may extend losses.
Market Trend: Bearish
Watch key levels and manage risk carefully.
#HYPE
#USStocksSufferSteepestRoutSince2020
Current Price: $77.59
HYPE is facing bearish pressure after a sharp market decline. Support is at $76.30–$74.00, while resistance stands at $80.00–$82.00. A breakout above resistance could trigger recovery, while a breakdown below support may extend losses.
Market Trend: Bearish
Watch key levels and manage risk carefully.
#HYPE
#USStocksSufferSteepestRoutSince2020
193
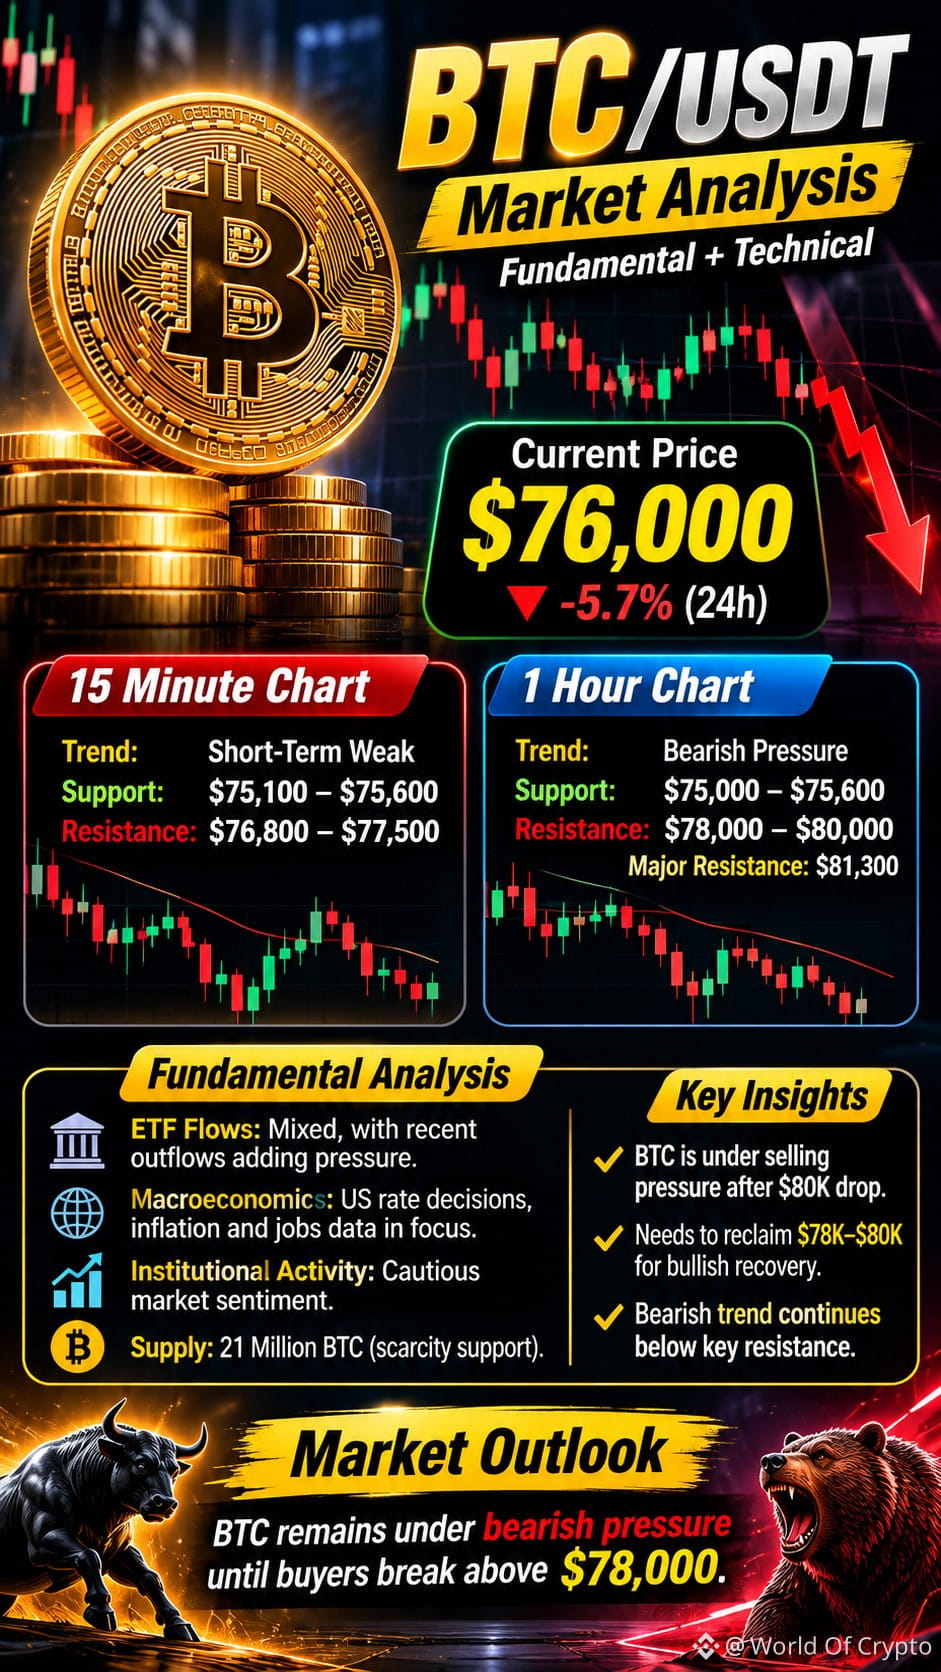
$BTC /USDT | Current Price: $76,000
Bitcoin is facing strong selling pressure after losing the $80,000 region, with short-term momentum remaining bearish. On the 15M timeframe, immediate support stands around $75,100–$75,600, while resistance is near $76,800–$77,500. On the 1H timeframe, BTC needs to reclaim $78,000–$80,000 to improve its market structure, with major resistance around $81,300. Fundamentally, mixed ETF flows, institutional activity and US macroeconomic uncertainty continue to influence market sentiment. Overall, BTC remains under bearish pressure until buyers establish a sustained recovery above key resistance levels.
{spot}(BTCUSDT)
#ADPUSPrivateEmployersAdd86000JobsInOctober
$BTC /USDT | Current Price: $76,000
Bitcoin is facing strong selling pressure after losing the $80,000 region, with short-term momentum remaining bearish. On the 15M timeframe, immediate support stands around $75,100–$75,600, while resistance is near $76,800–$77,500. On the 1H timeframe, BTC needs to reclaim $78,000–$80,000 to improve its market structure, with major resistance around $81,300. Fundamentally, mixed ETF flows, institutional activity and US macroeconomic uncertainty continue to influence market sentiment. Overall, BTC remains under bearish pressure until buyers establish a sustained recovery above key resistance levels.
#ADPUSPrivateEmployersAdd86000JobsInOctober
Bitcoin is facing strong selling pressure after losing the $80,000 region, with short-term momentum remaining bearish. On the 15M timeframe, immediate support stands around $75,100–$75,600, while resistance is near $76,800–$77,500. On the 1H timeframe, BTC needs to reclaim $78,000–$80,000 to improve its market structure, with major resistance around $81,300. Fundamentally, mixed ETF flows, institutional activity and US macroeconomic uncertainty continue to influence market sentiment. Overall, BTC remains under bearish pressure until buyers establish a sustained recovery above key resistance levels.
#ADPUSPrivateEmployersAdd86000JobsInOctober
77
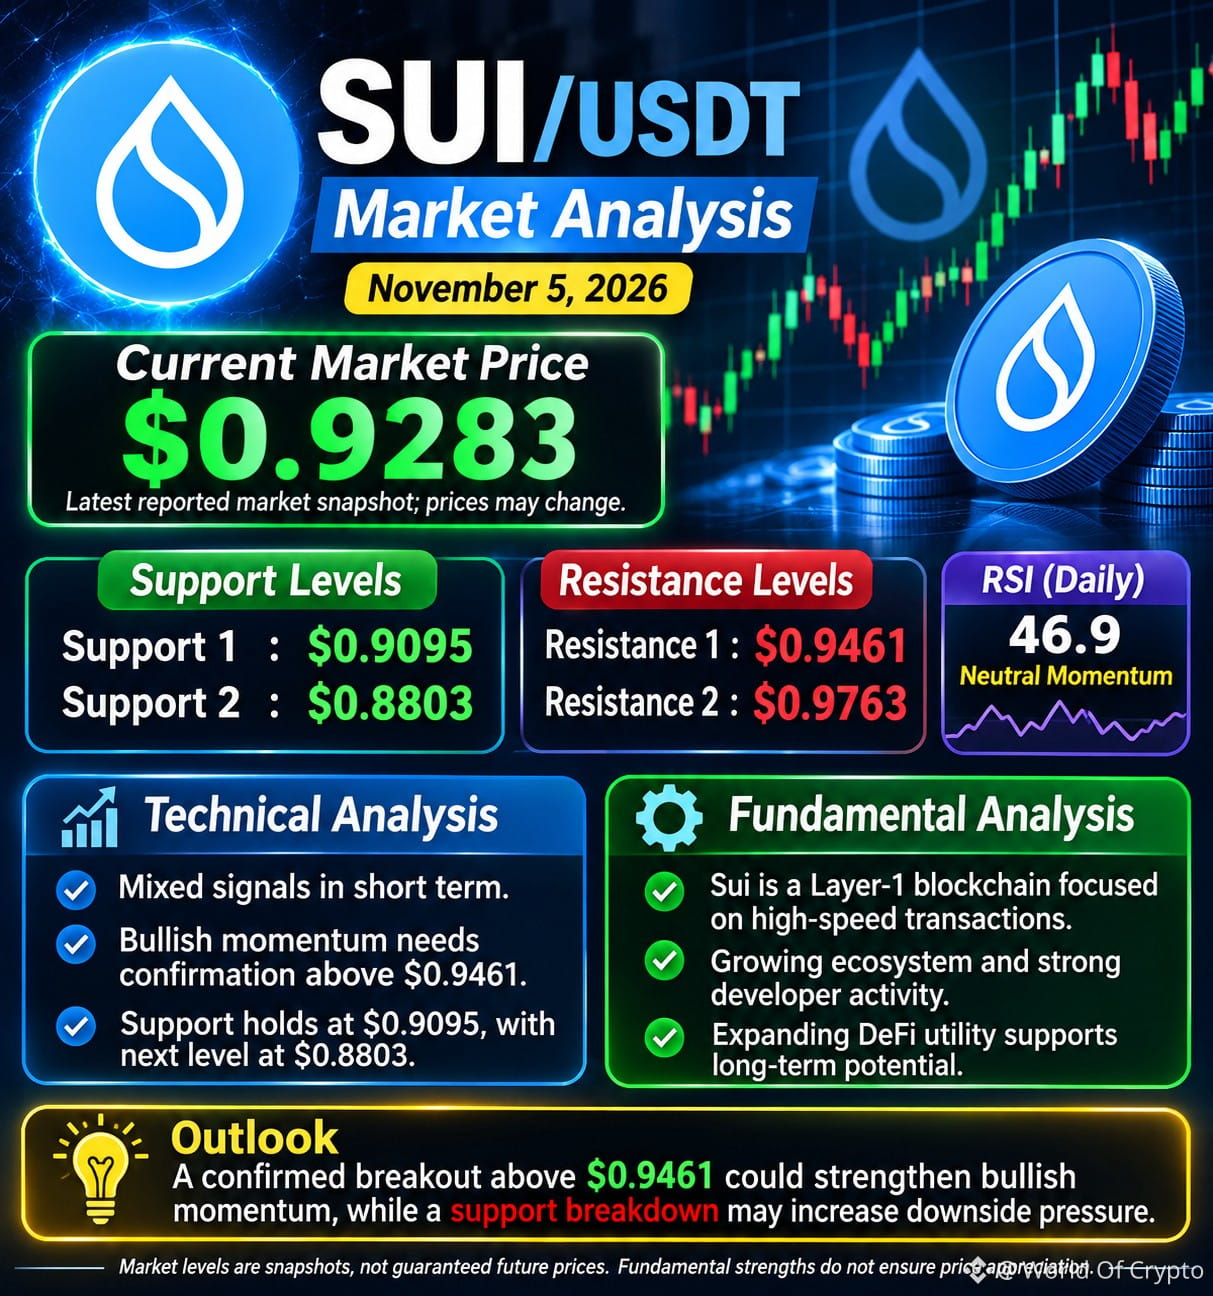
$SUI /USDT is currently trading around $0.9283, showing mixed market momentum with a developing short-term bullish structure. Immediate support stands at $0.9095, followed by $0.8803, while resistance is positioned at $0.9461 and $0.9763. Fundamentally, Sui's scalable Layer-1 technology, growing ecosystem, and expanding DeFi utility support its long-term potential. A confirmed breakout above resistance could strengthen bullish momentum, while a support breakdown may increase downside pressure.
{spot}(SUIUSDT)
#Binance98PercentReplenished
$SUI /USDT is currently trading around $0.9283, showing mixed market momentum with a developing short-term bullish structure. Immediate support stands at $0.9095, followed by $0.8803, while resistance is positioned at $0.9461 and $0.9763. Fundamentally, Sui's scalable Layer-1 technology, growing ecosystem, and expanding DeFi utility support its long-term potential. A confirmed breakout above resistance could strengthen bullish momentum, while a support breakdown may increase downside pressure.
#Binance98PercentReplenished
#Binance98PercentReplenished
84
$TRUMP /USDT | Current Price: $1.24
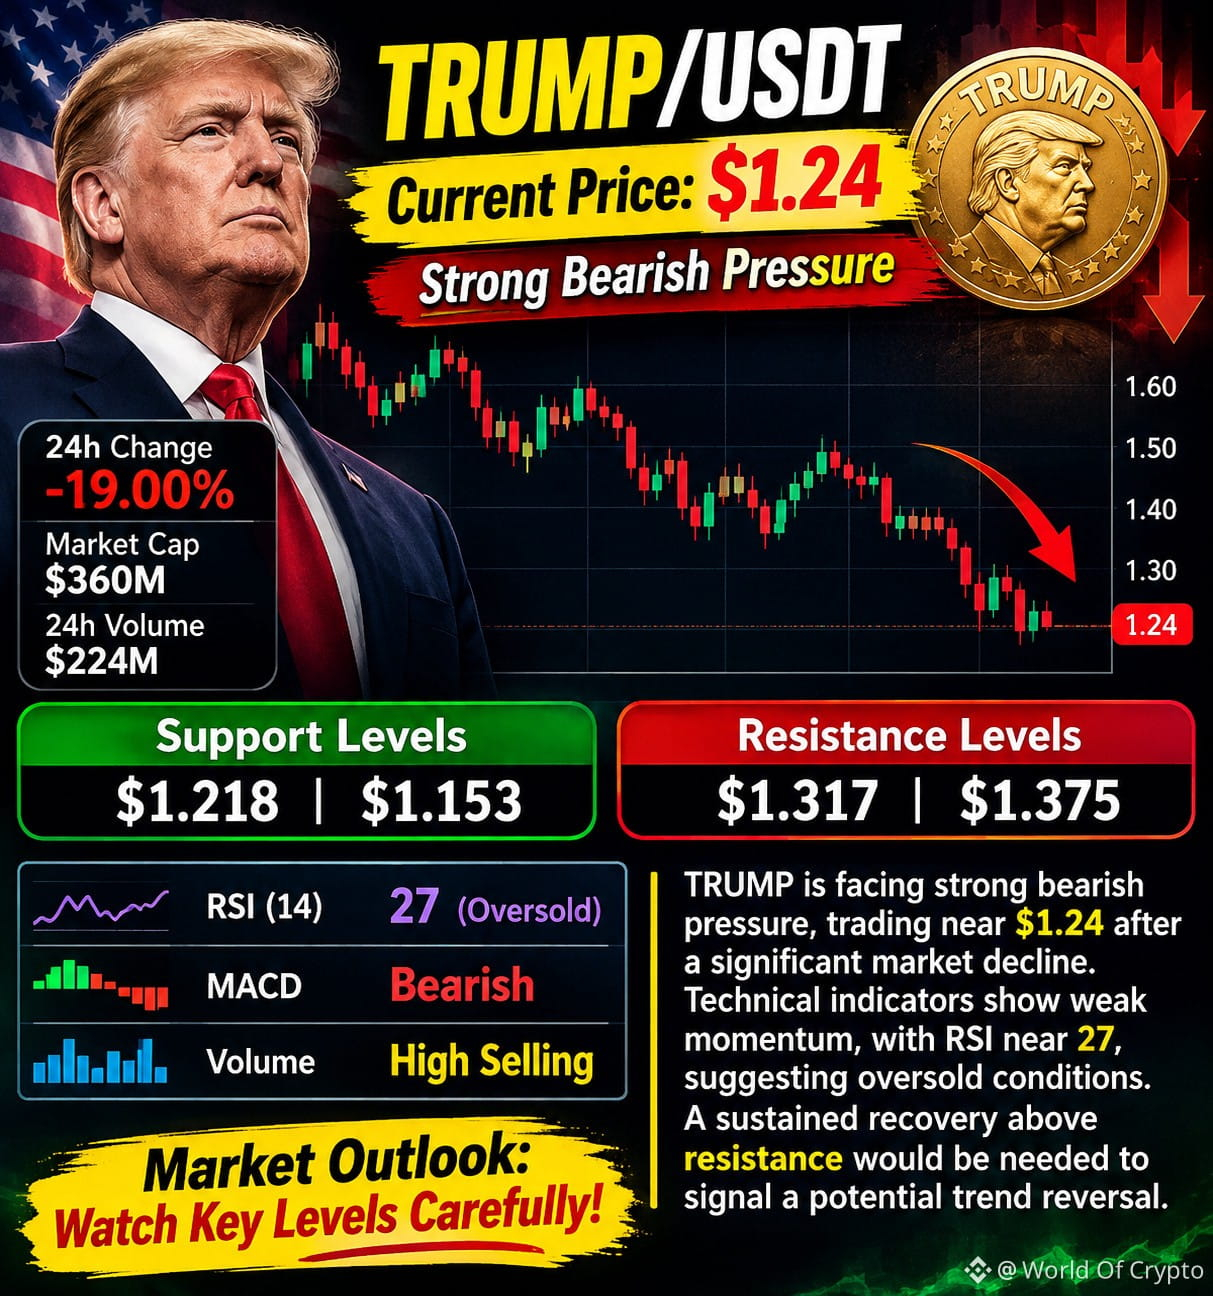
TRUMP is facing strong bearish pressure, trading near $1.24 after a significant market decline. Immediate support is located at $1.218, followed by $1.153, while resistance stands at $1.317 and $1.375. Technical indicators show weak momentum, with RSI near 27, suggesting oversold conditions. A sustained recovery above resistance would be needed to signal a potential trend reversal.
{spot}(TRUMPUSDT)
#BinanceReopensWithdrawalsForMoreAssets
$TRUMP /USDT | Current Price: $1.24
TRUMP is facing strong bearish pressure, trading near $1.24 after a significant market decline. Immediate support is located at $1.218, followed by $1.153, while resistance stands at $1.317 and $1.375. Technical indicators show weak momentum, with RSI near 27, suggesting oversold conditions. A sustained recovery above resistance would be needed to signal a potential trend reversal.
#BinanceReopensWithdrawalsForMoreAssets
TRUMP is facing strong bearish pressure, trading near $1.24 after a significant market decline. Immediate support is located at $1.218, followed by $1.153, while resistance stands at $1.317 and $1.375. Technical indicators show weak momentum, with RSI near 27, suggesting oversold conditions. A sustained recovery above resistance would be needed to signal a potential trend reversal.
#BinanceReopensWithdrawalsForMoreAssets
249
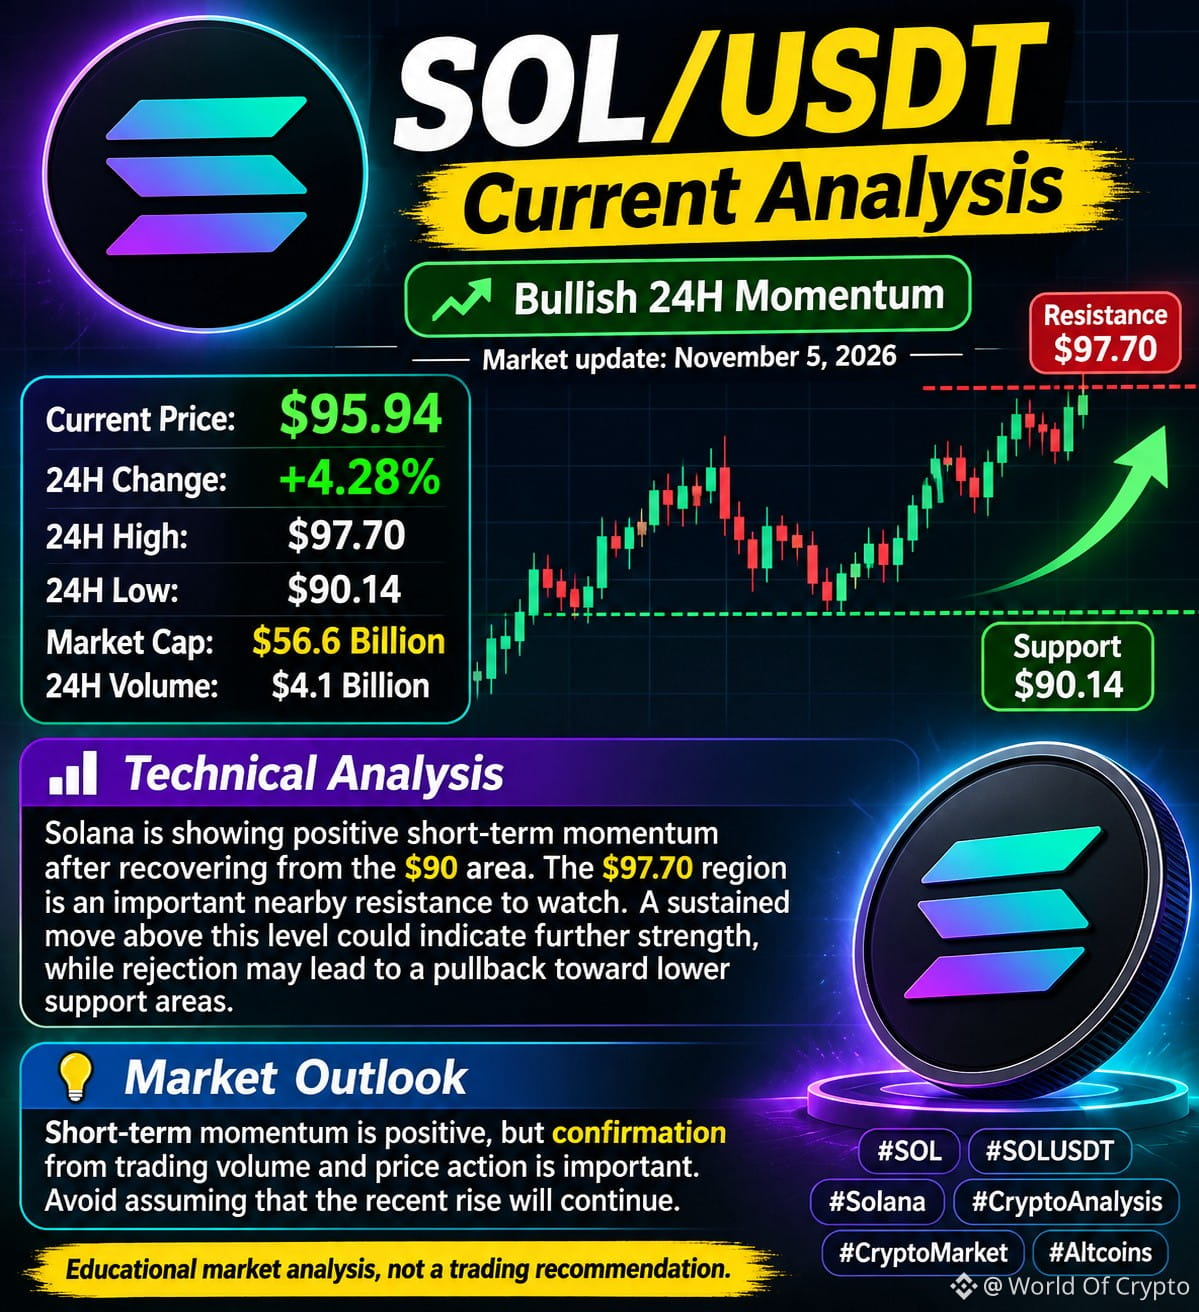
$SOL Solana is showing positive short-term momentum after recovering from the $90 area. The $97.70 region is an important nearby resistance to watch. A sustained move above this level could indicate further strength, while rejection may lead to a pullback toward lower support areas.
Market Outlook: Short-term momentum is positive, but confirmation from trading volume and price action is important. Avoid assuming that the recent rise will continue.
{spot}(SOLUSDT)
#USOctoberNFP-AreRateCutsStillPossible
$SOL Solana is showing positive short-term momentum after recovering from the $90 area. The $97.70 region is an important nearby resistance to watch. A sustained move above this level could indicate further strength, while rejection may lead to a pullback toward lower support areas.
Market Outlook: Short-term momentum is positive, but confirmation from trading volume and price action is important. Avoid assuming that the recent rise will continue.
#USOctoberNFP-AreRateCutsStillPossible
Market Outlook: Short-term momentum is positive, but confirmation from trading volume and price action is important. Avoid assuming that the recent rise will continue.
#USOctoberNFP-AreRateCutsStillPossible
88
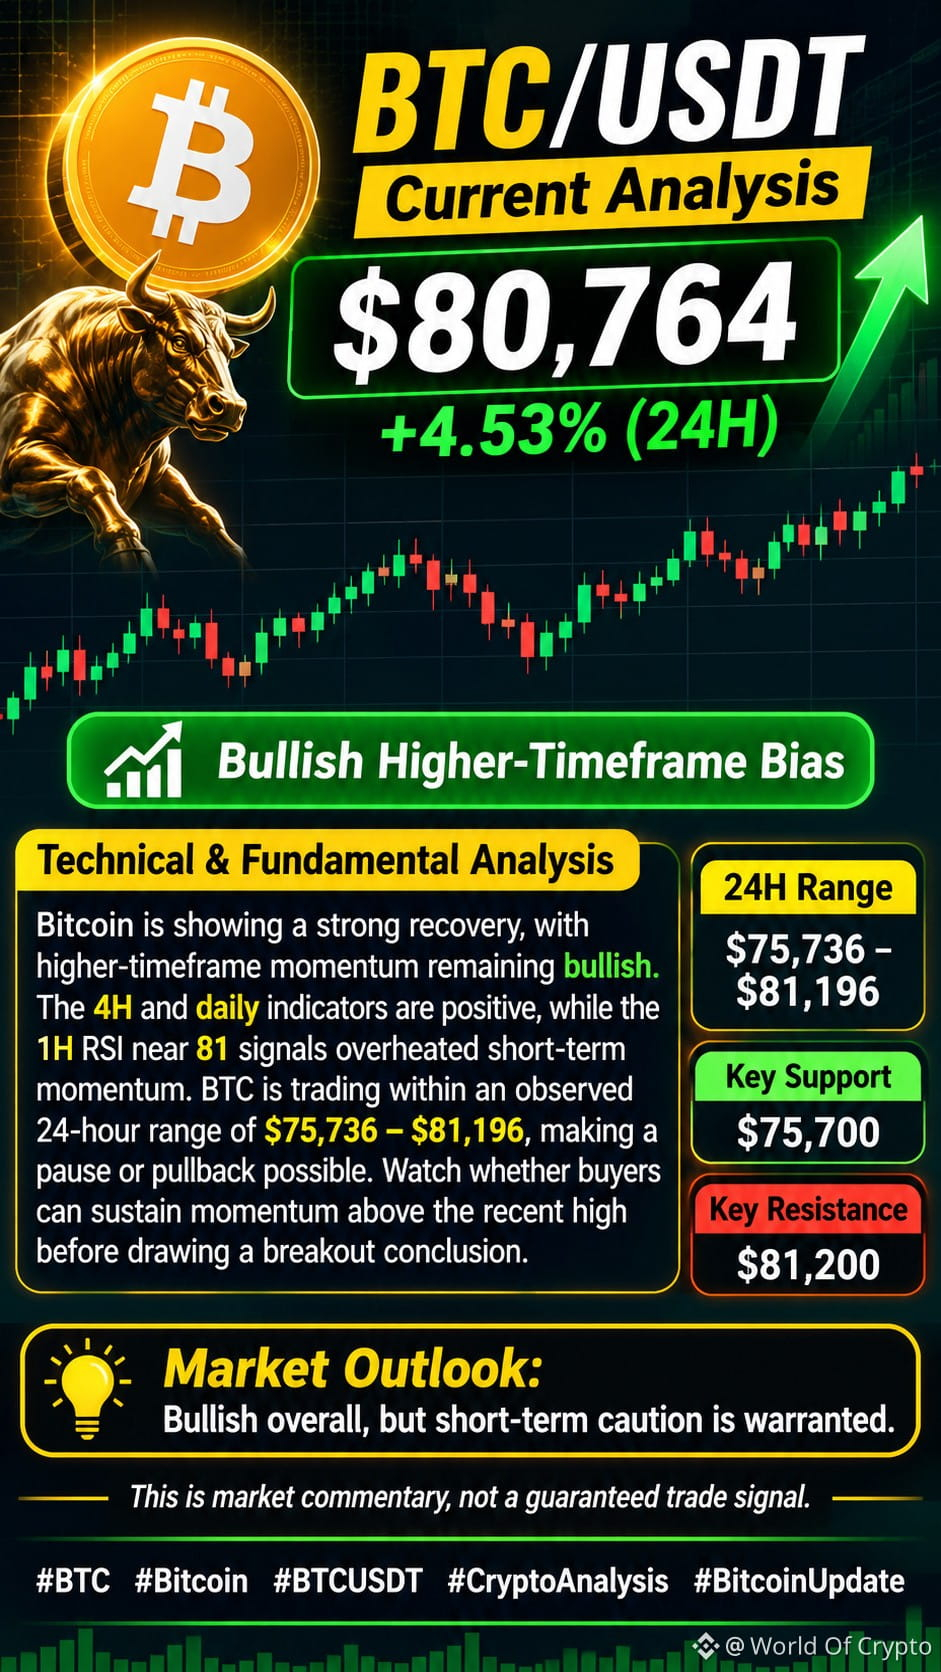
$BTC Bitcoin is showing a strong recovery, with higher-timeframe momentum remaining bullish. The 4H and daily indicators are positive, while the 1H RSI near 81 signals overheated short-term momentum. BTC is trading within an observed 24-hour range of $75,736–$81,196, making a pause or pullback possible. Watch whether buyers can sustain momentum above the recent high before drawing a breakout conclusion.
{spot}(BTCUSDT)
#USMidterms-WhatAreMarketsExpecting?
$BTC Bitcoin is showing a strong recovery, with higher-timeframe momentum remaining bullish. The 4H and daily indicators are positive, while the 1H RSI near 81 signals overheated short-term momentum. BTC is trading within an observed 24-hour range of $75,736–$81,196, making a pause or pullback possible. Watch whether buyers can sustain momentum above the recent high before drawing a breakout conclusion.
#USMidterms-WhatAreMarketsExpecting?
#USMidterms-WhatAreMarketsExpecting?
83
$IDOL is showing strong bullish momentum, trading around $0.0208–$0.0215, with approximately 17–20% gains over the last 24 hours. Trading activity remains elevated, while the 4H RSI is around 56, indicating positive momentum without an extremely overbought reading. Immediate resistance is near $0.0223, while support is around $0.0200–$0.0207. A sustained move above resistance could strengthen bullish momentum, whereas rejection may lead to a short-term correction. Overall, the market structure remains bullish, but volatility is high.
{future}(IDOLUSDT)
#BinanceReopensWithdrawalsForMoreAssets
$IDOL is showing strong bullish momentum, trading around $0.0208–$0.0215, with approximately 17–20% gains over the last 24 hours. Trading activity remains elevated, while the 4H RSI is around 56, indicating positive momentum without an extremely overbought reading. Immediate resistance is near $0.0223, while support is around $0.0200–$0.0207. A sustained move above resistance could strengthen bullish momentum, whereas rejection may lead to a short-term correction. Overall, the market structure remains bullish, but volatility is high.
#BinanceReopensWithdrawalsForMoreAssets
#BinanceReopensWithdrawalsForMoreAssets
423
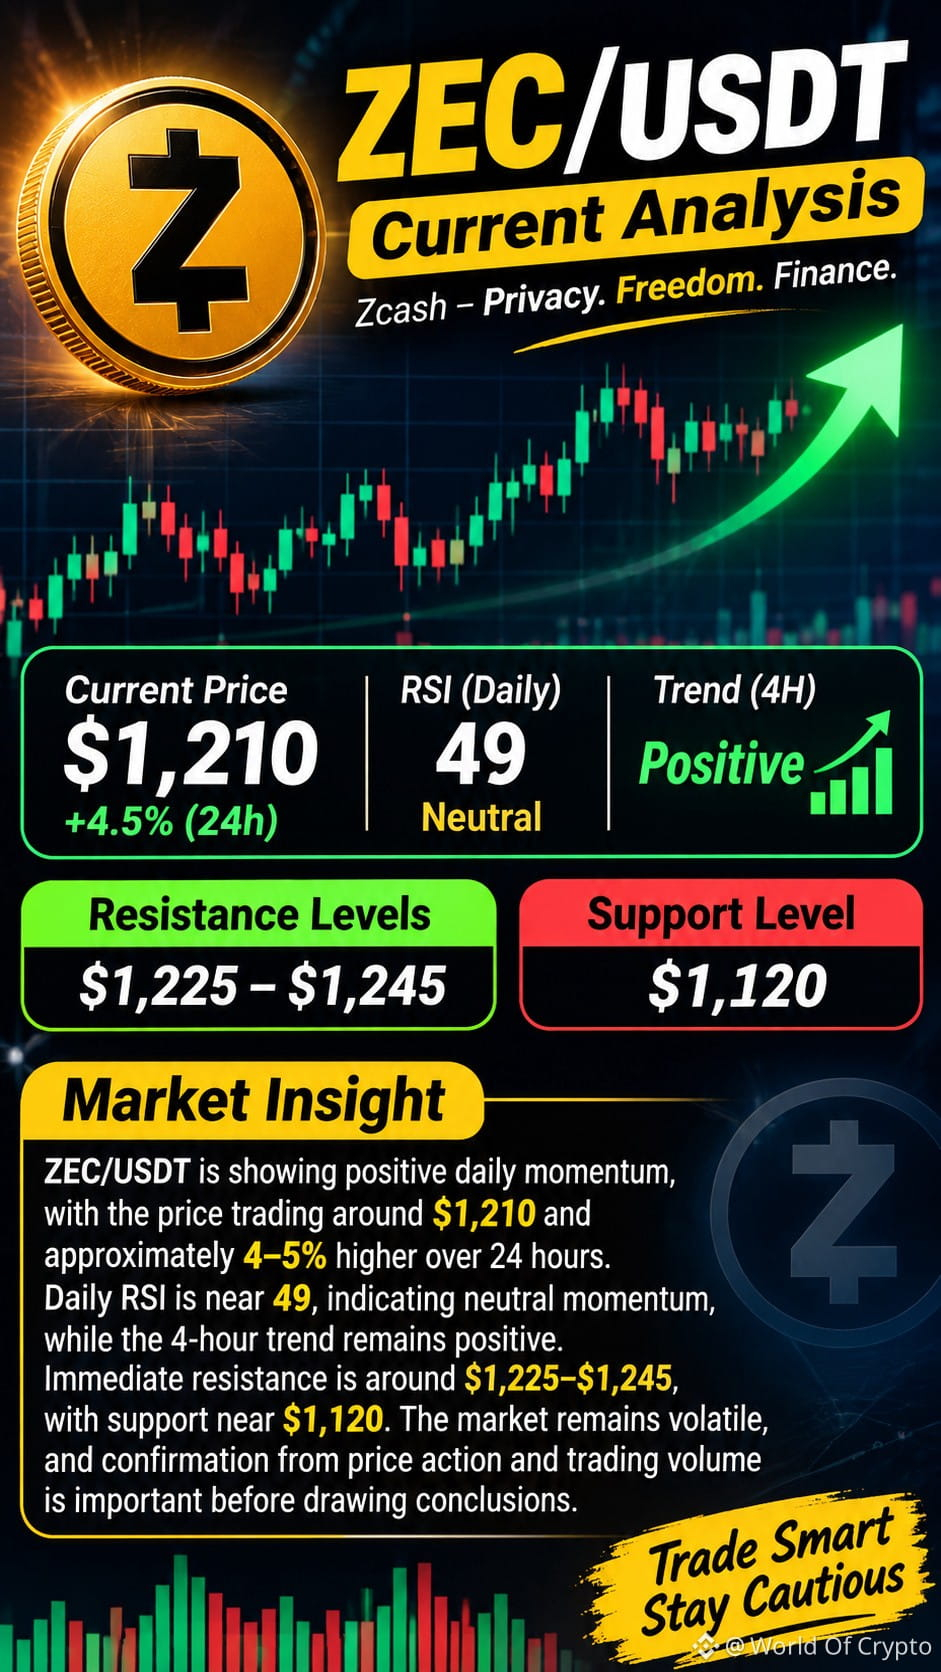
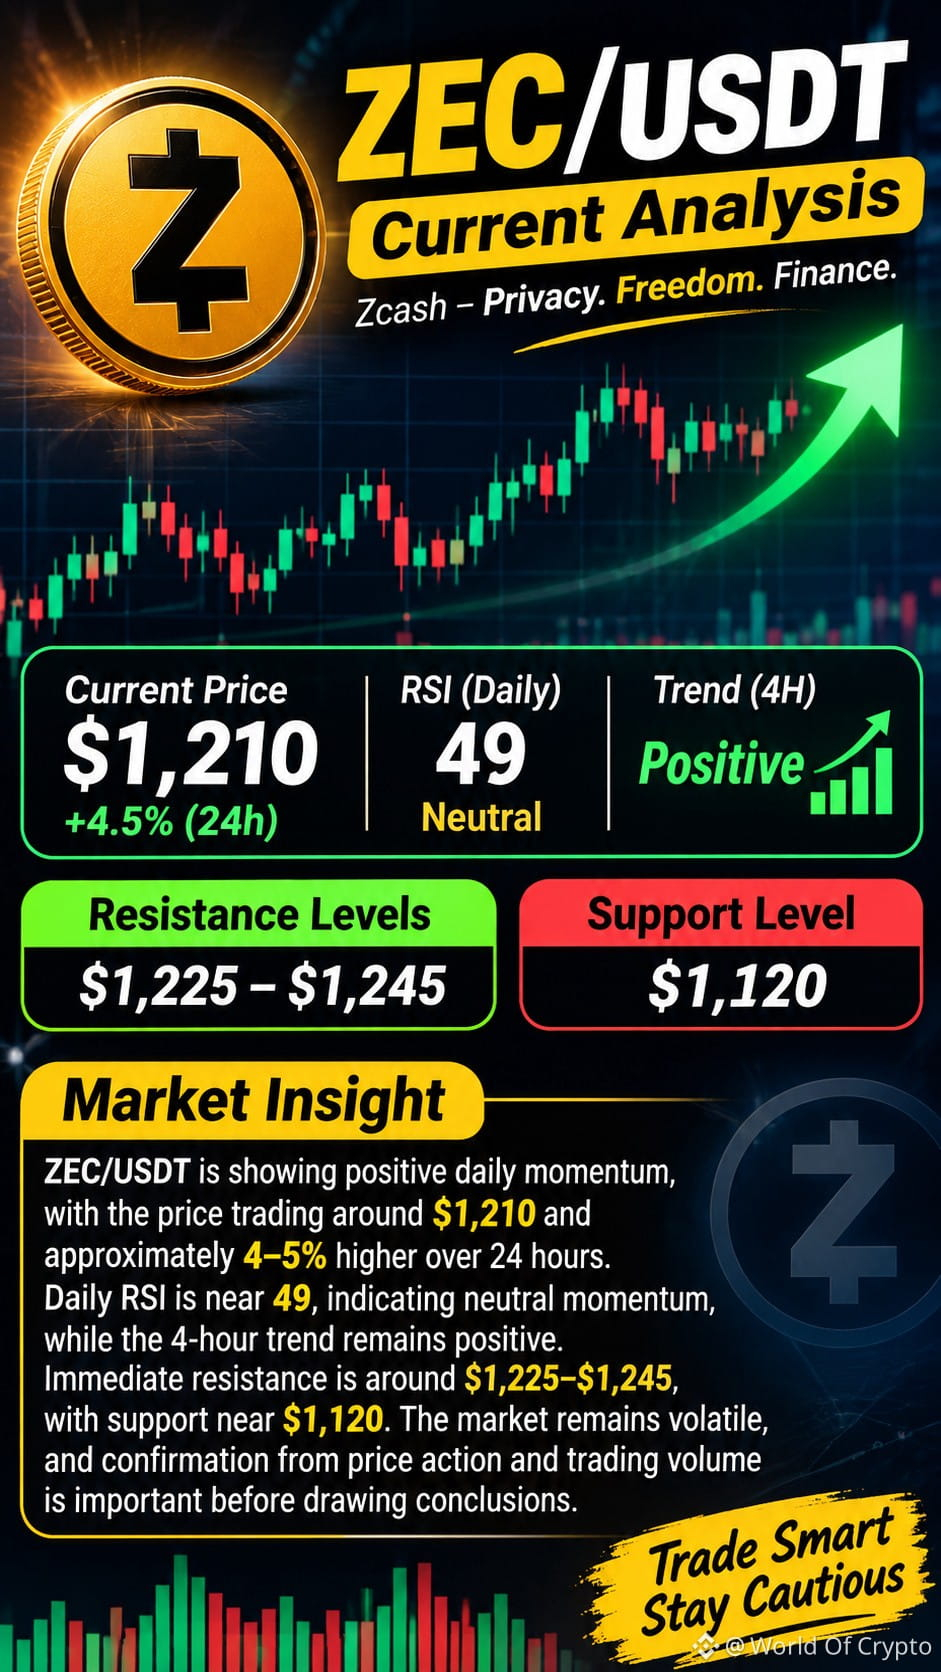
$ZEC /USDT is showing positive daily momentum, with the price trading around $1,210 and approximately 4–5% higher over 24 hours. Daily RSI is near 49, indicating neutral momentum, while the 4-hour trend remains positive. Immediate resistance is around $1,225–$1,245, with support near $1,120. The market remains volatile, and confirmation from price action and trading volume is important before drawing conclusions.
{spot}(ZECUSDT)
#USOctoberNFP-AreRateCutsStillPossible
$ZEC /USDT is showing positive daily momentum, with the price trading around $1,210 and approximately 4–5% higher over 24 hours. Daily RSI is near 49, indicating neutral momentum, while the 4-hour trend remains positive. Immediate resistance is around $1,225–$1,245, with support near $1,120. The market remains volatile, and confirmation from price action and trading volume is important before drawing conclusions.
#USOctoberNFP-AreRateCutsStillPossible
#USOctoberNFP-AreRateCutsStillPossible
194
SOLANA ($SOL ) — Is a Recovery Coming, or Is More Pressure Ahead?
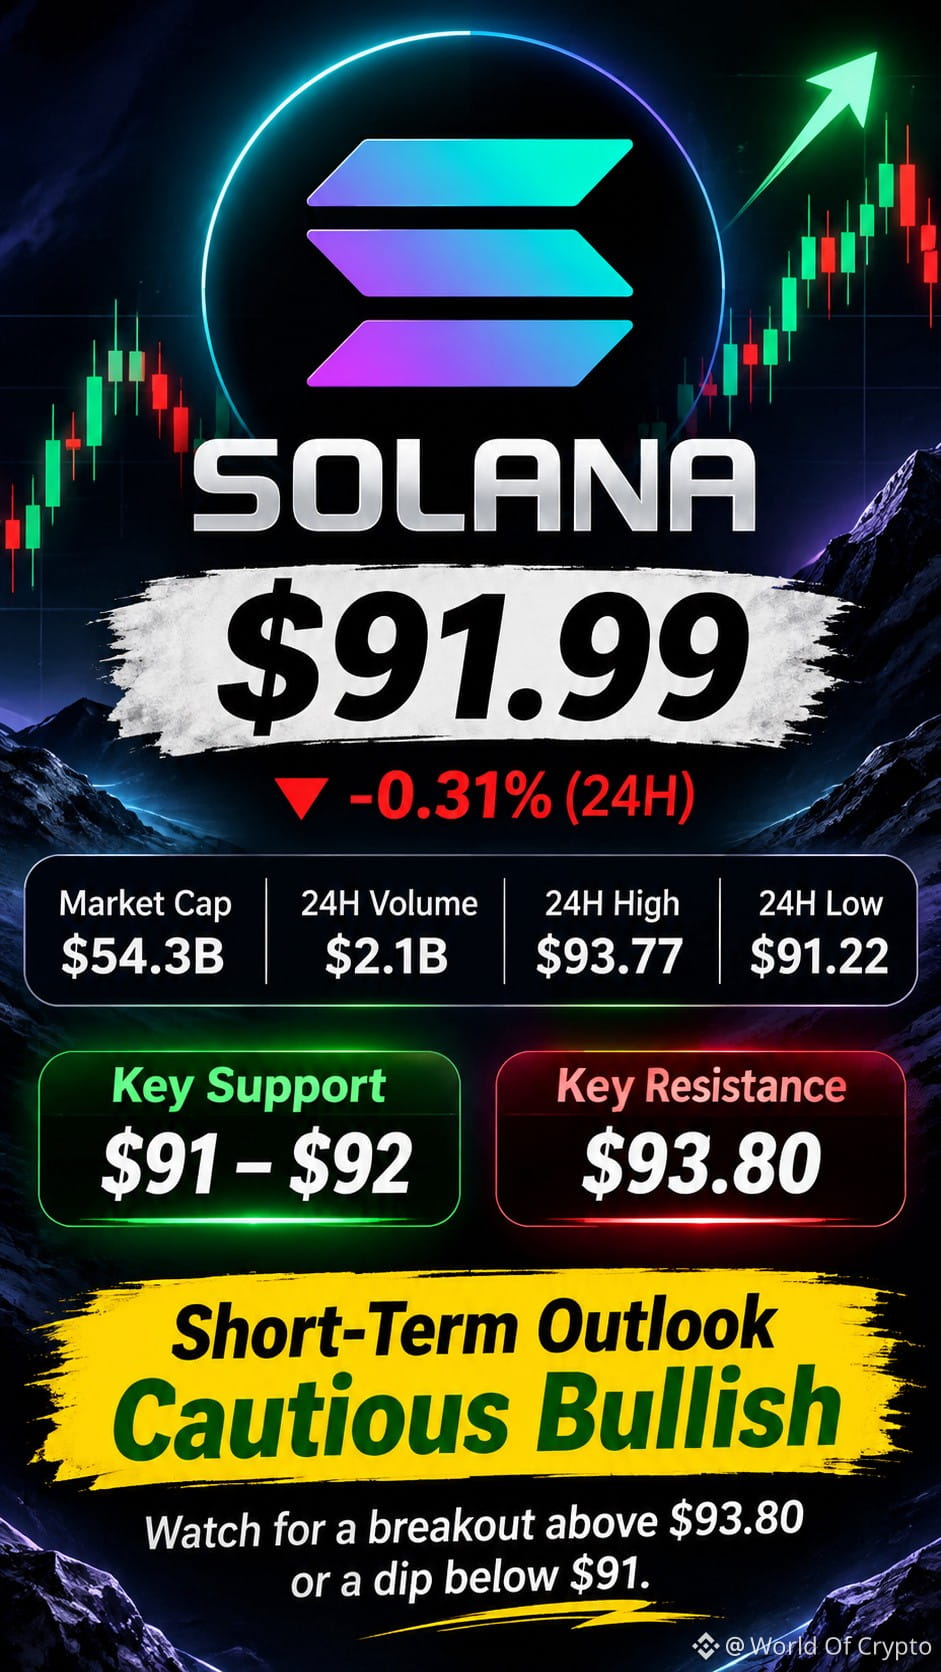
Solana is currently trading around $91.99, showing a slight 24-hour decline of 0.31%. After a difficult weekly performance, SOL is approaching an important price area where market participants are watching for signs of stabilization. The $91–$92 zone is an important near-term area to monitor, while $93.80 is the immediate resistance to watch. A strong move above this resistance with increasing volume could improve short-term momentum, whereas a breakdown below the recent low could indicate continued weakness. For now, the market needs confirmation before a bullish reversal can be established.
What do you think? Can SOL reclaim $100, or will sellers remain in control?
{spot}(SOLUSDT)
#Solana
SOLANA ($SOL ) — Is a Recovery Coming, or Is More Pressure Ahead?
Solana is currently trading around $91.99, showing a slight 24-hour decline of 0.31%. After a difficult weekly performance, SOL is approaching an important price area where market participants are watching for signs of stabilization. The $91–$92 zone is an important near-term area to monitor, while $93.80 is the immediate resistance to watch. A strong move above this resistance with increasing volume could improve short-term momentum, whereas a breakdown below the recent low could indicate continued weakness. For now, the market needs confirmation before a bullish reversal can be established.
What do you think? Can SOL reclaim $100, or will sellers remain in control?
#Solana
Solana is currently trading around $91.99, showing a slight 24-hour decline of 0.31%. After a difficult weekly performance, SOL is approaching an important price area where market participants are watching for signs of stabilization. The $91–$92 zone is an important near-term area to monitor, while $93.80 is the immediate resistance to watch. A strong move above this resistance with increasing volume could improve short-term momentum, whereas a breakdown below the recent low could indicate continued weakness. For now, the market needs confirmation before a bullish reversal can be established.
What do you think? Can SOL reclaim $100, or will sellers remain in control?
#Solana
1
158
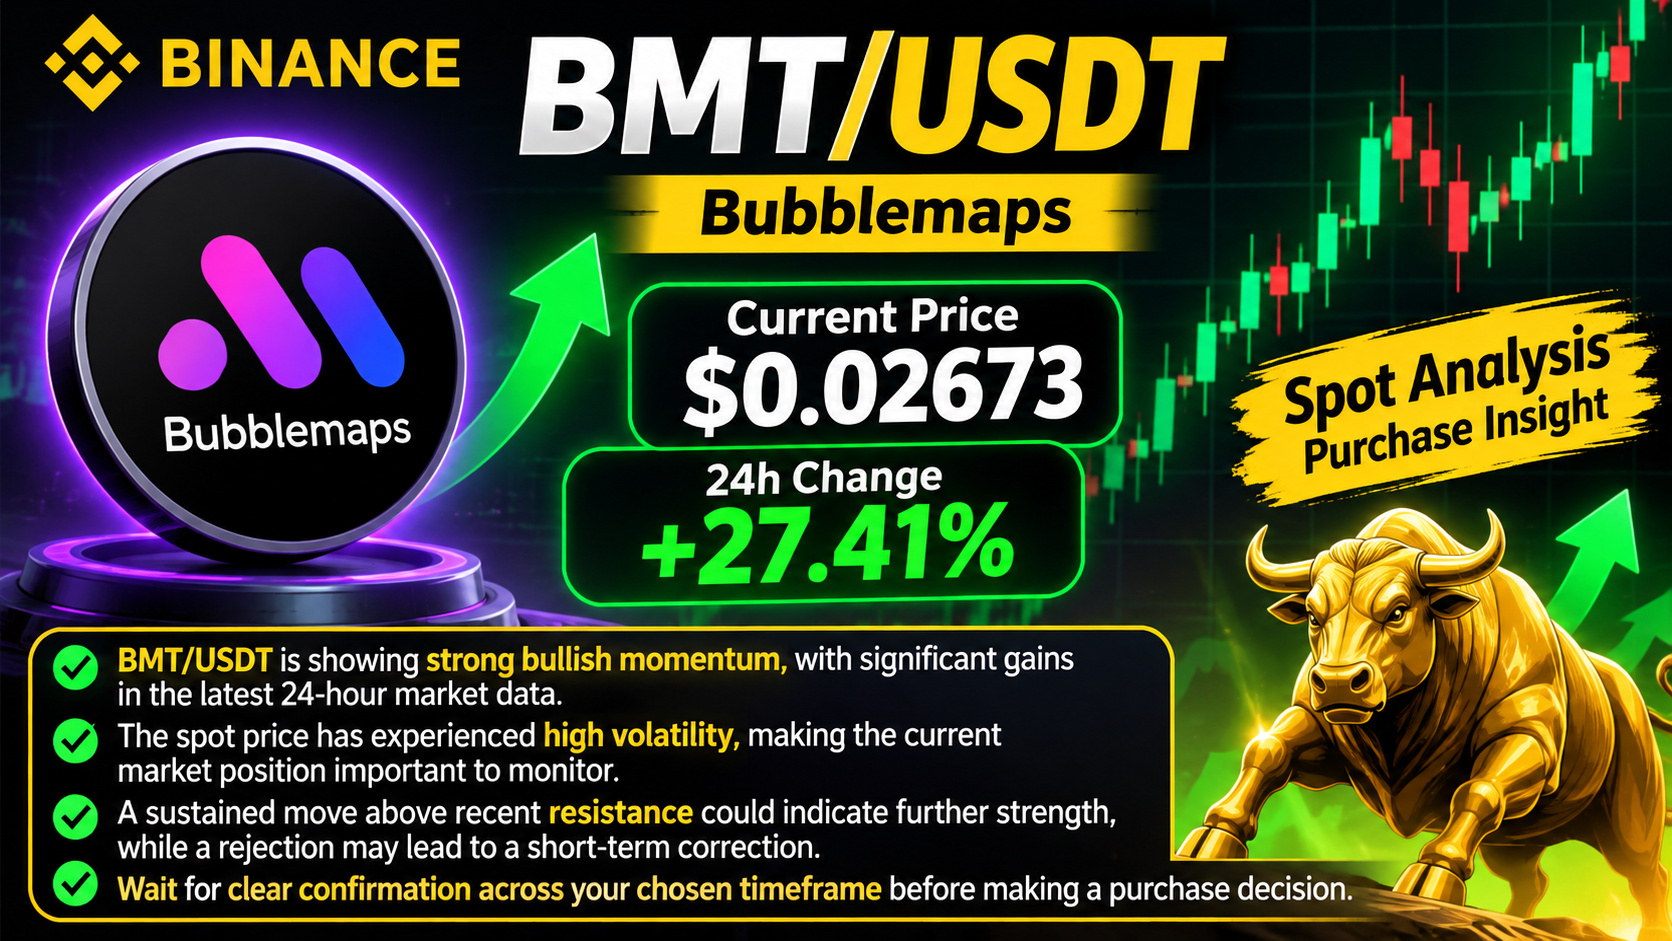
$BMT /USDT is showing strong bullish momentum, with significant gains in the latest 24-hour market data.
The spot price has experienced high volatility, making the current market position important to monitor.
A sustained move above recent resistance could indicate further strength, while a rejection may lead to a short-term correction.
Wait for clear confirmation across your chosen timeframe before making any purchase decision.
{spot}(BMTUSDT)
#BinanceReopensWithdrawalsForMoreAssets
$BMT /USDT is showing strong bullish momentum, with significant gains in the latest 24-hour market data.
The spot price has experienced high volatility, making the current market position important to monitor.
A sustained move above recent resistance could indicate further strength, while a rejection may lead to a short-term correction.
Wait for clear confirmation across your chosen timeframe before making any purchase decision.
#BinanceReopensWithdrawalsForMoreAssets
The spot price has experienced high volatility, making the current market position important to monitor.
A sustained move above recent resistance could indicate further strength, while a rejection may lead to a short-term correction.
Wait for clear confirmation across your chosen timeframe before making any purchase decision.
#BinanceReopensWithdrawalsForMoreAssets
146
Log in to explore more content
Join global crypto users on Binance Square
⚡️ Get latest and useful information about crypto.
💬 Trusted by the world’s largest crypto exchange.
👍 Discover real insights from verified creators.
Email / Phone number
Trending Topics
BinanceReopensWithdrawalsForHYPE&APT
67,329 views
867 Discussing
Binance Re-Enables Withdrawals for HYPE and APT, Extends List of Restored Assets
Binance News
·32 Likes
·22.4k views
SouthKoreaDraftLawTargets15To20%ShareholderCap
68,288 views
573 Discussing
TradFiForBeginners
169,594 views
1,769 Discussing