

#cryptoliquidations$674min24h
cryptoliquidations$674min24h
41,570 views
241 Discussing
Hot
Latest

·
--
Bearish
#CryptoLiquidations$674MIn24H
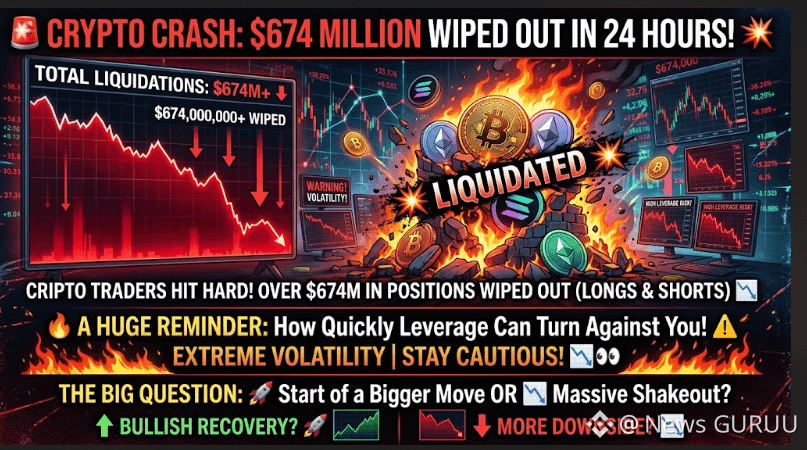
🚨 $674M+ Crypto Liquidations in 24 Hours
More than $674 million in crypto positions were reportedly liquidated, highlighting the danger of excessive leverage. ⚠️ Extreme volatility can quickly wipe out both long and short positions.
Traders should reduce leverage and manage risk carefully.
Trading View: SELL 🔴
Question: Is this a major shakeout or the beginning of further downside? "CLICK ON THE BELOW YELLOW COIN TAG TO GO TO DESIRED TRADING PAGE TO GET BENEFIT TRADE"$BNB $BTC $ETH
{spot}(ETHUSDT)
{spot}(BTCUSDT)
{spot}(BNBUSDT)
#CryptoMarket #USBankCompletesCrossBorderPaymentPilotOnStellar #EtherRalliesAsBearishBetsLiquidate #USInflationHoldsAt3.4%InAugust
#CryptoLiquidations$674MIn24H
🚨 $674M+ Crypto Liquidations in 24 Hours
More than $674 million in crypto positions were reportedly liquidated, highlighting the danger of excessive leverage. ⚠️ Extreme volatility can quickly wipe out both long and short positions.
Traders should reduce leverage and manage risk carefully.
Trading View: SELL 🔴
Question: Is this a major shakeout or the beginning of further downside? "CLICK ON THE BELOW YELLOW COIN TAG TO GO TO DESIRED TRADING PAGE TO GET BENEFIT TRADE"$BNB $BTC $ETH
#CryptoMarket #USBankCompletesCrossBorderPaymentPilotOnStellar #EtherRalliesAsBearishBetsLiquidate #USInflationHoldsAt3.4%InAugust
1
1
118

·
--
#CryptoLiquidations$674MIn24H
🚨 $674M Got Liquidated. But Crypto Didn’t Actually Move $674M.
That headline sounds terrifying.
But the real story is leverage.
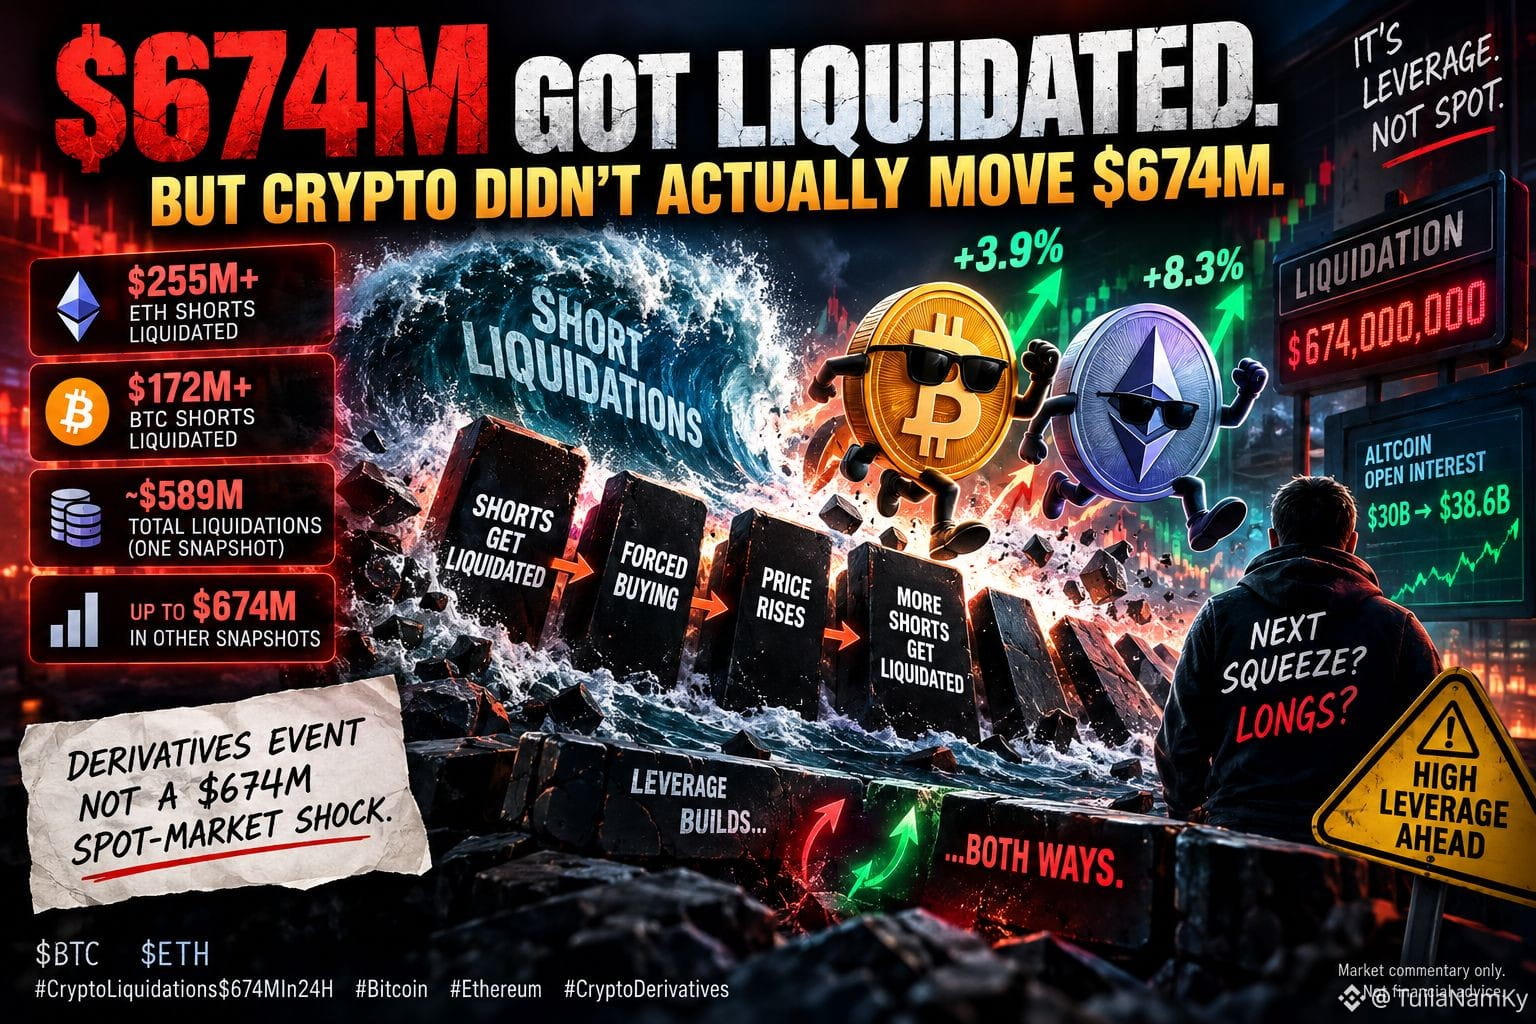
On Sept. 11, ETH jumped as much as 8.3%, while BTC gained less than 4%.
That was enough to trigger a fresh short squeeze:
Shorts get liquidated → forced buying kicks in → price rises → more shorts get liquidated.
A classic leverage domino. 👀
📊 The numbers depend on when you measure them:
→ $255M+ in ETH shorts liquidated
→ $172M+ in BTC shorts liquidated
→ Around $589M total liquidations in one snapshot
→ Other snapshots showed as much as $674M
That doesn't mean someone suddenly lost $674M in spot crypto.
Liquidation data is a rolling 24-hour snapshot of leveraged positions being forcibly closed.
And here's the bigger clue:
Despite hundreds of millions in liquidations, BTC and ETH spot prices remained relatively contained.
So this was primarily a derivatives event, not a $674M spot-market shock.
BUT HERE'S WHAT MANY PEOPLE MISS 👀
The leverage may already be rebuilding.
Altcoin Open Interest climbed from roughly $30B to $38.6B.
That means the next squeeze doesn't necessarily have to be upward.
If shorts are the fuel today, overleveraged longs could become the fuel tomorrow.
🧠 Square Insight:
A liquidation flush doesn't tell you where Bitcoin is going. It tells you how much leverage was standing in the way.
The real question:
Has the market actually deleveraged — or is it simply loading the next squeeze?
$BTC
{future}(BTCUSDT)
$ETH
{future}(ETHUSDT)
#Bitcoin #Ethereum #CryptoDerivatives
Market commentary only. Not financial advice.
#CryptoLiquidations$674MIn24H
🚨 $674M Got Liquidated. But Crypto Didn’t Actually Move $674M.
That headline sounds terrifying.
But the real story is leverage.
On Sept. 11, ETH jumped as much as 8.3%, while BTC gained less than 4%.
That was enough to trigger a fresh short squeeze:
Shorts get liquidated → forced buying kicks in → price rises → more shorts get liquidated.
A classic leverage domino. 👀
📊 The numbers depend on when you measure them:
→ $255M+ in ETH shorts liquidated
→ $172M+ in BTC shorts liquidated
→ Around $589M total liquidations in one snapshot
→ Other snapshots showed as much as $674M
That doesn't mean someone suddenly lost $674M in spot crypto.
Liquidation data is a rolling 24-hour snapshot of leveraged positions being forcibly closed.
And here's the bigger clue:
Despite hundreds of millions in liquidations, BTC and ETH spot prices remained relatively contained.
So this was primarily a derivatives event, not a $674M spot-market shock.
BUT HERE'S WHAT MANY PEOPLE MISS 👀
The leverage may already be rebuilding.
Altcoin Open Interest climbed from roughly $30B to $38.6B.
That means the next squeeze doesn't necessarily have to be upward.
If shorts are the fuel today, overleveraged longs could become the fuel tomorrow.
🧠 Square Insight:
A liquidation flush doesn't tell you where Bitcoin is going. It tells you how much leverage was standing in the way.
The real question:
Has the market actually deleveraged — or is it simply loading the next squeeze?
$BTC
$ETH
#Bitcoin #Ethereum #CryptoDerivatives
Market commentary only. Not financial advice.
10
190


·
--
Bearish
#CryptoLiquidations$674MIn24H
🚨💥 CRYPTO LIQUIDATIONS JUST NEARED $674M: LEVERAGE IS GETTING WIPED OUT 💥🚨
When the market moves fast,
leverage turns a small mistake into a forced exit.
Crypto derivatives have just endured another major liquidation wave. Recent reports put 24-hour liquidations in the roughly $600M to $680M range, showing how quickly leveraged positioning can unwind during volatile sessions.
The key detail is not simply the headline number. Liquidations reveal where traders were positioned too aggressively, because exchanges automatically close leveraged positions when margin becomes insufficient.
Recent data also showed short positions taking the heavier hit during one major liquidation wave, with about $422M in shorts versus $261M in longs. That suggests the move was not simply a one-directional collapse, but a violent repositioning as price reversed.
My Take: The real warning is leverage, not liquidation itself. When positioning becomes crowded, even a relatively sharp price move can trigger forced buying or selling, creating a feedback loop that amplifies volatility.
This is why liquidation spikes can distort the market picture. A sudden move may reflect forced positioning being cleared as much as genuine spot demand or selling pressure.
After the leverage gets flushed, the more important question becomes whether fresh capital steps in or traders simply reduce risk.
The market does not need more leverage to move fast. It already has enough.
❓Is this liquidation wave cleansing excessive leverage, or signaling deeper market weakness?
Disclaimer: Informational only, not financial advice.
#Crypto #Liquidations #GrowWithSAC $SOL $ETH $BNB

15
468

·
--
Bullish
$674 Million in Liquidations Shows How Quickly Leverage Can Unwind
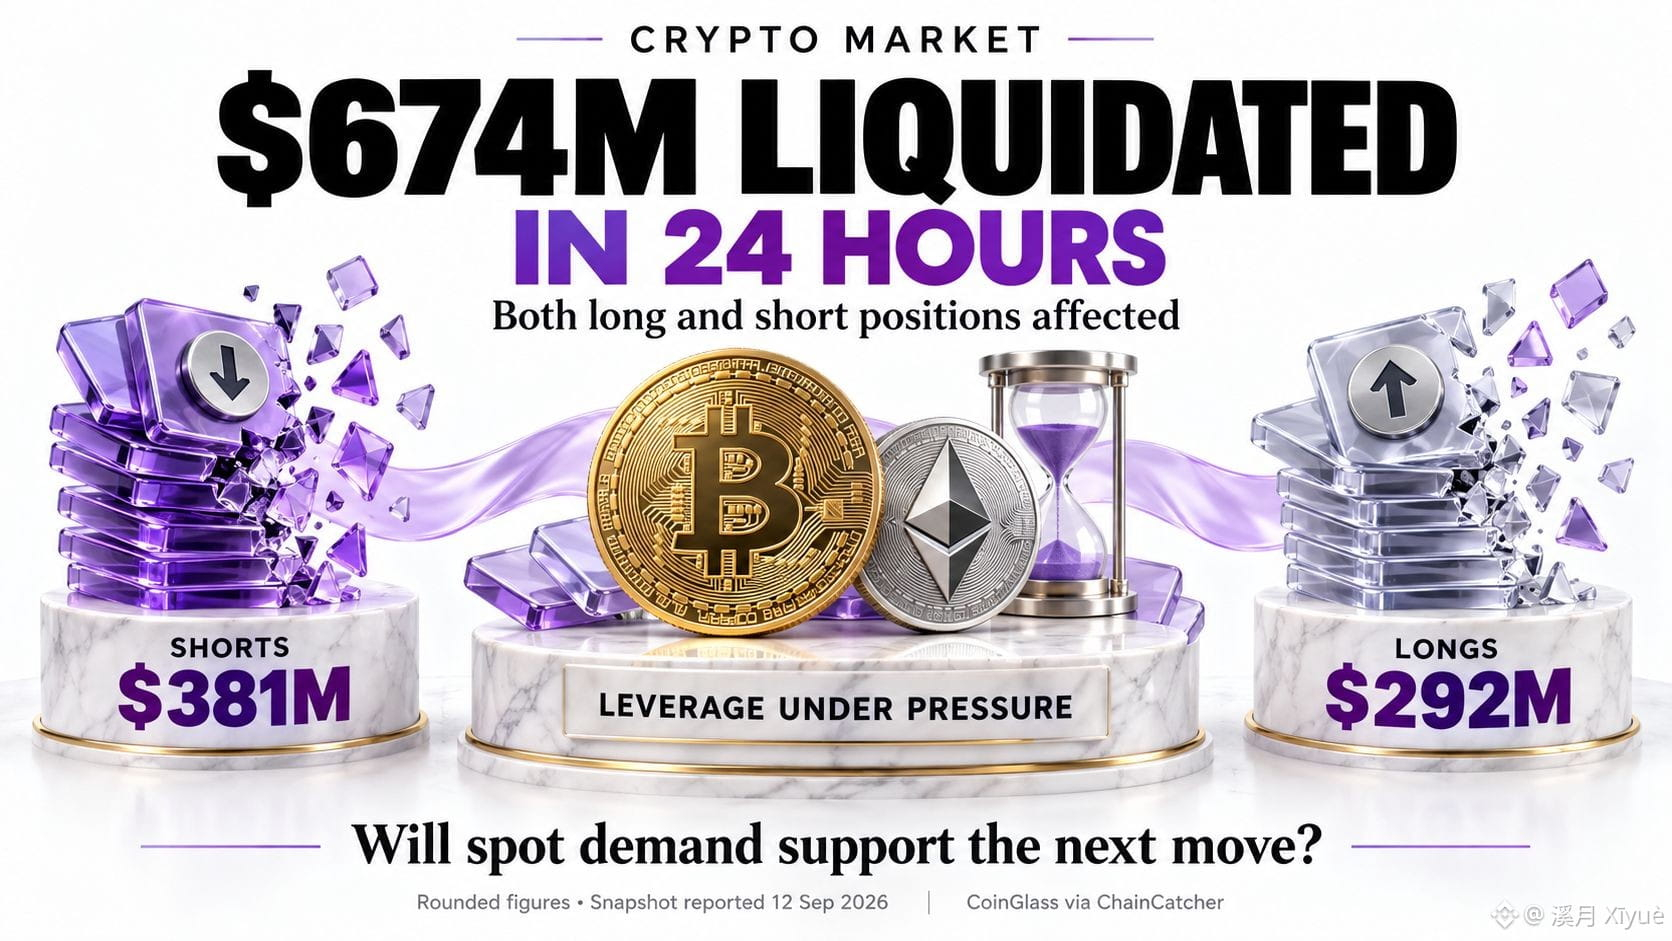
A September 12 report citing CoinGlass recorded approximately $674 million in crypto liquidations over the preceding 24 hours.
The rounded breakdown included $381 million in shorts and $292 million in longs, showing that traders on both sides faced forced exits.
Liquidation occurs when a leveraged position no longer meets its maintenance requirements. The reported position value can be much larger than the trader’s original margin deposit.
What interests me is what happens afterward. A liquidation wave can remove crowded positions, but the market can quickly become vulnerable again if leverage rebuilds faster than underlying demand.
I would watch whether open interest stabilizes while spot buying supports prices. That combination would make a recovery more convincing.
Rapidly increasing leverage alongside weak price progress would raise a different concern: traders may be rebuilding exposure before the market has found enough support.
The liquidation total describes a specific window. Its usefulness comes from connecting that event with subsequent positioning and price behavior.
What would convince you the market has absorbed the leverage reset?
#CryptoLiquidations$674MIn24H #CryptoMarket #RiskManagement $STEEM $ARK
{future}(ARKUSDT)
{future}(STEEMUSDT)
$674 Million in Liquidations Shows How Quickly Leverage Can Unwind
A September 12 report citing CoinGlass recorded approximately $674 million in crypto liquidations over the preceding 24 hours.
The rounded breakdown included $381 million in shorts and $292 million in longs, showing that traders on both sides faced forced exits.
Liquidation occurs when a leveraged position no longer meets its maintenance requirements. The reported position value can be much larger than the trader’s original margin deposit.
What interests me is what happens afterward. A liquidation wave can remove crowded positions, but the market can quickly become vulnerable again if leverage rebuilds faster than underlying demand.
I would watch whether open interest stabilizes while spot buying supports prices. That combination would make a recovery more convincing.
Rapidly increasing leverage alongside weak price progress would raise a different concern: traders may be rebuilding exposure before the market has found enough support.
The liquidation total describes a specific window. Its usefulness comes from connecting that event with subsequent positioning and price behavior.
What would convince you the market has absorbed the leverage reset?
#CryptoLiquidations$674MIn24H #CryptoMarket #RiskManagement $STEEM $ARK
5
258

·
--
#CryptoLiquidations$674MIn24H
🩸 MASSIVE RECT DAY: $674M Liquidated in 24 Hours as Leverage Gets Wiped Out!
📊 The Liquidation Breakdown
Total Wipeout: A high-volatility liquidity sweep triggered $674 million in forced liquidations across derivative markets in a 24-hour window, hitting nearly 95,000 over-leveraged accounts.
Two-Sided Whipsaw: Contrary to a one-way dump, market makers caught both sides off guard. $381 million in short positions were wiped out alongside $292 million in longs, confirming intense stop-hunting wicks.
ETH Lead Liquidations: Ethereum ($ETH) saw the heaviest leverage flush, accounting for over $215 million in short liquidations alone as sudden price action forced cascading market orders.
💡 Crucial Takeaways for Futures Traders
Leverage Flush Complete: Major liquidation events often clear open interest, resetting derivative funding rates back to neutral baseline levels.
Beware of Volatility Wicks: High open interest paired with tight stop-losses creates cascading liquidations. Lower your leverage ratio to survive choppy ranges.
Spot vs. Futures Divergence: While derivatives traders got wiped out, spot accumulation zones remain active near major support levels.
💬 Discussion: Were you caught in today's liquidation cascade, or did you stay on the sidelines in cash? Sound off below! 👇
#ClarityActFacesProceduralVoteSept15 #Liquidations

1
1
183

·
--
Bullish
#CryptoLiquidations$674MIn24H
Crypto’s $674 million liquidation wave hit both sides of the trade.
A September 12 report from ChainCatcher, citing CoinGlass, put liquidations at approximately $674 million over the preceding 24 hours:
Short positions: roughly $381 million.
Long positions: roughly $292 million.
Ethereum shorts accounted for about $215 million, making them a significant part of that snapshot.
Short liquidations can add buying pressure as bearish positions are forcibly closed. Long liquidations can add selling pressure. These mechanisms can amplify price moves in both directions.
My read: the next move needs confirmation from spot demand.
With substantial liquidations on both sides, I would be cautious about treating a sudden price spike as proof that buyers have established control.
What matters to me is whether buyers continue supporting the market after forced short covering slows. A recovery that holds its gains, attracts sustained spot activity and avoids an aggressive rebuild in leverage would strengthen my confidence.
If open interest rises quickly while price struggles to advance, I would become more cautious about another reversal.
The liquidation figure tells us how much positioning was forcibly closed during that window. Assessing the remaining risk requires looking at current positioning too.
Which are you watching most closely now: spot buying, funding rates or open interest?
#CryptoLiquidations #bitcoin #Ethereum #CryptoMarket
$LSK $VTHO $ETHFI
{spot}(ETHFIUSDT)
{spot}(VTHOUSDT)
{spot}(LSKUSDT)
#CryptoLiquidations$674MIn24H
Crypto’s $674 million liquidation wave hit both sides of the trade.
A September 12 report from ChainCatcher, citing CoinGlass, put liquidations at approximately $674 million over the preceding 24 hours:
Short positions: roughly $381 million.
Long positions: roughly $292 million.
Ethereum shorts accounted for about $215 million, making them a significant part of that snapshot.
Short liquidations can add buying pressure as bearish positions are forcibly closed. Long liquidations can add selling pressure. These mechanisms can amplify price moves in both directions.
My read: the next move needs confirmation from spot demand.
With substantial liquidations on both sides, I would be cautious about treating a sudden price spike as proof that buyers have established control.
What matters to me is whether buyers continue supporting the market after forced short covering slows. A recovery that holds its gains, attracts sustained spot activity and avoids an aggressive rebuild in leverage would strengthen my confidence.
If open interest rises quickly while price struggles to advance, I would become more cautious about another reversal.
The liquidation figure tells us how much positioning was forcibly closed during that window. Assessing the remaining risk requires looking at current positioning too.
Which are you watching most closely now: spot buying, funding rates or open interest?
#CryptoLiquidations #bitcoin #Ethereum #CryptoMarket
$LSK $VTHO $ETHFI
3
2
528

⚠️ $246 MILLION IN CRYPTO POSITIONS LIQUIDATED IN 24 HOURS
Crypto markets are experiencing another period of elevated volatility.
According to market reporting, approximately $246 million worth of crypto positions were liquidated over the past 24 hours as Bitcoin traded around the $79K level. (The Economic Times)
The liquidations highlight how quickly leveraged positions can amplify market movements.
Bitcoin’s recent weakness has occurred alongside several macroeconomic concerns:
🇺🇸 Strong U.S. employment data
🛢️ Higher oil prices
📈 Inflation concerns
🏦 Uncertainty surrounding Federal Reserve policy
🌍 Rising geopolitical tensions
When market volatility increases, highly leveraged positions can be particularly vulnerable.
This doesn’t necessarily tell us where Bitcoin will go next, but it does show that traders are currently operating in a much more volatile environment.
📊 Bottom line:
The crypto market isn’t only reacting to crypto-specific news right now. Global economic developments are having a major influence on price action.
$
#bitcoin #BTC #CryptoLiquidations #BTCUSDT #CryptoMarket #BinanceSquare
1
386

·
--
Bearish
#CryptoLiquidations$674MIn24H
🚨 $674 MILLION WIPED OUT OF CRYPTO IN JUST 24 HOURS! 💥
Crypto traders are getting hit hard as $674M+ in positions were liquidated over the past 24 hours. 📉
🔥 This is a huge reminder of how quickly leverage can turn against traders.
When the market moves sharply, longs and shorts can get wiped out within minutes. 👀
⚠️ High liquidations often mean extreme volatility, so traders should be careful with high leverage.
The big question now:
Was this the start of a bigger move, or just a massive shakeout before the next rally? 🚀
💬 What do you think — bullish recovery or more downside?
#crypto #bitcoin #Liquidations $BTC $ETH
1
510

#CryptoLiquidations$674MIn24H
🚨🔥 Crypto Liquidations Hit $674M In 24H: Leverage Gets Punished 🔥🚨
The market looked calm for a moment. Then prices moved sharply, leveraged positions started breaking, and traders watching from the sidelines suddenly saw millions disappear.
A $674 million liquidation wave is a reminder that crypto volatility does not need weeks to build damage. In leveraged markets, a fast price move can force positions closed automatically.
Recent liquidation data shows just how quickly the pressure can spread. Bitcoin and Ethereum have both seen substantial forced closures during the latest volatility, while the broader market has experienced hundreds of millions in liquidations.
The real story is not simply that traders lost money. Liquidations reveal how much leverage was sitting beneath the market before the move began.
When positions are forcibly closed, the resulting buying or selling can amplify the original move. That creates a feedback loop where volatility itself becomes a catalyst.
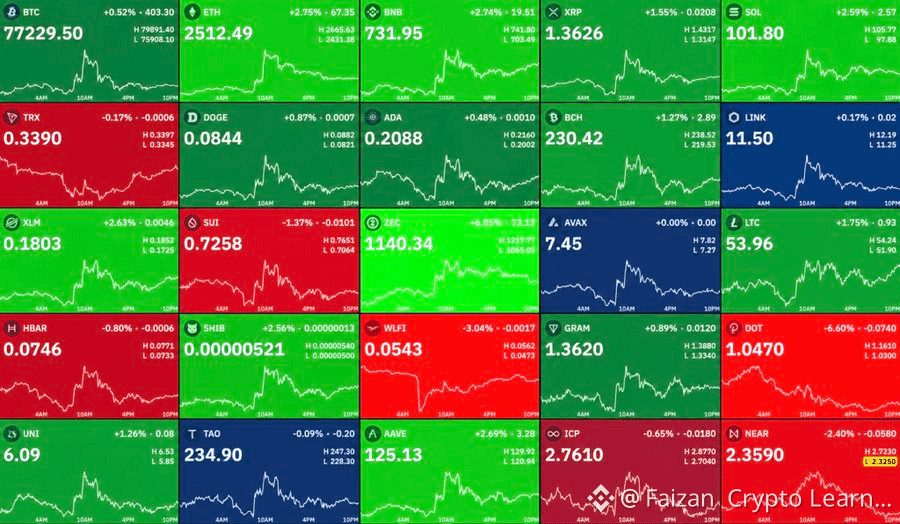
Bitcoin remains the market's main liquidity anchor, while Ethereum has recently shown particularly heavy derivatives activity. Current market data also shows BTC, ETH and several major altcoins trading higher after the latest volatility.
My take: liquidation spikes should not automatically be read as a bearish signal. They can represent painful leverage resets that leave the market less crowded afterward.
Smart traders watch leverage before chasing direction.
In crypto, the biggest risk is often not choosing the wrong side, but choosing it with too much leverage.
❓Do massive liquidations signal the end of a move, or could they prepare the market for the next one?
Disclaimer: This is for educational purposes only and is not financial advice.
#Bitcoin #Crypto #GrowWithSAC $BTC $ETH $SUI

1
2
527

·
--
#CryptoLiquidations$674MIn24H
🚨 $674M liquidated in just 24 hours!
Crypto’s leverage game is getting intense. A huge wave of forced liquidations can amplify volatility, push overleveraged traders out of positions, and create sharp moves across BTC and altcoins.
The big question now: was this a leverage reset before the next move, or could more liquidations be coming?
Trade smart. Manage risk. Don’t let leverage decide your fate. 📉📈
#CryptoLiquidations$674MIn24H #Bitcoin #CryptoLiquidations$674MIn24H BTC #Crypto
1
185

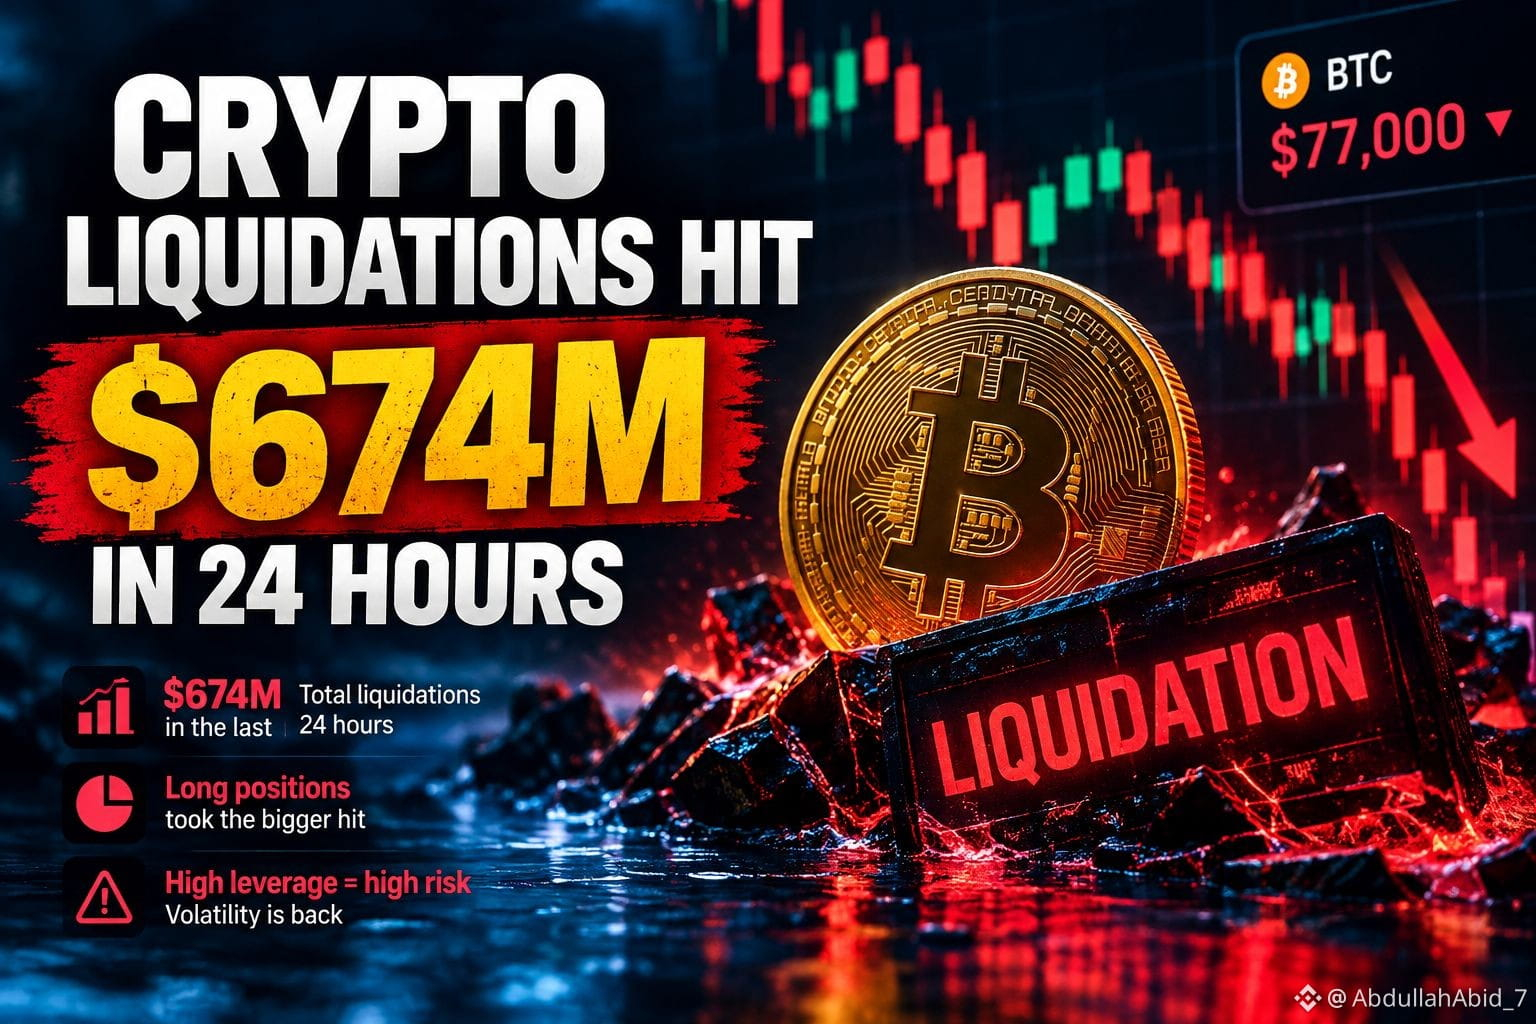
🚨 $674M Crypto Liquidation Wave Hits the Market
Crypto traders just got another reminder of how dangerous leverage can be.
Around $674 million in leveraged positions were liquidated over the past 24 hours, according to CoinGlass data reported today. Long positions accounted for the larger share of the wipeout.
$BTC has been trading around the $77K area, while profit-taking, market volatility and shifting expectations around the Fed continue to pressure risk assets.
Liquidation events like this can quickly flush excessive leverage from the market—but they can also create even sharper price swings.
📉 High leverage = high risk
⚡ Volatility is back
👀 Traders are watching the next BTC move closely
#CryptoLiquidations$674MIn24H #RevolutConfirmsFakeGovEmailDataBreach #CanadaOSFISaysTokenizedDepositsEqualTraditionalDeposits #Write2Earn #BinanceSquare
1
1
246

·
--
📉 MARKET LIQUIDATION ALERT: $674M Wiped Out in 24 Hours
Data from CoinGlass reveals massive volatility over the last 24 hours, triggering $674 Million in forced liquidations across major exchanges (Binance, Bybit, OKX).
📍 The Numbers Breakdown:
Total Liquidated Volume: $674.00 Million
Short Liquidations: $381.00 Million (56.5% of total)
Long Liquidations: $292.00 Million (43.5% of total)
💡 Key Takeaways for Traders:
Short Squeeze Pressure: The heavy concentration in short liquidations ($381M) signals aggressive upward spikes sweeping over-leveraged bears before price action stabilized.
Two-Way Volatility: With long traders also losing $292M, the market experienced severe stop-hunting and liquidation wicks in both directions.
Cascading Market Orders: High leverage on $BTC and$ETH triggered automated forced market sales, creating rapid domino-style volatility.
💬 Market Debate:
Was this liquidations cascade the final leverage flush before a continuation breakout, or are we heading for deeper downside? Drop your bias below! 👇
Click here to view the chart 👇️
{future}(XRPUSDT)
$XRP #CPIwatch #CryptoLiquidations$674MIn24H #RevolutConfirmsFakeGovEmailDataBreach #CanadaOSFISaysTokenizedDepositsEqualTraditionalDeposits #NvidiaInTalksToInvestUpTo$10BInAnthropicIPO
📉 MARKET LIQUIDATION ALERT: $674M Wiped Out in 24 Hours
Data from CoinGlass reveals massive volatility over the last 24 hours, triggering $674 Million in forced liquidations across major exchanges (Binance, Bybit, OKX).
📍 The Numbers Breakdown:
Total Liquidated Volume: $674.00 Million
Short Liquidations: $381.00 Million (56.5% of total)
Long Liquidations: $292.00 Million (43.5% of total)
💡 Key Takeaways for Traders:
Short Squeeze Pressure: The heavy concentration in short liquidations ($381M) signals aggressive upward spikes sweeping over-leveraged bears before price action stabilized.
Two-Way Volatility: With long traders also losing $292M, the market experienced severe stop-hunting and liquidation wicks in both directions.
Cascading Market Orders: High leverage on $BTC and$ETH triggered automated forced market sales, creating rapid domino-style volatility.
💬 Market Debate:
Was this liquidations cascade the final leverage flush before a continuation breakout, or are we heading for deeper downside? Drop your bias below! 👇
Click here to view the chart 👇️
$XRP #CPIwatch #CryptoLiquidations$674MIn24H #RevolutConfirmsFakeGovEmailDataBreach #CanadaOSFISaysTokenizedDepositsEqualTraditionalDeposits #NvidiaInTalksToInvestUpTo$10BInAnthropicIPO
1
139
·
--
#CryptoLiquidations$674MIn24H
💥 Market Volatility Spike: $674 Million Wiped Out in 24-Hour Liquidation Flush!
A massive liquidity wave just swept through derivatives markets! According to Coinglass metrics, over $674 million in crypto positions were liquidated across the market in a 24-hour window, affecting over 94,500 traders worldwide.
🔑 Key Highlights of the Liquidation Flush:
Two-Sided Squeeze: The flush wiped out $381 million in short positions and $292 million in long positions, catching high-leverage traders on both sides off guard.
Ethereum Leads the Damage: $ETH saw massive volatility, recording $215 million in short liquidations alongside $96.7 million in long liquidations. Bitcoin liquidations split closely at ~$89.4M in longs and ~$94.2M in shorts.
Record Single Order: The largest single liquidation order occurred on Hyperliquid’s ETH-USD pair, valued at an eye-watering $20.28 million.
🚨 Leverage Reset: Are high-leverage long wipes clearing the runway for a macro recovery?
When open interest reaches over-leveraged extremes, violent volatility sweeps out speculative excess. While short-term cascades create sharp price spikes and dips, flushing out weak hands resets funding rates to neutral, paving the way for healthier organic price discovery driven by spot demand.
⚡ MASSIVE CARNAGE! $674M liquidated in 24 hours—here’s who got caught off guard!
Aggressive leverage in tight trading ranges remains high-risk. Key support levels were heavily tested, but clean leverage wipes historically create ideal accumulation zones for disciplined spot investors.
💬 Were you caught in the liquidation wave, or did you stay in stables? What's your next move for $BTC and$ETH? Drop your thoughts below! 👇
#RevolutConfirmsFakeGovEmailDataBreach #Ethereum #EtherRalliesAsBearishBetsLiquidate
1
1
319

·
--
#CryptoLiquidations$674MIn24H
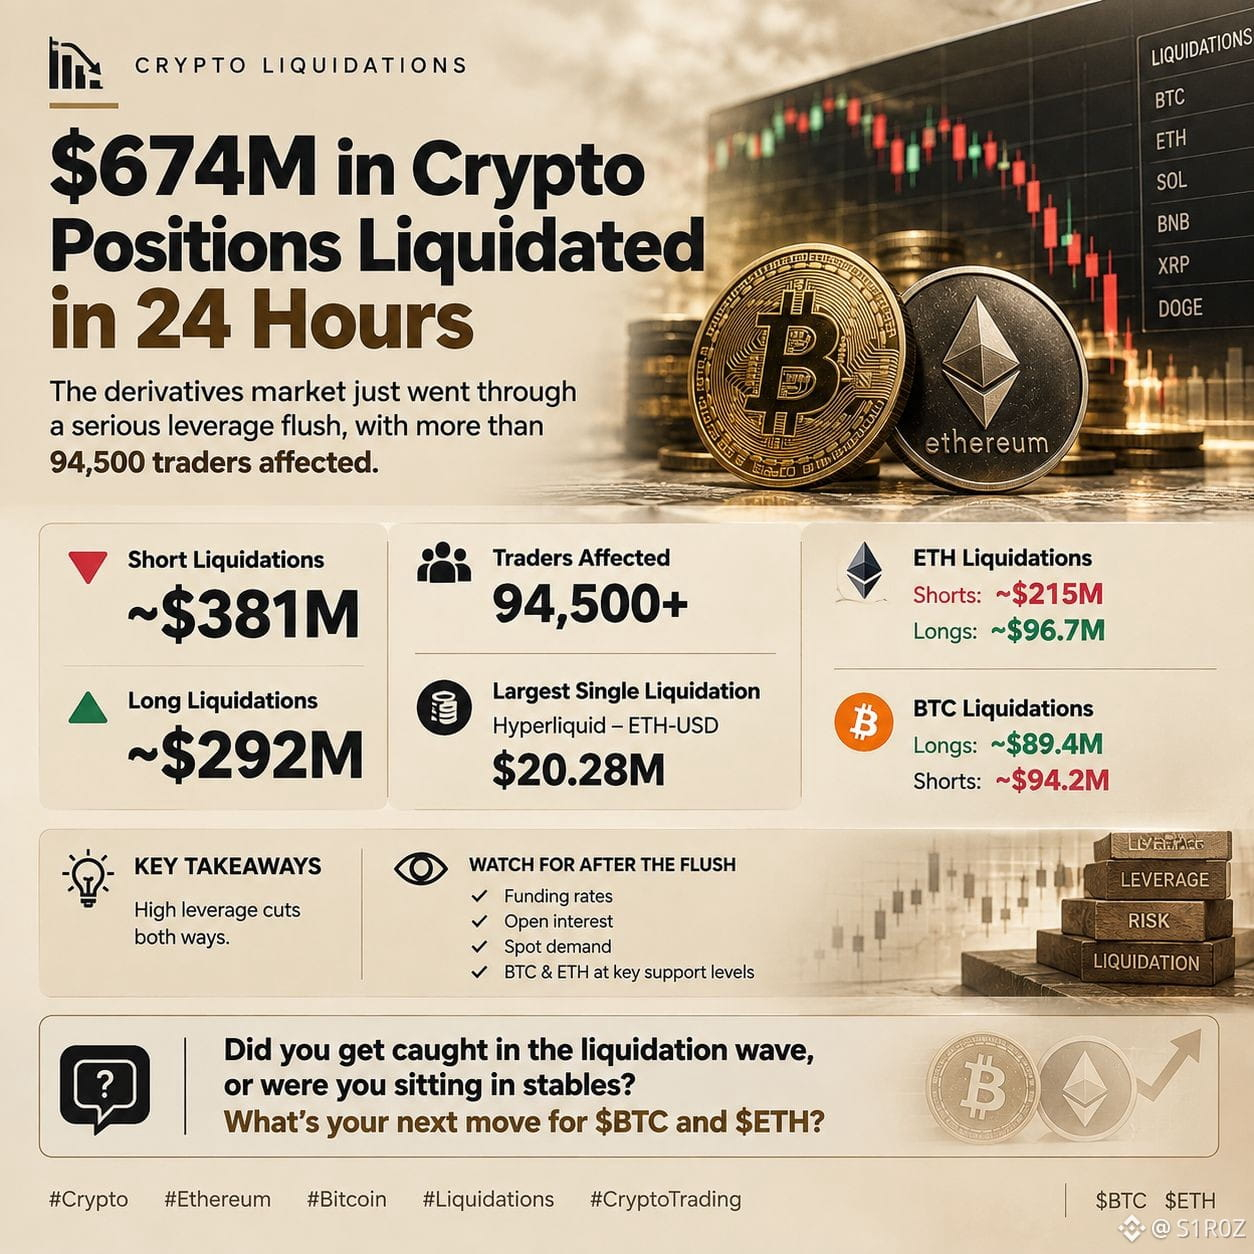
💥 $674M in crypto positions were liquidated in 24 hours.
The derivatives market just went through a serious leverage flush, with more than 94,500 traders affected.
According to the figures in your draft:
🔻 Short liquidations: ~$381M
🔺 Long liquidations: ~$292M
$ETH took some of the biggest damage, with around $215M in short liquidations and $96.7M in longs.
For $BTC, liquidations were more balanced at roughly $89.4M longs vs $94.2M shorts.
The biggest single liquidation reportedly hit Hyperliquid’s ETH-USD pair at $20.28M.
For traders, the key takeaway is simple: high leverage cuts both ways. After a flush this large, watch funding, open interest, spot demand and how BTC and ETH behave around key support levels.
Did you get caught in the liquidation wave, or were you sitting in stables? What’s your next move for $BTC and $ETH ?
{spot}(ETHUSDT)
{spot}(BTCUSDT)
#crypto #Ethereum #Bitcoin #Liquidations #cryptotrading
#CryptoLiquidations$674MIn24H
💥 $674M in crypto positions were liquidated in 24 hours.
The derivatives market just went through a serious leverage flush, with more than 94,500 traders affected.
According to the figures in your draft:
🔻 Short liquidations: ~$381M
🔺 Long liquidations: ~$292M
$ETH took some of the biggest damage, with around $215M in short liquidations and $96.7M in longs.
For $BTC , liquidations were more balanced at roughly $89.4M longs vs $94.2M shorts.
The biggest single liquidation reportedly hit Hyperliquid’s ETH-USD pair at $20.28M.
For traders, the key takeaway is simple: high leverage cuts both ways. After a flush this large, watch funding, open interest, spot demand and how BTC and ETH behave around key support levels.
Did you get caught in the liquidation wave, or were you sitting in stables? What’s your next move for $BTC and $ETH ?
#crypto #Ethereum #Bitcoin #Liquidations #cryptotrading
3
170

·
--
When the market is in full chaos, you either skim the profits—or watch others skim your liquidity. 😈💸
Take a look at this contrast, folks:
🔥 $LSK (+270,52%) — Simply cosmic green pump magic! If you jumped into this train at the start—I congratulate you, you’re dining on black caviar tonight. And if you were waiting for “trend confirmation”—well, look at the chart and cry into your handkerchief. 🚀
📉 $ACE ACE (-6,02%) — The market decided to cool off the hot heads a bit. While hamsters panic-sell on the dip, smart money calmly hunts for an entry point at the bottom. The main thing is not to get a margin call when you buy “on discounts.” 👀
🩸 $USELESS (-5,22%) — The name says it all… or is this another trap for shorters? It dipped a little, but in crypto, from “useless” to “to the moon”—one tweet or one powerful pump.
Feels like some people made a fortune in 2 hours today, while others are sitting in the red and counting losses.
👉 Which shield coin or alt is feeding your portfolio today? Are you in a tank and sitting in stables? Comment your positions—we’ll break it down! 👇
#LSK #ACE #useless #CryptoLiquidations$674MIn24H CryptoTrading #BinanceSquare
1
1.3k


·
--
Bullish
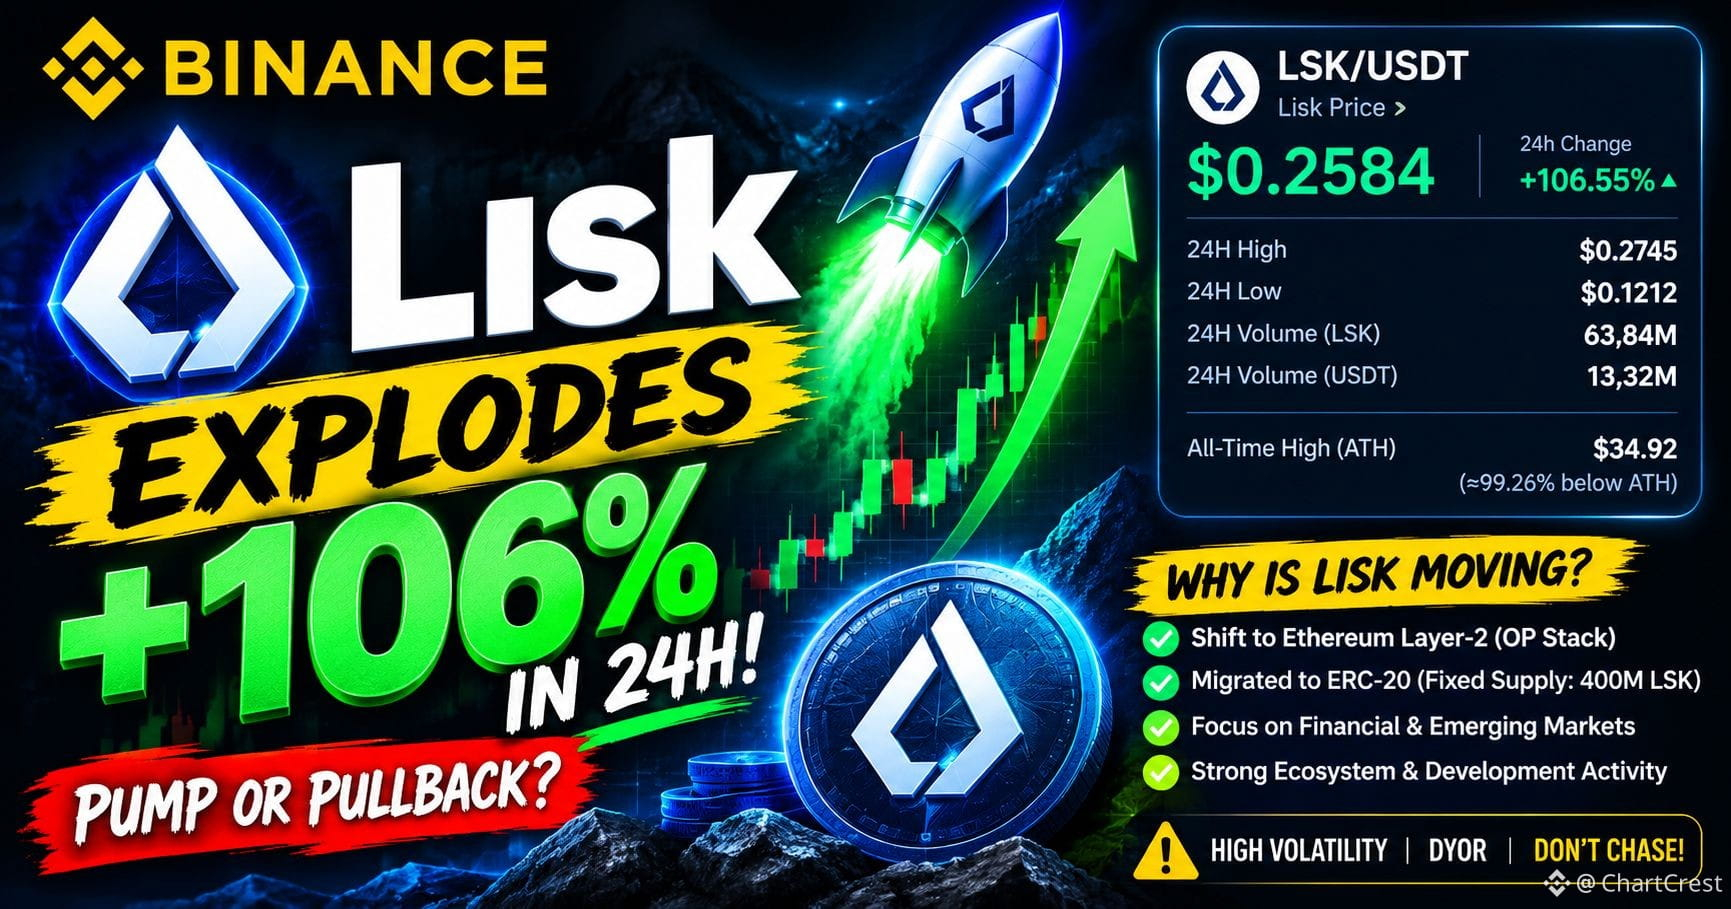
🚨 LISK ($LSK ) EXPLODES +106% IN 24H!
{future}(LSKUSDT)
Lisk ($LSK ) is suddenly making a massive move, with the token showing +106.55% in 24 hours on Binance.
📊 LSK Market Snapshot:
💰 Price: $0.2584
🚀 24H Change: +106.55%
🔝 24H High: $0.2745
🔻 24H Low: $0.1212
📈 24H Volume: 63.84M LSK
💵 Volume: ~13.32M USDT
🏆 All-Time High: $34.92
📉 Current price is still about 99.26% below its ATH.
🔥 Why is LSK moving?
Lisk has undergone a major transformation from its original Layer-1 blockchain toward an Ethereum Layer-2 ecosystem, using the OP Stack/Optimism Superchain architecture. LSK was also migrated to an ERC-20 token, with a fixed supply of 400M LSK.
Another important development: Lisk has been positioning itself around financial/modern money operations, while continuing its focus on emerging-market ecosystems and an EVM-based L2.
⚠️ Important: A +100% move in 24H means extreme volatility. After such a sharp pump, a pullback or strong price swings are possible. Don't chase the move blindly — DYOR.
Question:
Can LSK continue this rally, or is a major pullback coming next?
#ClarityActFacesProceduralVoteSept15 #US2YearYieldRisesTo4.61% #US10YearTreasuryYieldNears5% #CryptoLiquidations$674MIn24H #CryptoLiquidations$674MIn24H
🚨 LISK ($LSK ) EXPLODES +106% IN 24H!
Lisk ($LSK ) is suddenly making a massive move, with the token showing +106.55% in 24 hours on Binance.
📊 LSK Market Snapshot:
💰 Price: $0.2584
🚀 24H Change: +106.55%
🔝 24H High: $0.2745
🔻 24H Low: $0.1212
📈 24H Volume: 63.84M LSK
💵 Volume: ~13.32M USDT
🏆 All-Time High: $34.92
📉 Current price is still about 99.26% below its ATH.
🔥 Why is LSK moving?
Lisk has undergone a major transformation from its original Layer-1 blockchain toward an Ethereum Layer-2 ecosystem, using the OP Stack/Optimism Superchain architecture. LSK was also migrated to an ERC-20 token, with a fixed supply of 400M LSK.
Another important development: Lisk has been positioning itself around financial/modern money operations, while continuing its focus on emerging-market ecosystems and an EVM-based L2.
⚠️ Important: A +100% move in 24H means extreme volatility. After such a sharp pump, a pullback or strong price swings are possible. Don't chase the move blindly — DYOR.
Question:
Can LSK continue this rally, or is a major pullback coming next?
#ClarityActFacesProceduralVoteSept15 #US2YearYieldRisesTo4.61% #US10YearTreasuryYieldNears5% #CryptoLiquidations$674MIn24H #CryptoLiquidations$674MIn24H
1
160

·
--
🚀 Ethereum Breaks Higher: Up 2.7% as Traders Eye a Technical BreakoutCurrent price:
~$2,520, down about 49% from its all-time high of $4,946-4,954 (August 24, 2025). Market cap sits around $306-309 billion, holding the #2 spot, with roughly 122 million ETH in circulation (no fixed supply cap).
Recent trend:
ETH jumped about 2.5-2.7% over the past 24 hours, comfortably outperforming both the broader crypto index (up ~1.7%) and the overall market (down ~1.5% over the past week, while ETH itself is up ~2.5% over that stretch). The rally coincided with Bitcoin's brief CPI-driven surge and a wave of short-position liquidations that added fuel to the move. Analysts are now flagging ETH as one of the market's stronger performers alongside XRP, ADA, and BNB, with some pointing to a possible technical breakout scenario with targets meaningfully above current levels.
Key drivers:
Technical breakout signals — analysts are watching for a breakout above key resistance, with some pointing to significantly higher price targets if it confirms
Protocol development momentum — Ethereum developers are targeting October 6 for the "Glamsterdam" Sepolia testnet fork, a concrete step toward the network's next major upgrade
Macro-driven volatility — the same CPI surprise and bond-yield spike that moved Bitcoin also lifted ETH, showing how correlated the two remain during macro events
Relative strength — ETH's consistent outperformance vs. BTC and the broader market this week suggests some rotation of capital into Ethereum
High buyer participation — a large majority of active exchange users have been net buyers of ETH recently, reinforcing accumulation over distribution
Bottom line:
Ethereum is showing genuine relative strength right now — outperforming Bitcoin and the broader market on both a 24-hour and weekly basis, with technical analysts flagging a possible breakout. The upcoming Glamsterdam fork adds a concrete fundamental catalyst on top of the price momentum.
$ETH
{spot}(ETHUSDT)
#ETH🔥🔥🔥🔥🔥🔥 #Ethereum #US2YearYieldRisesTo4.61% #CryptoLiquidations$674MIn24H #RevolutConfirmsFakeGovEmailDataBreach
🚀 Ethereum Breaks Higher: Up 2.7% as Traders Eye a Technical Breakout
Current price:
~$2,520, down about 49% from its all-time high of $4,946-4,954 (August 24, 2025). Market cap sits around $306-309 billion, holding the #2 spot, with roughly 122 million ETH in circulation (no fixed supply cap).
Recent trend:
ETH jumped about 2.5-2.7% over the past 24 hours, comfortably outperforming both the broader crypto index (up ~1.7%) and the overall market (down ~1.5% over the past week, while ETH itself is up ~2.5% over that stretch). The rally coincided with Bitcoin's brief CPI-driven surge and a wave of short-position liquidations that added fuel to the move. Analysts are now flagging ETH as one of the market's stronger performers alongside XRP, ADA, and BNB, with some pointing to a possible technical breakout scenario with targets meaningfully above current levels.
Key drivers:
Technical breakout signals — analysts are watching for a breakout above key resistance, with some pointing to significantly higher price targets if it confirms
Protocol development momentum — Ethereum developers are targeting October 6 for the "Glamsterdam" Sepolia testnet fork, a concrete step toward the network's next major upgrade
Macro-driven volatility — the same CPI surprise and bond-yield spike that moved Bitcoin also lifted ETH, showing how correlated the two remain during macro events
Relative strength — ETH's consistent outperformance vs. BTC and the broader market this week suggests some rotation of capital into Ethereum
High buyer participation — a large majority of active exchange users have been net buyers of ETH recently, reinforcing accumulation over distribution
Bottom line:
Ethereum is showing genuine relative strength right now — outperforming Bitcoin and the broader market on both a 24-hour and weekly basis, with technical analysts flagging a possible breakout. The upcoming Glamsterdam fork adds a concrete fundamental catalyst on top of the price momentum.
$ETH
#ETH🔥🔥🔥🔥🔥🔥 #Ethereum #US2YearYieldRisesTo4.61% #CryptoLiquidations$674MIn24H #RevolutConfirmsFakeGovEmailDataBreach
66

·
--
Article
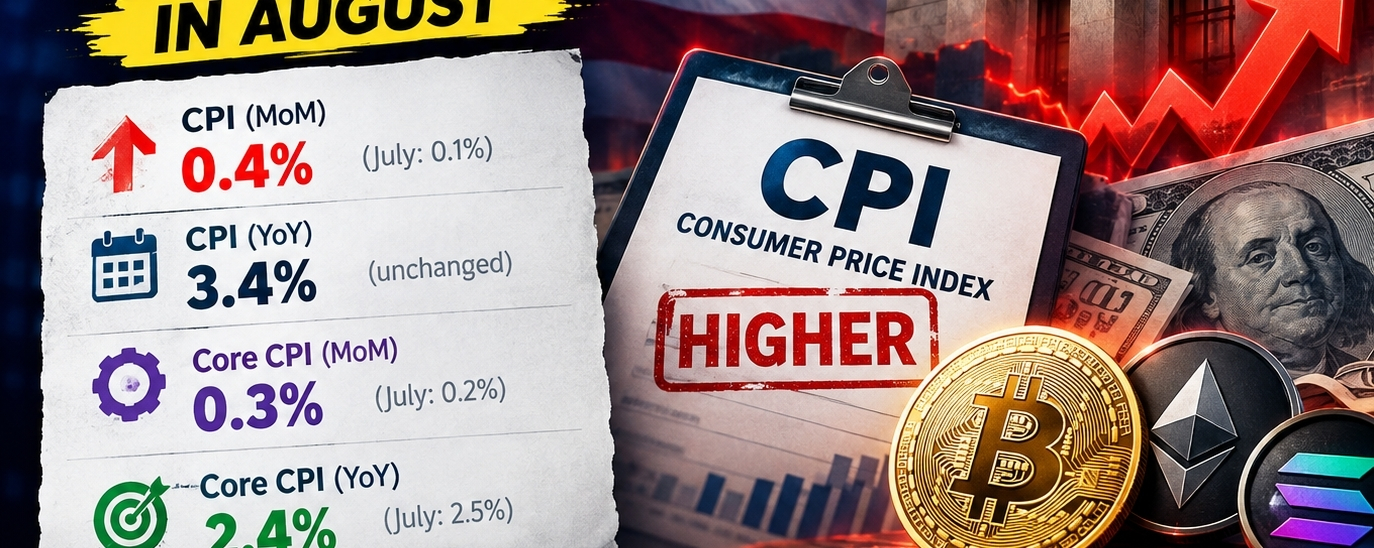
🔥 US CPI Rises More Than Expected in AugustThe latest US inflation data is out.
📊 CPI increased 0.4% in August, up from 0.1% in July, while annual inflation remained at 3.4%.
Core CPI, which excludes food and energy, rose 0.3% month-over-month and 2.4% year-over-year.
The hotter-than-expected inflation reading could keep pressure on the Fed and may bring more volatility across the crypto market.
Keep an eye on BTC and altcoins as traders react to the data. ⚠️
#CryptoLiquidations$674MIn24H BREAKING #CPI #Inflation #Crypto #CryptoLiquidations$674MIn24H Bitcoin #CanadaOSFISaysTokenizedDepositsEqualTraditionalDeposits US #News
🔥 US CPI Rises More Than Expected in August
The latest US inflation data is out.
📊 CPI increased 0.4% in August, up from 0.1% in July, while annual inflation remained at 3.4%.
Core CPI, which excludes food and energy, rose 0.3% month-over-month and 2.4% year-over-year.
The hotter-than-expected inflation reading could keep pressure on the Fed and may bring more volatility across the crypto market.
Keep an eye on BTC and altcoins as traders react to the data. ⚠️
#CryptoLiquidations$674MIn24H BREAKING #CPI #Inflation #Crypto #CryptoLiquidations$674MIn24H Bitcoin #CanadaOSFISaysTokenizedDepositsEqualTraditionalDeposits US #News
121

·
--
Bearish
🚨 Breaking News & Live Broadcast (September 13, 6 PM): A collective breath-hold in the market! $BTC is testing nerves at bearish levels, and $XRP is waiting for liquidity! 🤯📉
Hey folks! At this moment, the market is in a state of intense tension and brutal pressure! The screens flicker with cautious red, and everyone is waiting for the next move from the giants $BTC and $XRP! ⏱️🔥
📍 The on-the-ground scene right now (6 PM):
1️⃣ Bitcoin ($BTC):
It’s dropping now and testing tough psychological and technical support levels at $76,500 - $77,200 after failing to hold above the $78K mark. Whales are watching closely; a break of the $76,000 zone with a 4-hour candle close could open the door to a deeper correction. The battle is to reclaim $78,500 to ease fears! 📉👀
2️⃣ Ripple ($XRP) and Altcoins:
The alt market is being pressured by Bitcoin. It’s moving in a narrow, uncomfortable range near $1.30 - $1.35. Liquidity is extremely hesitant, and everyone is waiting for a spark of reversal from Bitcoin—or decisive legislative/regulatory news—to shake the stagnant waters #CryptoLiquidations$674MIn24H #ClarityActFacesProceduralVoteSept15 #NvidiaInTalksToInvestUpTo$10BInAnthropicIPO #EtherRalliesAsBearishBetsLiquidate #RevolutConfirmsFakeGovEmailDataBreach
🚨 Breaking News & Live Broadcast (September 13, 6 PM): A collective breath-hold in the market! $BTC is testing nerves at bearish levels, and $XRP is waiting for liquidity! 🤯📉
Hey folks! At this moment, the market is in a state of intense tension and brutal pressure! The screens flicker with cautious red, and everyone is waiting for the next move from the giants $BTC and $XRP ! ⏱️🔥
📍 The on-the-ground scene right now (6 PM):
1️⃣ Bitcoin ($BTC ):
It’s dropping now and testing tough psychological and technical support levels at $76,500 - $77,200 after failing to hold above the $78K mark. Whales are watching closely; a break of the $76,000 zone with a 4-hour candle close could open the door to a deeper correction. The battle is to reclaim $78,500 to ease fears! 📉👀
2️⃣ Ripple ($XRP ) and Altcoins:
The alt market is being pressured by Bitcoin. It’s moving in a narrow, uncomfortable range near $1.30 - $1.35. Liquidity is extremely hesitant, and everyone is waiting for a spark of reversal from Bitcoin—or decisive legislative/regulatory news—to shake the stagnant waters #CryptoLiquidations$674MIn24H #ClarityActFacesProceduralVoteSept15 #NvidiaInTalksToInvestUpTo$10BInAnthropicIPO #EtherRalliesAsBearishBetsLiquidate #RevolutConfirmsFakeGovEmailDataBreach
1
103
Log in to explore more content
Join global crypto users on Binance Square
⚡️ Get latest and useful information about crypto.
💬 Trusted by the world’s largest crypto exchange.
👍 Discover real insights from verified creators.
Email / Phone number
Trending Topics
1
#BinancePick
3.3M views
163,074 Discussing
2
#EarningsSeason
5.4M views
26,693 Discussing
3
#StrategySkipsBitcoinPurchasesSpends$205MOnSTRCBuybacks
347 views
17 Discussing
4
#BitmineAdds10452ETH
5,951 views
156 Discussing
5
#SouthKoreaConsidersEducationTaxOnCryptoExchanges
5,301 views
136 Discussing
6
#OCCUrgesCommunityBanksToEnterStablecoinPayments
4,541 views
90 Discussing
7
#RippleWinsFullApprovalAsNationalTrustBank
4,327 views
93 Discussing
8
#AkashSelectsSolanaAsMigrationTarget
2,596 views
32 Discussing
9
#OndoToOpenSubscriptionsForOpenAIPreIPOTokenizedNotes
163 views
11 Discussing
10
#AnthropicTTMRevenueGrewAbout1200%
55,071 views
556 Discussing