

孤独的交易者C
41 Publicações

孤独的交易者C
Denunciar
Bloquear Utilizador
BNB999BTC
Trader Frequente
5.2 ano(s)
12 A seguir
63 Seguidores
45 Gostaram
Publicações
·
--
🚀 SOL forte tendência de mercado, siga a tendência, aposte com pequenas quantias, saia rapidamente em caso de quebra.
#SOL #Solana #Operação de intervalo #内容挖矿
$BNB
🚀 SOL forte tendência de mercado, siga a tendência, aposte com pequenas quantias, saia rapidamente em caso de quebra.
#SOL #Solana #Operação de intervalo #内容挖矿
$BNB
#SOL #Solana #Operação de intervalo #内容挖矿
$BNB
4
568
·
--
$ETH
{future}(ETHUSDT)
💡 ETH deve ser comprado em correções, não em altas, mantenha paciência com as moedas principais até que a tendência seja quebrada.
#ETH #Ethereum #NegociaçãoSpot #MineraçãoDeConteúdo
$ETH
💡 ETH deve ser comprado em correções, não em altas, mantenha paciência com as moedas principais até que a tendência seja quebrada.
#ETH #Ethereum #NegociaçãoSpot #MineraçãoDeConteúdo
💡 ETH deve ser comprado em correções, não em altas, mantenha paciência com as moedas principais até que a tendência seja quebrada.
#ETH #Ethereum #NegociaçãoSpot #MineraçãoDeConteúdo
592
·
--
1. 📊 BTC níveis de suporte chave mantidos, pensamento de curto prazo levemente otimista, rigorosamente com stop loss, não segure posições e não sobrecarregue.
#BTC #Bitcoin #DicasDeContrato #内容挖矿 $BTC
{future}(BTCUSDT)
1. 📊 BTC níveis de suporte chave mantidos, pensamento de curto prazo levemente otimista, rigorosamente com stop loss, não segure posições e não sobrecarregue.
#BTC #Bitcoin #DicasDeContrato #内容挖矿 $BTC
#BTC #Bitcoin #DicasDeContrato #内容挖矿 $BTC
300
·
--

Artigo
ZORA Token Technical Analysis: Market Performance, Price Predictions, and Future Outlook#zora
As the native cryptocurrency of the Zora network, the ZORA token has sparked widespread discussion in the crypto community since its official issuance on April 23, 2025. This technical analysis will comprehensively analyze ZORA token's market performance, technical indicators, on-chain data, competitive landscape, and future potential from multiple dimensions to help investors understand current market dynamics and make more informed investment decisions. We will present a panoramic view of ZORA tokens based on the latest price data, trading volume changes, support and resistance level analysis, and professional institutional price forecasts.
ZORA Token Technical Analysis: Market Performance, Price Predictions, and Future Outlook
#zora
As the native cryptocurrency of the Zora network, the ZORA token has sparked widespread discussion in the crypto community since its official issuance on April 23, 2025. This technical analysis will comprehensively analyze ZORA token's market performance, technical indicators, on-chain data, competitive landscape, and future potential from multiple dimensions to help investors understand current market dynamics and make more informed investment decisions. We will present a panoramic view of ZORA tokens based on the latest price data, trading volume changes, support and resistance level analysis, and professional institutional price forecasts.
As the native cryptocurrency of the Zora network, the ZORA token has sparked widespread discussion in the crypto community since its official issuance on April 23, 2025. This technical analysis will comprehensively analyze ZORA token's market performance, technical indicators, on-chain data, competitive landscape, and future potential from multiple dimensions to help investors understand current market dynamics and make more informed investment decisions. We will present a panoramic view of ZORA tokens based on the latest price data, trading volume changes, support and resistance level analysis, and professional institutional price forecasts.
1
1
1
1.3k
·
--
#TRUMP晚宴
# Trump plans to hold an event named "TRUMP DINNER" at the Trump National Golf Club in Washington, D.C. on May 22, 2025, inviting the top 220 investors ranked by their holdings of the official Meme coin ($TRUMP). Here are the key details:
### **1. Event Schedule**
- **Date**: May 22, 2025
- **Location**: Trump National Golf Club, Washington, D.C.
- **Participants**: Top 220 holders of $TRUMP (based on the holdings snapshot from May 12)
- **VIP Treatment**: The top 25 holders will be invited to a private VIP reception with Trump and a special edition White House tour.
### **2. Participation Conditions**
- **Background Check**: All invitees must pass KYC (Know Your Customer) and compliance checks, with investors from sanctioned countries prohibited.
- **Self-Funded**: Participants must cover their own travel, accommodation, and meal expenses.
- **Trump May Be Absent**: An official statement indicates that Trump may not attend; if canceled or rescheduled, participants will receive a limited edition NFT as a substitute.
### **3. Market Reaction**
- **Price Surge**: Following the announcement, the price of $TRUMP surged by 60%, with trading volume skyrocketing.
- **Whale Manipulation**: Large holders rapidly bought and sold for arbitrage, making over $700,000 in profit within 30 minutes.
- **Controversy**: 80% of $TRUMP is controlled by Trump-affiliated parties, with Democrats criticizing the move as potentially involving "de facto bribery" and conflicts of interest.
### **4. Historical Background**
- Trump previously hosted NFT dinners (such as the "MugShot Edition" NFT event in May 2024), but this is the first time targeting Meme coin holders as the primary invitees.
- He has long been absent from traditional political dinners (like the White House Correspondents' Dinner), opting instead for such private events.
### **5. Potential Risks**
- **High Volatility**: $TRUMP has previously plummeted from $75 to single digits, with strong market speculation.
- **Regulatory Concerns**: U.S. lawmakers are proposing legislation to prohibit politicians from profiting from Meme coins, viewing them as potential "tools for foreign influence."
This dinner is seen as a means for Trump to consolidate support within the crypto community, but it also raises concerns about market manipulation and compliance. Investors should be wary of short-term speculative risks.
#TRUMP晚宴
# Trump plans to hold an event named "TRUMP DINNER" at the Trump National Golf Club in Washington, D.C. on May 22, 2025, inviting the top 220 investors ranked by their holdings of the official Meme coin ($TRUMP). Here are the key details:
### **1. Event Schedule**
- **Date**: May 22, 2025
- **Location**: Trump National Golf Club, Washington, D.C.
- **Participants**: Top 220 holders of $TRUMP (based on the holdings snapshot from May 12)
- **VIP Treatment**: The top 25 holders will be invited to a private VIP reception with Trump and a special edition White House tour.
### **2. Participation Conditions**
- **Background Check**: All invitees must pass KYC (Know Your Customer) and compliance checks, with investors from sanctioned countries prohibited.
- **Self-Funded**: Participants must cover their own travel, accommodation, and meal expenses.
- **Trump May Be Absent**: An official statement indicates that Trump may not attend; if canceled or rescheduled, participants will receive a limited edition NFT as a substitute.
### **3. Market Reaction**
- **Price Surge**: Following the announcement, the price of $TRUMP surged by 60%, with trading volume skyrocketing.
- **Whale Manipulation**: Large holders rapidly bought and sold for arbitrage, making over $700,000 in profit within 30 minutes.
- **Controversy**: 80% of $TRUMP is controlled by Trump-affiliated parties, with Democrats criticizing the move as potentially involving "de facto bribery" and conflicts of interest.
### **4. Historical Background**
- Trump previously hosted NFT dinners (such as the "MugShot Edition" NFT event in May 2024), but this is the first time targeting Meme coin holders as the primary invitees.
- He has long been absent from traditional political dinners (like the White House Correspondents' Dinner), opting instead for such private events.
### **5. Potential Risks**
- **High Volatility**: $TRUMP has previously plummeted from $75 to single digits, with strong market speculation.
- **Regulatory Concerns**: U.S. lawmakers are proposing legislation to prohibit politicians from profiting from Meme coins, viewing them as potential "tools for foreign influence."
This dinner is seen as a means for Trump to consolidate support within the crypto community, but it also raises concerns about market manipulation and compliance. Investors should be wary of short-term speculative risks.
# Trump plans to hold an event named "TRUMP DINNER" at the Trump National Golf Club in Washington, D.C. on May 22, 2025, inviting the top 220 investors ranked by their holdings of the official Meme coin ($TRUMP). Here are the key details:
### **1. Event Schedule**
- **Date**: May 22, 2025
- **Location**: Trump National Golf Club, Washington, D.C.
- **Participants**: Top 220 holders of $TRUMP (based on the holdings snapshot from May 12)
- **VIP Treatment**: The top 25 holders will be invited to a private VIP reception with Trump and a special edition White House tour.
### **2. Participation Conditions**
- **Background Check**: All invitees must pass KYC (Know Your Customer) and compliance checks, with investors from sanctioned countries prohibited.
- **Self-Funded**: Participants must cover their own travel, accommodation, and meal expenses.
- **Trump May Be Absent**: An official statement indicates that Trump may not attend; if canceled or rescheduled, participants will receive a limited edition NFT as a substitute.
### **3. Market Reaction**
- **Price Surge**: Following the announcement, the price of $TRUMP surged by 60%, with trading volume skyrocketing.
- **Whale Manipulation**: Large holders rapidly bought and sold for arbitrage, making over $700,000 in profit within 30 minutes.
- **Controversy**: 80% of $TRUMP is controlled by Trump-affiliated parties, with Democrats criticizing the move as potentially involving "de facto bribery" and conflicts of interest.
### **4. Historical Background**
- Trump previously hosted NFT dinners (such as the "MugShot Edition" NFT event in May 2024), but this is the first time targeting Meme coin holders as the primary invitees.
- He has long been absent from traditional political dinners (like the White House Correspondents' Dinner), opting instead for such private events.
### **5. Potential Risks**
- **High Volatility**: $TRUMP has previously plummeted from $75 to single digits, with strong market speculation.
- **Regulatory Concerns**: U.S. lawmakers are proposing legislation to prohibit politicians from profiting from Meme coins, viewing them as potential "tools for foreign influence."
This dinner is seen as a means for Trump to consolidate support within the crypto community, but it also raises concerns about market manipulation and compliance. Investors should be wary of short-term speculative risks.

745
·
--
$BNB
{spot}(BNBUSDT)
#Strategy增持比特币
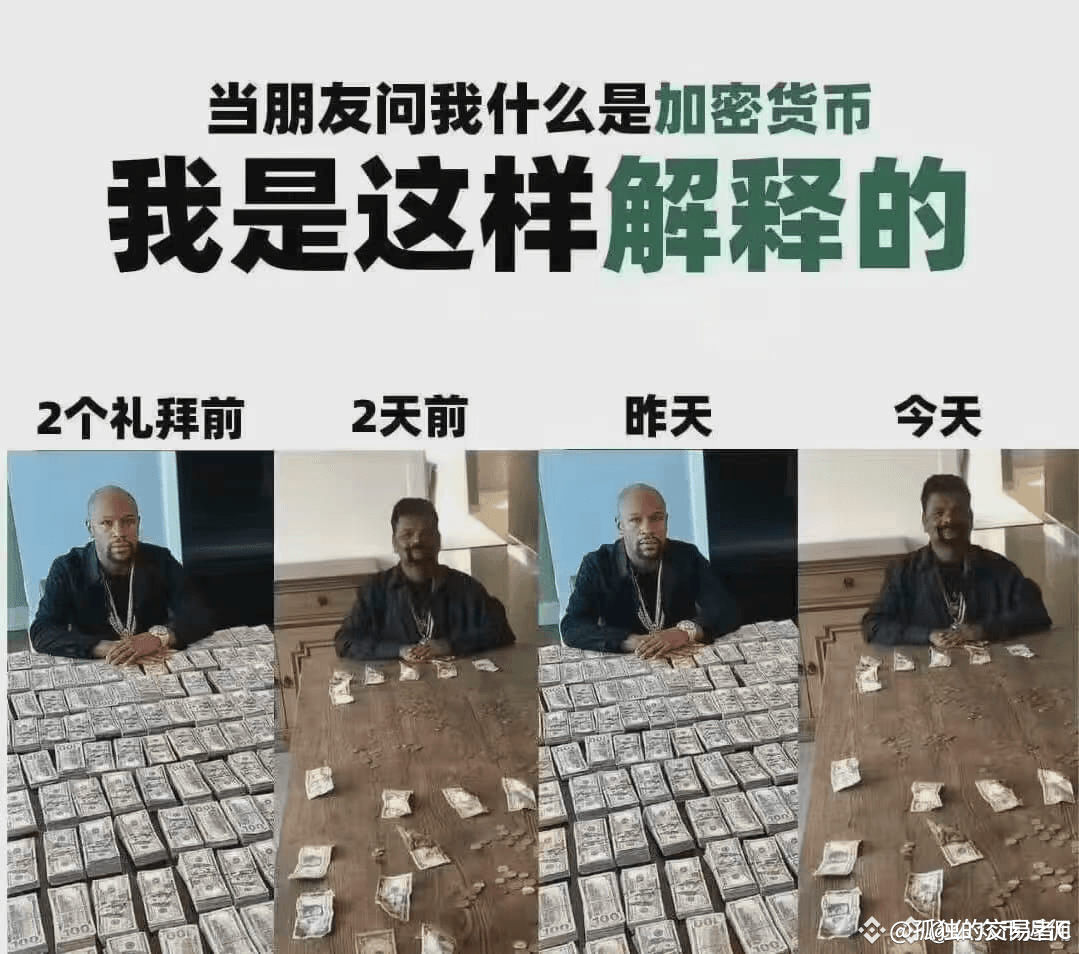
BNBUSDT 1d行情走势分析报告
当前价格:613.450 USDT
24小时涨跌:2.886%
主要支撑位:578.663 USDT
主要压力位:611.533 USDT
当前趋势:震荡偏多
详细解释:
技术指标综合:
均线系统:多头排列。MA5(593.802)MA10(588.931)MA20(583.962),表明短期均线呈现多头排列,市场短期趋势偏强。
MACD:金叉运行中。DIF(-1.758)与DEA(-4.550)形成金叉,且柱状图(2.792)为正,表明市场动能正在增强,有利于多头。
BOLL:价格位于中轨(583.962)与上轨(611.309)之间,且%B(0.73%)接近上轨,表明市场处于强势区域,但接近上轨可能面临一定压力。
RSI:中性。RSI6(65.45)接近超买区域,但RSI12(53.72)和RSI14(52.32)仍处于中性区域,表明市场尚未进入极端超买状态。
KDJ:金叉运行中。K(67.73)D(71.00)J(61.21),表明市场短期内有进一步上涨的潜力。
指标数据:
资金费率:0E-8%,表明市场多空情绪较为平衡,没有明显的多空倾向。
成交量变化:近期成交量有所放大,特别是在价格上涨时成交量增加,表明市场参与者对当前价格水平的认可度较高。
资金流数据:合约资金净流入流出数据显示,24小时内资金净流入20688324.75 USDT,表明市场资金流入较多,有利于价格进一步上涨。
分析结果
方向:谨慎做多
入场时机:建议在价格回调至主要支撑位578.663 USDT附近时入场,或者在价格突破主要压力位611.533 USDT时追多。
止损设定:建议止损设在入场价下方3%-5%的位置,即560.707 USDT附近。
目标价位:预期目标价位为644.403 USDT,预期收益率约为5%-10%。
提示:本次分析仅供参考,不构成任何投资建议!
$BNB
#Strategy增持比特币
BNBUSDT 1d行情走势分析报告
当前价格:613.450 USDT
24小时涨跌:2.886%
主要支撑位:578.663 USDT
主要压力位:611.533 USDT
当前趋势:震荡偏多
详细解释:
技术指标综合:
均线系统:多头排列。MA5(593.802)MA10(588.931)MA20(583.962),表明短期均线呈现多头排列,市场短期趋势偏强。
MACD:金叉运行中。DIF(-1.758)与DEA(-4.550)形成金叉,且柱状图(2.792)为正,表明市场动能正在增强,有利于多头。
BOLL:价格位于中轨(583.962)与上轨(611.309)之间,且%B(0.73%)接近上轨,表明市场处于强势区域,但接近上轨可能面临一定压力。
RSI:中性。RSI6(65.45)接近超买区域,但RSI12(53.72)和RSI14(52.32)仍处于中性区域,表明市场尚未进入极端超买状态。
KDJ:金叉运行中。K(67.73)D(71.00)J(61.21),表明市场短期内有进一步上涨的潜力。
指标数据:
资金费率:0E-8%,表明市场多空情绪较为平衡,没有明显的多空倾向。
成交量变化:近期成交量有所放大,特别是在价格上涨时成交量增加,表明市场参与者对当前价格水平的认可度较高。
资金流数据:合约资金净流入流出数据显示,24小时内资金净流入20688324.75 USDT,表明市场资金流入较多,有利于价格进一步上涨。
分析结果
方向:谨慎做多
入场时机:建议在价格回调至主要支撑位578.663 USDT附近时入场,或者在价格突破主要压力位611.533 USDT时追多。
止损设定:建议止损设在入场价下方3%-5%的位置,即560.707 USDT附近。
目标价位:预期目标价位为644.403 USDT,预期收益率约为5%-10%。
提示:本次分析仅供参考,不构成任何投资建议!
#Strategy增持比特币
BNBUSDT 1d行情走势分析报告
当前价格:613.450 USDT
24小时涨跌:2.886%
主要支撑位:578.663 USDT
主要压力位:611.533 USDT
当前趋势:震荡偏多
详细解释:
技术指标综合:
均线系统:多头排列。MA5(593.802)MA10(588.931)MA20(583.962),表明短期均线呈现多头排列,市场短期趋势偏强。
MACD:金叉运行中。DIF(-1.758)与DEA(-4.550)形成金叉,且柱状图(2.792)为正,表明市场动能正在增强,有利于多头。
BOLL:价格位于中轨(583.962)与上轨(611.309)之间,且%B(0.73%)接近上轨,表明市场处于强势区域,但接近上轨可能面临一定压力。
RSI:中性。RSI6(65.45)接近超买区域,但RSI12(53.72)和RSI14(52.32)仍处于中性区域,表明市场尚未进入极端超买状态。
KDJ:金叉运行中。K(67.73)D(71.00)J(61.21),表明市场短期内有进一步上涨的潜力。
指标数据:
资金费率:0E-8%,表明市场多空情绪较为平衡,没有明显的多空倾向。
成交量变化:近期成交量有所放大,特别是在价格上涨时成交量增加,表明市场参与者对当前价格水平的认可度较高。
资金流数据:合约资金净流入流出数据显示,24小时内资金净流入20688324.75 USDT,表明市场资金流入较多,有利于价格进一步上涨。
分析结果
方向:谨慎做多
入场时机:建议在价格回调至主要支撑位578.663 USDT附近时入场,或者在价格突破主要压力位611.533 USDT时追多。
止损设定:建议止损设在入场价下方3%-5%的位置,即560.707 USDT附近。
目标价位:预期目标价位为644.403 USDT,预期收益率约为5%-10%。
提示:本次分析仅供参考,不构成任何投资建议!
1
272
·
--
#鲍威尔发言
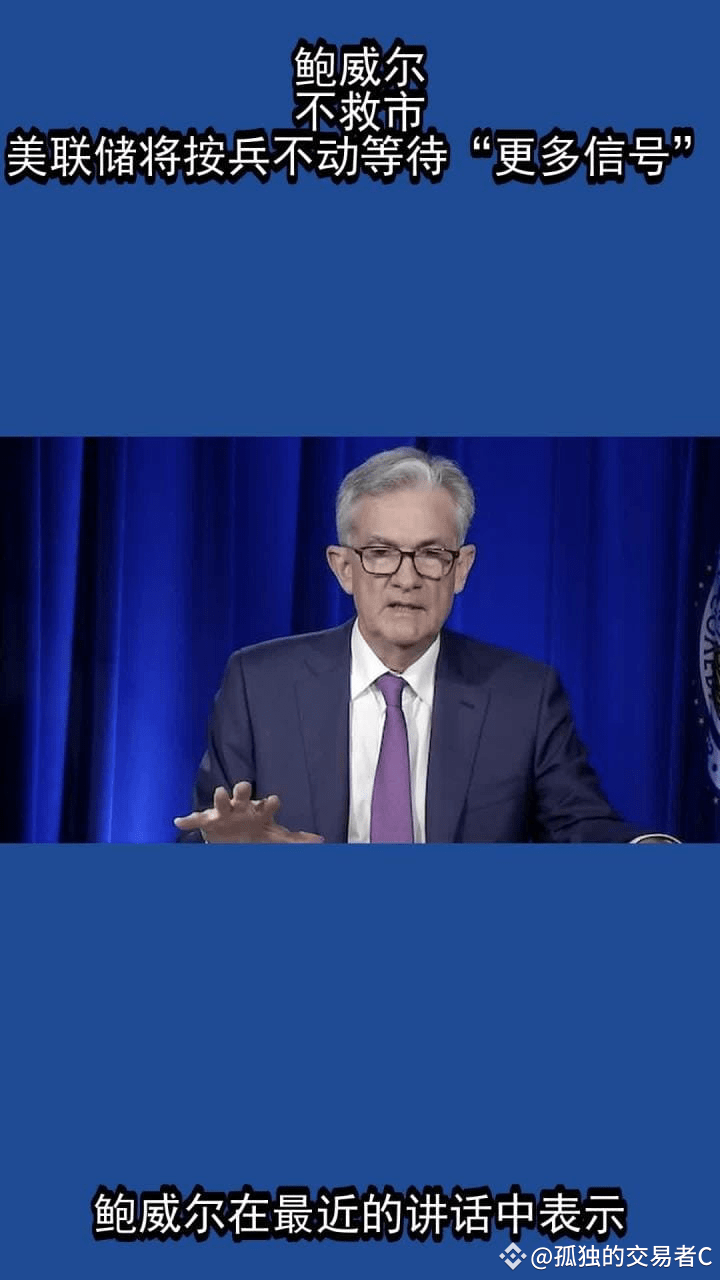
On April 17, 2025, Federal Reserve Chairman Powell delivered a speech at the Chicago Economic Club, the core content is as follows:
1. Policy Stance and Stagflation Risk
Powell clearly stated that the Federal Reserve is not currently considering interest rate cuts or market intervention, denying the existence of a “Federal Reserve put option.” He expressed concerns about “stagflation” for the first time, pointing out that tariff policies may lead to a contradictory situation of rising inflation and slowing economic growth, putting the Federal Reserve's dual mandate (full employment and price stability) goals in conflict.
2. Impact of Tariff Policies
- Inflation Risk: Powell warned that tariffs are “very likely” to push up short-term inflation, and the effects may be more lasting. The University of Michigan’s one-year inflation expectation in the U.S. has soared to 6.7% in April, the highest since 1981.
- Economic Slowdown: The uncertainty of tariff policies may lead to reduced business investment and slowed economic growth. The Federal Reserve will prioritize anchoring long-term inflation expectations to prevent one-time price increases from evolving into sustained inflation.
3. Market Reaction and Interest Rate Expectations
After Powell's speech, market expectations for a rate cut in May fell below 15%, but the probability of a 25 basis point cut in June remains close to 60%. He emphasized the need to wait for the policy impact to become clear before adjusting monetary policy.
4. Independence of the Federal Reserve
In response to rumors of a “leadership change” in the White House, Powell emphasized that the independence of the Federal Reserve is protected by law, and the government has no right to dismiss officials without cause.
5. Other Key Points
- U.S. economic growth in the first quarter may slow, with core PCE inflation expectations raised to 2.8%.
- The Federal Reserve is slowing the pace of balance sheet reduction (QT) to respond to market turbulence.
In summary, Powell's remarks conveyed a hawkish signal, highlighting the Federal Reserve's policy dilemma between inflation and growth. For more specific details, further related reports may be consulted.
#鲍威尔发言
On April 17, 2025, Federal Reserve Chairman Powell delivered a speech at the Chicago Economic Club, the core content is as follows:
1. Policy Stance and Stagflation Risk
Powell clearly stated that the Federal Reserve is not currently considering interest rate cuts or market intervention, denying the existence of a “Federal Reserve put option.” He expressed concerns about “stagflation” for the first time, pointing out that tariff policies may lead to a contradictory situation of rising inflation and slowing economic growth, putting the Federal Reserve's dual mandate (full employment and price stability) goals in conflict.
2. Impact of Tariff Policies
- Inflation Risk: Powell warned that tariffs are “very likely” to push up short-term inflation, and the effects may be more lasting. The University of Michigan’s one-year inflation expectation in the U.S. has soared to 6.7% in April, the highest since 1981.
- Economic Slowdown: The uncertainty of tariff policies may lead to reduced business investment and slowed economic growth. The Federal Reserve will prioritize anchoring long-term inflation expectations to prevent one-time price increases from evolving into sustained inflation.
3. Market Reaction and Interest Rate Expectations
After Powell's speech, market expectations for a rate cut in May fell below 15%, but the probability of a 25 basis point cut in June remains close to 60%. He emphasized the need to wait for the policy impact to become clear before adjusting monetary policy.
4. Independence of the Federal Reserve
In response to rumors of a “leadership change” in the White House, Powell emphasized that the independence of the Federal Reserve is protected by law, and the government has no right to dismiss officials without cause.
5. Other Key Points
- U.S. economic growth in the first quarter may slow, with core PCE inflation expectations raised to 2.8%.
- The Federal Reserve is slowing the pace of balance sheet reduction (QT) to respond to market turbulence.
In summary, Powell's remarks conveyed a hawkish signal, highlighting the Federal Reserve's policy dilemma between inflation and growth. For more specific details, further related reports may be consulted.
On April 17, 2025, Federal Reserve Chairman Powell delivered a speech at the Chicago Economic Club, the core content is as follows:
1. Policy Stance and Stagflation Risk
Powell clearly stated that the Federal Reserve is not currently considering interest rate cuts or market intervention, denying the existence of a “Federal Reserve put option.” He expressed concerns about “stagflation” for the first time, pointing out that tariff policies may lead to a contradictory situation of rising inflation and slowing economic growth, putting the Federal Reserve's dual mandate (full employment and price stability) goals in conflict.
2. Impact of Tariff Policies
- Inflation Risk: Powell warned that tariffs are “very likely” to push up short-term inflation, and the effects may be more lasting. The University of Michigan’s one-year inflation expectation in the U.S. has soared to 6.7% in April, the highest since 1981.
- Economic Slowdown: The uncertainty of tariff policies may lead to reduced business investment and slowed economic growth. The Federal Reserve will prioritize anchoring long-term inflation expectations to prevent one-time price increases from evolving into sustained inflation.
3. Market Reaction and Interest Rate Expectations
After Powell's speech, market expectations for a rate cut in May fell below 15%, but the probability of a 25 basis point cut in June remains close to 60%. He emphasized the need to wait for the policy impact to become clear before adjusting monetary policy.
4. Independence of the Federal Reserve
In response to rumors of a “leadership change” in the White House, Powell emphasized that the independence of the Federal Reserve is protected by law, and the government has no right to dismiss officials without cause.
5. Other Key Points
- U.S. economic growth in the first quarter may slow, with core PCE inflation expectations raised to 2.8%.
- The Federal Reserve is slowing the pace of balance sheet reduction (QT) to respond to market turbulence.
In summary, Powell's remarks conveyed a hawkish signal, highlighting the Federal Reserve's policy dilemma between inflation and growth. For more specific details, further related reports may be consulted.
1
726
·
--
#加拿大推出SolanaETF
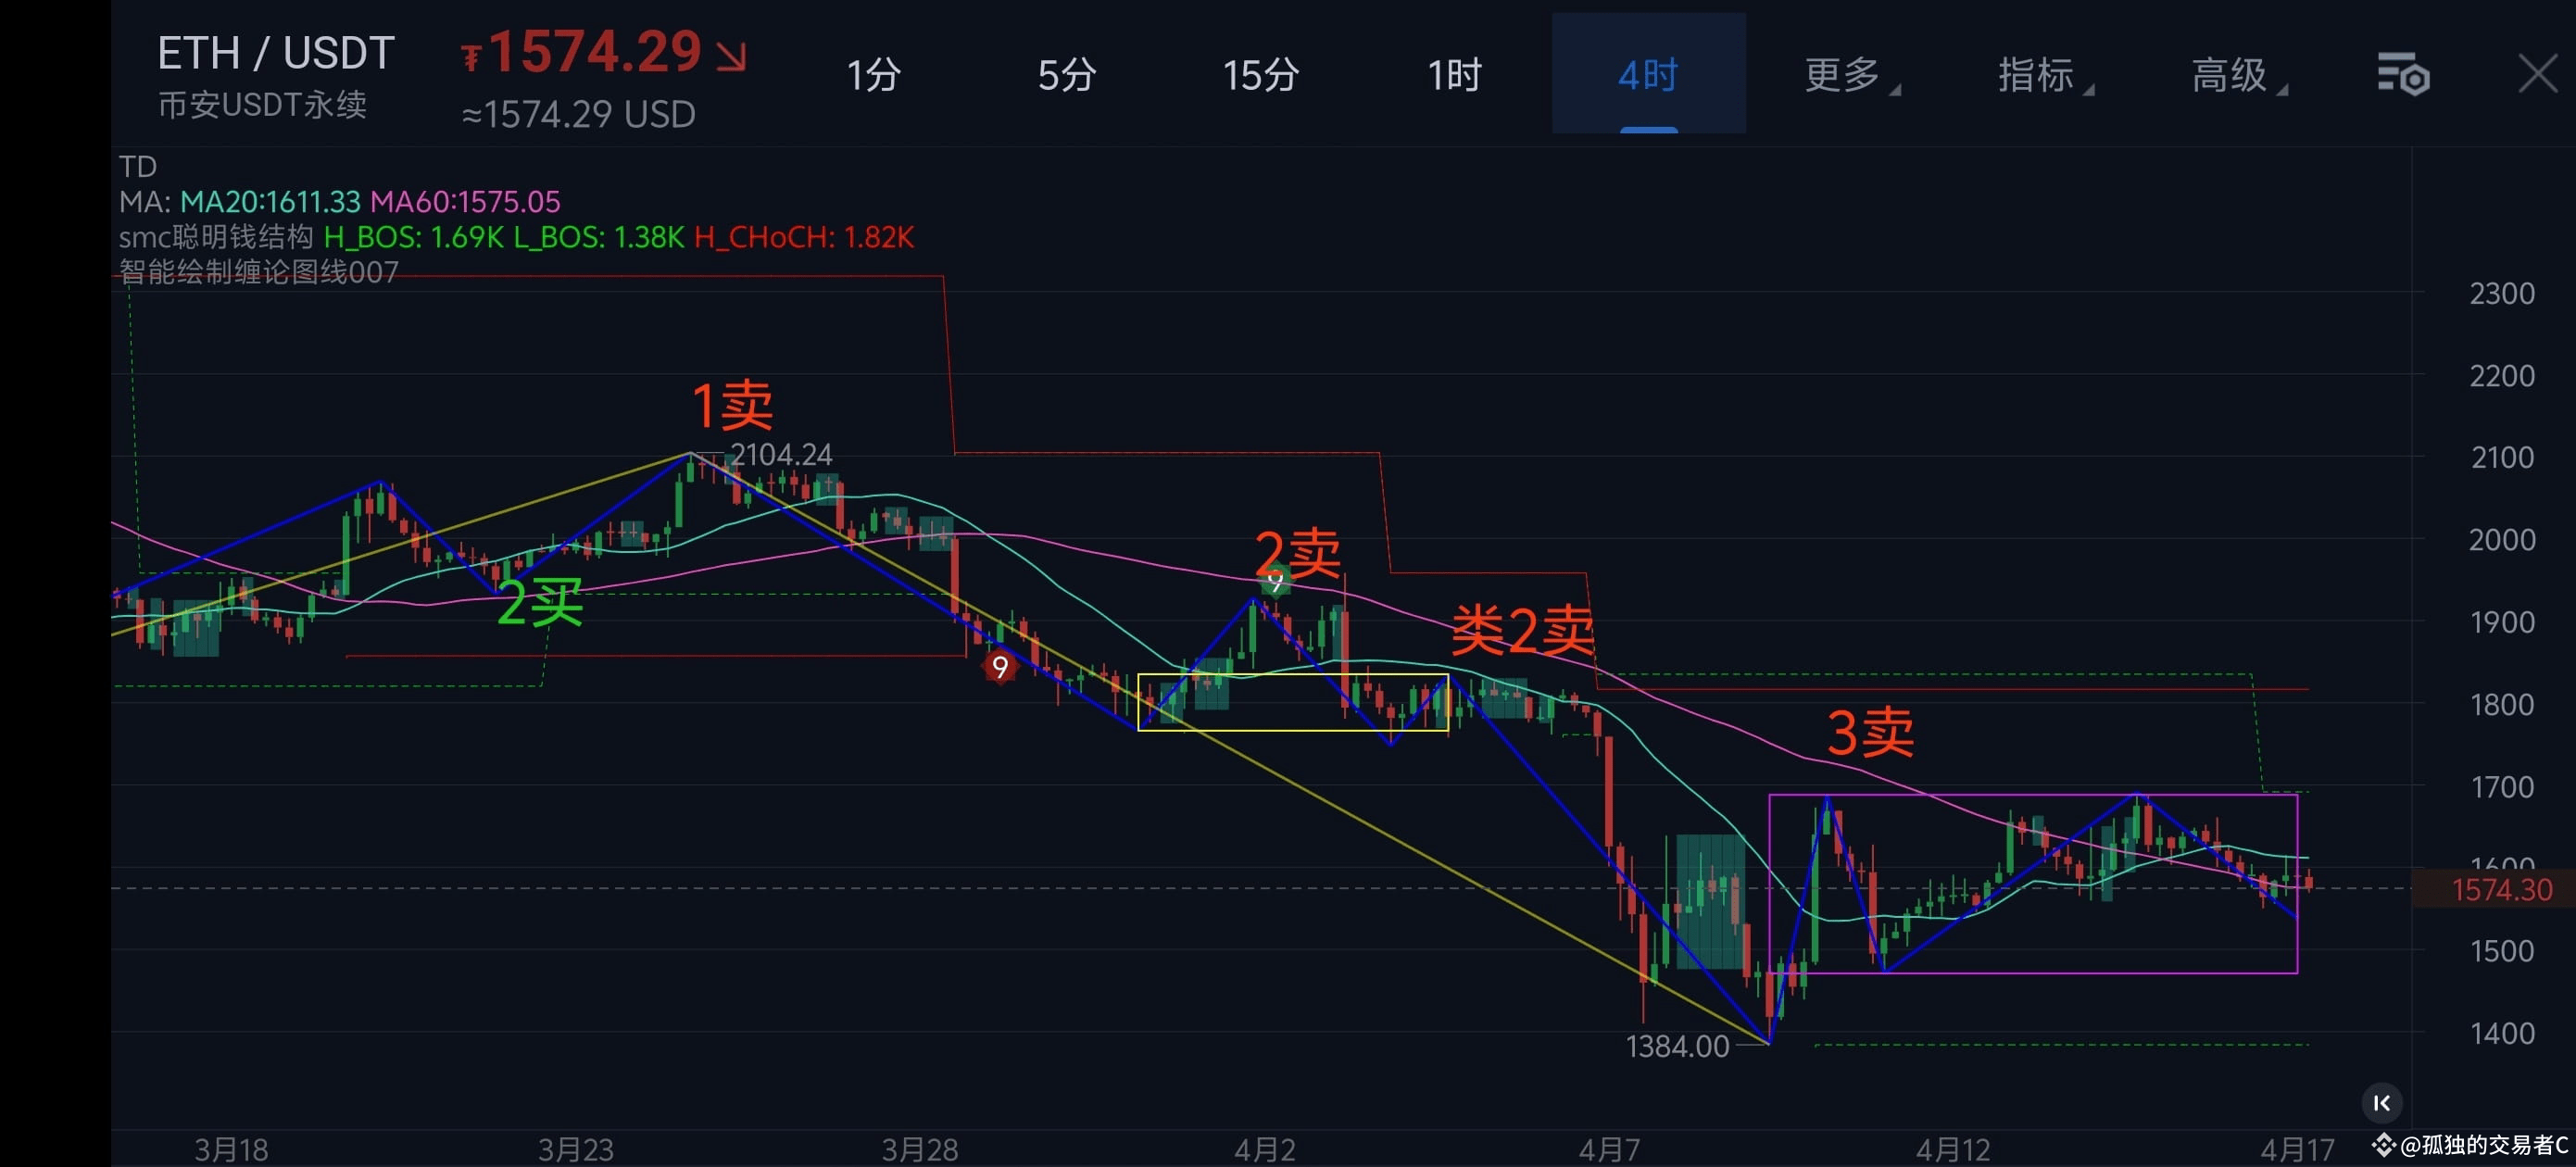
ETHUSDT 1d Market Trend Analysis Report
Current Price: 1572.65 USDT
24-Hour Change: -1.306%
Key Support Level: 1474.67 USDT
Key Resistance Level: 1695.40 USDT
Current Trend: Consolidation with a bearish bias
Detailed Explanation:
Technical Indicators Summary:
Moving Average System: MA5=1607.70, MA10=1581.98, MA20=1694.38, MA120=2621.55. The current price is below MA5 and MA10, and both MA5 and MA10 are below MA20, indicating a bearish arrangement in the short-term moving averages, suggesting a weak short-term trend.
MACD: DIF=-113.12, DEA=-121.94, Histogram=8.82. The MACD is in a death cross state, and both DIF and DEA are in negative territory, indicating weak market momentum and further downside risk in the short term.
BOLL: Upper Band=1959.92, Middle Band=1694.38, Lower Band=1428.84. The current price is located between the middle band and the lower band, and %B=0.30%, indicating that the price is in a weak area and may continue to move toward the lower band in the short term.
RSI: RSI6=42.71, RSI12=40.07, RSI14=39.65, RSI24=38.79. The RSI indicators are in a neutral to slightly lower zone, not entering the oversold area, indicating that there is still downside potential in the market.
KDJ: K=57.56, D=48.33, J=76.02. The KDJ indicators show that the K line and D line are in a neutral zone, with the J line slightly above the K line and D line, indicating a potential slight rebound in the short term, but the overall trend remains weak.
Indicator Data:
Funding Rate: 0.00415500%. The funding rate is in a neutral zone, with no obvious bullish or bearish sentiment, and has limited impact on prices in the short term.
Volume Change: Recent trading volume has shown fluctuations, but overall volume levels are low, indicating low market participation, likely maintaining a bearish consolidation trend in the short term.
Capital Flow Data: The net inflow and outflow of contract funds indicate that there has been significant capital outflow in the short term, suggesting that market capital is withdrawing, and may continue to decline in the short term.
Analysis Result
Direction: Cautiously Short
Entry Timing: It is recommended to enter short when the price rebounds to around 1600 USDT, confirming with the resistance levels of MA5 and MA10.
Stop Loss Setting: Set the stop loss at 1650 USDT, approximately a 3% stop loss ratio.
Target Price: Set the target price at 1474.67 USDT, with an expected return of about 8%.
Note: This analysis is for reference only and does not constitute any investment advice!
#加拿大推出SolanaETF
ETHUSDT 1d Market Trend Analysis Report
Current Price: 1572.65 USDT
24-Hour Change: -1.306%
Key Support Level: 1474.67 USDT
Key Resistance Level: 1695.40 USDT
Current Trend: Consolidation with a bearish bias
Detailed Explanation:
Technical Indicators Summary:
Moving Average System: MA5=1607.70, MA10=1581.98, MA20=1694.38, MA120=2621.55. The current price is below MA5 and MA10, and both MA5 and MA10 are below MA20, indicating a bearish arrangement in the short-term moving averages, suggesting a weak short-term trend.
MACD: DIF=-113.12, DEA=-121.94, Histogram=8.82. The MACD is in a death cross state, and both DIF and DEA are in negative territory, indicating weak market momentum and further downside risk in the short term.
BOLL: Upper Band=1959.92, Middle Band=1694.38, Lower Band=1428.84. The current price is located between the middle band and the lower band, and %B=0.30%, indicating that the price is in a weak area and may continue to move toward the lower band in the short term.
RSI: RSI6=42.71, RSI12=40.07, RSI14=39.65, RSI24=38.79. The RSI indicators are in a neutral to slightly lower zone, not entering the oversold area, indicating that there is still downside potential in the market.
KDJ: K=57.56, D=48.33, J=76.02. The KDJ indicators show that the K line and D line are in a neutral zone, with the J line slightly above the K line and D line, indicating a potential slight rebound in the short term, but the overall trend remains weak.
Indicator Data:
Funding Rate: 0.00415500%. The funding rate is in a neutral zone, with no obvious bullish or bearish sentiment, and has limited impact on prices in the short term.
Volume Change: Recent trading volume has shown fluctuations, but overall volume levels are low, indicating low market participation, likely maintaining a bearish consolidation trend in the short term.
Capital Flow Data: The net inflow and outflow of contract funds indicate that there has been significant capital outflow in the short term, suggesting that market capital is withdrawing, and may continue to decline in the short term.
Analysis Result
Direction: Cautiously Short
Entry Timing: It is recommended to enter short when the price rebounds to around 1600 USDT, confirming with the resistance levels of MA5 and MA10.
Stop Loss Setting: Set the stop loss at 1650 USDT, approximately a 3% stop loss ratio.
Target Price: Set the target price at 1474.67 USDT, with an expected return of about 8%.
Note: This analysis is for reference only and does not constitute any investment advice!
ETHUSDT 1d Market Trend Analysis Report
Current Price: 1572.65 USDT
24-Hour Change: -1.306%
Key Support Level: 1474.67 USDT
Key Resistance Level: 1695.40 USDT
Current Trend: Consolidation with a bearish bias
Detailed Explanation:
Technical Indicators Summary:
Moving Average System: MA5=1607.70, MA10=1581.98, MA20=1694.38, MA120=2621.55. The current price is below MA5 and MA10, and both MA5 and MA10 are below MA20, indicating a bearish arrangement in the short-term moving averages, suggesting a weak short-term trend.
MACD: DIF=-113.12, DEA=-121.94, Histogram=8.82. The MACD is in a death cross state, and both DIF and DEA are in negative territory, indicating weak market momentum and further downside risk in the short term.
BOLL: Upper Band=1959.92, Middle Band=1694.38, Lower Band=1428.84. The current price is located between the middle band and the lower band, and %B=0.30%, indicating that the price is in a weak area and may continue to move toward the lower band in the short term.
RSI: RSI6=42.71, RSI12=40.07, RSI14=39.65, RSI24=38.79. The RSI indicators are in a neutral to slightly lower zone, not entering the oversold area, indicating that there is still downside potential in the market.
KDJ: K=57.56, D=48.33, J=76.02. The KDJ indicators show that the K line and D line are in a neutral zone, with the J line slightly above the K line and D line, indicating a potential slight rebound in the short term, but the overall trend remains weak.
Indicator Data:
Funding Rate: 0.00415500%. The funding rate is in a neutral zone, with no obvious bullish or bearish sentiment, and has limited impact on prices in the short term.
Volume Change: Recent trading volume has shown fluctuations, but overall volume levels are low, indicating low market participation, likely maintaining a bearish consolidation trend in the short term.
Capital Flow Data: The net inflow and outflow of contract funds indicate that there has been significant capital outflow in the short term, suggesting that market capital is withdrawing, and may continue to decline in the short term.
Analysis Result
Direction: Cautiously Short
Entry Timing: It is recommended to enter short when the price rebounds to around 1600 USDT, confirming with the resistance levels of MA5 and MA10.
Stop Loss Setting: Set the stop loss at 1650 USDT, approximately a 3% stop loss ratio.
Target Price: Set the target price at 1474.67 USDT, with an expected return of about 8%.
Note: This analysis is for reference only and does not constitute any investment advice!
643
·
--
$SOL
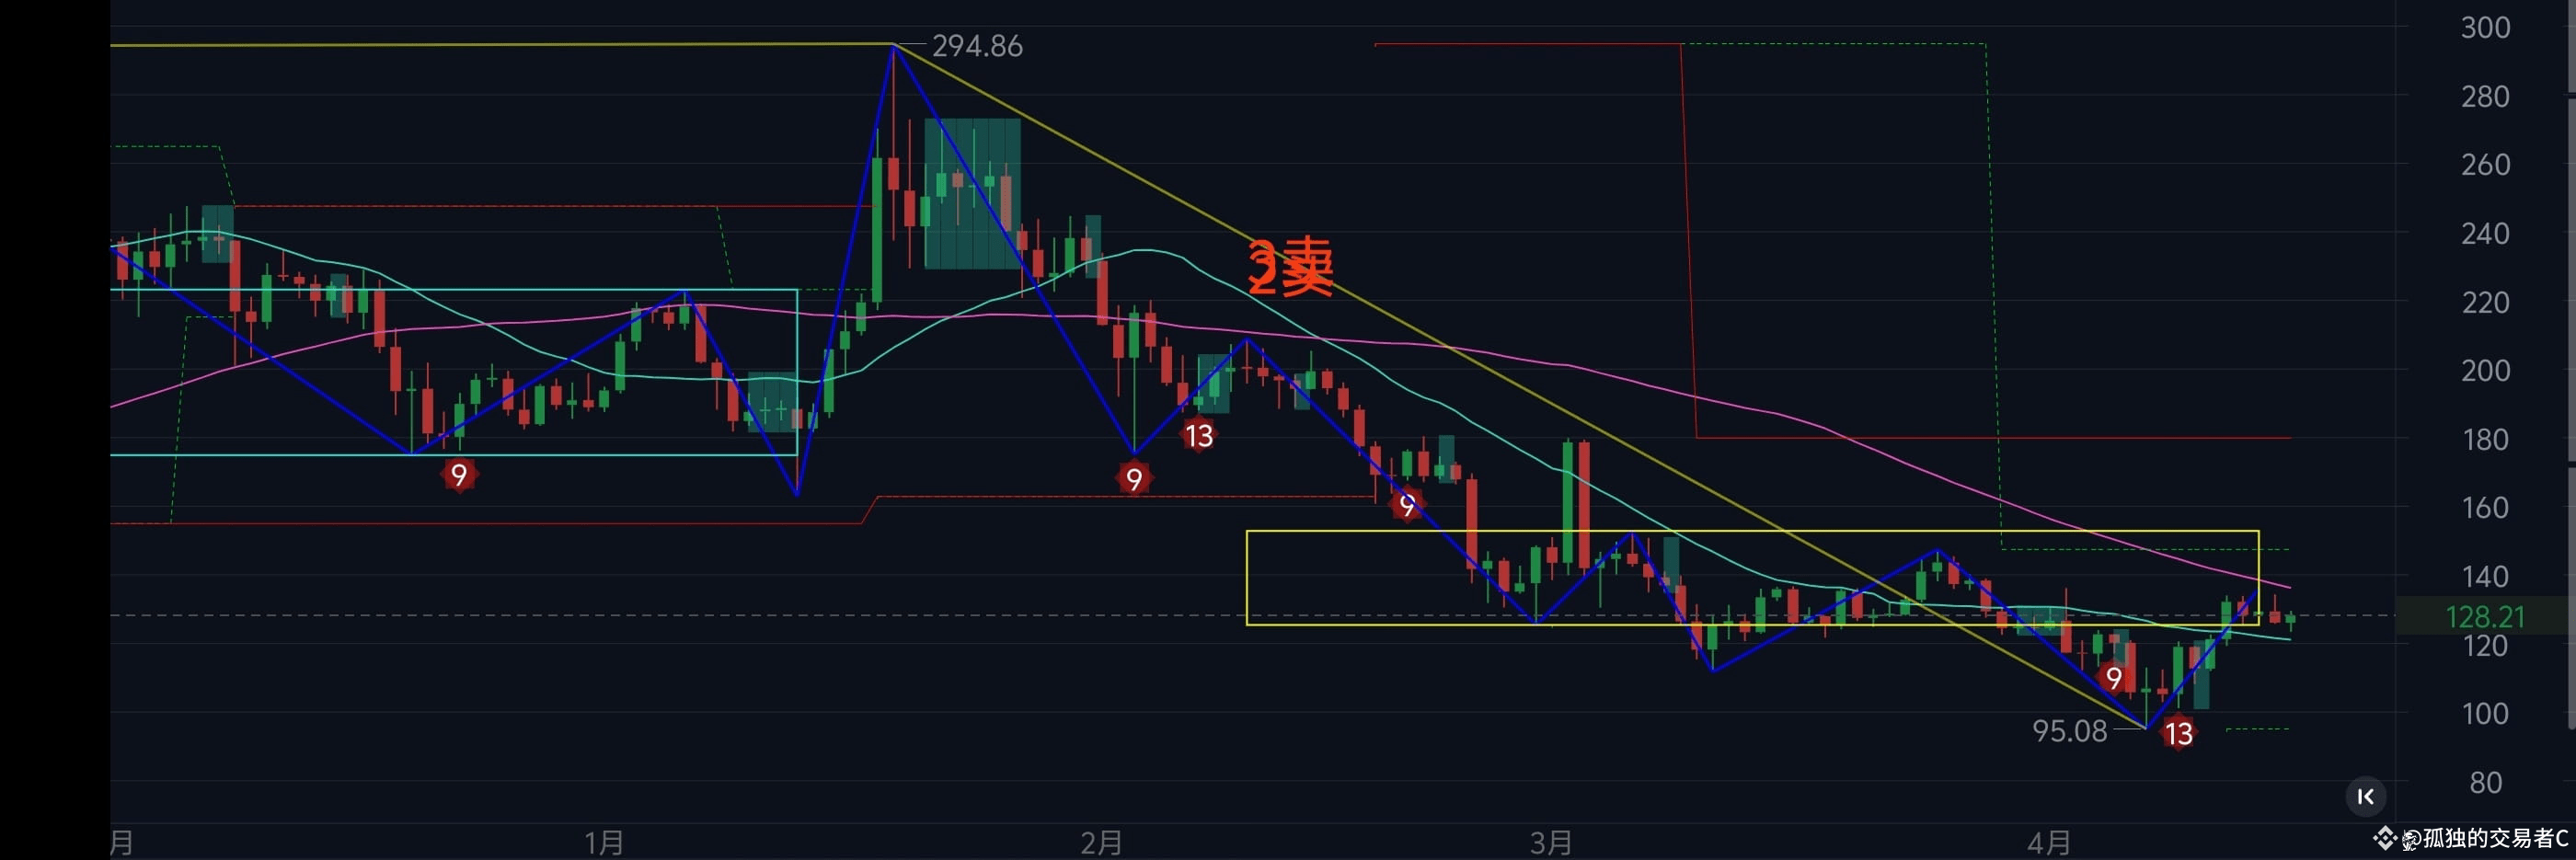
SOLUSDT 1d
Preço atual: 128.3500 USDT
Variação em 24 horas: -0.926%
Principais níveis de suporte: 110.6700 USDT
Principais níveis de resistência: 138.5500 USDT
Tendência atual: Lateralizada para alta
Explicação detalhada:
Indicadores técnicos:
Sistema de médias móveis: MA5 (128.3400) ligeiramente acima do preço atual, MA10 (120.7000) e MA20 (120.9960) estão abaixo do preço atual, mostrando suporte nas médias de curto prazo, mas a média de longo prazo MA120 (172.4776) está bem acima do preço atual, indicando que a tendência de longo prazo ainda é de queda. De maneira geral, o sistema de médias móveis apresenta um arranjo lateralizado para alta.
MACD: DIF (-1.9992) e DEA (-4.2459) estão na zona negativa, mas o histograma (2.2466) é positivo, indicando que o MACD está em estado de cruzamento positivo, podendo haver impulso de alta a curto prazo.
BOLL: O preço atual está entre a linha média (120.9960) e a linha superior (136.5879), %B (0.66%) mostra que o preço está próximo da linha superior, indicando que pode haver espaço para alta a curto prazo, mas é preciso estar atento à pressão da linha superior.
RSI: RSI6 (55.23), RSI12 (51.19), RSI14 (50.09) estão todos na zona neutra, sem sinais de sobrecompra ou sobrevenda, indicando que o sentimento do mercado está relativamente equilibrado.
KDJ: K (74.63), D (70.23), J (83.44) estão todos em níveis elevados, mostrando que pode haver pressão de correção a curto prazo, mas ainda está em tendência de alta.
Dados dos indicadores:
Taxa de financiamento: -0.00222300%, indicando que o sentimento do mercado entre compradores e vendedores está relativamente equilibrado, sem sinais claros de venda ou compra.
Variação no volume: O volume recente aumentou, especialmente quando o preço subiu, mostrando o reconhecimento dos participantes do mercado em relação à tendência de alta.
Dados de fluxo de capital: O fluxo de entrada e saída líquida de contratos tem flutuado bastante recentemente, mas o fluxo líquido de capital em spot é relativamente estável, indicando um forte suporte do mercado para o spot.
Resultados da análise
Direção: Cautelosamente comprador
Momento de entrada: O preço atual está próximo da linha superior do BOLL, recomenda-se entrar quando o preço corrigir para cerca de 125.0000 USDT.
Definição de stop loss: O nível de stop loss está definido em 120.0000 USDT, com uma proporção de stop loss de cerca de 3.5%.
Preço alvo: O preço alvo está definido em 138.5500 USDT, com uma expectativa de retorno de cerca de 7.5%.
Aviso: Esta análise é apenas para referência e não constitui qualquer recomendação de investimento!
{spot}(SOLUSDT)
$SOL
SOLUSDT 1d
Preço atual: 128.3500 USDT
Variação em 24 horas: -0.926%
Principais níveis de suporte: 110.6700 USDT
Principais níveis de resistência: 138.5500 USDT
Tendência atual: Lateralizada para alta
Explicação detalhada:
Indicadores técnicos:
Sistema de médias móveis: MA5 (128.3400) ligeiramente acima do preço atual, MA10 (120.7000) e MA20 (120.9960) estão abaixo do preço atual, mostrando suporte nas médias de curto prazo, mas a média de longo prazo MA120 (172.4776) está bem acima do preço atual, indicando que a tendência de longo prazo ainda é de queda. De maneira geral, o sistema de médias móveis apresenta um arranjo lateralizado para alta.
MACD: DIF (-1.9992) e DEA (-4.2459) estão na zona negativa, mas o histograma (2.2466) é positivo, indicando que o MACD está em estado de cruzamento positivo, podendo haver impulso de alta a curto prazo.
BOLL: O preço atual está entre a linha média (120.9960) e a linha superior (136.5879), %B (0.66%) mostra que o preço está próximo da linha superior, indicando que pode haver espaço para alta a curto prazo, mas é preciso estar atento à pressão da linha superior.
RSI: RSI6 (55.23), RSI12 (51.19), RSI14 (50.09) estão todos na zona neutra, sem sinais de sobrecompra ou sobrevenda, indicando que o sentimento do mercado está relativamente equilibrado.
KDJ: K (74.63), D (70.23), J (83.44) estão todos em níveis elevados, mostrando que pode haver pressão de correção a curto prazo, mas ainda está em tendência de alta.
Dados dos indicadores:
Taxa de financiamento: -0.00222300%, indicando que o sentimento do mercado entre compradores e vendedores está relativamente equilibrado, sem sinais claros de venda ou compra.
Variação no volume: O volume recente aumentou, especialmente quando o preço subiu, mostrando o reconhecimento dos participantes do mercado em relação à tendência de alta.
Dados de fluxo de capital: O fluxo de entrada e saída líquida de contratos tem flutuado bastante recentemente, mas o fluxo líquido de capital em spot é relativamente estável, indicando um forte suporte do mercado para o spot.
Resultados da análise
Direção: Cautelosamente comprador
Momento de entrada: O preço atual está próximo da linha superior do BOLL, recomenda-se entrar quando o preço corrigir para cerca de 125.0000 USDT.
Definição de stop loss: O nível de stop loss está definido em 120.0000 USDT, com uma proporção de stop loss de cerca de 3.5%.
Preço alvo: O preço alvo está definido em 138.5500 USDT, com uma expectativa de retorno de cerca de 7.5%.
Aviso: Esta análise é apenas para referência e não constitui qualquer recomendação de investimento!
SOLUSDT 1d
Preço atual: 128.3500 USDT
Variação em 24 horas: -0.926%
Principais níveis de suporte: 110.6700 USDT
Principais níveis de resistência: 138.5500 USDT
Tendência atual: Lateralizada para alta
Explicação detalhada:
Indicadores técnicos:
Sistema de médias móveis: MA5 (128.3400) ligeiramente acima do preço atual, MA10 (120.7000) e MA20 (120.9960) estão abaixo do preço atual, mostrando suporte nas médias de curto prazo, mas a média de longo prazo MA120 (172.4776) está bem acima do preço atual, indicando que a tendência de longo prazo ainda é de queda. De maneira geral, o sistema de médias móveis apresenta um arranjo lateralizado para alta.
MACD: DIF (-1.9992) e DEA (-4.2459) estão na zona negativa, mas o histograma (2.2466) é positivo, indicando que o MACD está em estado de cruzamento positivo, podendo haver impulso de alta a curto prazo.
BOLL: O preço atual está entre a linha média (120.9960) e a linha superior (136.5879), %B (0.66%) mostra que o preço está próximo da linha superior, indicando que pode haver espaço para alta a curto prazo, mas é preciso estar atento à pressão da linha superior.
RSI: RSI6 (55.23), RSI12 (51.19), RSI14 (50.09) estão todos na zona neutra, sem sinais de sobrecompra ou sobrevenda, indicando que o sentimento do mercado está relativamente equilibrado.
KDJ: K (74.63), D (70.23), J (83.44) estão todos em níveis elevados, mostrando que pode haver pressão de correção a curto prazo, mas ainda está em tendência de alta.
Dados dos indicadores:
Taxa de financiamento: -0.00222300%, indicando que o sentimento do mercado entre compradores e vendedores está relativamente equilibrado, sem sinais claros de venda ou compra.
Variação no volume: O volume recente aumentou, especialmente quando o preço subiu, mostrando o reconhecimento dos participantes do mercado em relação à tendência de alta.
Dados de fluxo de capital: O fluxo de entrada e saída líquida de contratos tem flutuado bastante recentemente, mas o fluxo líquido de capital em spot é relativamente estável, indicando um forte suporte do mercado para o spot.
Resultados da análise
Direção: Cautelosamente comprador
Momento de entrada: O preço atual está próximo da linha superior do BOLL, recomenda-se entrar quando o preço corrigir para cerca de 125.0000 USDT.
Definição de stop loss: O nível de stop loss está definido em 120.0000 USDT, com uma proporção de stop loss de cerca de 3.5%.
Preço alvo: O preço alvo está definido em 138.5500 USDT, com uma expectativa de retorno de cerca de 7.5%.
Aviso: Esta análise é apenas para referência e não constitui qualquer recomendação de investimento!
1
1.2k
·
--
#保持SAFU
BTCUSDT 15m Análise de Tendências de Mercado
$BTC
{spot}(BTCUSDT)
Preço Atual: 85454.60 USDT
Variação em 24 Horas: 0.585%
Principais Níveis de Suporte: 85269.33 USDT
Principais Níveis de Resistência: 85677.73 USDT
Tendência Atual: Oscilação Levemente Alta
Explicação Detalhada:
Indicadores Técnicos Combinados:
Sistema de Médias: MA5 atual=85519.84, MA10=85541.30, MA20=85672.13, as médias apresentam uma configuração de alta, mas MA5 e MA10 estão próximas, indicando a possibilidade de oscilações a curto prazo.
MACD: DIF=13.11, DEA=61.70, Coluna=-48.59, o MACD está em estado de cruzamento negativo, mas o gráfico de colunas está começando a se reduzir, mostrando que a energia de venda está diminuindo.
BOLL: Banda Superior=85980.43, Banda Média=85672.13, Banda Inferior=85363.83, o preço atualmente oscila próximo à banda média, %B=0.14%, indicando que o preço está em uma posição baixa, com possibilidade de recuperação.
RSI: RSI6=38.71, RSI12=44.94, RSI14=46.43, RSI24=50.55, o RSI está em uma área neutra, sem sinais claros de sobrecompra ou sobrevenda.
KDJ: K=33.97, D=35.11, J=31.67, o KDJ está em estado de cruzamento negativo, mas o valor J é relativamente baixo, mostrando a possibilidade de recuperação.
Dados dos Indicadores:
Taxa de Financiamento: 0.00723900%, a taxa de financiamento está em uma área neutra, sem emoções de compra ou venda claras.
Variação no Volume: O volume de negociação recente aumentou, mostrando um aumento na atividade do mercado, com boa combinação entre volume e preço.
Dados de Fluxo de Capital: Os dados recentes de fluxo líquido de capital em contratos mostram uma saída significativa de capital, mas a entrada de capital em spot aumentou, indicando um aquecimento do sentimento do mercado.
Resultados da Análise
Direção: Cautelosamente Longo
Momento de Entrada: Quando o preço recuar para cerca de 85269.33 USDT, pode-se considerar entrar em uma posição longa.
Configuração de Stop Loss: Stop Loss definido em 84769.33 USDT (aproximadamente 3% de taxa de stop loss).
Preço Alvo: Preço alvo definido em 89500.00 USDT (aproximadamente 5% de retorno).
Dica: Esta análise é apenas para referência e não constitui qualquer recomendação de investimento!
#保持SAFU
BTCUSDT 15m Análise de Tendências de Mercado
$BTC
Preço Atual: 85454.60 USDT
Variação em 24 Horas: 0.585%
Principais Níveis de Suporte: 85269.33 USDT
Principais Níveis de Resistência: 85677.73 USDT
Tendência Atual: Oscilação Levemente Alta
Explicação Detalhada:
Indicadores Técnicos Combinados:
Sistema de Médias: MA5 atual=85519.84, MA10=85541.30, MA20=85672.13, as médias apresentam uma configuração de alta, mas MA5 e MA10 estão próximas, indicando a possibilidade de oscilações a curto prazo.
MACD: DIF=13.11, DEA=61.70, Coluna=-48.59, o MACD está em estado de cruzamento negativo, mas o gráfico de colunas está começando a se reduzir, mostrando que a energia de venda está diminuindo.
BOLL: Banda Superior=85980.43, Banda Média=85672.13, Banda Inferior=85363.83, o preço atualmente oscila próximo à banda média, %B=0.14%, indicando que o preço está em uma posição baixa, com possibilidade de recuperação.
RSI: RSI6=38.71, RSI12=44.94, RSI14=46.43, RSI24=50.55, o RSI está em uma área neutra, sem sinais claros de sobrecompra ou sobrevenda.
KDJ: K=33.97, D=35.11, J=31.67, o KDJ está em estado de cruzamento negativo, mas o valor J é relativamente baixo, mostrando a possibilidade de recuperação.
Dados dos Indicadores:
Taxa de Financiamento: 0.00723900%, a taxa de financiamento está em uma área neutra, sem emoções de compra ou venda claras.
Variação no Volume: O volume de negociação recente aumentou, mostrando um aumento na atividade do mercado, com boa combinação entre volume e preço.
Dados de Fluxo de Capital: Os dados recentes de fluxo líquido de capital em contratos mostram uma saída significativa de capital, mas a entrada de capital em spot aumentou, indicando um aquecimento do sentimento do mercado.
Resultados da Análise
Direção: Cautelosamente Longo
Momento de Entrada: Quando o preço recuar para cerca de 85269.33 USDT, pode-se considerar entrar em uma posição longa.
Configuração de Stop Loss: Stop Loss definido em 84769.33 USDT (aproximadamente 3% de taxa de stop loss).
Preço Alvo: Preço alvo definido em 89500.00 USDT (aproximadamente 5% de retorno).
Dica: Esta análise é apenas para referência e não constitui qualquer recomendação de investimento!
BTCUSDT 15m Análise de Tendências de Mercado
$BTC
Preço Atual: 85454.60 USDT
Variação em 24 Horas: 0.585%
Principais Níveis de Suporte: 85269.33 USDT
Principais Níveis de Resistência: 85677.73 USDT
Tendência Atual: Oscilação Levemente Alta
Explicação Detalhada:
Indicadores Técnicos Combinados:
Sistema de Médias: MA5 atual=85519.84, MA10=85541.30, MA20=85672.13, as médias apresentam uma configuração de alta, mas MA5 e MA10 estão próximas, indicando a possibilidade de oscilações a curto prazo.
MACD: DIF=13.11, DEA=61.70, Coluna=-48.59, o MACD está em estado de cruzamento negativo, mas o gráfico de colunas está começando a se reduzir, mostrando que a energia de venda está diminuindo.
BOLL: Banda Superior=85980.43, Banda Média=85672.13, Banda Inferior=85363.83, o preço atualmente oscila próximo à banda média, %B=0.14%, indicando que o preço está em uma posição baixa, com possibilidade de recuperação.
RSI: RSI6=38.71, RSI12=44.94, RSI14=46.43, RSI24=50.55, o RSI está em uma área neutra, sem sinais claros de sobrecompra ou sobrevenda.
KDJ: K=33.97, D=35.11, J=31.67, o KDJ está em estado de cruzamento negativo, mas o valor J é relativamente baixo, mostrando a possibilidade de recuperação.
Dados dos Indicadores:
Taxa de Financiamento: 0.00723900%, a taxa de financiamento está em uma área neutra, sem emoções de compra ou venda claras.
Variação no Volume: O volume de negociação recente aumentou, mostrando um aumento na atividade do mercado, com boa combinação entre volume e preço.
Dados de Fluxo de Capital: Os dados recentes de fluxo líquido de capital em contratos mostram uma saída significativa de capital, mas a entrada de capital em spot aumentou, indicando um aquecimento do sentimento do mercado.
Resultados da Análise
Direção: Cautelosamente Longo
Momento de Entrada: Quando o preço recuar para cerca de 85269.33 USDT, pode-se considerar entrar em uma posição longa.
Configuração de Stop Loss: Stop Loss definido em 84769.33 USDT (aproximadamente 3% de taxa de stop loss).
Preço Alvo: Preço alvo definido em 89500.00 USDT (aproximadamente 5% de retorno).
Dica: Esta análise é apenas para referência e não constitui qualquer recomendação de investimento!
448
·
--

Artigo
币安广场最新羊毛!ListaLending借贷教程
ListaLending是一款在BNBChain生态系统中提供创新借贷服务的平台,为用户提供了便捷、高效的借贷体验。以下是一份详细的ListaLending借贷教程,帮助你了解如何在ListaLending平台上进行借贷操作。
一、准备工作
(一)注册BNBChain钱包
在进行任何借贷操作之前,你需要拥有一个BNBChain钱包。你可以选择使用官方推荐的钱包应用程序,如Trust Wallet、MetaMask等,并按照其指引完成钱包的注册和设置。确保妥善保管好你的钱包私钥或助记词,这是访问和管理你钱包资产的关键。
币安广场最新羊毛!
ListaLending借贷教程
ListaLending是一款在BNBChain生态系统中提供创新借贷服务的平台,为用户提供了便捷、高效的借贷体验。以下是一份详细的ListaLending借贷教程,帮助你了解如何在ListaLending平台上进行借贷操作。
一、准备工作
(一)注册BNBChain钱包
在进行任何借贷操作之前,你需要拥有一个BNBChain钱包。你可以选择使用官方推荐的钱包应用程序,如Trust Wallet、MetaMask等,并按照其指引完成钱包的注册和设置。确保妥善保管好你的钱包私钥或助记词,这是访问和管理你钱包资产的关键。
ListaLending是一款在BNBChain生态系统中提供创新借贷服务的平台,为用户提供了便捷、高效的借贷体验。以下是一份详细的ListaLending借贷教程,帮助你了解如何在ListaLending平台上进行借贷操作。
一、准备工作
(一)注册BNBChain钱包
在进行任何借贷操作之前,你需要拥有一个BNBChain钱包。你可以选择使用官方推荐的钱包应用程序,如Trust Wallet、MetaMask等,并按照其指引完成钱包的注册和设置。确保妥善保管好你的钱包私钥或助记词,这是访问和管理你钱包资产的关键。
1
174
·
--
Tema do 24º Concurso de Redação: #Inovação da ListaLending
Empréstimos na BNBChain#Vaulta
Inovação da ListaLending: Uma nova jornada de empréstimos na BNBChain
Na era em que as finanças descentralizadas (DeFi) estão se desenvolvendo rapidamente, os empréstimos, como um dos pilares centrais, estão passando por inovações e transformações constantes. A ListaLending se destaca no ecossistema da BNBChain, trazendo uma nova experiência de empréstimo e um potencial infinito, liderando uma nova tendência na área de empréstimos.
Um, o contexto de nascimento da ListaLending
Com a rápida expansão da indústria DeFi, a demanda dos usuários por serviços de empréstimos está se tornando cada vez mais diversificada e refinada. Os modelos de empréstimo tradicionais apresentam muitos pontos problemáticos, como altos custos de confiança, processos operacionais complicados e baixa taxa de utilização de fundos. A BNBChain, como uma plataforma de blockchain de alto desempenho e com baixas taxas de transação, oferece um solo fértil para inovações financeiras. A ListaLending surgiu nesse contexto, visando aproveitar as vantagens da BNBChain para construir um ecossistema de empréstimos mais eficiente, seguro e transparente.
Tema do 24º Concurso de Redação: #Inovação da ListaLending Empréstimos na BNBChain
#Vaulta
Inovação da ListaLending: Uma nova jornada de empréstimos na BNBChain
Na era em que as finanças descentralizadas (DeFi) estão se desenvolvendo rapidamente, os empréstimos, como um dos pilares centrais, estão passando por inovações e transformações constantes. A ListaLending se destaca no ecossistema da BNBChain, trazendo uma nova experiência de empréstimo e um potencial infinito, liderando uma nova tendência na área de empréstimos.
Um, o contexto de nascimento da ListaLending
Com a rápida expansão da indústria DeFi, a demanda dos usuários por serviços de empréstimos está se tornando cada vez mais diversificada e refinada. Os modelos de empréstimo tradicionais apresentam muitos pontos problemáticos, como altos custos de confiança, processos operacionais complicados e baixa taxa de utilização de fundos. A BNBChain, como uma plataforma de blockchain de alto desempenho e com baixas taxas de transação, oferece um solo fértil para inovações financeiras. A ListaLending surgiu nesse contexto, visando aproveitar as vantagens da BNBChain para construir um ecossistema de empréstimos mais eficiente, seguro e transparente.
Inovação da ListaLending: Uma nova jornada de empréstimos na BNBChain
Na era em que as finanças descentralizadas (DeFi) estão se desenvolvendo rapidamente, os empréstimos, como um dos pilares centrais, estão passando por inovações e transformações constantes. A ListaLending se destaca no ecossistema da BNBChain, trazendo uma nova experiência de empréstimo e um potencial infinito, liderando uma nova tendência na área de empréstimos.
Um, o contexto de nascimento da ListaLending
Com a rápida expansão da indústria DeFi, a demanda dos usuários por serviços de empréstimos está se tornando cada vez mais diversificada e refinada. Os modelos de empréstimo tradicionais apresentam muitos pontos problemáticos, como altos custos de confiança, processos operacionais complicados e baixa taxa de utilização de fundos. A BNBChain, como uma plataforma de blockchain de alto desempenho e com baixas taxas de transação, oferece um solo fértil para inovações financeiras. A ListaLending surgiu nesse contexto, visando aproveitar as vantagens da BNBChain para construir um ecossistema de empréstimos mais eficiente, seguro e transparente.
235
·
--
$ETH
ETHUSDT 4h行情走势分析报告
当前价格:1558.43 USDT
24小时涨跌:2.213%
主要支撑位:1516.25 USDT
主要压力位:1603.50 USDT
当前趋势:震荡偏多
详细解释:
技术指标综合:
均线系统:MA5=1563.94,MA10=1544.56,MA20=1543.61,MA120=1804.39。均线系统呈现多头排列,短期均线在中期均线之上,显示出一定的上升趋势。
MACD:DIF=-13.56,DEA=-22.95,柱=9.40。MACD柱状图在零轴上方,显示出多头力量正在增强。
BOLL:上轨=1667.85,中轨=1543.62,下轨=1419.38。当前价格位于中轨和上轨之间,显示出市场处于震荡偏多的状态。
RSI:RSI6=56.35,RSI12=50.14,RSI14=49.02,RSI24=45.87。RSI指标处于中性区域,没有明显的超买或超卖信号。
KDJ:K=62.77,D=53.85,J=80.61。KDJ指标显示K线和J线在D线之上,显示出多头力量较强。
指标数据:
资金费率:0.00275200%。资金费率处于正常范围内,没有明显的多空情绪。
成交量变化:24小时成交量为6247815.080,显示出市场活跃度较高。近期成交量有所增加,显示出市场参与者增多。
资金流数据:24小时合约资金净流入为726427816.12 USDT,显示出多头资金正在流入市场。
分析结果
方向:谨慎做多
入场时机:建议在价格回调至1550 USDT附近时入场,或者在价格突破1603.50 USDT时追多。
止损设定:建议设置在1516.25 USDT下方,止损比例约为3%。
目标价位:预期目标价位为1640.82 USDT,预期收益率约为5%。
提示:本次分析仅供参考,不构成任何投资建议!
$ETH
ETHUSDT 4h行情走势分析报告
当前价格:1558.43 USDT
24小时涨跌:2.213%
主要支撑位:1516.25 USDT
主要压力位:1603.50 USDT
当前趋势:震荡偏多
详细解释:
技术指标综合:
均线系统:MA5=1563.94,MA10=1544.56,MA20=1543.61,MA120=1804.39。均线系统呈现多头排列,短期均线在中期均线之上,显示出一定的上升趋势。
MACD:DIF=-13.56,DEA=-22.95,柱=9.40。MACD柱状图在零轴上方,显示出多头力量正在增强。
BOLL:上轨=1667.85,中轨=1543.62,下轨=1419.38。当前价格位于中轨和上轨之间,显示出市场处于震荡偏多的状态。
RSI:RSI6=56.35,RSI12=50.14,RSI14=49.02,RSI24=45.87。RSI指标处于中性区域,没有明显的超买或超卖信号。
KDJ:K=62.77,D=53.85,J=80.61。KDJ指标显示K线和J线在D线之上,显示出多头力量较强。
指标数据:
资金费率:0.00275200%。资金费率处于正常范围内,没有明显的多空情绪。
成交量变化:24小时成交量为6247815.080,显示出市场活跃度较高。近期成交量有所增加,显示出市场参与者增多。
资金流数据:24小时合约资金净流入为726427816.12 USDT,显示出多头资金正在流入市场。
分析结果
方向:谨慎做多
入场时机:建议在价格回调至1550 USDT附近时入场,或者在价格突破1603.50 USDT时追多。
止损设定:建议设置在1516.25 USDT下方,止损比例约为3%。
目标价位:预期目标价位为1640.82 USDT,预期收益率约为5%。
提示:本次分析仅供参考,不构成任何投资建议!
ETHUSDT 4h行情走势分析报告
当前价格:1558.43 USDT
24小时涨跌:2.213%
主要支撑位:1516.25 USDT
主要压力位:1603.50 USDT
当前趋势:震荡偏多
详细解释:
技术指标综合:
均线系统:MA5=1563.94,MA10=1544.56,MA20=1543.61,MA120=1804.39。均线系统呈现多头排列,短期均线在中期均线之上,显示出一定的上升趋势。
MACD:DIF=-13.56,DEA=-22.95,柱=9.40。MACD柱状图在零轴上方,显示出多头力量正在增强。
BOLL:上轨=1667.85,中轨=1543.62,下轨=1419.38。当前价格位于中轨和上轨之间,显示出市场处于震荡偏多的状态。
RSI:RSI6=56.35,RSI12=50.14,RSI14=49.02,RSI24=45.87。RSI指标处于中性区域,没有明显的超买或超卖信号。
KDJ:K=62.77,D=53.85,J=80.61。KDJ指标显示K线和J线在D线之上,显示出多头力量较强。
指标数据:
资金费率:0.00275200%。资金费率处于正常范围内,没有明显的多空情绪。
成交量变化:24小时成交量为6247815.080,显示出市场活跃度较高。近期成交量有所增加,显示出市场参与者增多。
资金流数据:24小时合约资金净流入为726427816.12 USDT,显示出多头资金正在流入市场。
分析结果
方向:谨慎做多
入场时机:建议在价格回调至1550 USDT附近时入场,或者在价格突破1603.50 USDT时追多。
止损设定:建议设置在1516.25 USDT下方,止损比例约为3%。
目标价位:预期目标价位为1640.82 USDT,预期收益率约为5%。
提示:本次分析仅供参考,不构成任何投资建议!
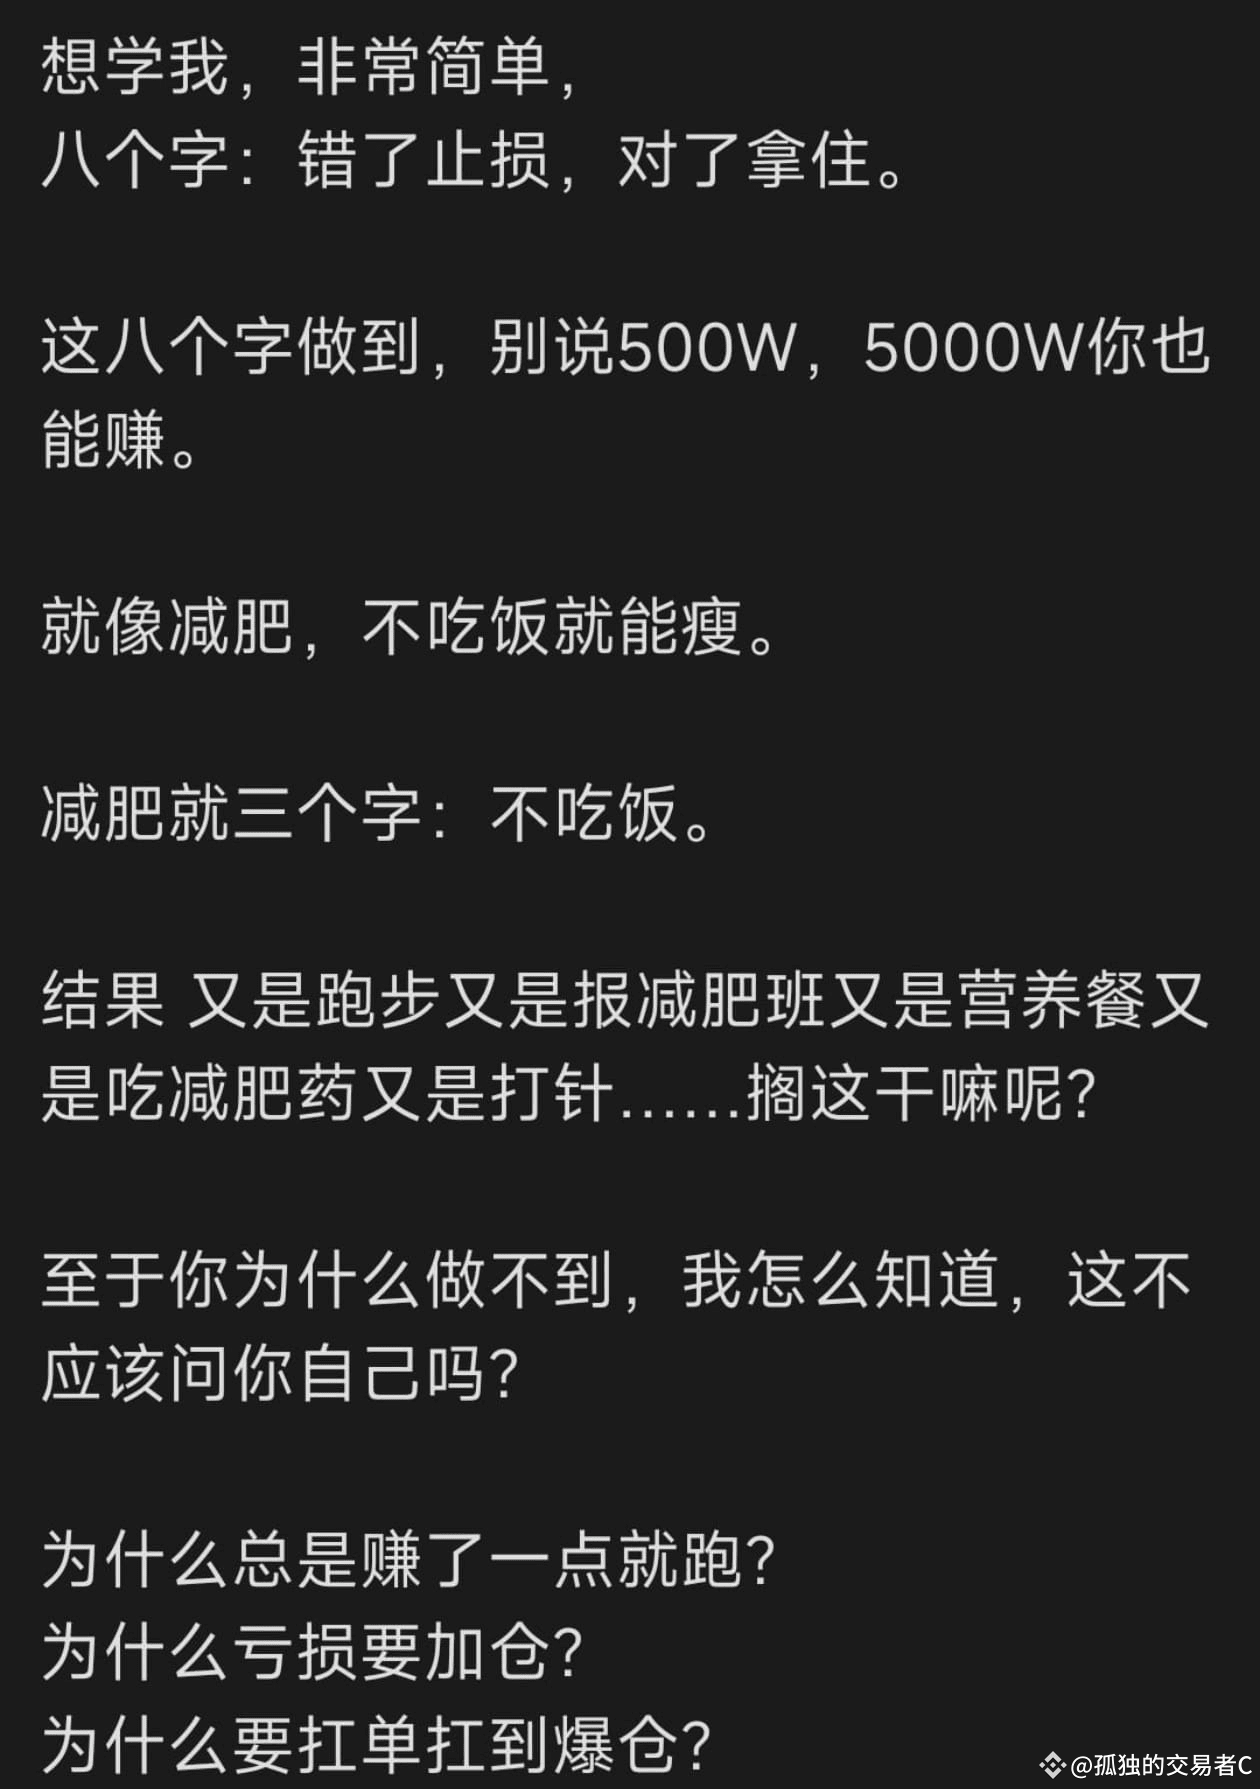
557
·
--
$BTC
Based on the current market dynamics and technical indicators analysis, Bitcoin (BTC) is showing the following characteristics and predictions for the four-hour chart on April 10, 2025:
Market Overview
After a morning peak of 83500, the Bitcoin price has retreated to around 82200, currently in a neutral range on the four-hour chart, intensifying the contest between bulls and bears. The daily MACD is converging negatively, the RSI has rebounded to 49.27, showing short-term rebound momentum but has not yet formed a clear trend.
Key Support and Resistance
- Resistance Levels: 83500-84000 (Bollinger Band upper track and EMA180 range)
- Support Levels: 80000-81000 (EMA300 and previous low pattern support)
Technical Indicator Signals
1. MACD: The DIF and DEA golden cross is expanding, but the histogram remains below the 0 axis, indicating a weak rebound.
2. KDJ: The J value has entered the overbought range, caution is needed for a potential correction.
3. Bollinger Bands: The convergence trend is obvious, with the price approaching the middle track at 83500; a breakout may accelerate the directional choice.
Operation Strategy Recommendations
- Bullish: If the price stabilizes above 81000 and breaks through 83500, a light long position can be taken, targeting 84000-85000, with a stop loss at 80500.
- Bearish: Short when there is resistance during a rebound to the 83500-84000 range, targeting 82000-80000, with a stop loss at 84500.
- Breakout Strategy: If there is a volume breakout above 84000, it may surge to 86000; if it drops below 80000, caution is needed for a correction to 77000 or even lower.
Risk Warning
The current market is significantly affected by tariff policies and macroeconomic data (such as CPI), with increasing volatility. Light position trading is recommended, with strict stop losses, and attention should be paid to real-time news changes.
$BTC
Based on the current market dynamics and technical indicators analysis, Bitcoin (BTC) is showing the following characteristics and predictions for the four-hour chart on April 10, 2025:
Market Overview
After a morning peak of 83500, the Bitcoin price has retreated to around 82200, currently in a neutral range on the four-hour chart, intensifying the contest between bulls and bears. The daily MACD is converging negatively, the RSI has rebounded to 49.27, showing short-term rebound momentum but has not yet formed a clear trend.
Key Support and Resistance
- Resistance Levels: 83500-84000 (Bollinger Band upper track and EMA180 range)
- Support Levels: 80000-81000 (EMA300 and previous low pattern support)
Technical Indicator Signals
1. MACD: The DIF and DEA golden cross is expanding, but the histogram remains below the 0 axis, indicating a weak rebound.
2. KDJ: The J value has entered the overbought range, caution is needed for a potential correction.
3. Bollinger Bands: The convergence trend is obvious, with the price approaching the middle track at 83500; a breakout may accelerate the directional choice.
Operation Strategy Recommendations
- Bullish: If the price stabilizes above 81000 and breaks through 83500, a light long position can be taken, targeting 84000-85000, with a stop loss at 80500.
- Bearish: Short when there is resistance during a rebound to the 83500-84000 range, targeting 82000-80000, with a stop loss at 84500.
- Breakout Strategy: If there is a volume breakout above 84000, it may surge to 86000; if it drops below 80000, caution is needed for a correction to 77000 or even lower.
Risk Warning
The current market is significantly affected by tariff policies and macroeconomic data (such as CPI), with increasing volatility. Light position trading is recommended, with strict stop losses, and attention should be paid to real-time news changes.
Based on the current market dynamics and technical indicators analysis, Bitcoin (BTC) is showing the following characteristics and predictions for the four-hour chart on April 10, 2025:
Market Overview
After a morning peak of 83500, the Bitcoin price has retreated to around 82200, currently in a neutral range on the four-hour chart, intensifying the contest between bulls and bears. The daily MACD is converging negatively, the RSI has rebounded to 49.27, showing short-term rebound momentum but has not yet formed a clear trend.
Key Support and Resistance
- Resistance Levels: 83500-84000 (Bollinger Band upper track and EMA180 range)
- Support Levels: 80000-81000 (EMA300 and previous low pattern support)
Technical Indicator Signals
1. MACD: The DIF and DEA golden cross is expanding, but the histogram remains below the 0 axis, indicating a weak rebound.
2. KDJ: The J value has entered the overbought range, caution is needed for a potential correction.
3. Bollinger Bands: The convergence trend is obvious, with the price approaching the middle track at 83500; a breakout may accelerate the directional choice.
Operation Strategy Recommendations
- Bullish: If the price stabilizes above 81000 and breaks through 83500, a light long position can be taken, targeting 84000-85000, with a stop loss at 80500.
- Bearish: Short when there is resistance during a rebound to the 83500-84000 range, targeting 82000-80000, with a stop loss at 84500.
- Breakout Strategy: If there is a volume breakout above 84000, it may surge to 86000; if it drops below 80000, caution is needed for a correction to 77000 or even lower.
Risk Warning
The current market is significantly affected by tariff policies and macroeconomic data (such as CPI), with increasing volatility. Light position trading is recommended, with strict stop losses, and attention should be paid to real-time news changes.
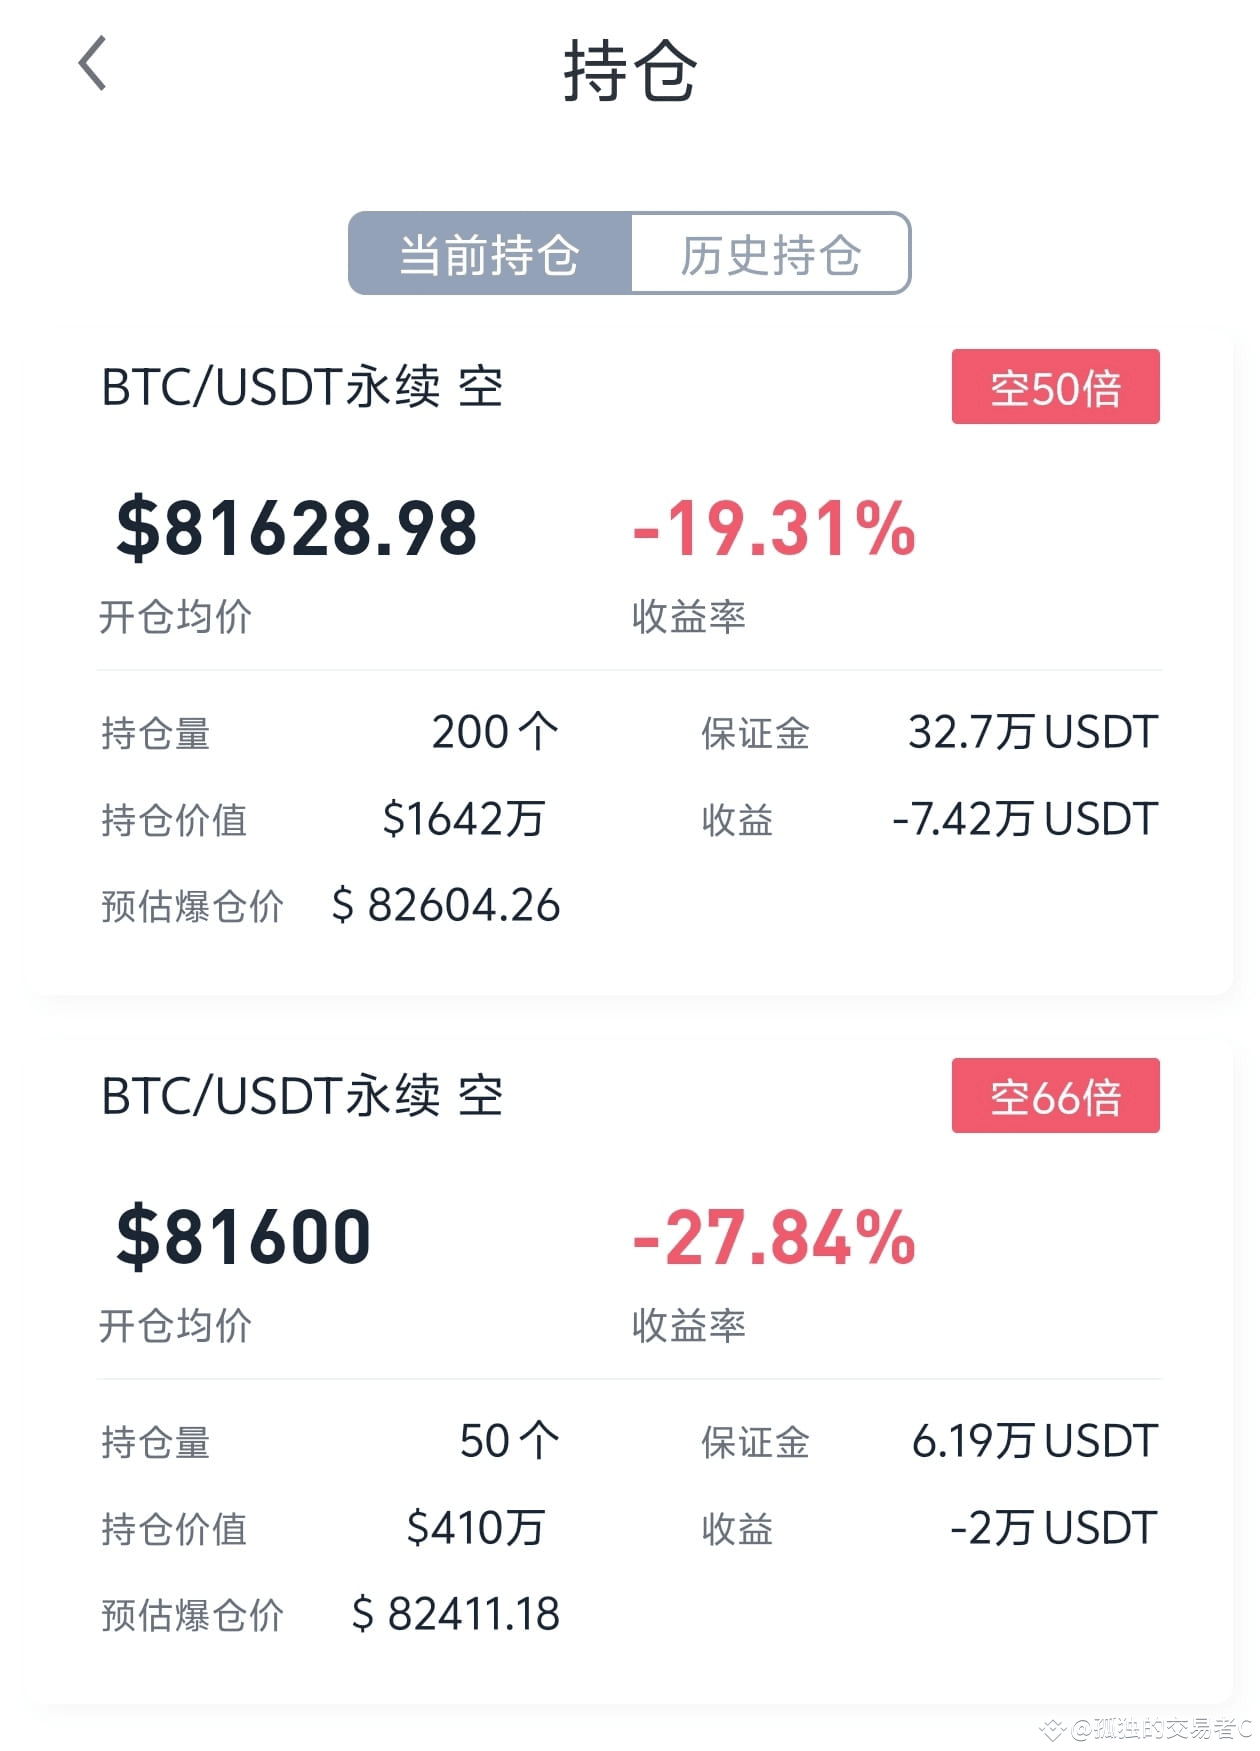
1
359
·
--
#特朗普暂停新关税
The President of the United States, Donald Trump, announced on April 9, 2025, a 90-day suspension of "reciprocal tariffs" for most countries, during which a 10% baseline tariff will be maintained. This decision is mainly influenced by the following factors:
1. Bond market turmoil: U.S. Treasury bonds faced massive sell-offs, with the yield on 30-year Treasury bonds soaring nearly 60 basis points in three days, briefly surpassing the 5% mark. Internal concerns within the Treasury regarding market risks became the core motivation for suspending the tariffs.
2. Economic consequence concerns: If the bond sell-off continues, it could trigger the most severe financial crisis since 1981. Wall Street generally believes that while suspending tariffs can stabilize the market in the short term, the policy inconsistency exacerbates uncertainty.
3. Multiple pressures: Republican lawmakers, business executives, and Wall Street allies pressured Trump through phone calls and meetings, urging him to reconsider the tariff policy. JPMorgan CEO Jamie Dimon warned that an economic recession could be a "possible outcome" of the new tariffs.
It is noteworthy that Trump also imposed a 125% tariff on China, aimed at forcing China to make concessions in negotiations through extreme pressure. Current market reactions show divergence: the three major U.S. stock indexes recorded the largest single-day gains in history, but institutions like Goldman Sachs still predict a 45% probability of recession in the next 12 months.
#特朗普暂停新关税
The President of the United States, Donald Trump, announced on April 9, 2025, a 90-day suspension of "reciprocal tariffs" for most countries, during which a 10% baseline tariff will be maintained. This decision is mainly influenced by the following factors:
1. Bond market turmoil: U.S. Treasury bonds faced massive sell-offs, with the yield on 30-year Treasury bonds soaring nearly 60 basis points in three days, briefly surpassing the 5% mark. Internal concerns within the Treasury regarding market risks became the core motivation for suspending the tariffs.
2. Economic consequence concerns: If the bond sell-off continues, it could trigger the most severe financial crisis since 1981. Wall Street generally believes that while suspending tariffs can stabilize the market in the short term, the policy inconsistency exacerbates uncertainty.
3. Multiple pressures: Republican lawmakers, business executives, and Wall Street allies pressured Trump through phone calls and meetings, urging him to reconsider the tariff policy. JPMorgan CEO Jamie Dimon warned that an economic recession could be a "possible outcome" of the new tariffs.
It is noteworthy that Trump also imposed a 125% tariff on China, aimed at forcing China to make concessions in negotiations through extreme pressure. Current market reactions show divergence: the three major U.S. stock indexes recorded the largest single-day gains in history, but institutions like Goldman Sachs still predict a 45% probability of recession in the next 12 months.
The President of the United States, Donald Trump, announced on April 9, 2025, a 90-day suspension of "reciprocal tariffs" for most countries, during which a 10% baseline tariff will be maintained. This decision is mainly influenced by the following factors:
1. Bond market turmoil: U.S. Treasury bonds faced massive sell-offs, with the yield on 30-year Treasury bonds soaring nearly 60 basis points in three days, briefly surpassing the 5% mark. Internal concerns within the Treasury regarding market risks became the core motivation for suspending the tariffs.
2. Economic consequence concerns: If the bond sell-off continues, it could trigger the most severe financial crisis since 1981. Wall Street generally believes that while suspending tariffs can stabilize the market in the short term, the policy inconsistency exacerbates uncertainty.
3. Multiple pressures: Republican lawmakers, business executives, and Wall Street allies pressured Trump through phone calls and meetings, urging him to reconsider the tariff policy. JPMorgan CEO Jamie Dimon warned that an economic recession could be a "possible outcome" of the new tariffs.
It is noteworthy that Trump also imposed a 125% tariff on China, aimed at forcing China to make concessions in negotiations through extreme pressure. Current market reactions show divergence: the three major U.S. stock indexes recorded the largest single-day gains in history, but institutions like Goldman Sachs still predict a 45% probability of recession in the next 12 months.

41
·
--
#加密市场回调
ETHUSDT 4h行情走势分析报告
当前价格:1656.72 USDT
24小时涨跌:12.535%
主要支撑位:1462.41 USDT
主要压力位:1751.21 USDT
当前趋势:震荡偏多
详细解释:
技术指标综合:
均线系统: MA5=1541.62,MA10=1518.31,MA20=1533.97,MA120=1849.87。当前价格位于MA5和MA10之上,且MA5和MA10呈多头排列,显示出短期内的上升趋势。
MACD: DIF=-44.94,DEA=-65.80,柱=20.86。MACD柱状图在零轴上方,显示出多头力量正在增强,短期内可能继续上涨。
BOLL: 上轨=1662.98,中轨=1533.97,下轨=1404.96。当前价格接近BOLL上轨,显示出价格处于相对高位,但尚未突破上轨,表明短期内可能面临一定的压力。
RSI: RSI6=70.41,RSI12=57.05,RSI14=54.80,RSI24=49.01。RSI6处于超买区域,但其他RSI指标处于中性区域,显示出短期内可能面临一定的回调压力。
KDJ: K=65.95,D=49.08,J=99.70。KDJ指标显示出多头力量较强,但J值接近100,显示出短期内可能面临一定的回调压力。
指标数据:
资金费率: 0.00981800%。资金费率处于中性区域,多空情绪不明显。
成交量变化: 近期成交量有所增加,特别是在价格上涨时,显示出多头力量较强。
资金流数据: 4H和6H的资金净流入较大,显示出短期内多头力量较强。
分析结果
方向: 谨慎做多
入场时机: 建议在价格回调至1600 USDT附近时入场,或者等待价格突破1751.21 USDT时入场。
止损设定: 建议止损设定在1550 USDT,即当前价格的3%左右。
目标价位: 预期目标价位为1800 USDT,预期收益率为8.6%。
提示:本次分析仅供参考,不构成任何投资建议!
#加密市场回调
ETHUSDT 4h行情走势分析报告
当前价格:1656.72 USDT
24小时涨跌:12.535%
主要支撑位:1462.41 USDT
主要压力位:1751.21 USDT
当前趋势:震荡偏多
详细解释:
技术指标综合:
均线系统: MA5=1541.62,MA10=1518.31,MA20=1533.97,MA120=1849.87。当前价格位于MA5和MA10之上,且MA5和MA10呈多头排列,显示出短期内的上升趋势。
MACD: DIF=-44.94,DEA=-65.80,柱=20.86。MACD柱状图在零轴上方,显示出多头力量正在增强,短期内可能继续上涨。
BOLL: 上轨=1662.98,中轨=1533.97,下轨=1404.96。当前价格接近BOLL上轨,显示出价格处于相对高位,但尚未突破上轨,表明短期内可能面临一定的压力。
RSI: RSI6=70.41,RSI12=57.05,RSI14=54.80,RSI24=49.01。RSI6处于超买区域,但其他RSI指标处于中性区域,显示出短期内可能面临一定的回调压力。
KDJ: K=65.95,D=49.08,J=99.70。KDJ指标显示出多头力量较强,但J值接近100,显示出短期内可能面临一定的回调压力。
指标数据:
资金费率: 0.00981800%。资金费率处于中性区域,多空情绪不明显。
成交量变化: 近期成交量有所增加,特别是在价格上涨时,显示出多头力量较强。
资金流数据: 4H和6H的资金净流入较大,显示出短期内多头力量较强。
分析结果
方向: 谨慎做多
入场时机: 建议在价格回调至1600 USDT附近时入场,或者等待价格突破1751.21 USDT时入场。
止损设定: 建议止损设定在1550 USDT,即当前价格的3%左右。
目标价位: 预期目标价位为1800 USDT,预期收益率为8.6%。
提示:本次分析仅供参考,不构成任何投资建议!
ETHUSDT 4h行情走势分析报告
当前价格:1656.72 USDT
24小时涨跌:12.535%
主要支撑位:1462.41 USDT
主要压力位:1751.21 USDT
当前趋势:震荡偏多
详细解释:
技术指标综合:
均线系统: MA5=1541.62,MA10=1518.31,MA20=1533.97,MA120=1849.87。当前价格位于MA5和MA10之上,且MA5和MA10呈多头排列,显示出短期内的上升趋势。
MACD: DIF=-44.94,DEA=-65.80,柱=20.86。MACD柱状图在零轴上方,显示出多头力量正在增强,短期内可能继续上涨。
BOLL: 上轨=1662.98,中轨=1533.97,下轨=1404.96。当前价格接近BOLL上轨,显示出价格处于相对高位,但尚未突破上轨,表明短期内可能面临一定的压力。
RSI: RSI6=70.41,RSI12=57.05,RSI14=54.80,RSI24=49.01。RSI6处于超买区域,但其他RSI指标处于中性区域,显示出短期内可能面临一定的回调压力。
KDJ: K=65.95,D=49.08,J=99.70。KDJ指标显示出多头力量较强,但J值接近100,显示出短期内可能面临一定的回调压力。
指标数据:
资金费率: 0.00981800%。资金费率处于中性区域,多空情绪不明显。
成交量变化: 近期成交量有所增加,特别是在价格上涨时,显示出多头力量较强。
资金流数据: 4H和6H的资金净流入较大,显示出短期内多头力量较强。
分析结果
方向: 谨慎做多
入场时机: 建议在价格回调至1600 USDT附近时入场,或者等待价格突破1751.21 USDT时入场。
止损设定: 建议止损设定在1550 USDT,即当前价格的3%左右。
目标价位: 预期目标价位为1800 USDT,预期收益率为8.6%。
提示:本次分析仅供参考,不构成任何投资建议!
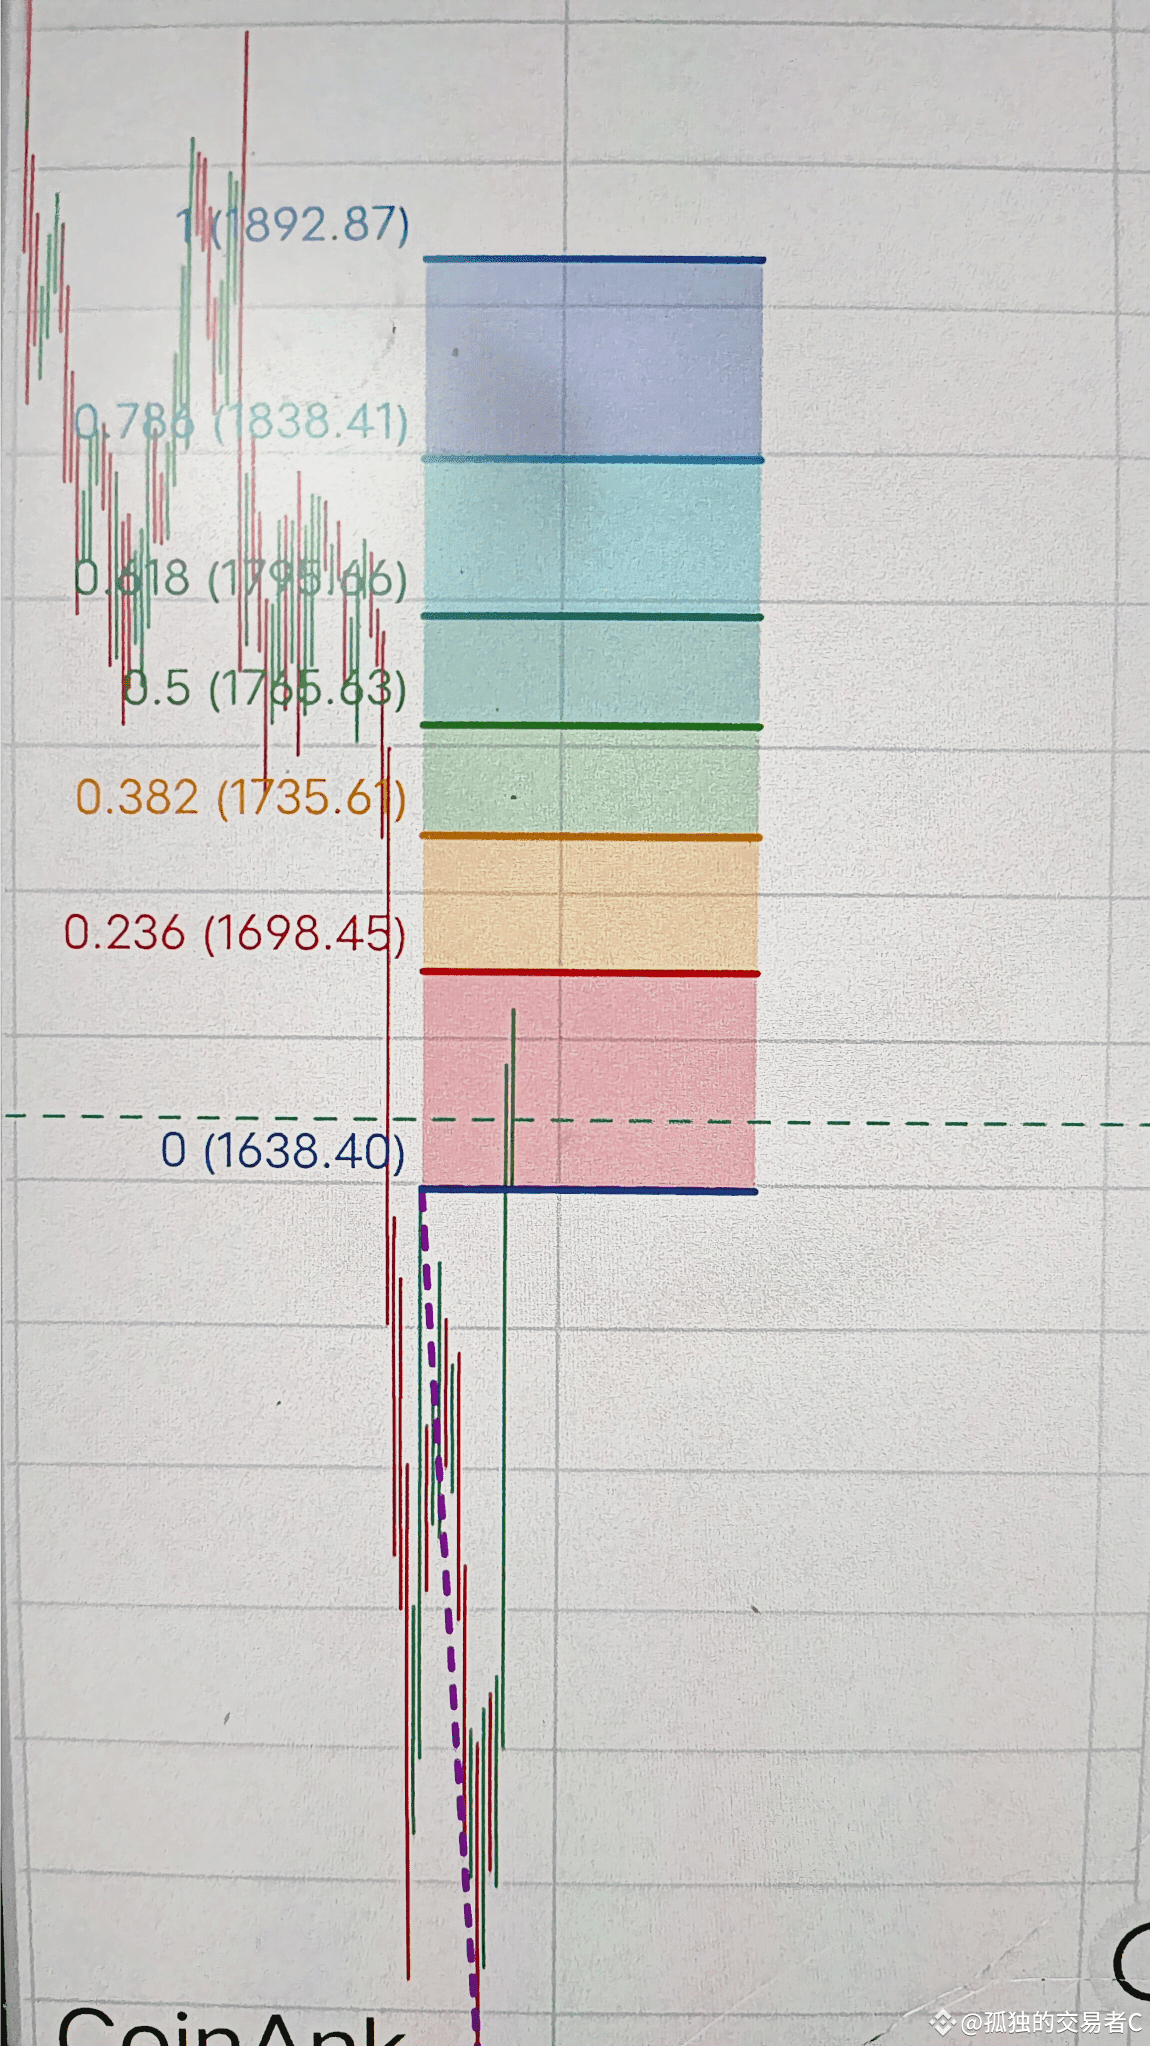
1
595
·
--
#风险回报比
In cryptocurrency (crypto circle) investment, the risk-reward ratio is an important indicator for assessing whether a trade or investment is worth participating in. It helps investors evaluate the feasibility of a trade by comparing the ratio of potential gains to potential risks. Here is a detailed analysis of the risk-reward ratio in the crypto circle:
The risk-reward ratio is typically expressed as "Potential Gains ÷ Potential Risks", for example:
1:2 ratio: take on 1 unit of risk, potentially gain 2 units of profit.
1:3 ratio: take on 1 unit of risk, potentially gain 3 units of profit.
Core logic: The higher the ratio, the greater the potential return for each unit of risk, making the trade more attractive.
How to optimize the risk-reward ratio?
(1) Strict stop-loss and take-profit
Set clear stop-loss points (e.g., 5% below the support level) to avoid emotional losses.
Dynamically adjust take-profit points based on market trends (e.g., taking profits in batches after reaching the target).
(2) Diversified investment
Avoid all-in on a single asset; reduce overall risk by combining mainstream coins, growth coins, and stablecoins.
For example: allocate funds as 50% Bitcoin, 30% blue-chip altcoins, 20% cash.
(3) In-depth fundamental analysis
Evaluate project team, technology roadmap, community activity, application scenarios, etc.
Beware of "air coins" and Ponzi schemes (risk-reward ratios of projects without actual value support are overly inflated).
(4) Technical analysis assistance
Use indicators such as trend lines, moving averages, and RSI to determine entry timing.
For example: buy at the bottom of an uptrend channel, sell in batches near the top.
(5) Position management
The risk of a single trade should not exceed 2%-5% of total capital (e.g., with 100,000 yuan in capital, control the maximum loss of a single trade within 2,000 yuan).
#风险回报比
In cryptocurrency (crypto circle) investment, the risk-reward ratio is an important indicator for assessing whether a trade or investment is worth participating in. It helps investors evaluate the feasibility of a trade by comparing the ratio of potential gains to potential risks. Here is a detailed analysis of the risk-reward ratio in the crypto circle:
The risk-reward ratio is typically expressed as "Potential Gains ÷ Potential Risks", for example:
1:2 ratio: take on 1 unit of risk, potentially gain 2 units of profit.
1:3 ratio: take on 1 unit of risk, potentially gain 3 units of profit.
Core logic: The higher the ratio, the greater the potential return for each unit of risk, making the trade more attractive.
How to optimize the risk-reward ratio?
(1) Strict stop-loss and take-profit
Set clear stop-loss points (e.g., 5% below the support level) to avoid emotional losses.
Dynamically adjust take-profit points based on market trends (e.g., taking profits in batches after reaching the target).
(2) Diversified investment
Avoid all-in on a single asset; reduce overall risk by combining mainstream coins, growth coins, and stablecoins.
For example: allocate funds as 50% Bitcoin, 30% blue-chip altcoins, 20% cash.
(3) In-depth fundamental analysis
Evaluate project team, technology roadmap, community activity, application scenarios, etc.
Beware of "air coins" and Ponzi schemes (risk-reward ratios of projects without actual value support are overly inflated).
(4) Technical analysis assistance
Use indicators such as trend lines, moving averages, and RSI to determine entry timing.
For example: buy at the bottom of an uptrend channel, sell in batches near the top.
(5) Position management
The risk of a single trade should not exceed 2%-5% of total capital (e.g., with 100,000 yuan in capital, control the maximum loss of a single trade within 2,000 yuan).
In cryptocurrency (crypto circle) investment, the risk-reward ratio is an important indicator for assessing whether a trade or investment is worth participating in. It helps investors evaluate the feasibility of a trade by comparing the ratio of potential gains to potential risks. Here is a detailed analysis of the risk-reward ratio in the crypto circle:
The risk-reward ratio is typically expressed as "Potential Gains ÷ Potential Risks", for example:
1:2 ratio: take on 1 unit of risk, potentially gain 2 units of profit.
1:3 ratio: take on 1 unit of risk, potentially gain 3 units of profit.
Core logic: The higher the ratio, the greater the potential return for each unit of risk, making the trade more attractive.
How to optimize the risk-reward ratio?
(1) Strict stop-loss and take-profit
Set clear stop-loss points (e.g., 5% below the support level) to avoid emotional losses.
Dynamically adjust take-profit points based on market trends (e.g., taking profits in batches after reaching the target).
(2) Diversified investment
Avoid all-in on a single asset; reduce overall risk by combining mainstream coins, growth coins, and stablecoins.
For example: allocate funds as 50% Bitcoin, 30% blue-chip altcoins, 20% cash.
(3) In-depth fundamental analysis
Evaluate project team, technology roadmap, community activity, application scenarios, etc.
Beware of "air coins" and Ponzi schemes (risk-reward ratios of projects without actual value support are overly inflated).
(4) Technical analysis assistance
Use indicators such as trend lines, moving averages, and RSI to determine entry timing.
For example: buy at the bottom of an uptrend channel, sell in batches near the top.
(5) Position management
The risk of a single trade should not exceed 2%-5% of total capital (e.g., with 100,000 yuan in capital, control the maximum loss of a single trade within 2,000 yuan).

120
·
--
#美国加征关税
The impact of tariffs on the macroeconomy transmitted to the cryptocurrency sector
Inflation and tightening monetary policy
Tariffs drive up import prices: Increased tariffs may exacerbate imported inflation (such as rising energy and raw material costs), forcing central banks like the Federal Reserve to maintain a tight monetary policy (interest rate hikes/asset reductions).
Negative for cryptocurrency: Historical experience indicates that risk assets (such as cryptocurrencies and stocks) often face pressure during interest rate hike cycles, with funds flowing into safe-haven assets like the US dollar and US Treasuries.
Fluctuations in US dollar credit
Tariffs weaken US dollar hegemony: Long-term abuse of tariffs may accelerate global 'de-dollarization', with some countries turning to local currency settlements or digital currencies, indirectly benefiting cryptocurrencies (such as Bitcoin being seen as a 'digital gold' alternative to US dollar reserves).
Short-term volatility intensifies: Trade frictions caused by tariffs will increase fluctuations in the US dollar exchange rate, while cryptocurrency prices often show a negative correlation with the US dollar index.
Supply chain disruptions and recession risks
Decline in corporate profits: Tariffs elevate corporate costs, and if they trigger a global economic recession, the high-risk appetite cryptocurrency market may face sell-offs.
Divergence in safe-haven demand: Some funds may flow into cryptocurrencies to hedge against fiat currency depreciation, but most retail and institutional investors still prefer to hold cash or gold.
#美国加征关税
The impact of tariffs on the macroeconomy transmitted to the cryptocurrency sector
Inflation and tightening monetary policy
Tariffs drive up import prices: Increased tariffs may exacerbate imported inflation (such as rising energy and raw material costs), forcing central banks like the Federal Reserve to maintain a tight monetary policy (interest rate hikes/asset reductions).
Negative for cryptocurrency: Historical experience indicates that risk assets (such as cryptocurrencies and stocks) often face pressure during interest rate hike cycles, with funds flowing into safe-haven assets like the US dollar and US Treasuries.
Fluctuations in US dollar credit
Tariffs weaken US dollar hegemony: Long-term abuse of tariffs may accelerate global 'de-dollarization', with some countries turning to local currency settlements or digital currencies, indirectly benefiting cryptocurrencies (such as Bitcoin being seen as a 'digital gold' alternative to US dollar reserves).
Short-term volatility intensifies: Trade frictions caused by tariffs will increase fluctuations in the US dollar exchange rate, while cryptocurrency prices often show a negative correlation with the US dollar index.
Supply chain disruptions and recession risks
Decline in corporate profits: Tariffs elevate corporate costs, and if they trigger a global economic recession, the high-risk appetite cryptocurrency market may face sell-offs.
Divergence in safe-haven demand: Some funds may flow into cryptocurrencies to hedge against fiat currency depreciation, but most retail and institutional investors still prefer to hold cash or gold.
The impact of tariffs on the macroeconomy transmitted to the cryptocurrency sector
Inflation and tightening monetary policy
Tariffs drive up import prices: Increased tariffs may exacerbate imported inflation (such as rising energy and raw material costs), forcing central banks like the Federal Reserve to maintain a tight monetary policy (interest rate hikes/asset reductions).
Negative for cryptocurrency: Historical experience indicates that risk assets (such as cryptocurrencies and stocks) often face pressure during interest rate hike cycles, with funds flowing into safe-haven assets like the US dollar and US Treasuries.
Fluctuations in US dollar credit
Tariffs weaken US dollar hegemony: Long-term abuse of tariffs may accelerate global 'de-dollarization', with some countries turning to local currency settlements or digital currencies, indirectly benefiting cryptocurrencies (such as Bitcoin being seen as a 'digital gold' alternative to US dollar reserves).
Short-term volatility intensifies: Trade frictions caused by tariffs will increase fluctuations in the US dollar exchange rate, while cryptocurrency prices often show a negative correlation with the US dollar index.
Supply chain disruptions and recession risks
Decline in corporate profits: Tariffs elevate corporate costs, and if they trigger a global economic recession, the high-risk appetite cryptocurrency market may face sell-offs.
Divergence in safe-haven demand: Some funds may flow into cryptocurrencies to hedge against fiat currency depreciation, but most retail and institutional investors still prefer to hold cash or gold.
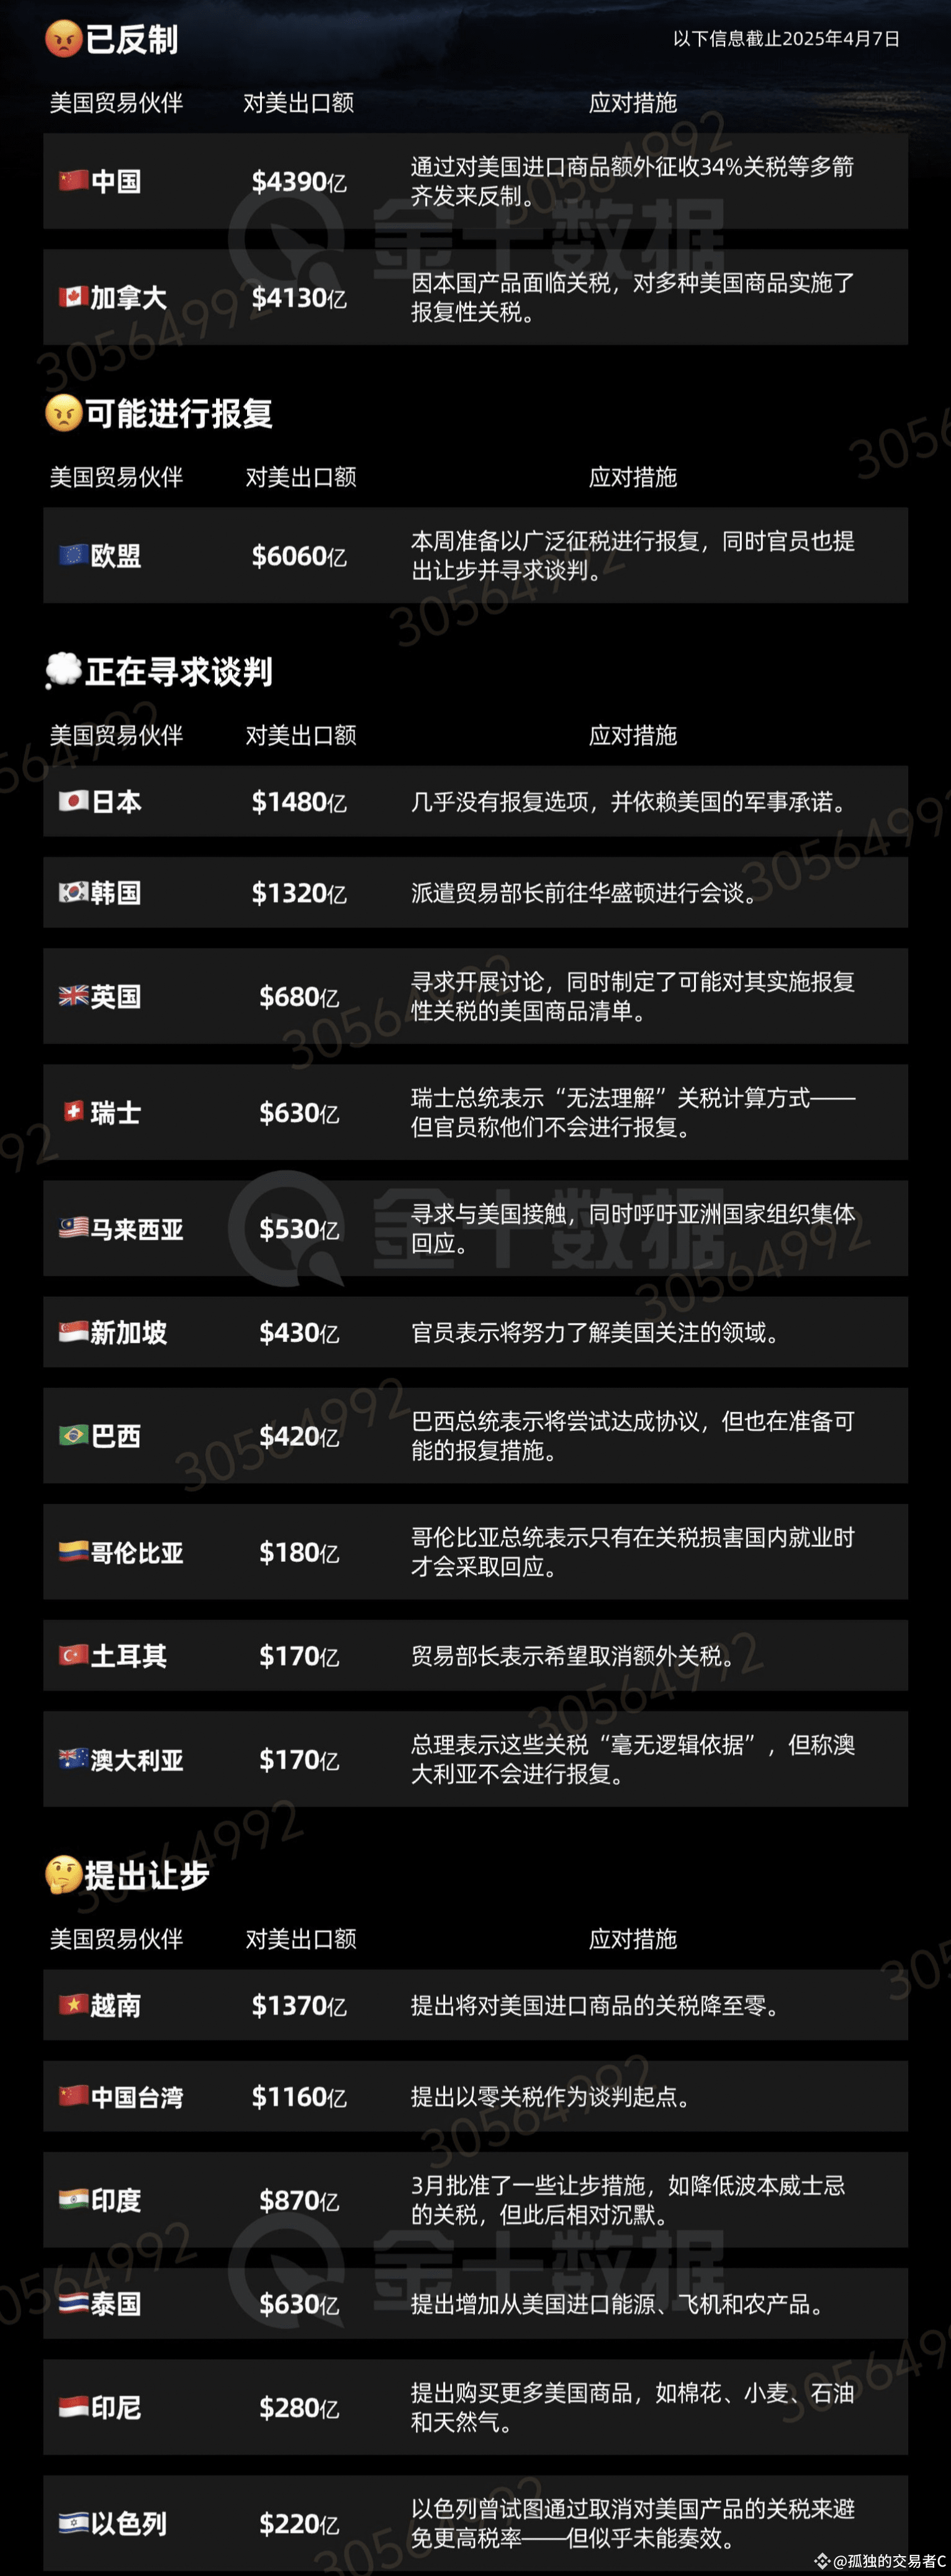
721
·
--
#交易心理学
以下是与交易心理学相关的核心概念及其生动形象的英语表达方式,融合了金融术语与生活化比喻:
---
1. 贪婪与恐惧的博弈
Greed vs. Fear Tango
(贪婪与恐惧的探戈)
- 创意解析:用"探戈"的互动性比喻两种情绪的拉扯
- 场景:"当市场波动时,交易者们在贪婪与恐惧的探戈中舞动。"
---
2. 过度交易成瘾
Clickety-Click Compulsion
(咔嗒点击强迫症)
- 创意解析:模拟鼠标高频点击声强化行为上瘾感
- 例证:"散户投资者通常会陷入咔嗒点击强迫症的陷阱。"
---
3. 确认偏误陷阱
Echo Chamber of Ego
(自我回音室效应)
- 创意解析:将认知偏差具象化为声音封闭空间
- 应用:"你的获利策略不应该生活在自我回音室中。"
---
4. 止损心理障碍
The Anchored Amnesia Syndrome
(锚定失忆症)
- 创意解析:用航海"锚定"比喻固守错误,叠加记忆丧失的荒诞感
- 示例:"患有锚定失忆症,他不停地驾驶着一艘沉船。"
---
5. 羊群效应
Meme Herding Madness
(模因牧羊癫狂)
- 创意解析:结合互联网模因文化与动物群体行为
- 场景:"加密货币崩盘通常始于模因牧羊癫狂。"
---
6. 幸存者偏差幻觉
Survivorship Spotlight Delusion
(幸存聚光灯妄想)
- 创意解析:用舞台聚光灯比喻选择性关注
- 解析:"只关注赢利交易是幸存聚光灯妄想。"
---
7. 黑天鹅恐惧症
Black Swan Phobia Paradox
(黑天鹅恐惧悖论)
- 创意解析:将罕见风险恐惧与逻辑悖论结合
- 应用:"对抗黑天鹅恐惧症悖论需要反直觉的策略。"
---
8. 仓位大小心魔
Position Sizing Gremlin
(仓位大小小恶魔)
- 创意解析:用神话中的捣蛋鬼比喻难以控制的风险决策
- 例句:"当逻辑告诉他要走开时,仓位大小小恶魔低语‘加倍下注’。"
---
#交易心理学
以下是与交易心理学相关的核心概念及其生动形象的英语表达方式,融合了金融术语与生活化比喻:
---
1. 贪婪与恐惧的博弈
Greed vs. Fear Tango
(贪婪与恐惧的探戈)
- 创意解析:用"探戈"的互动性比喻两种情绪的拉扯
- 场景:"当市场波动时,交易者们在贪婪与恐惧的探戈中舞动。"
---
2. 过度交易成瘾
Clickety-Click Compulsion
(咔嗒点击强迫症)
- 创意解析:模拟鼠标高频点击声强化行为上瘾感
- 例证:"散户投资者通常会陷入咔嗒点击强迫症的陷阱。"
---
3. 确认偏误陷阱
Echo Chamber of Ego
(自我回音室效应)
- 创意解析:将认知偏差具象化为声音封闭空间
- 应用:"你的获利策略不应该生活在自我回音室中。"
---
4. 止损心理障碍
The Anchored Amnesia Syndrome
(锚定失忆症)
- 创意解析:用航海"锚定"比喻固守错误,叠加记忆丧失的荒诞感
- 示例:"患有锚定失忆症,他不停地驾驶着一艘沉船。"
---
5. 羊群效应
Meme Herding Madness
(模因牧羊癫狂)
- 创意解析:结合互联网模因文化与动物群体行为
- 场景:"加密货币崩盘通常始于模因牧羊癫狂。"
---
6. 幸存者偏差幻觉
Survivorship Spotlight Delusion
(幸存聚光灯妄想)
- 创意解析:用舞台聚光灯比喻选择性关注
- 解析:"只关注赢利交易是幸存聚光灯妄想。"
---
7. 黑天鹅恐惧症
Black Swan Phobia Paradox
(黑天鹅恐惧悖论)
- 创意解析:将罕见风险恐惧与逻辑悖论结合
- 应用:"对抗黑天鹅恐惧症悖论需要反直觉的策略。"
---
8. 仓位大小心魔
Position Sizing Gremlin
(仓位大小小恶魔)
- 创意解析:用神话中的捣蛋鬼比喻难以控制的风险决策
- 例句:"当逻辑告诉他要走开时,仓位大小小恶魔低语‘加倍下注’。"
---
以下是与交易心理学相关的核心概念及其生动形象的英语表达方式,融合了金融术语与生活化比喻:
---
1. 贪婪与恐惧的博弈
Greed vs. Fear Tango
(贪婪与恐惧的探戈)
- 创意解析:用"探戈"的互动性比喻两种情绪的拉扯
- 场景:"当市场波动时,交易者们在贪婪与恐惧的探戈中舞动。"
---
2. 过度交易成瘾
Clickety-Click Compulsion
(咔嗒点击强迫症)
- 创意解析:模拟鼠标高频点击声强化行为上瘾感
- 例证:"散户投资者通常会陷入咔嗒点击强迫症的陷阱。"
---
3. 确认偏误陷阱
Echo Chamber of Ego
(自我回音室效应)
- 创意解析:将认知偏差具象化为声音封闭空间
- 应用:"你的获利策略不应该生活在自我回音室中。"
---
4. 止损心理障碍
The Anchored Amnesia Syndrome
(锚定失忆症)
- 创意解析:用航海"锚定"比喻固守错误,叠加记忆丧失的荒诞感
- 示例:"患有锚定失忆症,他不停地驾驶着一艘沉船。"
---
5. 羊群效应
Meme Herding Madness
(模因牧羊癫狂)
- 创意解析:结合互联网模因文化与动物群体行为
- 场景:"加密货币崩盘通常始于模因牧羊癫狂。"
---
6. 幸存者偏差幻觉
Survivorship Spotlight Delusion
(幸存聚光灯妄想)
- 创意解析:用舞台聚光灯比喻选择性关注
- 解析:"只关注赢利交易是幸存聚光灯妄想。"
---
7. 黑天鹅恐惧症
Black Swan Phobia Paradox
(黑天鹅恐惧悖论)
- 创意解析:将罕见风险恐惧与逻辑悖论结合
- 应用:"对抗黑天鹅恐惧症悖论需要反直觉的策略。"
---
8. 仓位大小心魔
Position Sizing Gremlin
(仓位大小小恶魔)
- 创意解析:用神话中的捣蛋鬼比喻难以控制的风险决策
- 例句:"当逻辑告诉他要走开时,仓位大小小恶魔低语‘加倍下注’。"
---
29
·
--
$ETH
ETHUSDT 4h Market Trend Analysis Report
Current Price: 1468.29 USDT
24h Change: -6.841%
Main Support Level: 1405.38 USDT
Main Resistance Level: 1569.92 USDT
Current Trend: Clear Downtrend
Detailed Explanation:
Technical Indicator Summary:
Moving Average System: Bearish Arrangement, MA5 (1523.59) < MA10 (1533.68) < MA20 (1614.19) < MA120 (1873.29), the moving average system shows a clear bearish arrangement, indicating that both short-term and medium-term trends are bearish.
MACD: Dead Cross in Operation, DIF (-75.72) < DEA (-69.80), MACD bars are negative, indicating that market momentum is weak, and there is still room for decline in the short term.
BOLL: Price is near the lower band (1368.46), %B is 0.19%, indicating that the price is in the oversold area, but the BOLL bandwidth is narrow, suggesting low market volatility, which may continue to decline in the short term.
RSI: Oversold Area, RSI6 (24.97), RSI12 (28.28), RSI14 (28.85) are all below 30, indicating that the market is in an oversold state, but the RSI indicator can easily become dull, requiring a comprehensive judgment based on other indicators.
KDJ: Dead Cross in Operation, K (28.35) < D (39.53) < J (5.97), the KDJ indicator shows that the market is still in a weak position.
Indicator Data:
Funding Rate: -0.00396700%, the funding rate is relatively low, indicating that the market's long and short sentiment is not obvious, but slightly bearish.
Volume Change: Recent trading volume continues to expand, especially during price declines, indicating significant selling pressure in the market, which may continue to decline in the short term.
Capital Flow Data: Significant net outflow of contract funds, especially a net outflow of 374430971.23 USDT in 24 hours, indicating continuous withdrawal of funds from the market, and strong bearish sentiment in the short term.
Analysis Result
Direction: Short
Entry Timing: Near the current price of 1468.29 USDT, or wait for the price to rebound to around 1520 USDT to enter short.
Stop Loss Setting: Stop loss set at 1569.92 USDT (above the main resistance level), stop loss ratio about 6.9%.
Target Price Level: Target price set at 1405.38 USDT (main support level), expected return rate about 4.3%. If the price falls below 1405.38 USDT, it can continue to hold until 1347.15 USDT, expected return rate about 8.2%.
Note: This analysis is for reference only and does not constitute any investment advice!
$ETH
ETHUSDT 4h Market Trend Analysis Report
Current Price: 1468.29 USDT
24h Change: -6.841%
Main Support Level: 1405.38 USDT
Main Resistance Level: 1569.92 USDT
Current Trend: Clear Downtrend
Detailed Explanation:
Technical Indicator Summary:
Moving Average System: Bearish Arrangement, MA5 (1523.59) < MA10 (1533.68) < MA20 (1614.19) < MA120 (1873.29), the moving average system shows a clear bearish arrangement, indicating that both short-term and medium-term trends are bearish.
MACD: Dead Cross in Operation, DIF (-75.72) < DEA (-69.80), MACD bars are negative, indicating that market momentum is weak, and there is still room for decline in the short term.
BOLL: Price is near the lower band (1368.46), %B is 0.19%, indicating that the price is in the oversold area, but the BOLL bandwidth is narrow, suggesting low market volatility, which may continue to decline in the short term.
RSI: Oversold Area, RSI6 (24.97), RSI12 (28.28), RSI14 (28.85) are all below 30, indicating that the market is in an oversold state, but the RSI indicator can easily become dull, requiring a comprehensive judgment based on other indicators.
KDJ: Dead Cross in Operation, K (28.35) < D (39.53) < J (5.97), the KDJ indicator shows that the market is still in a weak position.
Indicator Data:
Funding Rate: -0.00396700%, the funding rate is relatively low, indicating that the market's long and short sentiment is not obvious, but slightly bearish.
Volume Change: Recent trading volume continues to expand, especially during price declines, indicating significant selling pressure in the market, which may continue to decline in the short term.
Capital Flow Data: Significant net outflow of contract funds, especially a net outflow of 374430971.23 USDT in 24 hours, indicating continuous withdrawal of funds from the market, and strong bearish sentiment in the short term.
Analysis Result
Direction: Short
Entry Timing: Near the current price of 1468.29 USDT, or wait for the price to rebound to around 1520 USDT to enter short.
Stop Loss Setting: Stop loss set at 1569.92 USDT (above the main resistance level), stop loss ratio about 6.9%.
Target Price Level: Target price set at 1405.38 USDT (main support level), expected return rate about 4.3%. If the price falls below 1405.38 USDT, it can continue to hold until 1347.15 USDT, expected return rate about 8.2%.
Note: This analysis is for reference only and does not constitute any investment advice!
ETHUSDT 4h Market Trend Analysis Report
Current Price: 1468.29 USDT
24h Change: -6.841%
Main Support Level: 1405.38 USDT
Main Resistance Level: 1569.92 USDT
Current Trend: Clear Downtrend
Detailed Explanation:
Technical Indicator Summary:
Moving Average System: Bearish Arrangement, MA5 (1523.59) < MA10 (1533.68) < MA20 (1614.19) < MA120 (1873.29), the moving average system shows a clear bearish arrangement, indicating that both short-term and medium-term trends are bearish.
MACD: Dead Cross in Operation, DIF (-75.72) < DEA (-69.80), MACD bars are negative, indicating that market momentum is weak, and there is still room for decline in the short term.
BOLL: Price is near the lower band (1368.46), %B is 0.19%, indicating that the price is in the oversold area, but the BOLL bandwidth is narrow, suggesting low market volatility, which may continue to decline in the short term.
RSI: Oversold Area, RSI6 (24.97), RSI12 (28.28), RSI14 (28.85) are all below 30, indicating that the market is in an oversold state, but the RSI indicator can easily become dull, requiring a comprehensive judgment based on other indicators.
KDJ: Dead Cross in Operation, K (28.35) < D (39.53) < J (5.97), the KDJ indicator shows that the market is still in a weak position.
Indicator Data:
Funding Rate: -0.00396700%, the funding rate is relatively low, indicating that the market's long and short sentiment is not obvious, but slightly bearish.
Volume Change: Recent trading volume continues to expand, especially during price declines, indicating significant selling pressure in the market, which may continue to decline in the short term.
Capital Flow Data: Significant net outflow of contract funds, especially a net outflow of 374430971.23 USDT in 24 hours, indicating continuous withdrawal of funds from the market, and strong bearish sentiment in the short term.
Analysis Result
Direction: Short
Entry Timing: Near the current price of 1468.29 USDT, or wait for the price to rebound to around 1520 USDT to enter short.
Stop Loss Setting: Stop loss set at 1569.92 USDT (above the main resistance level), stop loss ratio about 6.9%.
Target Price Level: Target price set at 1405.38 USDT (main support level), expected return rate about 4.3%. If the price falls below 1405.38 USDT, it can continue to hold until 1347.15 USDT, expected return rate about 8.2%.
Note: This analysis is for reference only and does not constitute any investment advice!

2.2k
Inicia sessão para explorar mais conteúdos
Junta-te a utilizadores de criptomoedas de todo o mundo na Binance Square
⚡️ Obtém informações úteis e recentes sobre criptomoedas.
💬 Com a confiança da maior exchange de criptomoedas do mundo.
👍 Descobre perspetivas reais de criadores verificados.
E-mail/Número de telefone
Tópicos em Tendência
BNBSurpasses$790
9,286 visualizações
77 a discutir
$BNB plano estratégico de longo prazo -> FOQUE AGORA
O BNB criou 2 fortes mínimas após romper a liquidez interna
Estou esperando um movimento em direção à máxima da swing em US$ 815–US$ 830 e procuro uma compra (long) em uma retest da caixa verde
#BNBSurpasses$790 #bnb
Ghost Writer
·4 gostos
·4.3k visualizações
ZamaRises15.99%ToIntradayHigh$0.09
2,901 visualizações
66 a discutir
BitcoinSpotETFsDraw$6.34BInflowsInQ3
3,227 visualizações
53 a discutir