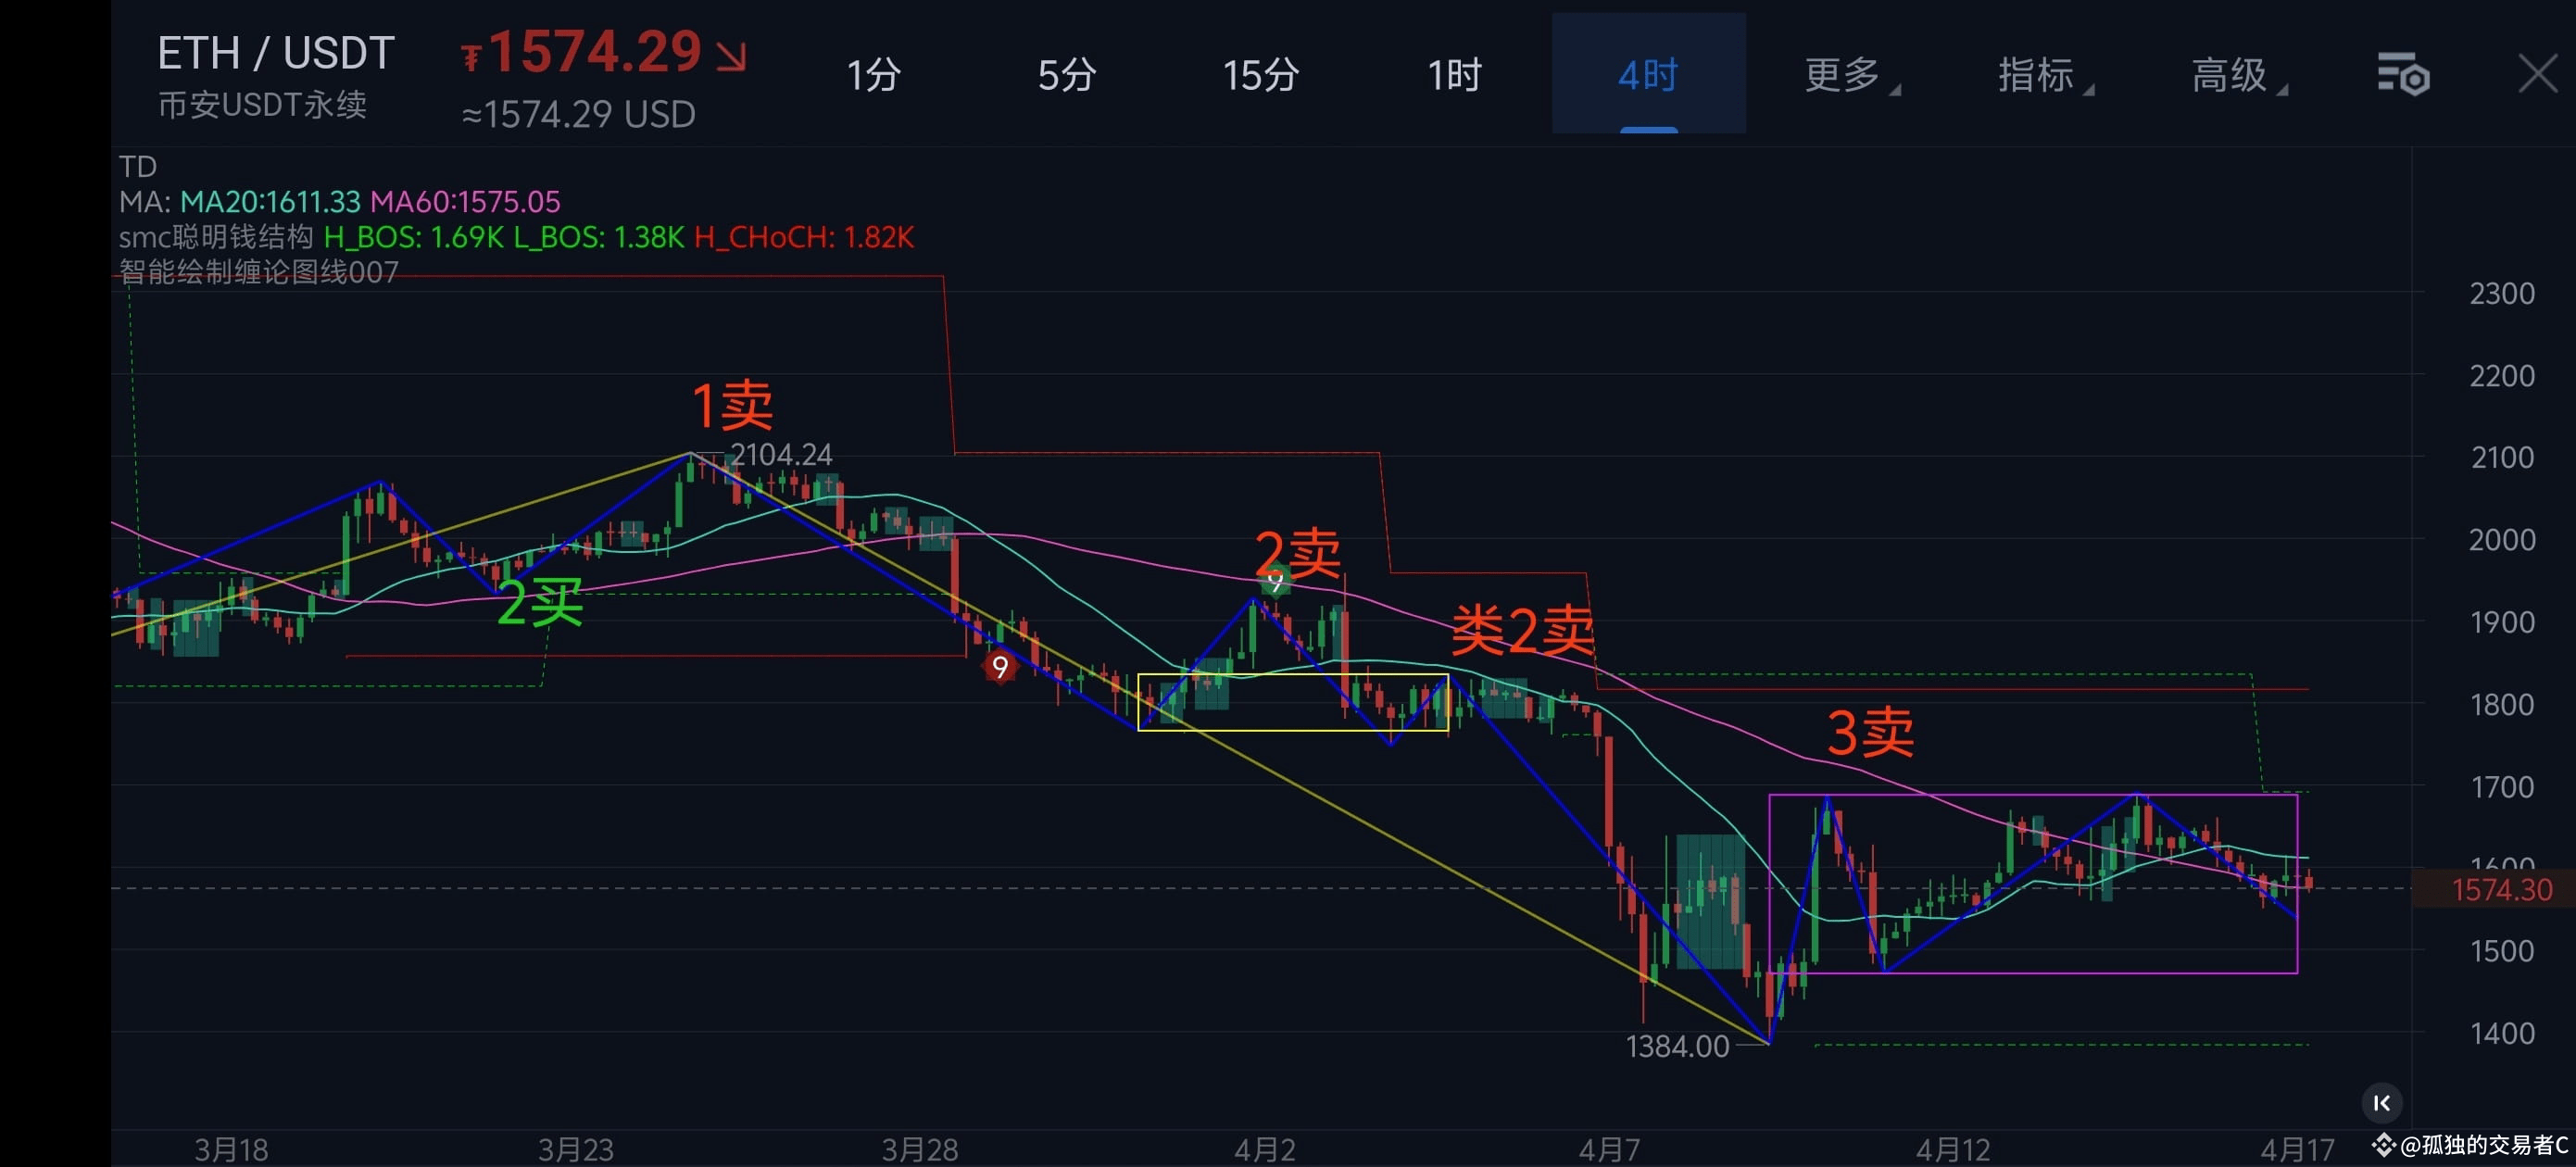
#加拿大推出SolanaETF
ETHUSDT 1d Market Trend Analysis Report
Current Price: 1572.65 USDT
24-Hour Change: -1.306%
Key Support Level: 1474.67 USDT
Key Resistance Level: 1695.40 USDT
Current Trend: Consolidation with a bearish bias
Detailed Explanation:
Technical Indicators Summary:
Moving Average System: MA5=1607.70, MA10=1581.98, MA20=1694.38, MA120=2621.55. The current price is below MA5 and MA10, and both MA5 and MA10 are below MA20, indicating a bearish arrangement in the short-term moving averages, suggesting a weak short-term trend.
MACD: DIF=-113.12, DEA=-121.94, Histogram=8.82. The MACD is in a death cross state, and both DIF and DEA are in negative territory, indicating weak market momentum and further downside risk in the short term.
BOLL: Upper Band=1959.92, Middle Band=1694.38, Lower Band=1428.84. The current price is located between the middle band and the lower band, and %B=0.30%, indicating that the price is in a weak area and may continue to move toward the lower band in the short term.
RSI: RSI6=42.71, RSI12=40.07, RSI14=39.65, RSI24=38.79. The RSI indicators are in a neutral to slightly lower zone, not entering the oversold area, indicating that there is still downside potential in the market.
KDJ: K=57.56, D=48.33, J=76.02. The KDJ indicators show that the K line and D line are in a neutral zone, with the J line slightly above the K line and D line, indicating a potential slight rebound in the short term, but the overall trend remains weak.
Indicator Data:
Funding Rate: 0.00415500%. The funding rate is in a neutral zone, with no obvious bullish or bearish sentiment, and has limited impact on prices in the short term.
Volume Change: Recent trading volume has shown fluctuations, but overall volume levels are low, indicating low market participation, likely maintaining a bearish consolidation trend in the short term.
Capital Flow Data: The net inflow and outflow of contract funds indicate that there has been significant capital outflow in the short term, suggesting that market capital is withdrawing, and may continue to decline in the short term.
Analysis Result
Direction: Cautiously Short
Entry Timing: It is recommended to enter short when the price rebounds to around 1600 USDT, confirming with the resistance levels of MA5 and MA10.
Stop Loss Setting: Set the stop loss at 1650 USDT, approximately a 3% stop loss ratio.
Target Price: Set the target price at 1474.67 USDT, with an expected return of about 8%.
Note: This analysis is for reference only and does not constitute any investment advice!
ETHUSDT 1d Market Trend Analysis Report
Current Price: 1572.65 USDT
24-Hour Change: -1.306%
Key Support Level: 1474.67 USDT
Key Resistance Level: 1695.40 USDT
Current Trend: Consolidation with a bearish bias
Detailed Explanation:
Technical Indicators Summary:
Moving Average System: MA5=1607.70, MA10=1581.98, MA20=1694.38, MA120=2621.55. The current price is below MA5 and MA10, and both MA5 and MA10 are below MA20, indicating a bearish arrangement in the short-term moving averages, suggesting a weak short-term trend.
MACD: DIF=-113.12, DEA=-121.94, Histogram=8.82. The MACD is in a death cross state, and both DIF and DEA are in negative territory, indicating weak market momentum and further downside risk in the short term.
BOLL: Upper Band=1959.92, Middle Band=1694.38, Lower Band=1428.84. The current price is located between the middle band and the lower band, and %B=0.30%, indicating that the price is in a weak area and may continue to move toward the lower band in the short term.
RSI: RSI6=42.71, RSI12=40.07, RSI14=39.65, RSI24=38.79. The RSI indicators are in a neutral to slightly lower zone, not entering the oversold area, indicating that there is still downside potential in the market.
KDJ: K=57.56, D=48.33, J=76.02. The KDJ indicators show that the K line and D line are in a neutral zone, with the J line slightly above the K line and D line, indicating a potential slight rebound in the short term, but the overall trend remains weak.
Indicator Data:
Funding Rate: 0.00415500%. The funding rate is in a neutral zone, with no obvious bullish or bearish sentiment, and has limited impact on prices in the short term.
Volume Change: Recent trading volume has shown fluctuations, but overall volume levels are low, indicating low market participation, likely maintaining a bearish consolidation trend in the short term.
Capital Flow Data: The net inflow and outflow of contract funds indicate that there has been significant capital outflow in the short term, suggesting that market capital is withdrawing, and may continue to decline in the short term.
Analysis Result
Direction: Cautiously Short
Entry Timing: It is recommended to enter short when the price rebounds to around 1600 USDT, confirming with the resistance levels of MA5 and MA10.
Stop Loss Setting: Set the stop loss at 1650 USDT, approximately a 3% stop loss ratio.
Target Price: Set the target price at 1474.67 USDT, with an expected return of about 8%.
Note: This analysis is for reference only and does not constitute any investment advice!