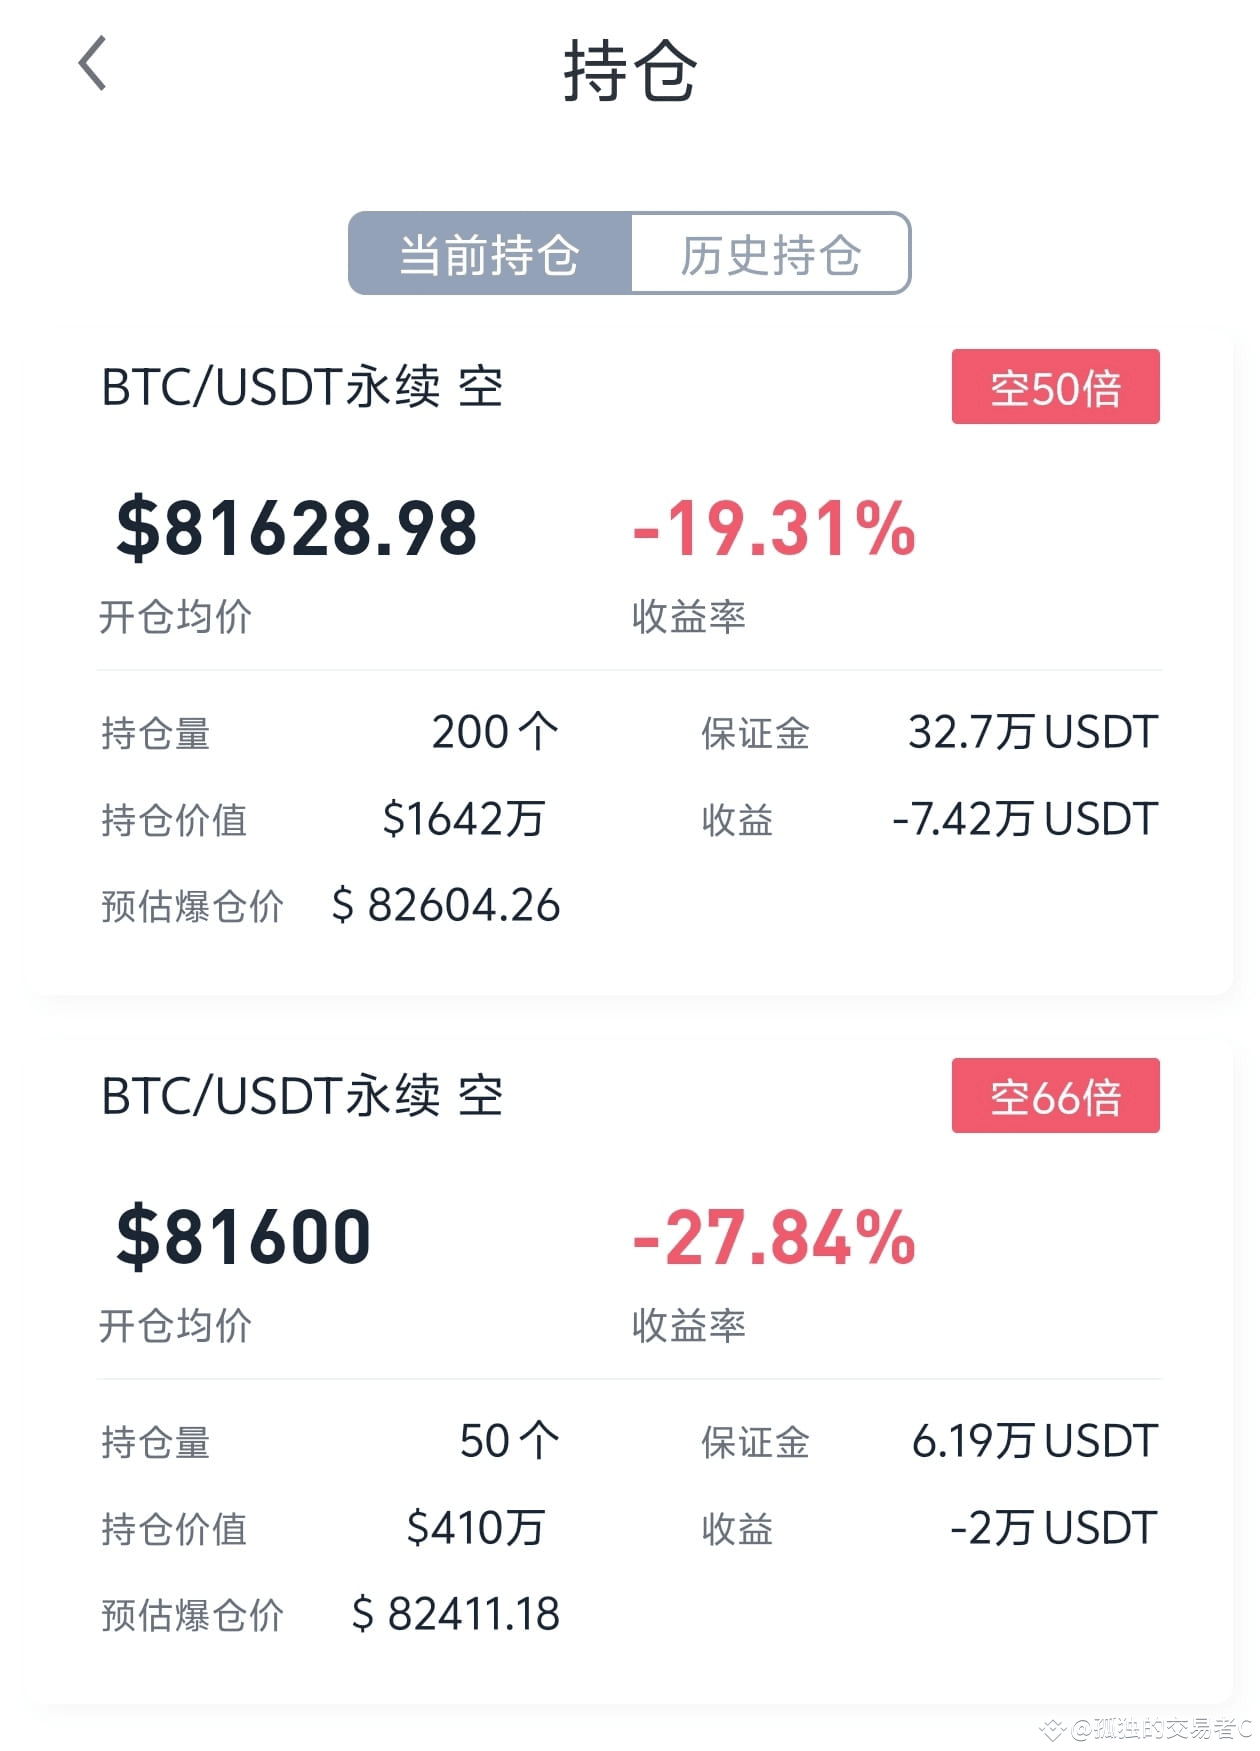
$BTC
Based on the current market dynamics and technical indicators analysis, Bitcoin (BTC) is showing the following characteristics and predictions for the four-hour chart on April 10, 2025:
Market Overview
After a morning peak of 83500, the Bitcoin price has retreated to around 82200, currently in a neutral range on the four-hour chart, intensifying the contest between bulls and bears. The daily MACD is converging negatively, the RSI has rebounded to 49.27, showing short-term rebound momentum but has not yet formed a clear trend.
Key Support and Resistance
- Resistance Levels: 83500-84000 (Bollinger Band upper track and EMA180 range)
- Support Levels: 80000-81000 (EMA300 and previous low pattern support)
Technical Indicator Signals
1. MACD: The DIF and DEA golden cross is expanding, but the histogram remains below the 0 axis, indicating a weak rebound.
2. KDJ: The J value has entered the overbought range, caution is needed for a potential correction.
3. Bollinger Bands: The convergence trend is obvious, with the price approaching the middle track at 83500; a breakout may accelerate the directional choice.
Operation Strategy Recommendations
- Bullish: If the price stabilizes above 81000 and breaks through 83500, a light long position can be taken, targeting 84000-85000, with a stop loss at 80500.
- Bearish: Short when there is resistance during a rebound to the 83500-84000 range, targeting 82000-80000, with a stop loss at 84500.
- Breakout Strategy: If there is a volume breakout above 84000, it may surge to 86000; if it drops below 80000, caution is needed for a correction to 77000 or even lower.
Risk Warning
The current market is significantly affected by tariff policies and macroeconomic data (such as CPI), with increasing volatility. Light position trading is recommended, with strict stop losses, and attention should be paid to real-time news changes.
Based on the current market dynamics and technical indicators analysis, Bitcoin (BTC) is showing the following characteristics and predictions for the four-hour chart on April 10, 2025:
Market Overview
After a morning peak of 83500, the Bitcoin price has retreated to around 82200, currently in a neutral range on the four-hour chart, intensifying the contest between bulls and bears. The daily MACD is converging negatively, the RSI has rebounded to 49.27, showing short-term rebound momentum but has not yet formed a clear trend.
Key Support and Resistance
- Resistance Levels: 83500-84000 (Bollinger Band upper track and EMA180 range)
- Support Levels: 80000-81000 (EMA300 and previous low pattern support)
Technical Indicator Signals
1. MACD: The DIF and DEA golden cross is expanding, but the histogram remains below the 0 axis, indicating a weak rebound.
2. KDJ: The J value has entered the overbought range, caution is needed for a potential correction.
3. Bollinger Bands: The convergence trend is obvious, with the price approaching the middle track at 83500; a breakout may accelerate the directional choice.
Operation Strategy Recommendations
- Bullish: If the price stabilizes above 81000 and breaks through 83500, a light long position can be taken, targeting 84000-85000, with a stop loss at 80500.
- Bearish: Short when there is resistance during a rebound to the 83500-84000 range, targeting 82000-80000, with a stop loss at 84500.
- Breakout Strategy: If there is a volume breakout above 84000, it may surge to 86000; if it drops below 80000, caution is needed for a correction to 77000 or even lower.
Risk Warning
The current market is significantly affected by tariff policies and macroeconomic data (such as CPI), with increasing volatility. Light position trading is recommended, with strict stop losses, and attention should be paid to real-time news changes.