

Herculis Gold Coin XAUH
100 投稿

Herculis Gold Coin XAUH
報告
ユーザーをブロック
XAUH is a payment crypto token fully backed by LBMA-certified fine gold bullion (999.9 purity), refined in Switzerland and listed on DEX and CEX.
4 フォロー
32 フォロワー
143 いいね
投稿
すべて
引用
動画
翻訳参照
$XAUH is now available on ChangeNOW!
A major step forward in expanding global access to tokenized physical gold.
ChangeNOW, operating since 2017, has built a global crypto ecosystem serving:
10M+ users worldwide 175 countries
5,000+ API partners
50,000+ exchanges every day
CghangeNow, this global infrastructure provides another gateway to $XAUH— a digital asset backed 1:1 by 1 gram of Swiss LBMA 999.9 fine gold, securely stored and insured in Switzerland.
Physical gold backing 24/7 digital access.
Easy crypto swaps.
Greater global accessibility.
The ChangeNOW ecosystem supports 1,000+ crypto assets, while its listing infrastructure connects assets with thousands of partners and millions of users.
Physical gold.
Digital mobility.
Global access.
$XAUH is now available on ChangeNOW!
A major step forward in expanding global access to tokenized physical gold.
ChangeNOW, operating since 2017, has built a global crypto ecosystem serving:
10M+ users worldwide 175 countries
5,000+ API partners
50,000+ exchanges every day
CghangeNow, this global infrastructure provides another gateway to $XAUH— a digital asset backed 1:1 by 1 gram of Swiss LBMA 999.9 fine gold, securely stored and insured in Switzerland.
Physical gold backing 24/7 digital access.
Easy crypto swaps.
Greater global accessibility.
The ChangeNOW ecosystem supports 1,000+ crypto assets, while its listing infrastructure connects assets with thousands of partners and millions of users.
Physical gold.
Digital mobility.
Global access.
A major step forward in expanding global access to tokenized physical gold.
ChangeNOW, operating since 2017, has built a global crypto ecosystem serving:
10M+ users worldwide 175 countries
5,000+ API partners
50,000+ exchanges every day
CghangeNow, this global infrastructure provides another gateway to $XAUH— a digital asset backed 1:1 by 1 gram of Swiss LBMA 999.9 fine gold, securely stored and insured in Switzerland.
Physical gold backing 24/7 digital access.
Easy crypto swaps.
Greater global accessibility.
The ChangeNOW ecosystem supports 1,000+ crypto assets, while its listing infrastructure connects assets with thousands of partners and millions of users.
Physical gold.
Digital mobility.
Global access.

5
翻訳参照
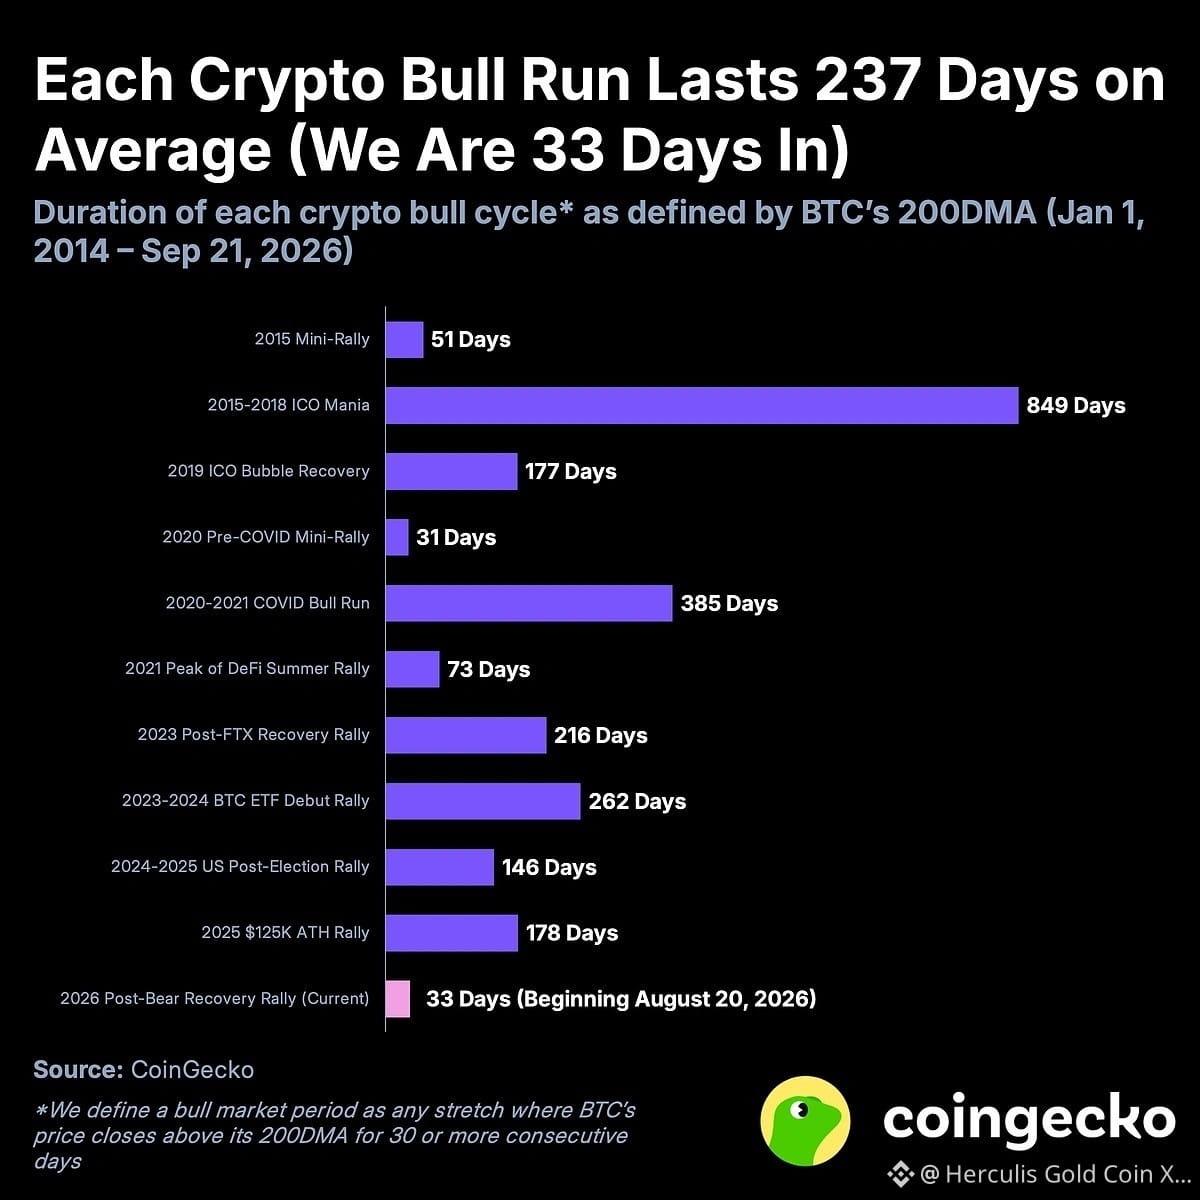
Bitcoin climbed as high as $87,158 on last week, up more than 25% since the latest bull cycle began on August 20, 2026. Historical data shows that Bitcoin bull cycles have lasted 169 days on average when excluding one unusually long cycle, with BTC gaining +130.5% from start to peak on average. This is Bitcoin's 11th bull market since 2014. Bitcoin closed above its 200-day moving average on August 20, bringing the 2025–2026 bear market to an end after 290 days. Using the inverse the bear market definition, we consider Bitcoin to be in a bull cycle when it trades above its 200-day moving average for at least 30 consecutive days. Across nine completed cycles since 2014, Bitcoin rose an average of +130.5% from the start of each bull cycle to its peak, excluding the extreme 2015–2018 rally.
Bitcoin climbed as high as $87,158 on last week, up more than 25% since the latest bull cycle began on August 20, 2026. Historical data shows that Bitcoin bull cycles have lasted 169 days on average when excluding one unusually long cycle, with BTC gaining +130.5% from start to peak on average. This is Bitcoin's 11th bull market since 2014. Bitcoin closed above its 200-day moving average on August 20, bringing the 2025–2026 bear market to an end after 290 days. Using the inverse the bear market definition, we consider Bitcoin to be in a bull cycle when it trades above its 200-day moving average for at least 30 consecutive days. Across nine completed cycles since 2014, Bitcoin rose an average of +130.5% from the start of each bull cycle to its peak, excluding the extreme 2015–2018 rally.
1
104
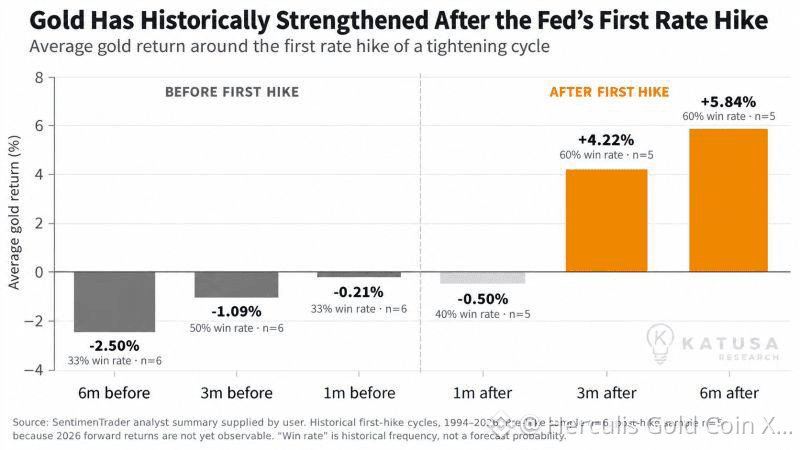
ゴールドは歴史的に、FRBの最初の利上げ後に強含む傾向があります。
金利引き締めとゴールドの関係は、しばしば誤解されています。一般的には「金利が高くなれば、ゴールドにとっては自動的にマイナスになるはずだ」と考えられがちです。しかし歴史は、より複雑な物語を示しています。
図のとおり、FRBの最初の利上げの前の数か月間は、先に市場が将来の金融引き締めを織り込むため、ゴールドは歴史的に弱含む傾向がありました。しかし最初の利上げの後は、このパターンが逆転する傾向にあります。
図に示された過去の引き締めサイクル全体を通じて:
利上げの6か月前:ゴールド平均 −2.50% / 3か月前:−1.09% / 1か月前:−0.21% / 1か月後:−0.50% / 3か月後:+4.22% / 6か月後:+5.84%
重要なのは、市場が先を見て動くということです。FRBが実際に金利を引き上げる時点では、引き締めに対する期待のかなりの部分が、すでにゴールド価格に反映されている可能性があります。
ゴールドは歴史的に、FRBの最初の利上げ後に強含む傾向があります。
金利引き締めとゴールドの関係は、しばしば誤解されています。一般的には「金利が高くなれば、ゴールドにとっては自動的にマイナスになるはずだ」と考えられがちです。しかし歴史は、より複雑な物語を示しています。
図のとおり、FRBの最初の利上げの前の数か月間は、先に市場が将来の金融引き締めを織り込むため、ゴールドは歴史的に弱含む傾向がありました。しかし最初の利上げの後は、このパターンが逆転する傾向にあります。
図に示された過去の引き締めサイクル全体を通じて:
利上げの6か月前:ゴールド平均 −2.50% / 3か月前:−1.09% / 1か月前:−0.21% / 1か月後:−0.50% / 3か月後:+4.22% / 6か月後:+5.84%
重要なのは、市場が先を見て動くということです。FRBが実際に金利を引き上げる時点では、引き締めに対する期待のかなりの部分が、すでにゴールド価格に反映されている可能性があります。
金利引き締めとゴールドの関係は、しばしば誤解されています。一般的には「金利が高くなれば、ゴールドにとっては自動的にマイナスになるはずだ」と考えられがちです。しかし歴史は、より複雑な物語を示しています。
図のとおり、FRBの最初の利上げの前の数か月間は、先に市場が将来の金融引き締めを織り込むため、ゴールドは歴史的に弱含む傾向がありました。しかし最初の利上げの後は、このパターンが逆転する傾向にあります。
図に示された過去の引き締めサイクル全体を通じて:
利上げの6か月前:ゴールド平均 −2.50% / 3か月前:−1.09% / 1か月前:−0.21% / 1か月後:−0.50% / 3か月後:+4.22% / 6か月後:+5.84%
重要なのは、市場が先を見て動くということです。FRBが実際に金利を引き上げる時点では、引き締めに対する期待のかなりの部分が、すでにゴールド価格に反映されている可能性があります。
1
148
翻訳参照
Keeping purchasing power of money is hard. A simple cup of coffee tells the story. If a coffee cost €1.00 in January 2002, that same euro would have needed to grow to roughly €1.69 by July 2026 just to preserve its purchasing power, based on Eurostat’s euro-area HICP illustration. That is the quiet effect of inflation: your account balance may stay the same while the amount it can buy gradually declines. For investors, the lesson is straightforward. Preserving wealth is not only about avoiding losses in nominal terms — it is about generating returns that protect purchasing power over time.
Keeping purchasing power of money is hard. A simple cup of coffee tells the story. If a coffee cost €1.00 in January 2002, that same euro would have needed to grow to roughly €1.69 by July 2026 just to preserve its purchasing power, based on Eurostat’s euro-area HICP illustration. That is the quiet effect of inflation: your account balance may stay the same while the amount it can buy gradually declines. For investors, the lesson is straightforward. Preserving wealth is not only about avoiding losses in nominal terms — it is about generating returns that protect purchasing power over time.
1
341
翻訳参照
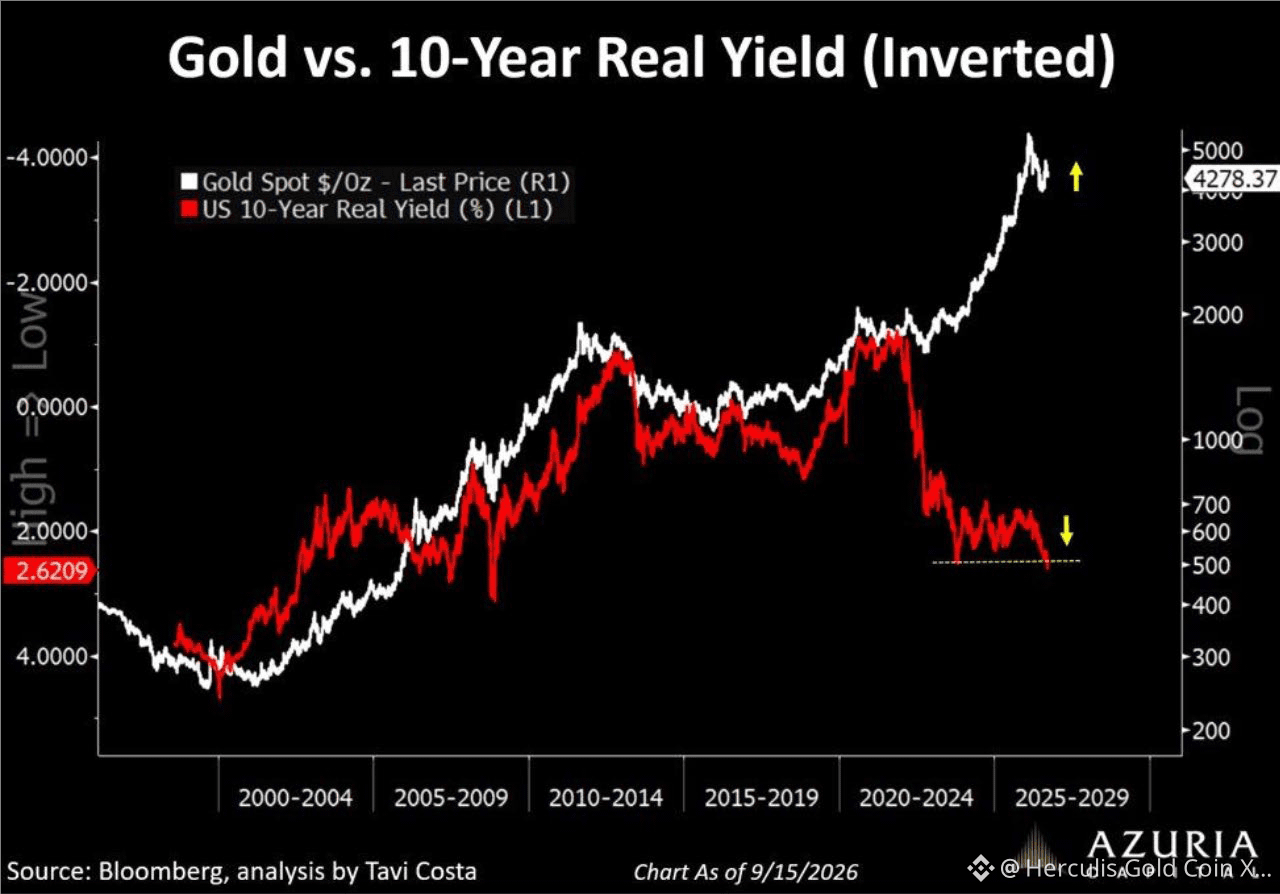
For decades, the rule was simple: rising real rates meant falling gold prices. This relationship worked because Treasuries served as the ultimate collateral—politically neutral and financially liquid. Since the freezing of Russian reserves in 2022, that neutrality has vanished. A dollar-denominated asset is no longer just a claim on the U.S.; it is also a claim subject to U.S. jurisdiction.
Gold is therefore no longer purchased solely as a hedge against inflation. It is acquired as collateral, without sanctions risk. This is why gold can rise alongside real interest rates. It is not a correlation anomaly. It is a revaluation of the political risk embedded in foreign exchange reserves.
And no one understands this shift better than Beijing. China’s officially reported holdings of Treasuries fell to $618 billion in July, their lowest level since August 2008, down from more than $1,300 billion at their peak in November 2013.
China is not engaging in a dramatic sell-off, as it has no interest in collapsing the asset it is divesting. It is orchestrating a slow, disciplined, and strategic shift toward gold, agency bonds, certain real assets, and its own financial ecosystem. Investors should follow suit.
China is not betting on the sudden collapse of the U.S.; it is protecting itself against the gradual erosion of the U.S.’s privilege. It isn’t selling a price. It’s selling a dependency.
For decades, the rule was simple: rising real rates meant falling gold prices. This relationship worked because Treasuries served as the ultimate collateral—politically neutral and financially liquid. Since the freezing of Russian reserves in 2022, that neutrality has vanished. A dollar-denominated asset is no longer just a claim on the U.S.; it is also a claim subject to U.S. jurisdiction.
Gold is therefore no longer purchased solely as a hedge against inflation. It is acquired as collateral, without sanctions risk. This is why gold can rise alongside real interest rates. It is not a correlation anomaly. It is a revaluation of the political risk embedded in foreign exchange reserves.
And no one understands this shift better than Beijing. China’s officially reported holdings of Treasuries fell to $618 billion in July, their lowest level since August 2008, down from more than $1,300 billion at their peak in November 2013.
China is not engaging in a dramatic sell-off, as it has no interest in collapsing the asset it is divesting. It is orchestrating a slow, disciplined, and strategic shift toward gold, agency bonds, certain real assets, and its own financial ecosystem. Investors should follow suit.
China is not betting on the sudden collapse of the U.S.; it is protecting itself against the gradual erosion of the U.S.’s privilege. It isn’t selling a price. It’s selling a dependency.
Gold is therefore no longer purchased solely as a hedge against inflation. It is acquired as collateral, without sanctions risk. This is why gold can rise alongside real interest rates. It is not a correlation anomaly. It is a revaluation of the political risk embedded in foreign exchange reserves.
And no one understands this shift better than Beijing. China’s officially reported holdings of Treasuries fell to $618 billion in July, their lowest level since August 2008, down from more than $1,300 billion at their peak in November 2013.
China is not engaging in a dramatic sell-off, as it has no interest in collapsing the asset it is divesting. It is orchestrating a slow, disciplined, and strategic shift toward gold, agency bonds, certain real assets, and its own financial ecosystem. Investors should follow suit.
China is not betting on the sudden collapse of the U.S.; it is protecting itself against the gradual erosion of the U.S.’s privilege. It isn’t selling a price. It’s selling a dependency.
1
163
インドにおける金との関係が変化している:投資が宝飾品を上回る
長年にわたり、インドは金のジュエリーと同義でした。しかし最新のデータは重要な転換を示しています。インド人はジュエリーとしてだけでなく、投資として金を買う割合がますます高まっているのです。
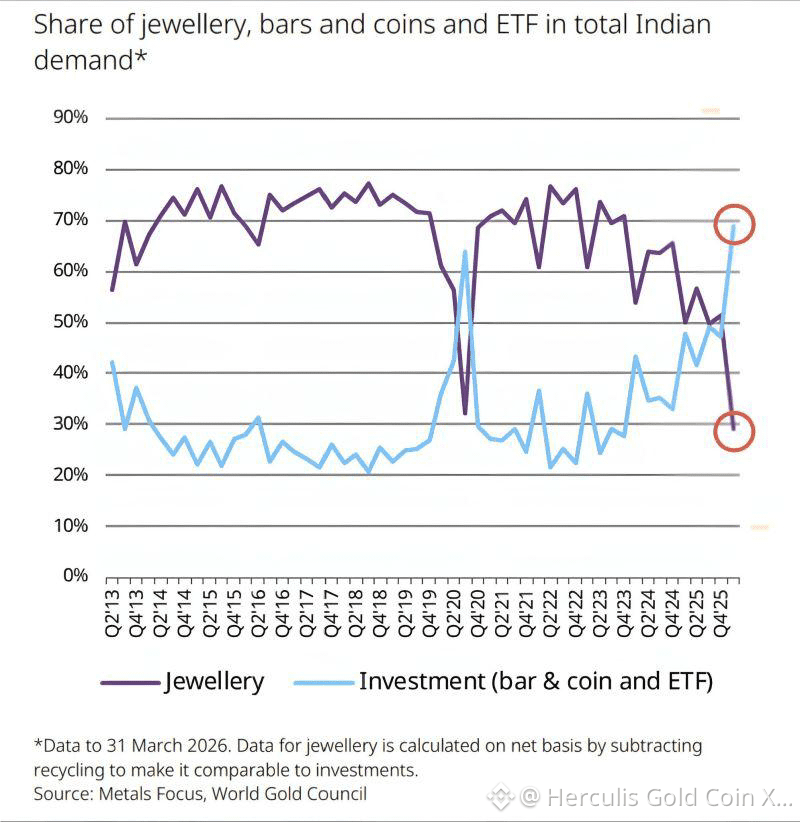
2026年Q1には、金地金、コイン、ETFにおける投資需要が82トンに達し、前年同期比で54%増となりました。一方でジュエリー需要は66トンでした。図に用いられている比較可能なネットベースでは、投資がインドの金需要のほぼ70%を占め、ジュエリーは約30%まで低下しています——これは世界金協会のデータで2000年まで遡っても最も低い構成比です。
物理市場の変化は特に際立っています。インド人は棒状地金(バー)とコインを62トン購入し、前年同期比34%増、2013年以来で最も強い第1四半期となりました。金ETFもさらに記録的に20トン追加され、3月末までのETF保有残高は115トンに達しました。
これは、インド人の金の買い方が変わったというだけではありません。金を所有する「理由」が変わっているのです。
この動きは、金に対する長期的な強気見通しをさらに後押しします。インドは世界最大級の金市場の一つであり、ジュエリーから地金、コイン、ETF、そしてデジタル形態の金へという構造的なシフトが進めば、需要はますます投資主導となり、上昇局面では価格に敏感になり得ます。
当社としては、多様化されたポートフォリオにおいて金の配分を戦略的に5〜10%維持し、急騰を追いかけるのではなく、意味のある価格調整を活用してポジションを構築します。
図からのより大きなメッセージは明確です。インドにおける金は、身につけるものから、投資するものへと進化しています。
インドにおける金との関係が変化している:投資が宝飾品を上回る
長年にわたり、インドは金のジュエリーと同義でした。しかし最新のデータは重要な転換を示しています。インド人はジュエリーとしてだけでなく、投資として金を買う割合がますます高まっているのです。
2026年Q1には、金地金、コイン、ETFにおける投資需要が82トンに達し、前年同期比で54%増となりました。一方でジュエリー需要は66トンでした。図に用いられている比較可能なネットベースでは、投資がインドの金需要のほぼ70%を占め、ジュエリーは約30%まで低下しています——これは世界金協会のデータで2000年まで遡っても最も低い構成比です。
物理市場の変化は特に際立っています。インド人は棒状地金(バー)とコインを62トン購入し、前年同期比34%増、2013年以来で最も強い第1四半期となりました。金ETFもさらに記録的に20トン追加され、3月末までのETF保有残高は115トンに達しました。
これは、インド人の金の買い方が変わったというだけではありません。金を所有する「理由」が変わっているのです。
この動きは、金に対する長期的な強気見通しをさらに後押しします。インドは世界最大級の金市場の一つであり、ジュエリーから地金、コイン、ETF、そしてデジタル形態の金へという構造的なシフトが進めば、需要はますます投資主導となり、上昇局面では価格に敏感になり得ます。
当社としては、多様化されたポートフォリオにおいて金の配分を戦略的に5〜10%維持し、急騰を追いかけるのではなく、意味のある価格調整を活用してポジションを構築します。
図からのより大きなメッセージは明確です。インドにおける金は、身につけるものから、投資するものへと進化しています。
長年にわたり、インドは金のジュエリーと同義でした。しかし最新のデータは重要な転換を示しています。インド人はジュエリーとしてだけでなく、投資として金を買う割合がますます高まっているのです。
2026年Q1には、金地金、コイン、ETFにおける投資需要が82トンに達し、前年同期比で54%増となりました。一方でジュエリー需要は66トンでした。図に用いられている比較可能なネットベースでは、投資がインドの金需要のほぼ70%を占め、ジュエリーは約30%まで低下しています——これは世界金協会のデータで2000年まで遡っても最も低い構成比です。
物理市場の変化は特に際立っています。インド人は棒状地金(バー)とコインを62トン購入し、前年同期比34%増、2013年以来で最も強い第1四半期となりました。金ETFもさらに記録的に20トン追加され、3月末までのETF保有残高は115トンに達しました。
これは、インド人の金の買い方が変わったというだけではありません。金を所有する「理由」が変わっているのです。
この動きは、金に対する長期的な強気見通しをさらに後押しします。インドは世界最大級の金市場の一つであり、ジュエリーから地金、コイン、ETF、そしてデジタル形態の金へという構造的なシフトが進めば、需要はますます投資主導となり、上昇局面では価格に敏感になり得ます。
当社としては、多様化されたポートフォリオにおいて金の配分を戦略的に5〜10%維持し、急騰を追いかけるのではなく、意味のある価格調整を活用してポジションを構築します。
図からのより大きなメッセージは明確です。インドにおける金は、身につけるものから、投資するものへと進化しています。
1
169
翻訳参照
Worried that US stocks are in a bubble? A bubble can keep inflating for months, sometimes years. Calling it a bubble tells you very little about how much upside is left before it bursts. That is the uncomfortable part of the investment decision. Take the Nasdaq-100. Since the beginning of 2020, it had gained around 233% (as of 10 September 2026 COB). Over the equivalent period starting in 1991, the gain was around 450%. And the 1990s rally was far from finished. From that point in September 1997, the index rose another 327% before reaching its March 2000 peak. Then it lost 83% by October 2002.
Worried that US stocks are in a bubble? A bubble can keep inflating for months, sometimes years. Calling it a bubble tells you very little about how much upside is left before it bursts. That is the uncomfortable part of the investment decision. Take the Nasdaq-100. Since the beginning of 2020, it had gained around 233% (as of 10 September 2026 COB). Over the equivalent period starting in 1991, the gain was around 450%. And the 1990s rally was far from finished. From that point in September 1997, the index rose another 327% before reaching its March 2000 peak. Then it lost 83% by October 2002.
1
112
翻訳参照
Taiwan Semiconductor Manufacturing Company (TSMC) now represents an extraordinary 41.4% of the entire Taiwan Stock Exchange’s market capitalization.
The transformation has been remarkable: TSMC’s share of Taiwan’s equity market increased from 16.3% in 2016 to 22.7% in 2019, 28.9% in 2021, 38.3% in 2025, and approximately 41.4% by August 2026.
TSMC sits at the center of the global semiconductor ecosystem and is one of the principal beneficiaries of the AI infrastructure boom.
Taiwan Semiconductor Manufacturing Company (TSMC) now represents an extraordinary 41.4% of the entire Taiwan Stock Exchange’s market capitalization.
The transformation has been remarkable: TSMC’s share of Taiwan’s equity market increased from 16.3% in 2016 to 22.7% in 2019, 28.9% in 2021, 38.3% in 2025, and approximately 41.4% by August 2026.
TSMC sits at the center of the global semiconductor ecosystem and is one of the principal beneficiaries of the AI infrastructure boom.
The transformation has been remarkable: TSMC’s share of Taiwan’s equity market increased from 16.3% in 2016 to 22.7% in 2019, 28.9% in 2021, 38.3% in 2025, and approximately 41.4% by August 2026.
TSMC sits at the center of the global semiconductor ecosystem and is one of the principal beneficiaries of the AI infrastructure boom.
1
1
250
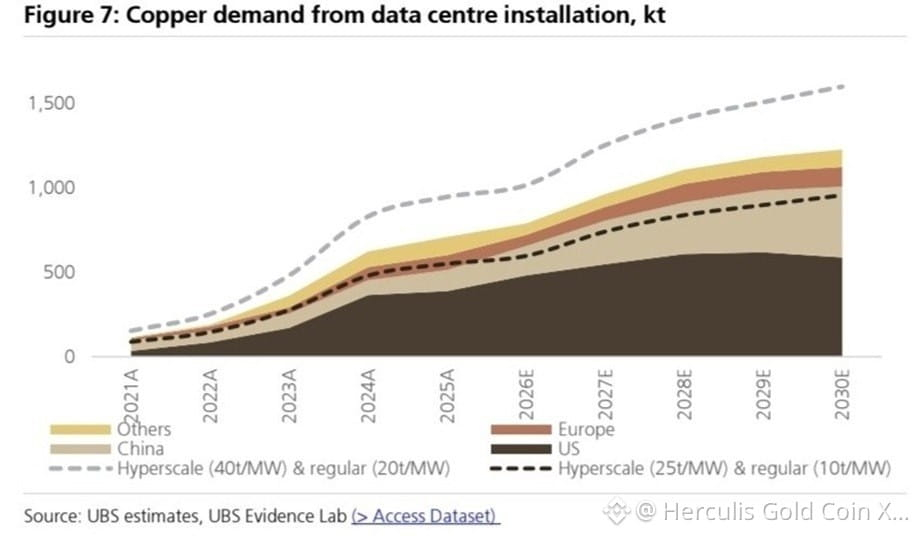
UBSによると、データセンターからの銅需要は、AIインフラの急速な拡大によって、すでに需給が逼迫している市場に新たな主要な需要源が加わるため、2030年までに大幅に増加すると見込まれています。
同時に、手に入りやすく低コストな銅の時代は終わりに近づいているようです。多くの新しい鉱床は遠隔地に位置しているか、極めて深い場所にあり、あるいは品位の低い鉱石を含んでいるため、今後の生産はますます高コスト化する見通しです。新規の採掘プロジェクトもまた、既存鉱山における自然な生産減少分を十分に相殺できない可能性があり、世界的な供給には継続的な圧力がかかります。
銅価格は、こうした引き締まりの環境にすでに反応しており、最近では1トン当たり約14,800ドルの水準で過去最高値に到達しました。
しかし、長期の投資判断はAIにとどまりません。供給が停滞する中で、再生可能エネルギー、電気自動車、巨大な規模の送電網への投資といった世界的なエネルギー転換により、銅需要は引き続き増加しています。さらに、AIデータセンターの爆発的な拡大が、構造的な需要の追加要因を生み出しています。
当社は3〜5年の投資期間において、銅に対して構造的に強気の見方を維持しています。ただし、最近の過去最高値への上昇を受けて、現在の価格で金属を積極的に追いかけることは避けるべきだと考えます。
株式の中では、既存の埋蔵量が大きく、生産コストが比較的低い、高品質な生産者を優先したいと考えます。さらに、グリーンフィールド案件だけに頼らずに増産できる能力がある企業が望ましいでしょう。Freeport-McMoRan、BHP、Rio Tinto、Antofagasta、Lundin Miningは、特に追加の分析に値する有望な候補です。
UBSによると、データセンターからの銅需要は、AIインフラの急速な拡大によって、すでに需給が逼迫している市場に新たな主要な需要源が加わるため、2030年までに大幅に増加すると見込まれています。
同時に、手に入りやすく低コストな銅の時代は終わりに近づいているようです。多くの新しい鉱床は遠隔地に位置しているか、極めて深い場所にあり、あるいは品位の低い鉱石を含んでいるため、今後の生産はますます高コスト化する見通しです。新規の採掘プロジェクトもまた、既存鉱山における自然な生産減少分を十分に相殺できない可能性があり、世界的な供給には継続的な圧力がかかります。
銅価格は、こうした引き締まりの環境にすでに反応しており、最近では1トン当たり約14,800ドルの水準で過去最高値に到達しました。
しかし、長期の投資判断はAIにとどまりません。供給が停滞する中で、再生可能エネルギー、電気自動車、巨大な規模の送電網への投資といった世界的なエネルギー転換により、銅需要は引き続き増加しています。さらに、AIデータセンターの爆発的な拡大が、構造的な需要の追加要因を生み出しています。
当社は3〜5年の投資期間において、銅に対して構造的に強気の見方を維持しています。ただし、最近の過去最高値への上昇を受けて、現在の価格で金属を積極的に追いかけることは避けるべきだと考えます。
株式の中では、既存の埋蔵量が大きく、生産コストが比較的低い、高品質な生産者を優先したいと考えます。さらに、グリーンフィールド案件だけに頼らずに増産できる能力がある企業が望ましいでしょう。Freeport-McMoRan、BHP、Rio Tinto、Antofagasta、Lundin Miningは、特に追加の分析に値する有望な候補です。
同時に、手に入りやすく低コストな銅の時代は終わりに近づいているようです。多くの新しい鉱床は遠隔地に位置しているか、極めて深い場所にあり、あるいは品位の低い鉱石を含んでいるため、今後の生産はますます高コスト化する見通しです。新規の採掘プロジェクトもまた、既存鉱山における自然な生産減少分を十分に相殺できない可能性があり、世界的な供給には継続的な圧力がかかります。
銅価格は、こうした引き締まりの環境にすでに反応しており、最近では1トン当たり約14,800ドルの水準で過去最高値に到達しました。
しかし、長期の投資判断はAIにとどまりません。供給が停滞する中で、再生可能エネルギー、電気自動車、巨大な規模の送電網への投資といった世界的なエネルギー転換により、銅需要は引き続き増加しています。さらに、AIデータセンターの爆発的な拡大が、構造的な需要の追加要因を生み出しています。
当社は3〜5年の投資期間において、銅に対して構造的に強気の見方を維持しています。ただし、最近の過去最高値への上昇を受けて、現在の価格で金属を積極的に追いかけることは避けるべきだと考えます。
株式の中では、既存の埋蔵量が大きく、生産コストが比較的低い、高品質な生産者を優先したいと考えます。さらに、グリーンフィールド案件だけに頼らずに増産できる能力がある企業が望ましいでしょう。Freeport-McMoRan、BHP、Rio Tinto、Antofagasta、Lundin Miningは、特に追加の分析に値する有望な候補です。
1
143
欧州のゴールドETFが過去最高の79億ドルを集めた
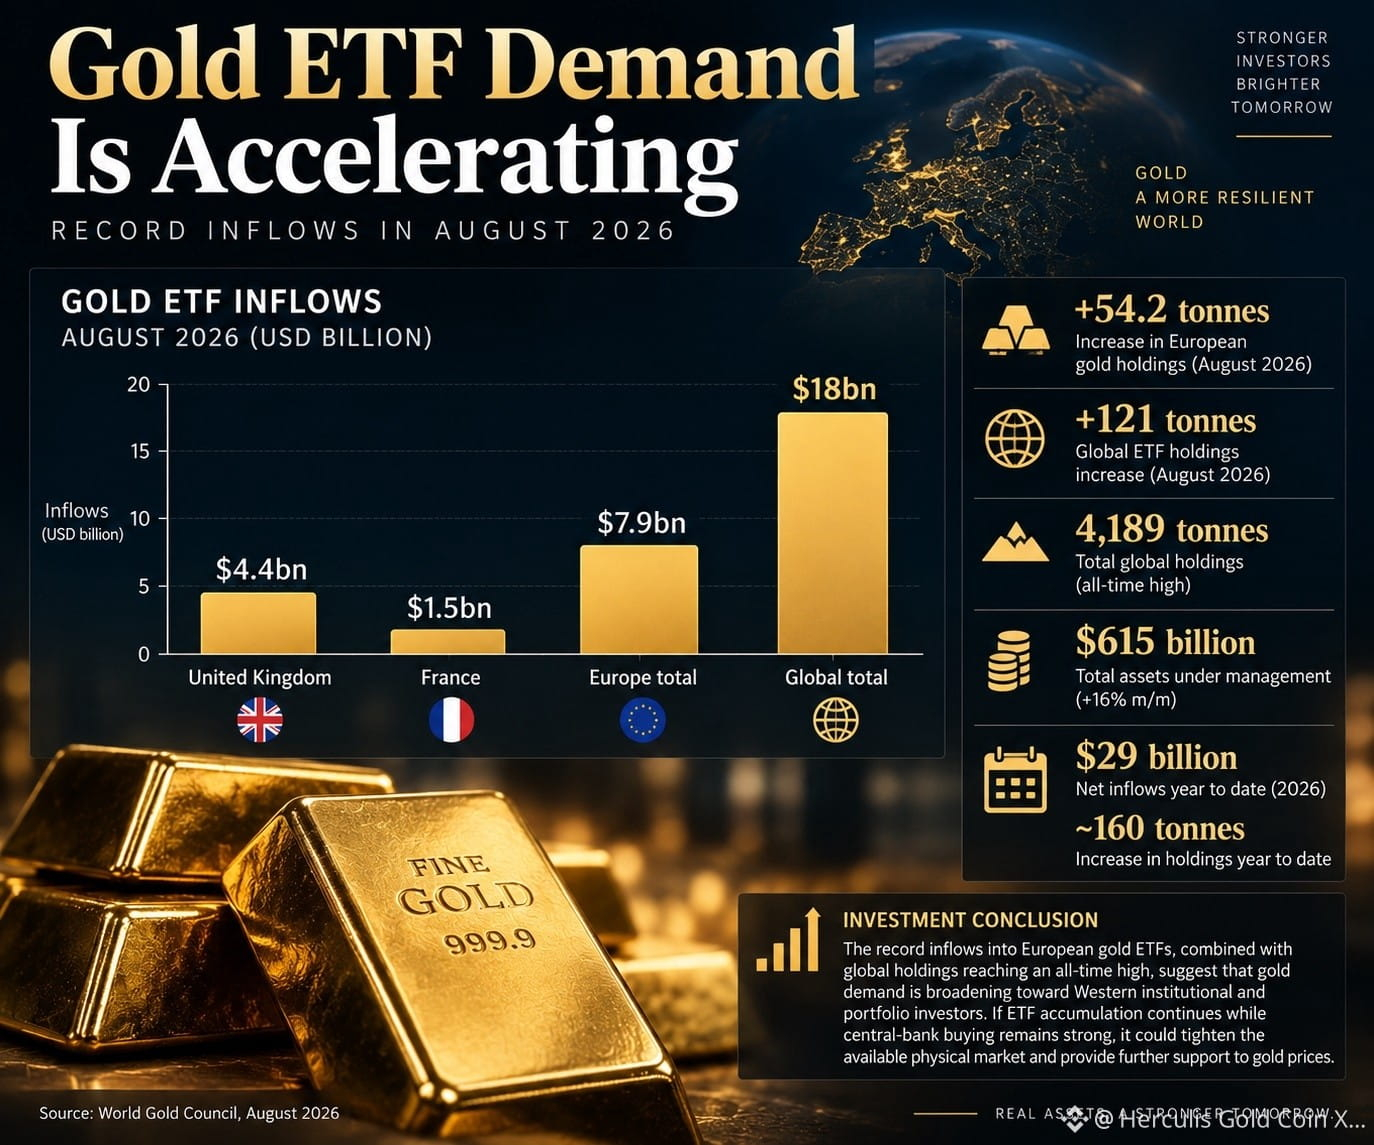
2026年8月、実物金に裏付けられた欧州の上場投資信託(ETF)が過去最高の79億ドルを集め、保有金が54.2トン増加した。これは世界金委員会(WGC)の報告によるもの。流入額の最大のシェアは英国で、44億ドルを計上しており、同国の記録上2番目に大きい月次流入となった。フランスのファンドは15億ドルを集めた。
同機関によると、世界全体ではゴールドETFの流入が8月に180億ドルに達し、ドル建てでは記録上2番目に大きい月次流入だった。強い投資家の資金流入と金価格の上昇を背景に、運用資産残高は月間で16%増加し、6,150億ドルになった。
世界のゴールドETF保有高は121トン増えて、過去最高の4,189トンとなった。年初からの累計では、ゴールドETFは純流入で290億ドルを集め、実物金の保有高は約160トン増加した。欧州のゴールドETFへの過去最高の流入に加え、世界の保有高が過去最高に到達したことは、金需要が中央銀行やアジアの投資家にとどまらず、西側の機関投資家やポートフォリオ投資家へと広がっていることを示唆している。
これは重要な構造シグナルだ。すなわち、ETFの積み増しが続き、中央銀行による買いが依然として強いなら、追加の投資需要によって利用可能な実物市場が締まり、金価格にさらなる下支えが加わる可能性がある。
欧州のゴールドETFが過去最高の79億ドルを集めた
2026年8月、実物金に裏付けられた欧州の上場投資信託(ETF)が過去最高の79億ドルを集め、保有金が54.2トン増加した。これは世界金委員会(WGC)の報告によるもの。流入額の最大のシェアは英国で、44億ドルを計上しており、同国の記録上2番目に大きい月次流入となった。フランスのファンドは15億ドルを集めた。
同機関によると、世界全体ではゴールドETFの流入が8月に180億ドルに達し、ドル建てでは記録上2番目に大きい月次流入だった。強い投資家の資金流入と金価格の上昇を背景に、運用資産残高は月間で16%増加し、6,150億ドルになった。
世界のゴールドETF保有高は121トン増えて、過去最高の4,189トンとなった。年初からの累計では、ゴールドETFは純流入で290億ドルを集め、実物金の保有高は約160トン増加した。欧州のゴールドETFへの過去最高の流入に加え、世界の保有高が過去最高に到達したことは、金需要が中央銀行やアジアの投資家にとどまらず、西側の機関投資家やポートフォリオ投資家へと広がっていることを示唆している。
これは重要な構造シグナルだ。すなわち、ETFの積み増しが続き、中央銀行による買いが依然として強いなら、追加の投資需要によって利用可能な実物市場が締まり、金価格にさらなる下支えが加わる可能性がある。
2026年8月、実物金に裏付けられた欧州の上場投資信託(ETF)が過去最高の79億ドルを集め、保有金が54.2トン増加した。これは世界金委員会(WGC)の報告によるもの。流入額の最大のシェアは英国で、44億ドルを計上しており、同国の記録上2番目に大きい月次流入となった。フランスのファンドは15億ドルを集めた。
同機関によると、世界全体ではゴールドETFの流入が8月に180億ドルに達し、ドル建てでは記録上2番目に大きい月次流入だった。強い投資家の資金流入と金価格の上昇を背景に、運用資産残高は月間で16%増加し、6,150億ドルになった。
世界のゴールドETF保有高は121トン増えて、過去最高の4,189トンとなった。年初からの累計では、ゴールドETFは純流入で290億ドルを集め、実物金の保有高は約160トン増加した。欧州のゴールドETFへの過去最高の流入に加え、世界の保有高が過去最高に到達したことは、金需要が中央銀行やアジアの投資家にとどまらず、西側の機関投資家やポートフォリオ投資家へと広がっていることを示唆している。
これは重要な構造シグナルだ。すなわち、ETFの積み増しが続き、中央銀行による買いが依然として強いなら、追加の投資需要によって利用可能な実物市場が締まり、金価格にさらなる下支えが加わる可能性がある。
1
189
🚀 Herculis Gold Coin($XAUH)のさらなるマイルストーン。
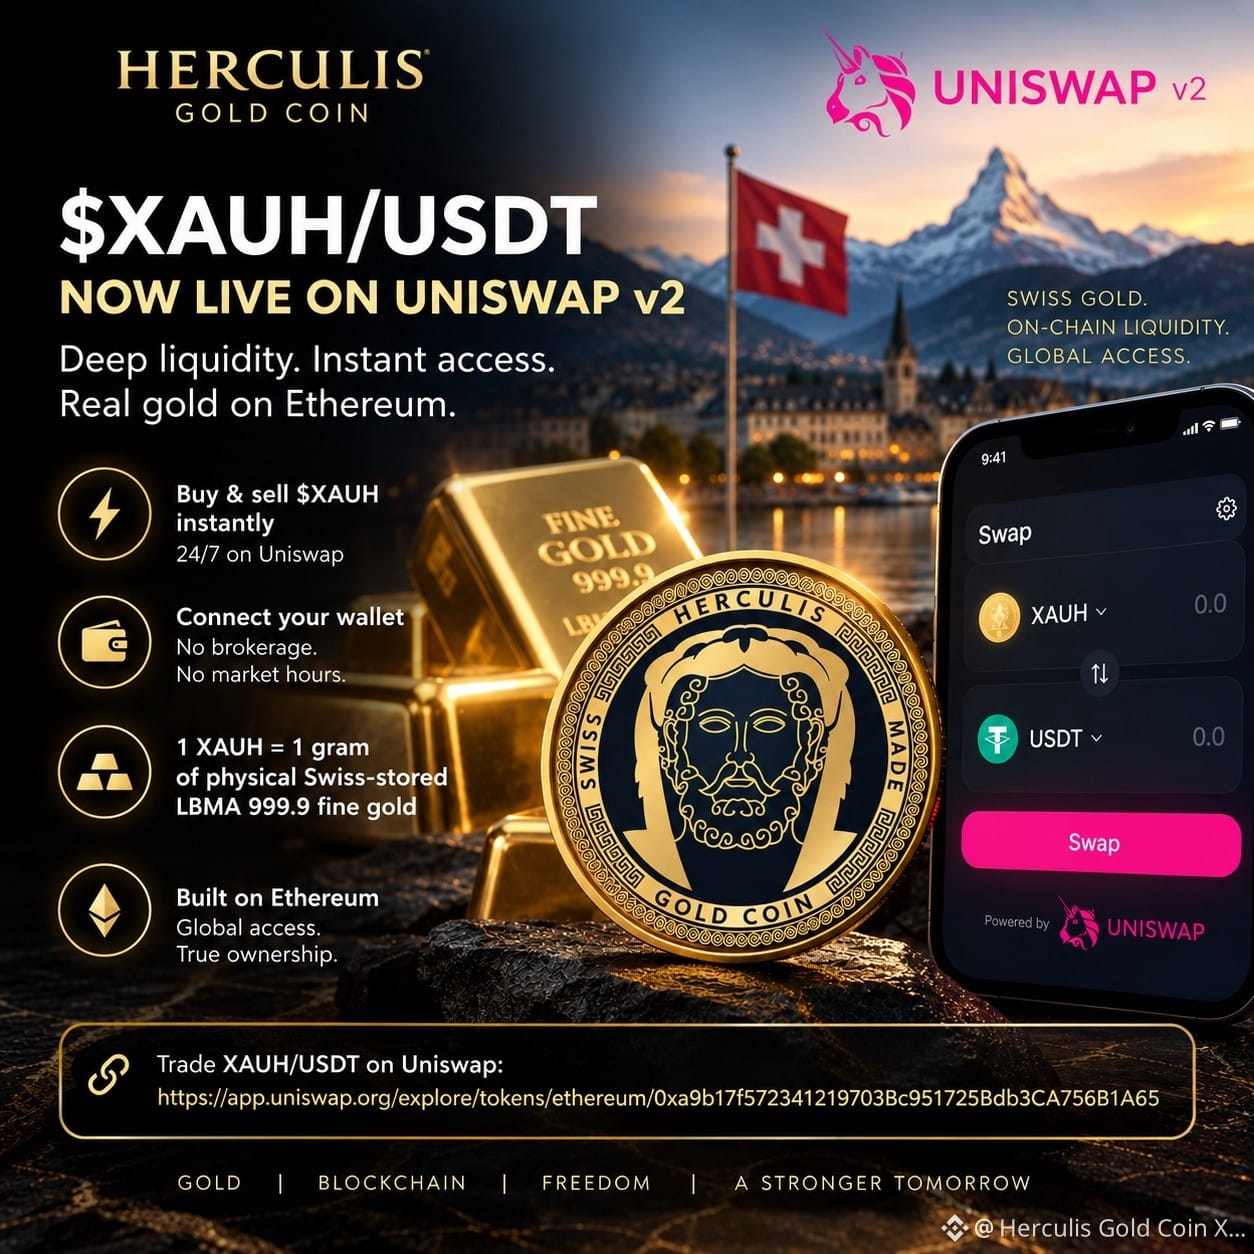
Uniswap v2でXAUH/USDTの流動性プールをローンチし、イーサリアム上の$XAUHに深いオンチェーン流動性をもたらすことをお知らせできて嬉しく思います。
イーサリアムの投資家は、Uniswapで$XAUHを今すぐ売買できるようになりました。自分のウォレットから、24時間365日いつでも利用可能です。
🪙 1 XAUH = 物理的なスイス保管LBMA 999.9の金1グラム
従来の仲介は不要。市場の営業時間制限もなし。ウォレットを接続するだけで、イーサリアム・エコシステムを通じて現物の金にアクセスできます。
🔗 UniswapでXAUH/USDTを取引:
スイスの金。オンチェーン流動性。グローバルなアクセス。
$XAUH #Gold #RWA #Tokenization #Ethereum #Uniswap #DeFi
🚀 Herculis Gold Coin($XAUH)のさらなるマイルストーン。
Uniswap v2でXAUH/USDTの流動性プールをローンチし、イーサリアム上の$XAUHに深いオンチェーン流動性をもたらすことをお知らせできて嬉しく思います。
イーサリアムの投資家は、Uniswapで$XAUHを今すぐ売買できるようになりました。自分のウォレットから、24時間365日いつでも利用可能です。
🪙 1 XAUH = 物理的なスイス保管LBMA 999.9の金1グラム
従来の仲介は不要。市場の営業時間制限もなし。ウォレットを接続するだけで、イーサリアム・エコシステムを通じて現物の金にアクセスできます。
🔗 UniswapでXAUH/USDTを取引:
スイスの金。オンチェーン流動性。グローバルなアクセス。
$XAUH #Gold #RWA #Tokenization #Ethereum #Uniswap #DeFi
Uniswap v2でXAUH/USDTの流動性プールをローンチし、イーサリアム上の$XAUHに深いオンチェーン流動性をもたらすことをお知らせできて嬉しく思います。
イーサリアムの投資家は、Uniswapで$XAUHを今すぐ売買できるようになりました。自分のウォレットから、24時間365日いつでも利用可能です。
🪙 1 XAUH = 物理的なスイス保管LBMA 999.9の金1グラム
従来の仲介は不要。市場の営業時間制限もなし。ウォレットを接続するだけで、イーサリアム・エコシステムを通じて現物の金にアクセスできます。
🔗 UniswapでXAUH/USDTを取引:
スイスの金。オンチェーン流動性。グローバルなアクセス。
$XAUH #Gold #RWA #Tokenization #Ethereum #Uniswap #DeFi
1
68
翻訳参照
Robinhood is having a monster day.
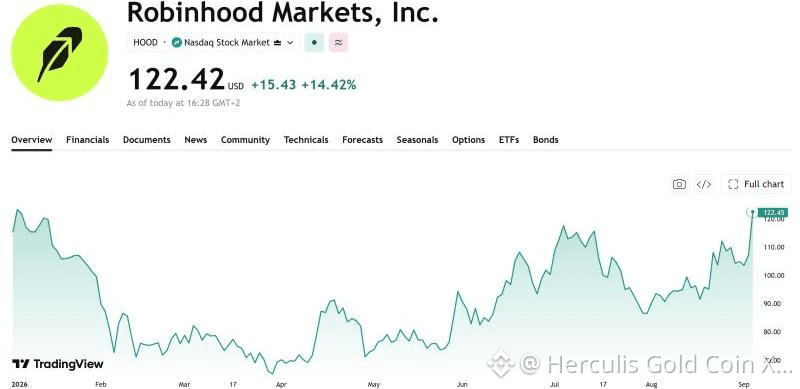
$HOOD surged 13% as Robinhood Chain smashed its previous records, generating approximately $4 million in onchain revenue on September 2—more than any other blockchain that day. Its ambition is to bring stocks, ETFs, private assets and other real-world assets onchain—enabling 24/7 trading, self-custody, lending and integration with decentralized finance. Morgan Stanley just upgraded $HOOD to Overweight with a $150 price target, while Scotiabank initiated coverage with a Sector Outperform rating. Robinhood is increasingly evolving from a retail brokerage into a vertically integrated onchain financial infrastructure platform. If Robinhood Chain succeeds in moving meaningful volumes of equities, ETFs and private assets onchain, $HOOD could capture economics across trading, tokenization, custody, lending and settlement. $HOOD offers one of the clearest public-equity plays on the convergence of traditional finance, tokenization and crypto infrastructure.
Robinhood is having a monster day.
$HOOD surged 13% as Robinhood Chain smashed its previous records, generating approximately $4 million in onchain revenue on September 2—more than any other blockchain that day. Its ambition is to bring stocks, ETFs, private assets and other real-world assets onchain—enabling 24/7 trading, self-custody, lending and integration with decentralized finance. Morgan Stanley just upgraded $HOOD to Overweight with a $150 price target, while Scotiabank initiated coverage with a Sector Outperform rating. Robinhood is increasingly evolving from a retail brokerage into a vertically integrated onchain financial infrastructure platform. If Robinhood Chain succeeds in moving meaningful volumes of equities, ETFs and private assets onchain, $HOOD could capture economics across trading, tokenization, custody, lending and settlement. $HOOD offers one of the clearest public-equity plays on the convergence of traditional finance, tokenization and crypto infrastructure.
$HOOD surged 13% as Robinhood Chain smashed its previous records, generating approximately $4 million in onchain revenue on September 2—more than any other blockchain that day. Its ambition is to bring stocks, ETFs, private assets and other real-world assets onchain—enabling 24/7 trading, self-custody, lending and integration with decentralized finance. Morgan Stanley just upgraded $HOOD to Overweight with a $150 price target, while Scotiabank initiated coverage with a Sector Outperform rating. Robinhood is increasingly evolving from a retail brokerage into a vertically integrated onchain financial infrastructure platform. If Robinhood Chain succeeds in moving meaningful volumes of equities, ETFs and private assets onchain, $HOOD could capture economics across trading, tokenization, custody, lending and settlement. $HOOD offers one of the clearest public-equity plays on the convergence of traditional finance, tokenization and crypto infrastructure.
1
168
翻訳参照
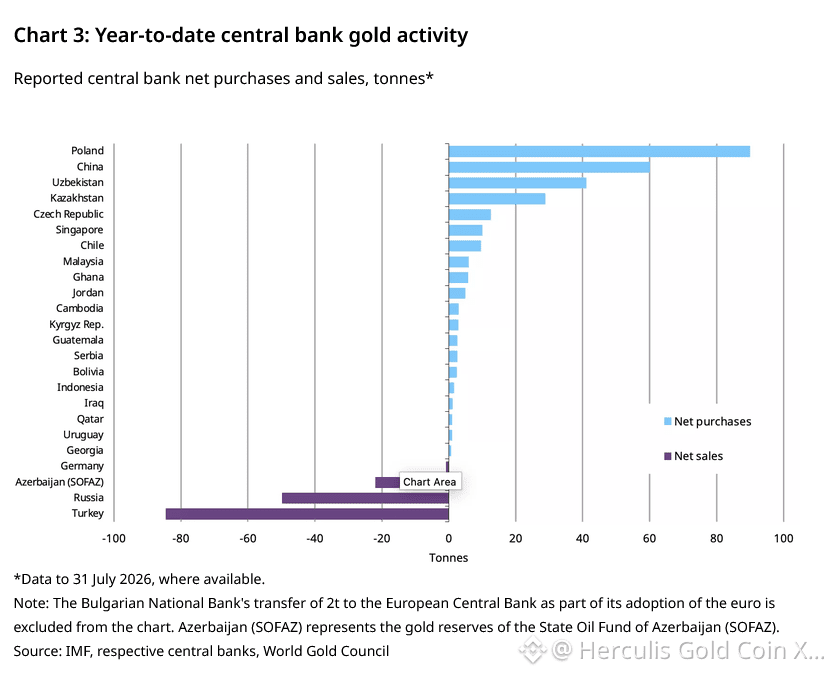
Central banks remain positive in July with net buying of 23t.
- The National Bank of Poland continued its gold accumulation streak, with 8t purchased this month. The country has accumulated 640t of gold – against its target of 700t – or approximately 28% of its total reserves.
- In its 21st consecutive month of buying the Central Bank of China added 20t to its gold reserves in July. China has added 60t to its gold reserves y-t-d. China’s official gold reserves now stand at 8% of total reserves, or around 2,366t.
- The Central Bank of Uzbekistan sold 1t this month; its y-t-d gold purchases stand at 40t. Uzbekistan’s gold now stands at 87% of total reserves, or about 431t.
- The Czech National Bank also bought 2t of gold this month in its 41st consecutive month of net buying. The central bank has bought 12t y-t-d, bringing its gold holdings to 6% of its total reserves, or 84t.
- The National Bank of Kazakhstan (NBK) bought 1t of gold this month. On a y-t-d basis the NBK has accumulated 29t of gold and is one of the top five gold accumulators globally. Kazakhstan’s gold holdings stand at 75% of its total reserves.
- The Central Bank of Russia continued its net sales in July, offloading a further 6t of gold. Russia has sold 50t of gold y-t-d, lowering its total gold holdings to 2,277t.
- The Central Bank of the Republic of Turkey sold 1t of gold this month, bringing its total sales so far this year to 85t.
Central banks remain positive in July with net buying of 23t.
- The National Bank of Poland continued its gold accumulation streak, with 8t purchased this month. The country has accumulated 640t of gold – against its target of 700t – or approximately 28% of its total reserves.
- In its 21st consecutive month of buying the Central Bank of China added 20t to its gold reserves in July. China has added 60t to its gold reserves y-t-d. China’s official gold reserves now stand at 8% of total reserves, or around 2,366t.
- The Central Bank of Uzbekistan sold 1t this month; its y-t-d gold purchases stand at 40t. Uzbekistan’s gold now stands at 87% of total reserves, or about 431t.
- The Czech National Bank also bought 2t of gold this month in its 41st consecutive month of net buying. The central bank has bought 12t y-t-d, bringing its gold holdings to 6% of its total reserves, or 84t.
- The National Bank of Kazakhstan (NBK) bought 1t of gold this month. On a y-t-d basis the NBK has accumulated 29t of gold and is one of the top five gold accumulators globally. Kazakhstan’s gold holdings stand at 75% of its total reserves.
- The Central Bank of Russia continued its net sales in July, offloading a further 6t of gold. Russia has sold 50t of gold y-t-d, lowering its total gold holdings to 2,277t.
- The Central Bank of the Republic of Turkey sold 1t of gold this month, bringing its total sales so far this year to 85t.
- The National Bank of Poland continued its gold accumulation streak, with 8t purchased this month. The country has accumulated 640t of gold – against its target of 700t – or approximately 28% of its total reserves.
- In its 21st consecutive month of buying the Central Bank of China added 20t to its gold reserves in July. China has added 60t to its gold reserves y-t-d. China’s official gold reserves now stand at 8% of total reserves, or around 2,366t.
- The Central Bank of Uzbekistan sold 1t this month; its y-t-d gold purchases stand at 40t. Uzbekistan’s gold now stands at 87% of total reserves, or about 431t.
- The Czech National Bank also bought 2t of gold this month in its 41st consecutive month of net buying. The central bank has bought 12t y-t-d, bringing its gold holdings to 6% of its total reserves, or 84t.
- The National Bank of Kazakhstan (NBK) bought 1t of gold this month. On a y-t-d basis the NBK has accumulated 29t of gold and is one of the top five gold accumulators globally. Kazakhstan’s gold holdings stand at 75% of its total reserves.
- The Central Bank of Russia continued its net sales in July, offloading a further 6t of gold. Russia has sold 50t of gold y-t-d, lowering its total gold holdings to 2,277t.
- The Central Bank of the Republic of Turkey sold 1t of gold this month, bringing its total sales so far this year to 85t.
1
4
·
--
ブリッシュ
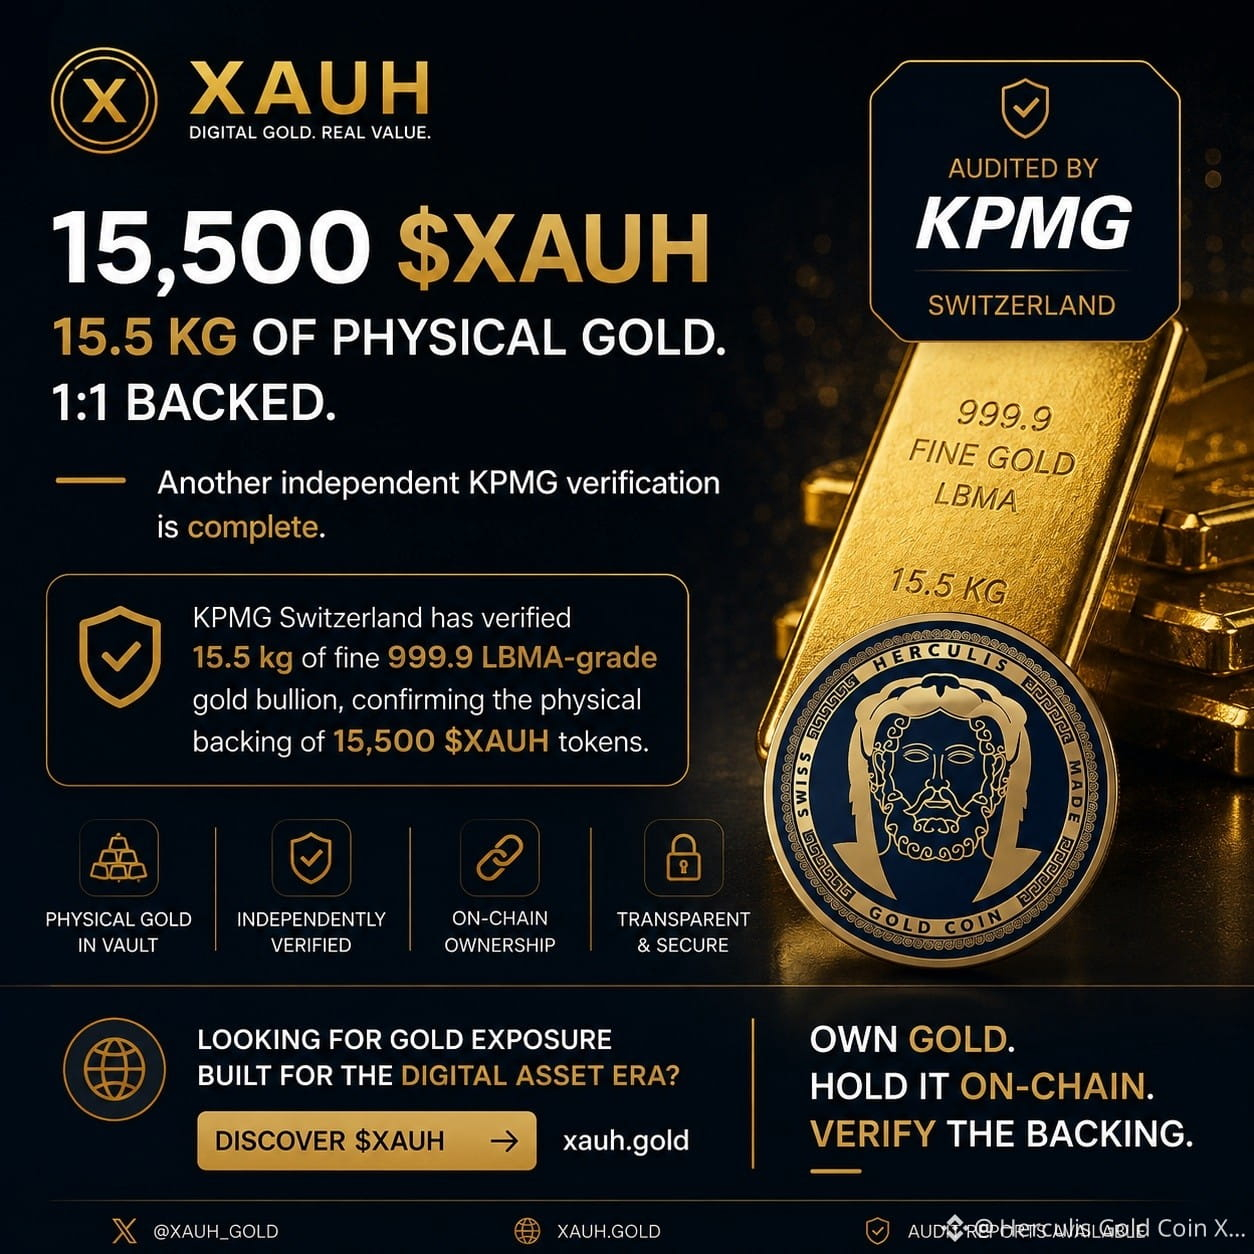
🥇 15,500 $XAUH。物理的な金 15.5 KG。1:1 で裏付け。
別の独立したKPMGの検証が完了しました。
KPMGスイスは、LBMAグレードのファイン999.9の金地金 15.5kgを検証し、15,500 $XAUHトークンが物理的に裏付けられていることを確認しました。
KPMGの完全な監査レポートは www.xauh.gold で入手可能です
アルゴリズムによる裏付けはありません。
合成エクスポージャーはありません。
約束はありません。
1 $XAUH = 物理的な金 1グラム。
オンチェーンの保有。物理的な金の裏付け。独立して検証済み。
本物の金。実在の準備金。オンチェーンで。🔗🥇
デジタル資産の時代に最適化された金へのエクスポージャーをお探しですか?
$XAUH を発見 → xauh.gold
金を保有。オンチェーンで保管。裏付けを検証。
🥇 15,500 $XAUH。物理的な金 15.5 KG。1:1 で裏付け。
別の独立したKPMGの検証が完了しました。
KPMGスイスは、LBMAグレードのファイン999.9の金地金 15.5kgを検証し、15,500 $XAUHトークンが物理的に裏付けられていることを確認しました。
KPMGの完全な監査レポートは www.xauh.gold で入手可能です
アルゴリズムによる裏付けはありません。
合成エクスポージャーはありません。
約束はありません。
1 $XAUH = 物理的な金 1グラム。
オンチェーンの保有。物理的な金の裏付け。独立して検証済み。
本物の金。実在の準備金。オンチェーンで。🔗🥇
デジタル資産の時代に最適化された金へのエクスポージャーをお探しですか?
$XAUH を発見 → xauh.gold
金を保有。オンチェーンで保管。裏付けを検証。
別の独立したKPMGの検証が完了しました。
KPMGスイスは、LBMAグレードのファイン999.9の金地金 15.5kgを検証し、15,500 $XAUHトークンが物理的に裏付けられていることを確認しました。
KPMGの完全な監査レポートは www.xauh.gold で入手可能です
アルゴリズムによる裏付けはありません。
合成エクスポージャーはありません。
約束はありません。
1 $XAUH = 物理的な金 1グラム。
オンチェーンの保有。物理的な金の裏付け。独立して検証済み。
本物の金。実在の準備金。オンチェーンで。🔗🥇
デジタル資産の時代に最適化された金へのエクスポージャーをお探しですか?
$XAUH を発見 → xauh.gold
金を保有。オンチェーンで保管。裏付けを検証。
1
100
翻訳参照
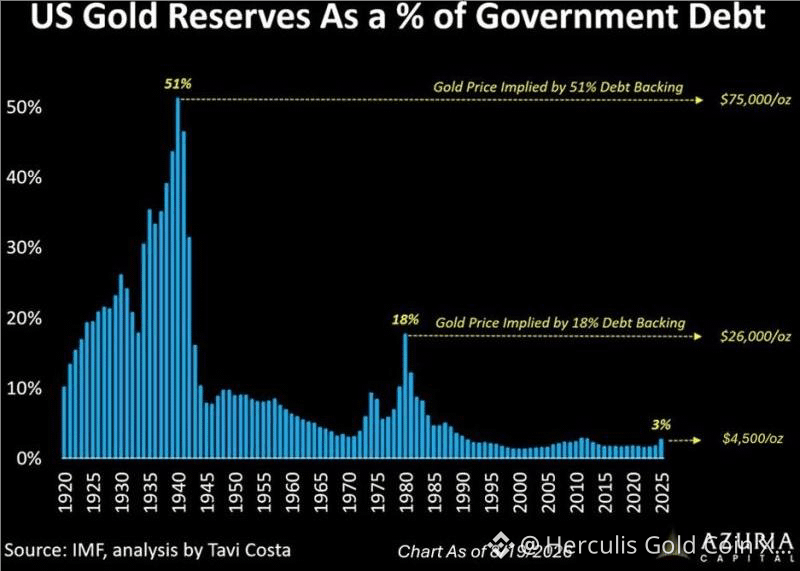
The chart is about the market value of US gold reserves relative to government debt, rather than Treasuries literally being “backed” by gold. The underlying contrast is nevertheless striking: US official gold holdings remain around 8,133 tonnes, while the debt stock has expanded enormously.
The key point is not that the US needs to return to a gold standard. It is the enormous divergence between a virtually fixed stock of sovereign gold and an exponentially expanding stock of sovereign liabilities. The US cannot manufacture additional gold to match additional debt.
This creates an asymmetric adjustment mechanism: if confidence in sovereign debt deteriorates, the quantity of US gold does not need to increase—the dollar price of that fixed gold stock can do the adjustment. The chart illustrates the scale: restoring the roughly 18% gold-to-debt valuation seen around 1980 would imply gold around $26,000/oz, while a return toward the extraordinary WWII-era ratio would imply approximately $75,000/oz. These are valuation scenarios, not price forecasts. Similar historical analysis puts the early-1940s ratio around 51%.
The investment case for gold therefore extends beyond inflation or interest-rate expectations. Gold increasingly represents insurance against sovereign balance-sheet expansion and monetary dilution. With the denominator—government debt—continuing to grow while the US gold stock remains essentially fixed, even a modest strategic revaluation of gold relative to sovereign liabilities could support substantially higher prices.
The chart is about the market value of US gold reserves relative to government debt, rather than Treasuries literally being “backed” by gold. The underlying contrast is nevertheless striking: US official gold holdings remain around 8,133 tonnes, while the debt stock has expanded enormously.
The key point is not that the US needs to return to a gold standard. It is the enormous divergence between a virtually fixed stock of sovereign gold and an exponentially expanding stock of sovereign liabilities. The US cannot manufacture additional gold to match additional debt.
This creates an asymmetric adjustment mechanism: if confidence in sovereign debt deteriorates, the quantity of US gold does not need to increase—the dollar price of that fixed gold stock can do the adjustment. The chart illustrates the scale: restoring the roughly 18% gold-to-debt valuation seen around 1980 would imply gold around $26,000/oz, while a return toward the extraordinary WWII-era ratio would imply approximately $75,000/oz. These are valuation scenarios, not price forecasts. Similar historical analysis puts the early-1940s ratio around 51%.
The investment case for gold therefore extends beyond inflation or interest-rate expectations. Gold increasingly represents insurance against sovereign balance-sheet expansion and monetary dilution. With the denominator—government debt—continuing to grow while the US gold stock remains essentially fixed, even a modest strategic revaluation of gold relative to sovereign liabilities could support substantially higher prices.
The key point is not that the US needs to return to a gold standard. It is the enormous divergence between a virtually fixed stock of sovereign gold and an exponentially expanding stock of sovereign liabilities. The US cannot manufacture additional gold to match additional debt.
This creates an asymmetric adjustment mechanism: if confidence in sovereign debt deteriorates, the quantity of US gold does not need to increase—the dollar price of that fixed gold stock can do the adjustment. The chart illustrates the scale: restoring the roughly 18% gold-to-debt valuation seen around 1980 would imply gold around $26,000/oz, while a return toward the extraordinary WWII-era ratio would imply approximately $75,000/oz. These are valuation scenarios, not price forecasts. Similar historical analysis puts the early-1940s ratio around 51%.
The investment case for gold therefore extends beyond inflation or interest-rate expectations. Gold increasingly represents insurance against sovereign balance-sheet expansion and monetary dilution. With the denominator—government debt—continuing to grow while the US gold stock remains essentially fixed, even a modest strategic revaluation of gold relative to sovereign liabilities could support substantially higher prices.
1
127
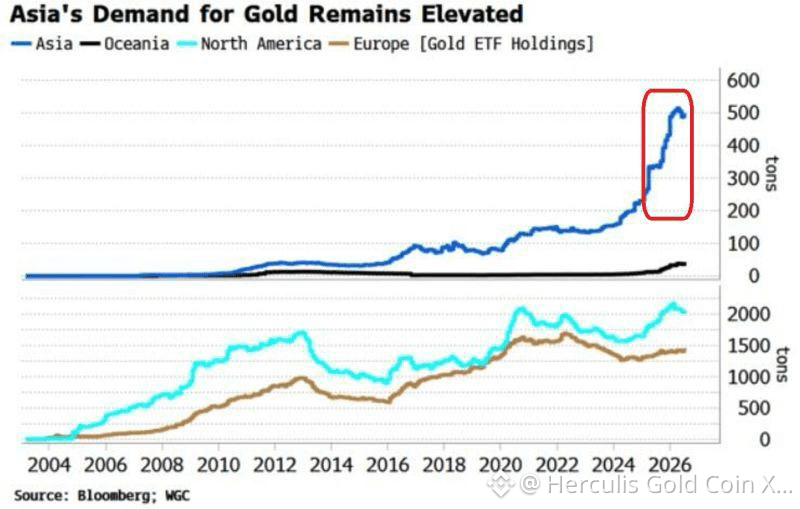
アジアにおける金需要は依然として非常に強い。アジアの金(ゴールド)ETF保有残高は過去1年で2倍以上に増加し、今世紀で初めて500トンを超えた。急増を牽引しているのは中国だ。一方で、北米および欧州の金ETF保有残高は概ね安定したままである。変わっているのは投資家の需要である。とりわけ中国を中心とするアジアの投資家が、加速するペースで金を積み増している。
この動きが特に重要なのは、その規模とスピードだ。アジアのETF保有残高は単に回復しているだけではなく、これまでの過去最高水準のレンジを明確に上抜けている。これは、金への構造的な資金再配分が進んでいることを示唆しており、すでに強い中央銀行需要に加えて、民間の投資家がますますその要因となっている。
アジア需要の加速は、ゴールド・ブル相場(強気相場)にもう一つの構造的な柱を加える。もし中国およびより広いアジアの配分が西側の水準に向けて引き続き収れんしていく一方で、西側のETF保有が単に安定したままであれば、その結果として生じる追加需要によって、実物市場が大幅に逼迫する可能性がある。したがって我々は引き続き、金について戦略的に強気の見方を維持しており、価格の大きな下落局面は長期トレンドの反転ではなく、積み増しの機会として捉えるべきだと考えている。
アジアにおける金需要は依然として非常に強い。アジアの金(ゴールド)ETF保有残高は過去1年で2倍以上に増加し、今世紀で初めて500トンを超えた。急増を牽引しているのは中国だ。一方で、北米および欧州の金ETF保有残高は概ね安定したままである。変わっているのは投資家の需要である。とりわけ中国を中心とするアジアの投資家が、加速するペースで金を積み増している。
この動きが特に重要なのは、その規模とスピードだ。アジアのETF保有残高は単に回復しているだけではなく、これまでの過去最高水準のレンジを明確に上抜けている。これは、金への構造的な資金再配分が進んでいることを示唆しており、すでに強い中央銀行需要に加えて、民間の投資家がますますその要因となっている。
アジア需要の加速は、ゴールド・ブル相場(強気相場)にもう一つの構造的な柱を加える。もし中国およびより広いアジアの配分が西側の水準に向けて引き続き収れんしていく一方で、西側のETF保有が単に安定したままであれば、その結果として生じる追加需要によって、実物市場が大幅に逼迫する可能性がある。したがって我々は引き続き、金について戦略的に強気の見方を維持しており、価格の大きな下落局面は長期トレンドの反転ではなく、積み増しの機会として捉えるべきだと考えている。
この動きが特に重要なのは、その規模とスピードだ。アジアのETF保有残高は単に回復しているだけではなく、これまでの過去最高水準のレンジを明確に上抜けている。これは、金への構造的な資金再配分が進んでいることを示唆しており、すでに強い中央銀行需要に加えて、民間の投資家がますますその要因となっている。
アジア需要の加速は、ゴールド・ブル相場(強気相場)にもう一つの構造的な柱を加える。もし中国およびより広いアジアの配分が西側の水準に向けて引き続き収れんしていく一方で、西側のETF保有が単に安定したままであれば、その結果として生じる追加需要によって、実物市場が大幅に逼迫する可能性がある。したがって我々は引き続き、金について戦略的に強気の見方を維持しており、価格の大きな下落局面は長期トレンドの反転ではなく、積み増しの機会として捉えるべきだと考えている。
1
147
翻訳参照
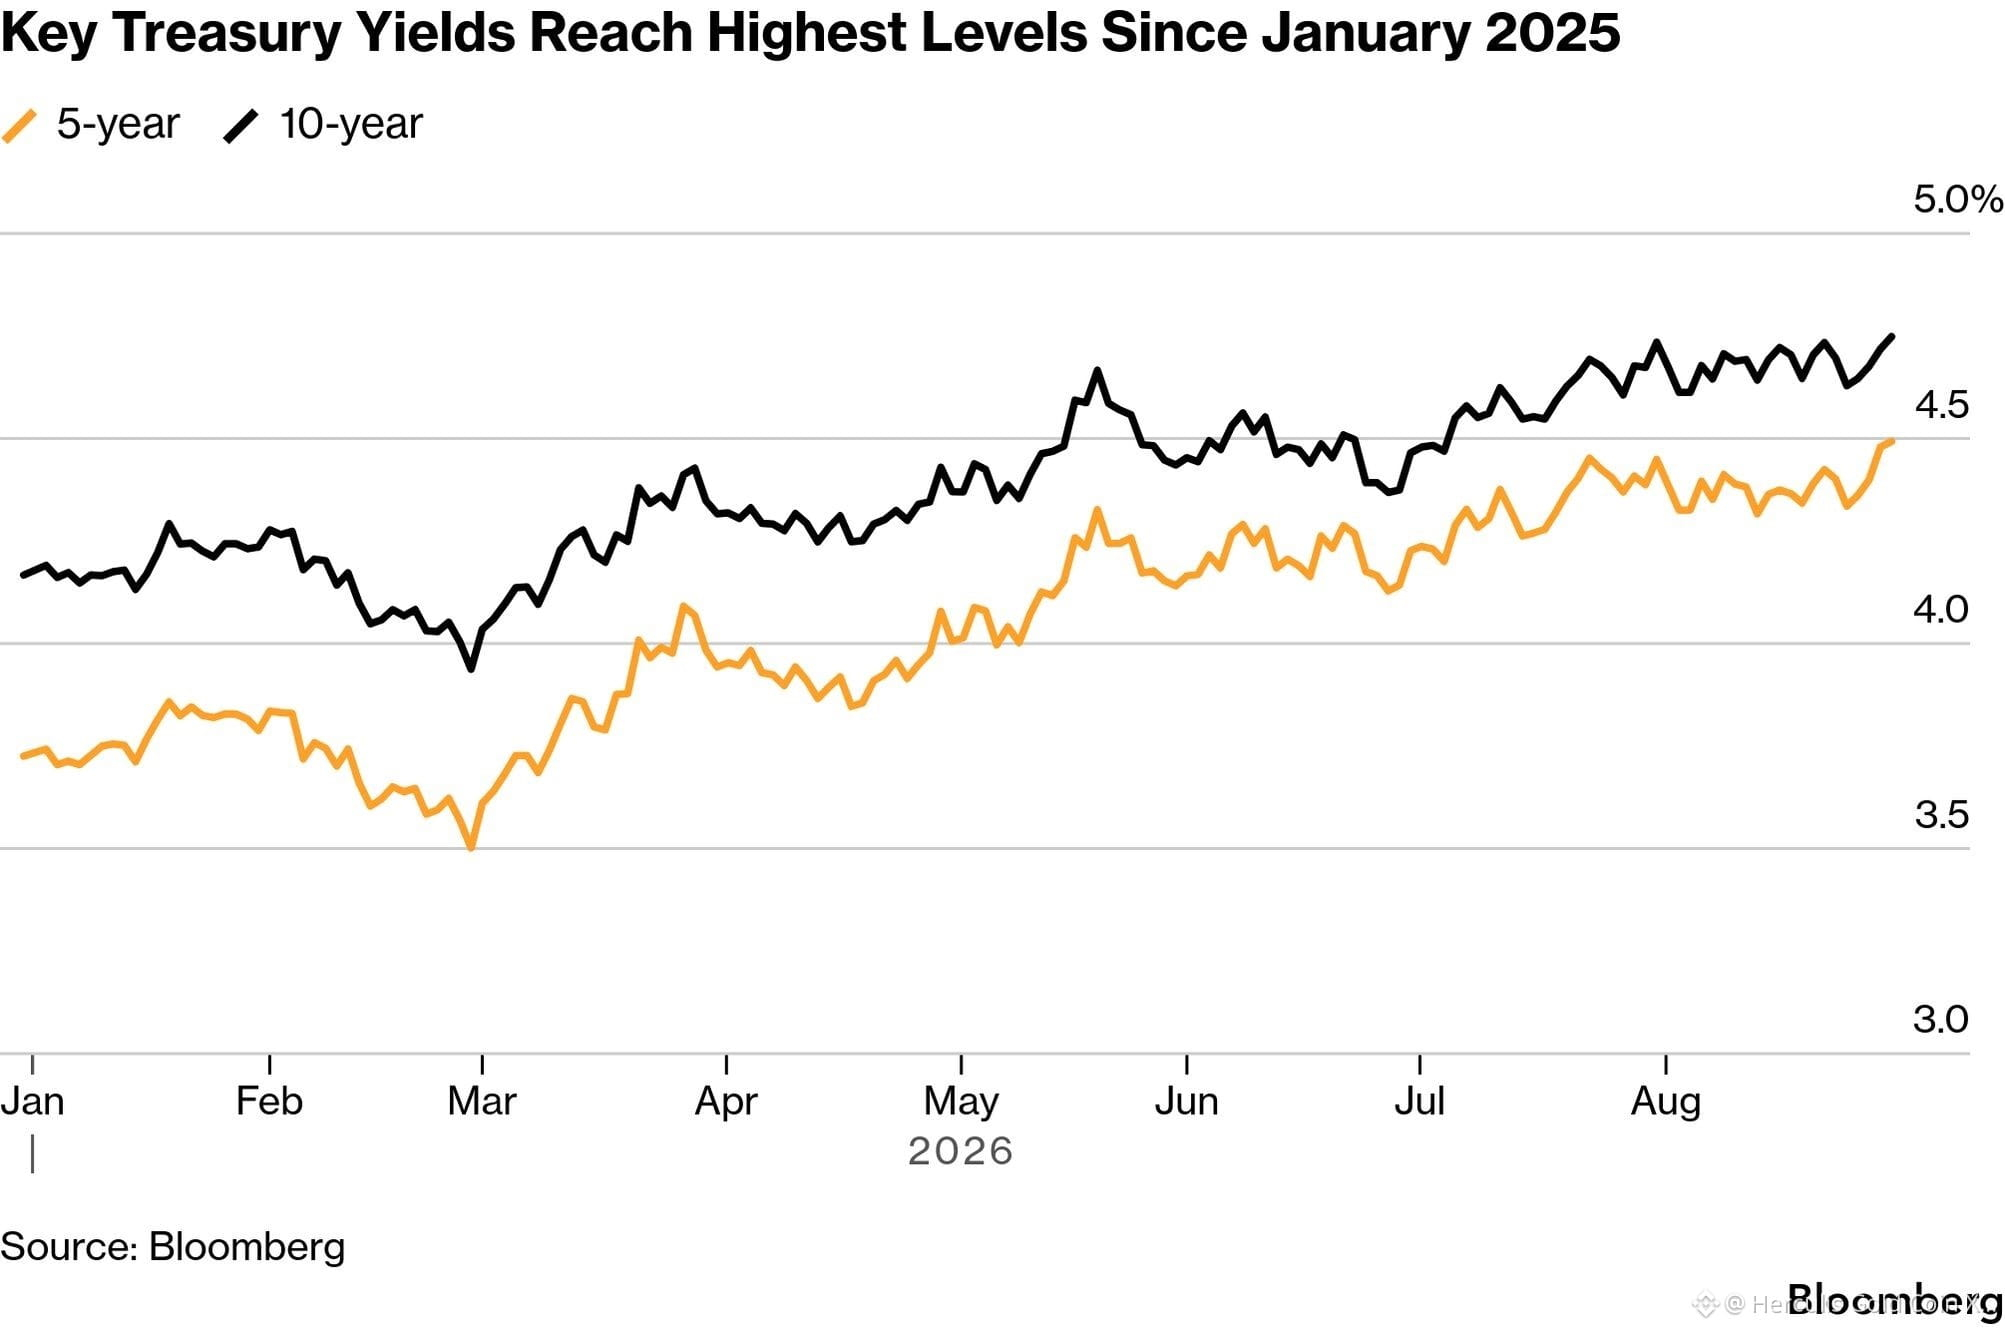
Yields for the US 10-year Treasury topped 4.75% on Monday for the first time since January 2025 following a spike in oil prices tied to renewed fighting around the Strait of Hormuz and the stalemate in the six-month US-Israel war with Iran.
Five-year yields are also hitting their highest level since early last year while 30-year yields, the subject of much discussion in the aftermath of the US exceeding $40 trillion in debt, surpassed last week’s highs.
In parallel,
- the 10-year Japanese JGB has hit 3% for the first time since 1996,
- Australian bonds are back at their 2011 levels,
- And Europe is following suit:
o France at 4.16%, the highest since 2008;
o Germany at 3.31%, the highest since 2011;
o Italy at 4.15%;
o Spain at 3.76%;
o Portugal at 3.67%.
The bond market does not necessarily signal an imminent crisis. It points to something more specific and more troubling. The inflation, budget deficits, war, artificial intelligence, and the erosion of political credibility must now all be financed simultaneously.
Welcome to the war of attrition on capital. Who wins?
Yields for the US 10-year Treasury topped 4.75% on Monday for the first time since January 2025 following a spike in oil prices tied to renewed fighting around the Strait of Hormuz and the stalemate in the six-month US-Israel war with Iran.
Five-year yields are also hitting their highest level since early last year while 30-year yields, the subject of much discussion in the aftermath of the US exceeding $40 trillion in debt, surpassed last week’s highs.
In parallel,
- the 10-year Japanese JGB has hit 3% for the first time since 1996,
- Australian bonds are back at their 2011 levels,
- And Europe is following suit:
o France at 4.16%, the highest since 2008;
o Germany at 3.31%, the highest since 2011;
o Italy at 4.15%;
o Spain at 3.76%;
o Portugal at 3.67%.
The bond market does not necessarily signal an imminent crisis. It points to something more specific and more troubling. The inflation, budget deficits, war, artificial intelligence, and the erosion of political credibility must now all be financed simultaneously.
Welcome to the war of attrition on capital. Who wins?
Five-year yields are also hitting their highest level since early last year while 30-year yields, the subject of much discussion in the aftermath of the US exceeding $40 trillion in debt, surpassed last week’s highs.
In parallel,
- the 10-year Japanese JGB has hit 3% for the first time since 1996,
- Australian bonds are back at their 2011 levels,
- And Europe is following suit:
o France at 4.16%, the highest since 2008;
o Germany at 3.31%, the highest since 2011;
o Italy at 4.15%;
o Spain at 3.76%;
o Portugal at 3.67%.
The bond market does not necessarily signal an imminent crisis. It points to something more specific and more troubling. The inflation, budget deficits, war, artificial intelligence, and the erosion of political credibility must now all be financed simultaneously.
Welcome to the war of attrition on capital. Who wins?
1
2
翻訳参照
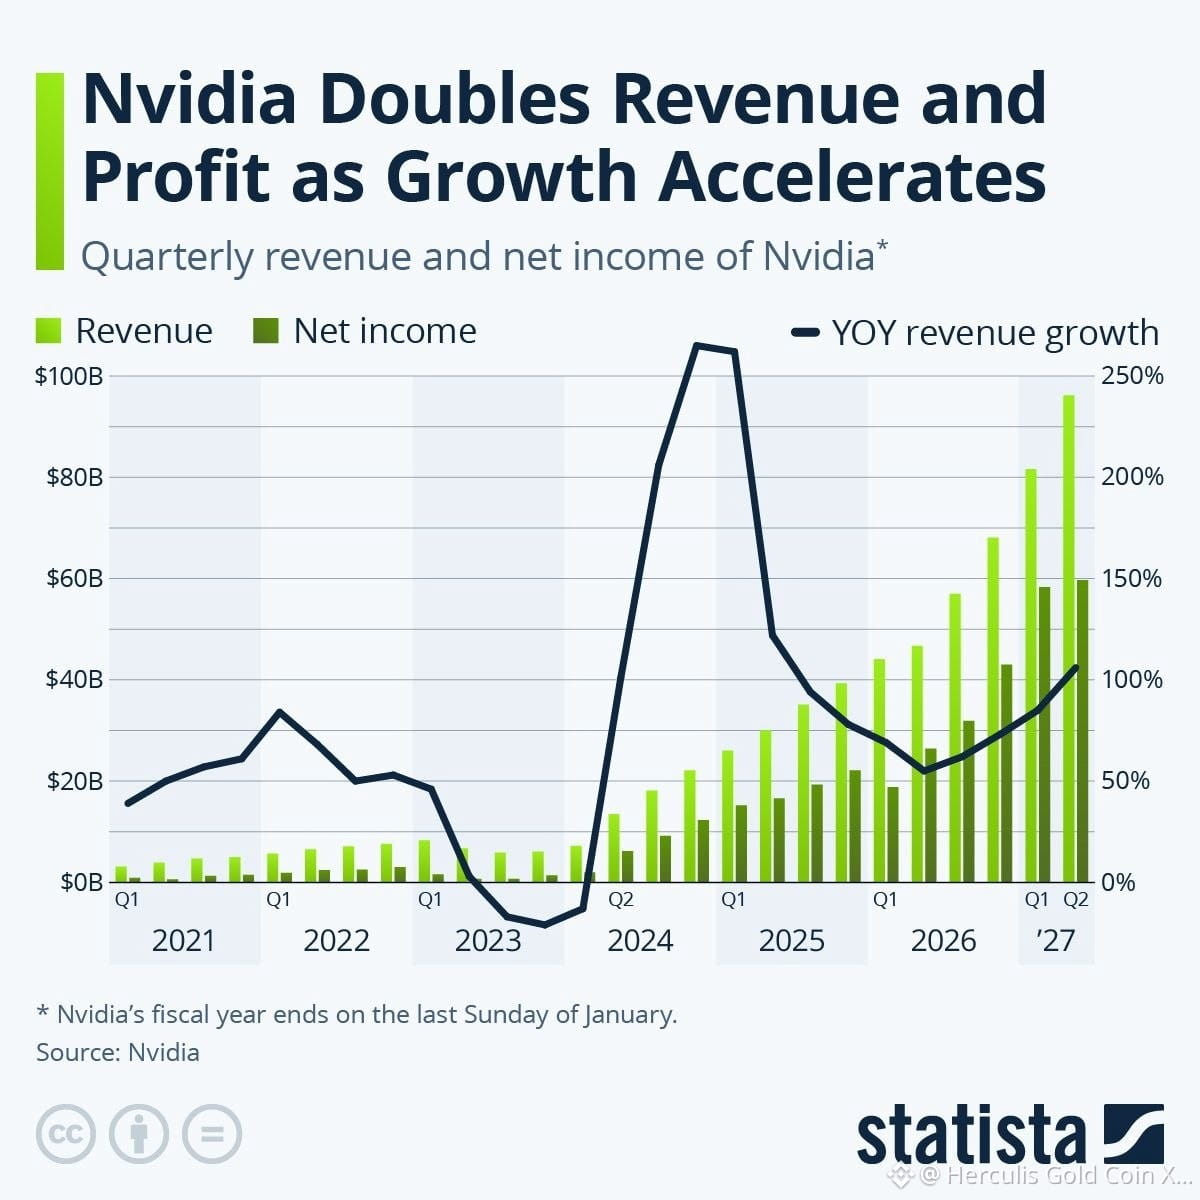
For the three months ended July 26, Nvidia’s revenue rose 106% year over year to $96.2 billion, exceeding both its own forecast of $91 billion and analysts’ expectations.
Net income more than doubled to $59.7 billion, putting Nvidia firmly on track to become the world’s first company with annual net profit exceeding $200 billion.
The most remarkable feature is not simply 106% revenue growth, but the economics behind it: Nvidia maintained a 75% gross margin while generating $59.7 billion of quarterly net income. Data Center revenue reached $89.0 billion, up 117% YoY. This combination of hyper-growth, exceptional margins and relatively low capital intensity makes Nvidia increasingly resemble a highly scalable AI infrastructure platform rather than a conventional semiconductor manufacturer.
Nvidia remains one of the highest-quality structural exposures to global AI infrastructure spending.
Nvidia is no longer merely selling the chips behind the AI revolution—it is capturing an extraordinary share of the economic value being created by it.
For the three months ended July 26, Nvidia’s revenue rose 106% year over year to $96.2 billion, exceeding both its own forecast of $91 billion and analysts’ expectations.
Net income more than doubled to $59.7 billion, putting Nvidia firmly on track to become the world’s first company with annual net profit exceeding $200 billion.
The most remarkable feature is not simply 106% revenue growth, but the economics behind it: Nvidia maintained a 75% gross margin while generating $59.7 billion of quarterly net income. Data Center revenue reached $89.0 billion, up 117% YoY. This combination of hyper-growth, exceptional margins and relatively low capital intensity makes Nvidia increasingly resemble a highly scalable AI infrastructure platform rather than a conventional semiconductor manufacturer.
Nvidia remains one of the highest-quality structural exposures to global AI infrastructure spending.
Nvidia is no longer merely selling the chips behind the AI revolution—it is capturing an extraordinary share of the economic value being created by it.
Net income more than doubled to $59.7 billion, putting Nvidia firmly on track to become the world’s first company with annual net profit exceeding $200 billion.
The most remarkable feature is not simply 106% revenue growth, but the economics behind it: Nvidia maintained a 75% gross margin while generating $59.7 billion of quarterly net income. Data Center revenue reached $89.0 billion, up 117% YoY. This combination of hyper-growth, exceptional margins and relatively low capital intensity makes Nvidia increasingly resemble a highly scalable AI infrastructure platform rather than a conventional semiconductor manufacturer.
Nvidia remains one of the highest-quality structural exposures to global AI infrastructure spending.
Nvidia is no longer merely selling the chips behind the AI revolution—it is capturing an extraordinary share of the economic value being created by it.
1
130
翻訳参照
🏆 Another important milestone for Herculis Gold Coin ($XAUH)!
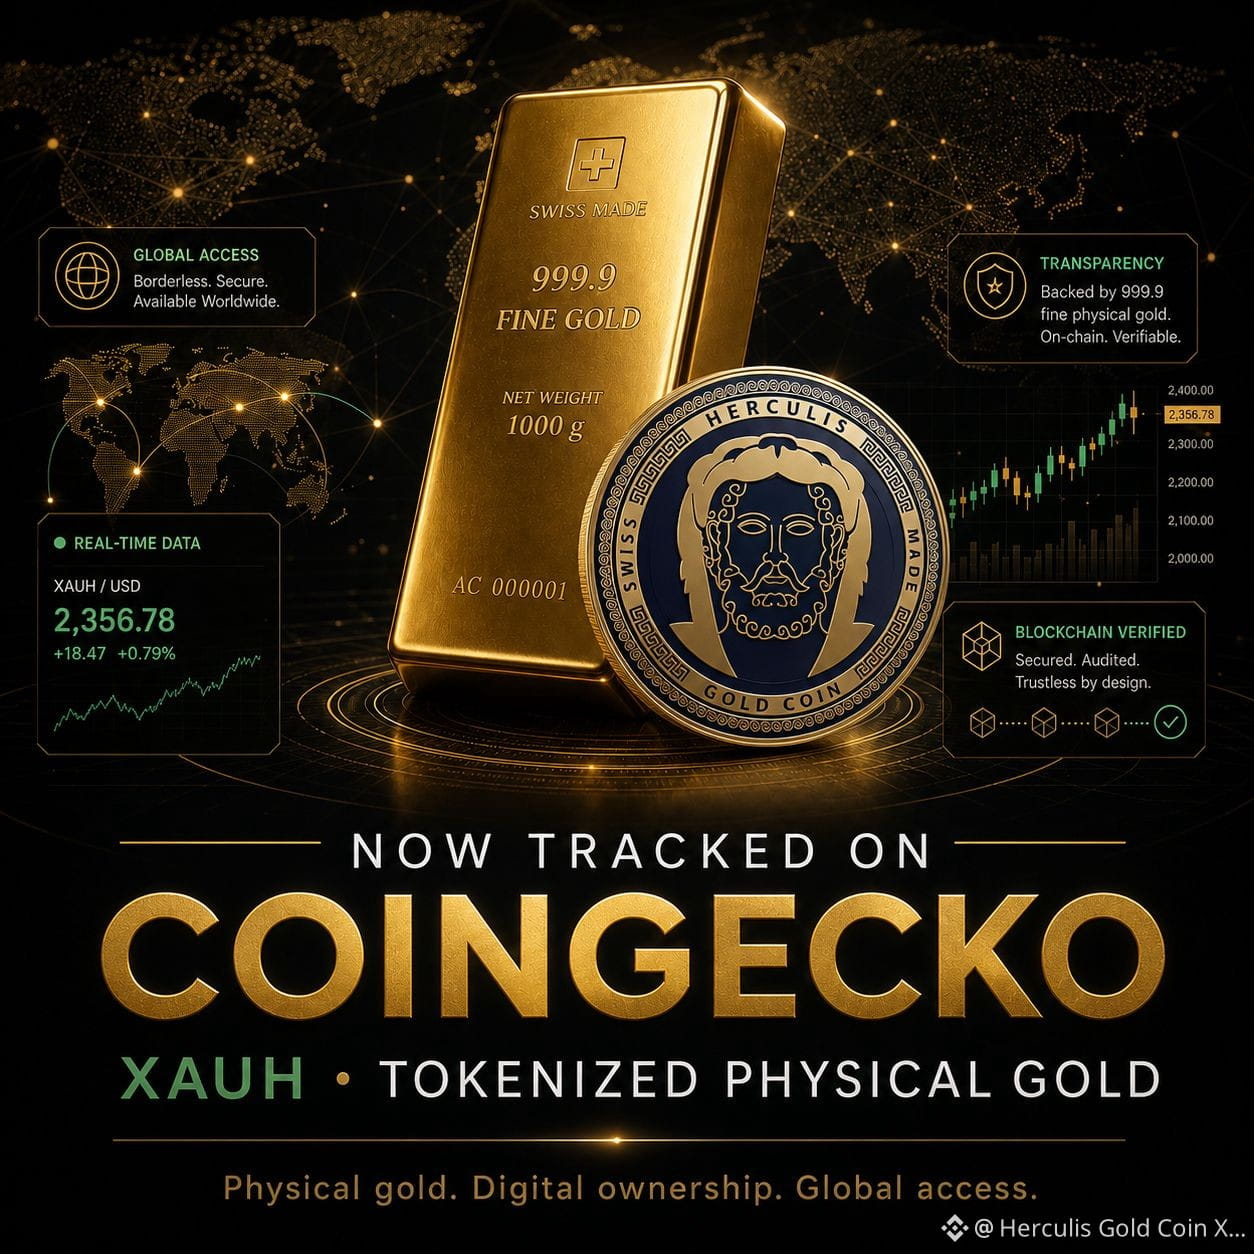
We are proud to announce that $XAUH is now listed on CoinGecko, one of the world’s leading independent cryptocurrency data platforms.
This listing gives investors greater visibility, transparency, and access to market data on $XAUH, including real-time pricing, market capitalization, trading volumes, available exchanges, liquidity, and other key metrics.
For $XAUH, the CoinGecko listing represents another important step in building a transparent and globally accessible ecosystem for tokenized physical gold—bridging the security of Swiss physical gold with the efficiency and accessibility of blockchain technology.
Physical gold. Digital ownership. Global access. $XAUH.
🏆 Another important milestone for Herculis Gold Coin ($XAUH)!
We are proud to announce that $XAUH is now listed on CoinGecko, one of the world’s leading independent cryptocurrency data platforms.
This listing gives investors greater visibility, transparency, and access to market data on $XAUH, including real-time pricing, market capitalization, trading volumes, available exchanges, liquidity, and other key metrics.
For $XAUH, the CoinGecko listing represents another important step in building a transparent and globally accessible ecosystem for tokenized physical gold—bridging the security of Swiss physical gold with the efficiency and accessibility of blockchain technology.
Physical gold. Digital ownership. Global access. $XAUH.
We are proud to announce that $XAUH is now listed on CoinGecko, one of the world’s leading independent cryptocurrency data platforms.
This listing gives investors greater visibility, transparency, and access to market data on $XAUH, including real-time pricing, market capitalization, trading volumes, available exchanges, liquidity, and other key metrics.
For $XAUH, the CoinGecko listing represents another important step in building a transparent and globally accessible ecosystem for tokenized physical gold—bridging the security of Swiss physical gold with the efficiency and accessibility of blockchain technology.
Physical gold. Digital ownership. Global access. $XAUH.
1
75
翻訳参照
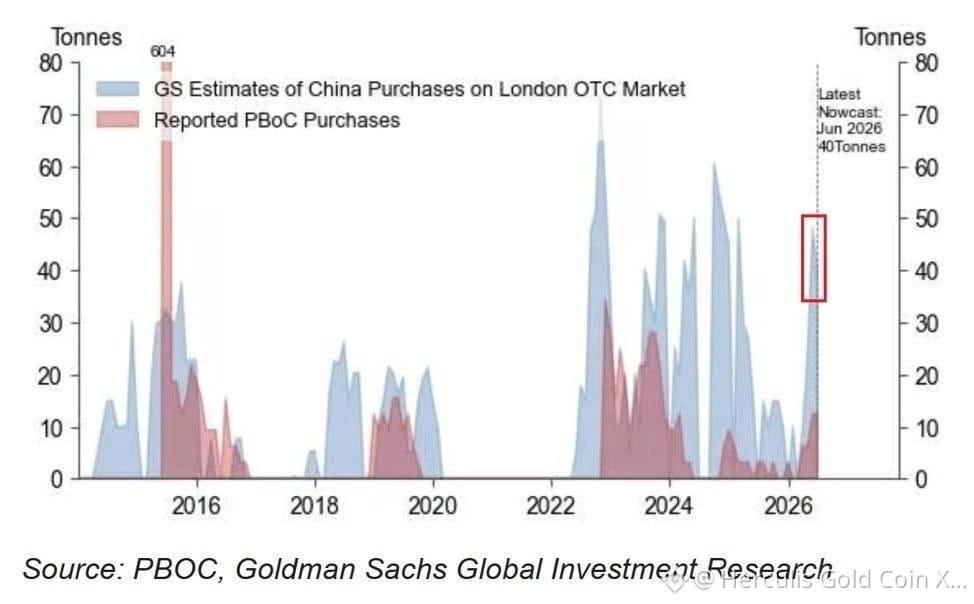
In June, China purchased more than 40 tonnes of gold through the London over-the-counter (OTC) market, marking its second-largest monthly purchase since the beginning of 2025.
This was 167% higher than the official figures published by the People’s Bank of China (PBoC), which reported gold purchases of 15 tonnes in June.
It is also estimated that China purchased an additional approximately 48 tonnes of gold through the OTC market in May, 380% more than the central bank’s officially reported purchase of 10 tonnes.
Meanwhile, in July, the PBoC officially increased its gold reserves by 20 tonnes, representing its largest monthly purchase since October 2023.
Since the beginning of the year, China has officially increased its gold reserves by 60 tonnes, bringing its total holdings to a record 2,366 tonnes.
Thus, China purchased approximately 88 tonnes of gold through the OTC market in May and June alone—more than the amount officially reported for the entire year to date. This suggests that China is acquiring significantly more gold than is reflected in its official data.
In June, China purchased more than 40 tonnes of gold through the London over-the-counter (OTC) market, marking its second-largest monthly purchase since the beginning of 2025.
This was 167% higher than the official figures published by the People’s Bank of China (PBoC), which reported gold purchases of 15 tonnes in June.
It is also estimated that China purchased an additional approximately 48 tonnes of gold through the OTC market in May, 380% more than the central bank’s officially reported purchase of 10 tonnes.
Meanwhile, in July, the PBoC officially increased its gold reserves by 20 tonnes, representing its largest monthly purchase since October 2023.
Since the beginning of the year, China has officially increased its gold reserves by 60 tonnes, bringing its total holdings to a record 2,366 tonnes.
Thus, China purchased approximately 88 tonnes of gold through the OTC market in May and June alone—more than the amount officially reported for the entire year to date. This suggests that China is acquiring significantly more gold than is reflected in its official data.
This was 167% higher than the official figures published by the People’s Bank of China (PBoC), which reported gold purchases of 15 tonnes in June.
It is also estimated that China purchased an additional approximately 48 tonnes of gold through the OTC market in May, 380% more than the central bank’s officially reported purchase of 10 tonnes.
Meanwhile, in July, the PBoC officially increased its gold reserves by 20 tonnes, representing its largest monthly purchase since October 2023.
Since the beginning of the year, China has officially increased its gold reserves by 60 tonnes, bringing its total holdings to a record 2,366 tonnes.
Thus, China purchased approximately 88 tonnes of gold through the OTC market in May and June alone—more than the amount officially reported for the entire year to date. This suggests that China is acquiring significantly more gold than is reflected in its official data.
1
65
ログインして、さらにコンテンツを読む
厳選トピックで世界の暗号資産トレーダーの仲間入り
⚡️ 暗号資産に関する最新かつ有益な情報が見つかります。
💬 世界最大の暗号資産取引所から信頼されています。
👍 認証を受けたクリエイターから、有益なインサイトを得られます。
メール / 電話番号
トレンドトピック
USRussiaUkraineTalksReportedlyIncludeLukoilOilDeal
閲覧回数 0
16人が討論中
#USRussiaUkraineTalksReportedlyIncludeLukoilOilDeal
⚡ 米ロ会談は、10億ドル規模の石油取引へ拡大する可能性があると報道
🇺🇸🇷🇺 ウクライナをめぐる協議が、ルクオイルの国際的な石油資産を対象とした潜在的な案件に発展する可能性があると報じられている。製油所、油田、給油所などが含まれるという。
💰 報じられている投資家グループには、米国の投資家トッド・ボエリーと中東の事業グループが含まれており、ワシントンとモスクワの双方から承認が必要とされている。
🛢️ 重要な点:この取引は、制裁、エネルギー市場、そしてウクライナ和平交渉と交差する可能性がある。
⚠️ まだ何も確定していない。ホワイトハウス、米財務省、ルクオイルはいずれも、引用された報道についてコメントしていない。
👀 大規模な石油取引が、より広範なウクライナ交渉の一部になる可能性はあるのか?
#Lukoil #OilMarkets #Ukraine #Geopolitics
CrypVexa
·いいね:1件
·閲覧回数 53
BitcoinParesGainsAfterRallyTo$86.5K
閲覧回数 28,288
105人が討論中
CerebrasSinksNearly20%OnReportNvidiaToPowerOpenAI
閲覧回数 52,615
605人が討論中