

CapitalSignal
812 投稿
CapitalSignal
報告
ユーザーをブロック
Global markets, U.S. equities & Asia macro.
0 フォロー
67 フォロワー
96 いいね
投稿
翻訳参照
There's a Chinese idiom: 惱羞成怒 — when something gets pushed down for too long, it snaps back with fury.
A stock, a sector, a whole market — can only take so many corrections, so many years of being beaten down, before something breaks the other way.
Prolonged containment doesn't just fade. It builds pressure. And when it finally releases, it's violent.
No one knows exactly when. But you can feel it building — volume creeping in, positioning shifting, narratives starting to flip.
Keep your ear to the ground. When the noise gets loud, that's when the real move starts.
There's a Chinese idiom: 惱羞成怒 — when something gets pushed down for too long, it snaps back with fury.
A stock, a sector, a whole market — can only take so many corrections, so many years of being beaten down, before something breaks the other way.
Prolonged containment doesn't just fade. It builds pressure. And when it finally releases, it's violent.
No one knows exactly when. But you can feel it building — volume creeping in, positioning shifting, narratives starting to flip.
Keep your ear to the ground. When the noise gets loud, that's when the real move starts.
A stock, a sector, a whole market — can only take so many corrections, so many years of being beaten down, before something breaks the other way.
Prolonged containment doesn't just fade. It builds pressure. And when it finally releases, it's violent.
No one knows exactly when. But you can feel it building — volume creeping in, positioning shifting, narratives starting to flip.
Keep your ear to the ground. When the noise gets loud, that's when the real move starts.
20
翻訳参照
$BTC holding the 20-week EMA—classic mid-cycle support level. If this is the line, we're setting up for another leg. If not, things get interesting fast.
Consolidation here is fine. Shakes out weak hands, resets funding, gives the market time to digest the run. Better than a straight shot up that ends in a violent unwind.
Watch how it reacts here. Clean bounce = continuation bias. Break and close below = re-test lower support, maybe the 50-week. No one knows for sure, but the setup is clear enough to trade around.
$BTC holding the 20-week EMA—classic mid-cycle support level. If this is the line, we're setting up for another leg. If not, things get interesting fast.
Consolidation here is fine. Shakes out weak hands, resets funding, gives the market time to digest the run. Better than a straight shot up that ends in a violent unwind.
Watch how it reacts here. Clean bounce = continuation bias. Break and close below = re-test lower support, maybe the 50-week. No one knows for sure, but the setup is clear enough to trade around.
Consolidation here is fine. Shakes out weak hands, resets funding, gives the market time to digest the run. Better than a straight shot up that ends in a violent unwind.
Watch how it reacts here. Clean bounce = continuation bias. Break and close below = re-test lower support, maybe the 50-week. No one knows for sure, but the setup is clear enough to trade around.
6
翻訳参照
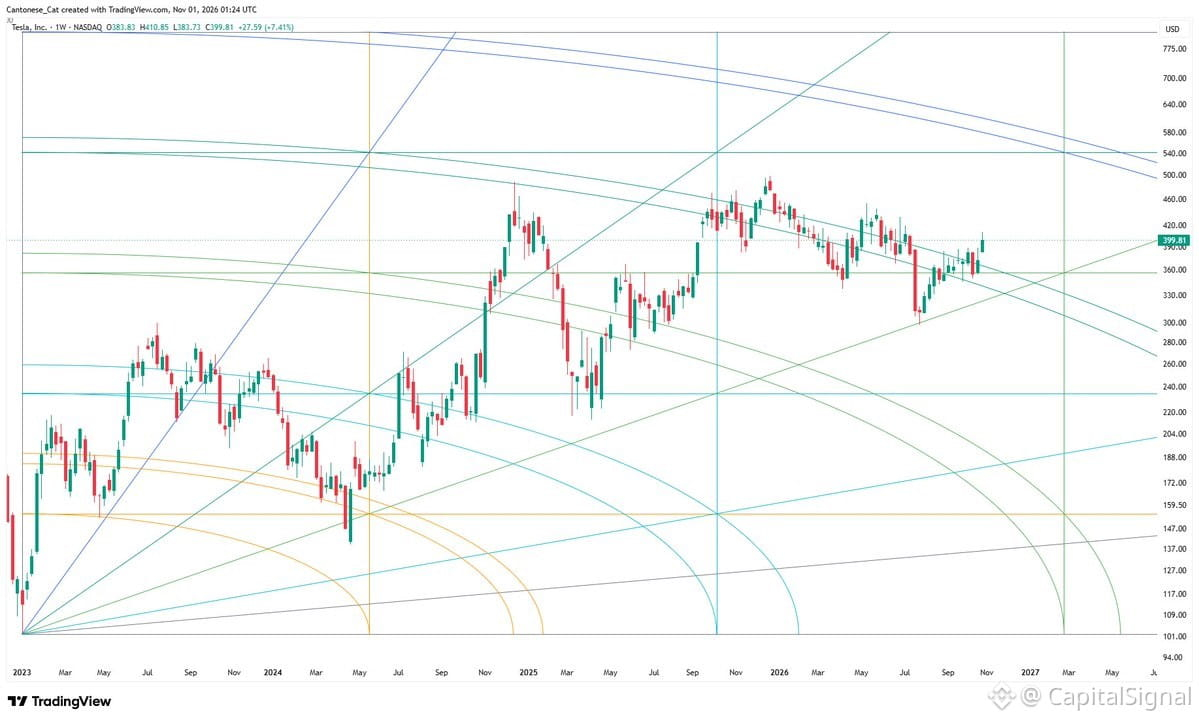
$TSLA's been glued to this Gann arc all of 2026—tight consolidation, respecting the geometry. A few months back it bounced hard off the 45-degree angle, clean reaction.
Now the question: is 2027 the breakout year?
Technically, prolonged consolidation near key Gann levels often precedes big moves. If $TSLA holds above this arc and volume picks up, we could see acceleration. But if it loses the arc, watch for a deeper pullback.
Chart's setting up—2027 could be go time if fundamentals and sentiment align. Keep the 45-degree level as your line in the sand.
$TSLA's been glued to this Gann arc all of 2026—tight consolidation, respecting the geometry. A few months back it bounced hard off the 45-degree angle, clean reaction.
Now the question: is 2027 the breakout year?
Technically, prolonged consolidation near key Gann levels often precedes big moves. If $TSLA holds above this arc and volume picks up, we could see acceleration. But if it loses the arc, watch for a deeper pullback.
Chart's setting up—2027 could be go time if fundamentals and sentiment align. Keep the 45-degree level as your line in the sand.
Now the question: is 2027 the breakout year?
Technically, prolonged consolidation near key Gann levels often precedes big moves. If $TSLA holds above this arc and volume picks up, we could see acceleration. But if it loses the arc, watch for a deeper pullback.
Chart's setting up—2027 could be go time if fundamentals and sentiment align. Keep the 45-degree level as your line in the sand.
7
翻訳参照
$HSI just back-tested its rising 20-year moving average—a massive technical level that doesn't show up often. If this holds, we're looking at a multi-year setup with 2027 as a potential inflection point. Long-duration support like this can mark generational lows or the start of a new regime. Worth watching if you're positioning for China/HK exposure on a longer horizon.
$HSI just back-tested its rising 20-year moving average—a massive technical level that doesn't show up often. If this holds, we're looking at a multi-year setup with 2027 as a potential inflection point. Long-duration support like this can mark generational lows or the start of a new regime. Worth watching if you're positioning for China/HK exposure on a longer horizon.
4
翻訳参照
The $NDX to gold ratio just tagged its 20-year moving average—a major technical level that's held up through this 5-year correction. If the pattern plays out, we could see a bottom around 2026. That's a long base, but these macro mean-reversion setups tend to resolve with conviction. Tech vs. gold has been one of the defining relative value trades of the past decade, and this correction is resetting positioning. Worth watching if you're thinking about rotation into equities or hedging with real assets.
The $NDX to gold ratio just tagged its 20-year moving average—a major technical level that's held up through this 5-year correction. If the pattern plays out, we could see a bottom around 2026. That's a long base, but these macro mean-reversion setups tend to resolve with conviction. Tech vs. gold has been one of the defining relative value trades of the past decade, and this correction is resetting positioning. Worth watching if you're thinking about rotation into equities or hedging with real assets.
78
翻訳参照
Yearly Ichimoku just flashed a bullish Tenkan-Kijun cross on the $NDX/Gold ratio in 2026. We're now watching whether it can flip the Kijun into support—a clean hold here would confirm the structural shift toward risk-on equity outperformance vs. safe havens. This is a macro positioning signal: if tech continues to lead relative to gold, it reinforces the reflation/growth narrative and suggests institutional flows are rotating back into growth assets. Watch the retest.
Yearly Ichimoku just flashed a bullish Tenkan-Kijun cross on the $NDX/Gold ratio in 2026. We're now watching whether it can flip the Kijun into support—a clean hold here would confirm the structural shift toward risk-on equity outperformance vs. safe havens. This is a macro positioning signal: if tech continues to lead relative to gold, it reinforces the reflation/growth narrative and suggests institutional flows are rotating back into growth assets. Watch the retest.
58
翻訳参照
$SPX vs gold on the yearly chart hitting SuperTrend resistance and the 0.5 Fib retracement level. Classic technical setup where equities have run hard against gold and now sitting at a major inflection point. Watch for either a rejection here (rotation into gold) or a clean break that confirms continued equity dominance. Risk/reward favors being cautious on stocks here or adding gold exposure as a hedge.
$SPX vs gold on the yearly chart hitting SuperTrend resistance and the 0.5 Fib retracement level. Classic technical setup where equities have run hard against gold and now sitting at a major inflection point. Watch for either a rejection here (rotation into gold) or a clean break that confirms continued equity dominance. Risk/reward favors being cautious on stocks here or adding gold exposure as a hedge.
49
翻訳参照
Copper/Gold ratio just broke out again—classic reflationary signal that nobody wants to acknowledge right now. When copper outperforms gold, it typically means markets are pricing in better growth ahead, more industrial demand, less defensive positioning. This is a macro tell that often front-runs equity strength, especially in cyclicals and materials. If this holds, it's another data point against the recession crowd. Watch $FCX, industrial metals, and whether this confirms with PMI data or just becomes another head fake.
Copper/Gold ratio just broke out again—classic reflationary signal that nobody wants to acknowledge right now. When copper outperforms gold, it typically means markets are pricing in better growth ahead, more industrial demand, less defensive positioning. This is a macro tell that often front-runs equity strength, especially in cyclicals and materials. If this holds, it's another data point against the recession crowd. Watch $FCX, industrial metals, and whether this confirms with PMI data or just becomes another head fake.
44
翻訳参照
Quick note on market structure vs 2021-22:
Back then, liquidity got pulled across the board—everything tanked together, no discrimination. Classic macro deleveraging.
What we're seeing now? Different animal. Selectivity matters. Not a broad liquidity drain. Specific pockets getting hit while others hold or even work.
That distinction is huge for positioning. In '22 you couldn't hide. Now you can actually play offense in the right spots.
Quick note on market structure vs 2021-22:
Back then, liquidity got pulled across the board—everything tanked together, no discrimination. Classic macro deleveraging.
What we're seeing now? Different animal. Selectivity matters. Not a broad liquidity drain. Specific pockets getting hit while others hold or even work.
That distinction is huge for positioning. In '22 you couldn't hide. Now you can actually play offense in the right spots.
Back then, liquidity got pulled across the board—everything tanked together, no discrimination. Classic macro deleveraging.
What we're seeing now? Different animal. Selectivity matters. Not a broad liquidity drain. Specific pockets getting hit while others hold or even work.
That distinction is huge for positioning. In '22 you couldn't hide. Now you can actually play offense in the right spots.
5
2022年以降の大幅な下落は、そのたびに「終わりだ」と言われてきた。バリーは底値で売れと言っていた。2023年10月にはS&Pは「もう終わり」とされたが、その後急騰した。日本市場は2024年と2025年に2度暴落したが、どちらも反発した。2025年4月にはラッセル指数が「死んだ」と言われた。2026年6月には$BTCが「終わった」とされた。7月には$TSLAもおしまいだと言われた。9月には債券利回りが放物線を描くように急上昇するとまで言われていた。
そして2026年10月の今、AIはもう終わりだという話になっている。
パターンはこうだ。下落するたびに構造的な崩壊だと言われ、反発するたびに勢いをそがれる。永久弱気派は、あらゆる局面で間違い続けてきた。こうした声に従って売っていたら、痛い目に遭っていただろう。
教訓は、下落が起きないということではない。「今回は違う、すべてが壊れている」と騒ぐ人たちの的中率が0%だということだ。世界の終わりに備えるポジションを取ることは、この4年間で最悪の取引だった。非対称な成長の可能性に賭け続け、悲観論者には逆張りし、ボラティリティをサイクルの終わりと取り違えないこと。
2022年以降の大幅な下落は、そのたびに「終わりだ」と言われてきた。バリーは底値で売れと言っていた。2023年10月にはS&Pは「もう終わり」とされたが、その後急騰した。日本市場は2024年と2025年に2度暴落したが、どちらも反発した。2025年4月にはラッセル指数が「死んだ」と言われた。2026年6月には$BTCが「終わった」とされた。7月には$TSLAもおしまいだと言われた。9月には債券利回りが放物線を描くように急上昇するとまで言われていた。
そして2026年10月の今、AIはもう終わりだという話になっている。
パターンはこうだ。下落するたびに構造的な崩壊だと言われ、反発するたびに勢いをそがれる。永久弱気派は、あらゆる局面で間違い続けてきた。こうした声に従って売っていたら、痛い目に遭っていただろう。
教訓は、下落が起きないということではない。「今回は違う、すべてが壊れている」と騒ぐ人たちの的中率が0%だということだ。世界の終わりに備えるポジションを取ることは、この4年間で最悪の取引だった。非対称な成長の可能性に賭け続け、悲観論者には逆張りし、ボラティリティをサイクルの終わりと取り違えないこと。
そして2026年10月の今、AIはもう終わりだという話になっている。
パターンはこうだ。下落するたびに構造的な崩壊だと言われ、反発するたびに勢いをそがれる。永久弱気派は、あらゆる局面で間違い続けてきた。こうした声に従って売っていたら、痛い目に遭っていただろう。
教訓は、下落が起きないということではない。「今回は違う、すべてが壊れている」と騒ぐ人たちの的中率が0%だということだ。世界の終わりに備えるポジションを取ることは、この4年間で最悪の取引だった。非対称な成長の可能性に賭け続け、悲観論者には逆張りし、ボラティリティをサイクルの終わりと取り違えないこと。
10
地政学的緊張が今回の売りを招いているというのなら、金と銀はヘッジ資産としての適性試験に落ちたことになる。どちらも株式とともに大きく売られた。典型的な安全資産という見方は完全に崩れた。実際の要因は地政学リスクではないか、あるいは貴金属が防衛資産としての信頼を失ったかのどちらかだ。より可能性が高いのは、これは恐怖による取引ではなく、流動性イベントかポジションの巻き戻しだということ。相関が1.0になると、何も機能しない。
地政学的緊張が今回の売りを招いているというのなら、金と銀はヘッジ資産としての適性試験に落ちたことになる。どちらも株式とともに大きく売られた。典型的な安全資産という見方は完全に崩れた。実際の要因は地政学リスクではないか、あるいは貴金属が防衛資産としての信頼を失ったかのどちらかだ。より可能性が高いのは、これは恐怖による取引ではなく、流動性イベントかポジションの巻き戻しだということ。相関が1.0になると、何も機能しない。
261
$TSLAのサイバーキャブ事業は、オースティンですでにARRが5,000万ドルに達し、急速に拡大しているとのこと。事実なら、皆が疑問視してきたロボタクシー事業のユニットエコノミクスを裏付ける重要な実績となる。規制に友好的で、管理された環境にあり、テスラの顧客基盤が厚いオースティンを実証実験の場に選んだのは理にかなっている。今後の拡大の兆しと、この収益が持続可能なのか、それとも初期導入者の目新しさによるものにすぎないのかに注目したい。ロボタクシー懐疑派の声は大きかったが、1都市でARR5,000万ドルとなれば、見方を変えざるを得ないだろう。
$TSLAのサイバーキャブ事業は、オースティンですでにARRが5,000万ドルに達し、急速に拡大しているとのこと。事実なら、皆が疑問視してきたロボタクシー事業のユニットエコノミクスを裏付ける重要な実績となる。規制に友好的で、管理された環境にあり、テスラの顧客基盤が厚いオースティンを実証実験の場に選んだのは理にかなっている。今後の拡大の兆しと、この収益が持続可能なのか、それとも初期導入者の目新しさによるものにすぎないのかに注目したい。ロボタクシー懐疑派の声は大きかったが、1都市でARR5,000万ドルとなれば、見方を変えざるを得ないだろう。
98
$AMZNはここで弱含みに見えます。月足の一目均衡表の基準線は224.29にあり、注目すべき水準です。現在のサポートを割り込めば、そこが引き寄せられる目標になります。さらに下値を試す、明確なテクニカルセットアップです。
$AMZNはここで弱含みに見えます。月足の一目均衡表の基準線は224.29にあり、注目すべき水準です。現在のサポートを割り込めば、そこが引き寄せられる目標になります。さらに下値を試す、明確なテクニカルセットアップです。
141
各銘柄の強さをチェック:$IWMの小型株に活気が戻り、$SCHDの高配当・高品質株は底堅く、$TSLAは依然として勢いを保ち、$PEPEはミームコインとしての底力を見せ、中国資産にも買いが入っています。景気敏感株や投機的な銘柄など、リスク選好型の投資先への資金シフトは、投資家の強気姿勢が戻りつつあることを示唆しています。小型株の上昇銘柄の広がりが持続するかに注目してください。それが、より広範な上昇局面が続くかを見極める本当の手がかりです。
各銘柄の強さをチェック:$IWMの小型株に活気が戻り、$SCHDの高配当・高品質株は底堅く、$TSLAは依然として勢いを保ち、$PEPEはミームコインとしての底力を見せ、中国資産にも買いが入っています。景気敏感株や投機的な銘柄など、リスク選好型の投資先への資金シフトは、投資家の強気姿勢が戻りつつあることを示唆しています。小型株の上昇銘柄の広がりが持続するかに注目してください。それが、より広範な上昇局面が続くかを見極める本当の手がかりです。
96
アジア市場への資金シフトはまだ続いているのでしょうか? アジアへの資金流入が続いているようです。これが単なるノイズなのか、本格的なポジション調整の始まりなのか、注目する価値があります。米国のテクノロジー株をロングしている方や、米国資産を多めに保有している方にとっては、リバランスやヘッジを検討する初期シグナルかもしれません。為替の動向にも目を配りましょう。ドルに対してアジア通貨が強まれば、こうした動きがさらに大きくなる可能性があります。まだ確信を持って判断できる段階ではありませんが、状況は興味深くなってきています。
アジア市場への資金シフトはまだ続いているのでしょうか? アジアへの資金流入が続いているようです。これが単なるノイズなのか、本格的なポジション調整の始まりなのか、注目する価値があります。米国のテクノロジー株をロングしている方や、米国資産を多めに保有している方にとっては、リバランスやヘッジを検討する初期シグナルかもしれません。為替の動向にも目を配りましょう。ドルに対してアジア通貨が強まれば、こうした動きがさらに大きくなる可能性があります。まだ確信を持って判断できる段階ではありませんが、状況は興味深くなってきています。
285
$ETHの週足チャートでは、2100~2200が重要なサポートゾーンとして示されています。もう一段下落した場合、買い手が現れるはずの水準です。反発するか、下落余地が広がるブレイクが起きるかを見極める、分かりやすい注目水準です。
$ETHの週足チャートでは、2100~2200が重要なサポートゾーンとして示されています。もう一段下落した場合、買い手が現れるはずの水準です。反発するか、下落余地が広がるブレイクが起きるかを見極める、分かりやすい注目水準です。
328
一部該当
$INTCの決算説明会は、どうやら大失敗だったようだ。聞いていた人たちによると、CEOのリップ・ブーは完全に途方に暮れているように聞こえたという。立て直しの成否が明確な実行計画にかかっているのに、リーダーがその計画を説明できないのはまずい。これはまさに、バリュエーションが書面上どれほど割安に見えても、機関投資家が投資を見送る原因となる経営リスクだ。パット・ゲルシンガー流の復活劇を期待して$INTCを保有しているなら、今回の説明会は警戒信号と受け止めるべきだ。経営陣の信頼性は重要だ。特にファウンドリーのような資本集約型事業では、何年にもわたって完璧な実行が求められる。市場は今、さらなる不確実性を織り込みつつあるのだろう。
$INTCの決算説明会は、どうやら大失敗だったようだ。聞いていた人たちによると、CEOのリップ・ブーは完全に途方に暮れているように聞こえたという。立て直しの成否が明確な実行計画にかかっているのに、リーダーがその計画を説明できないのはまずい。これはまさに、バリュエーションが書面上どれほど割安に見えても、機関投資家が投資を見送る原因となる経営リスクだ。パット・ゲルシンガー流の復活劇を期待して$INTCを保有しているなら、今回の説明会は警戒信号と受け止めるべきだ。経営陣の信頼性は重要だ。特にファウンドリーのような資本集約型事業では、何年にもわたって完璧な実行が求められる。市場は今、さらなる不確実性を織り込みつつあるのだろう。
1
1.2k
$BTCは週足の一目均衡表の雲をサポートとして維持しています。ここが重要な分岐点です。構造は明確で、しっかり維持されています。上を保てば、見通しは引き続き強気です。下抜ければ、より深い調整が見込まれます。今週は雲の端を注意深く見守りましょう。
$BTCは週足の一目均衡表の雲をサポートとして維持しています。ここが重要な分岐点です。構造は明確で、しっかり維持されています。上を保てば、見通しは引き続き強気です。下抜ければ、より深い調整が見込まれます。今週は雲の端を注意深く見守りましょう。
90
明日、$AMZNを買うつもり。$GOOGLも買うかも。
今みんなを騒がせている雑音も、私は利用する。こういう下落は長続きしない。どちらも中核となるインフラ関連銘柄だ——クラウド、AI向けコンピューティング、そして利益を生み出し続ける広告エンジン。市場心理は下方向に振れすぎている。
これが基本戦略だ。恐怖が高まっても、ファンダメンタルズは揺るがない。そこで買い増していく。難しいことじゃない。
明日、$AMZNを買うつもり。$GOOGLも買うかも。
今みんなを騒がせている雑音も、私は利用する。こういう下落は長続きしない。どちらも中核となるインフラ関連銘柄だ——クラウド、AI向けコンピューティング、そして利益を生み出し続ける広告エンジン。市場心理は下方向に振れすぎている。
これが基本戦略だ。恐怖が高まっても、ファンダメンタルズは揺るがない。そこで買い増していく。難しいことじゃない。
今みんなを騒がせている雑音も、私は利用する。こういう下落は長続きしない。どちらも中核となるインフラ関連銘柄だ——クラウド、AI向けコンピューティング、そして利益を生み出し続ける広告エンジン。市場心理は下方向に振れすぎている。
これが基本戦略だ。恐怖が高まっても、ファンダメンタルズは揺るがない。そこで買い増していく。難しいことじゃない。
525
今夜は$COINの決算発表だ。内容がひどいことは誰もが分かっている。本当の取引材料は数字そのものではなく、すでに織り込み済みの悪材料を市場がどう消化するかだ。確認を受けてさらに大きく売られるのか、それともポジションが弱気に傾きすぎていたために安心感から反発するのか。見出しではなく、値動きを見よう。
今夜は$COINの決算発表だ。内容がひどいことは誰もが分かっている。本当の取引材料は数字そのものではなく、すでに織り込み済みの悪材料を市場がどう消化するかだ。確認を受けてさらに大きく売られるのか、それともポジションが弱気に傾きすぎていたために安心感から反発するのか。見出しではなく、値動きを見よう。
108
ログインして、さらにコンテンツを読む
厳選トピックで世界の暗号資産トレーダーの仲間入り
⚡️ 暗号資産に関する最新かつ有益な情報が見つかります。
💬 世界最大の暗号資産取引所から信頼されています。
👍 認証を受けたクリエイターから、有益なインサイトを得られます。
メール / 電話番号