
#cryptoinsights
cryptoinsights
閲覧回数 10.8M
15,388人が討論中
注目
最新
·
--
翻訳参照
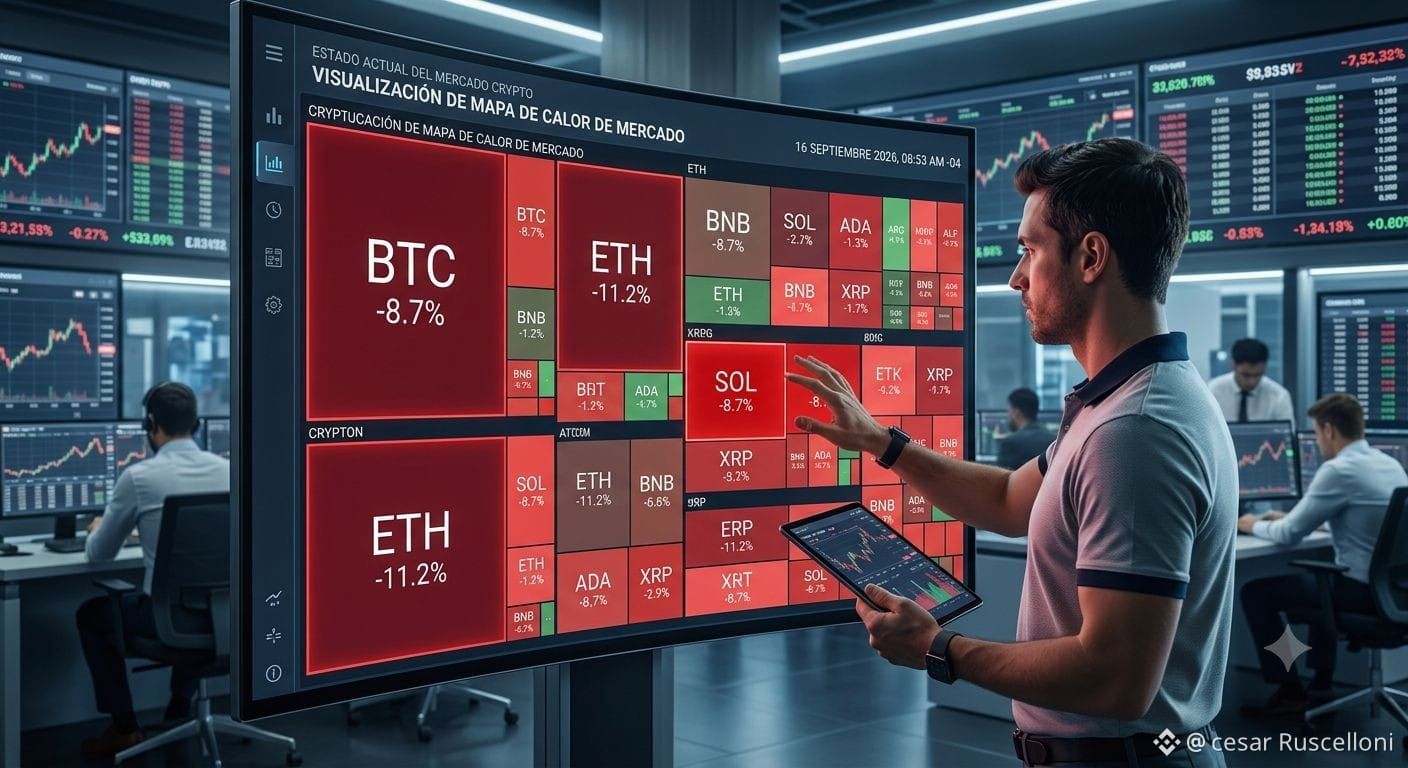
#CryptoInsights 👁️ El "Efecto Matriz": Por qué el 90% de los traders pierden dinero cuando el mercado está en verde 🟩
Cuerpo de la publicación:
Existe una paradoja no escrita en el trading de criptomonedas: las peores decisiones financieras casi nunca se toman durante un Crash, sino durante los días de euforia.
Psicológicamente, cuando el mercado se tiñe de verde, tu cerebro activa el mismo circuito de dopamina que una máquina tragamonedas. Dejas de analizar proyectos y comienzas a calcular cuánto dinero habrías ganado si hubieses invertido más.
Ese pensamiento tiene un nombre en finanzas conductuales: Sesgo de Sesgo de Retrospectiva y Euforia Proyectada.
Aquí tienes el mapa mental que distingue a un inversor promedio de un profesional cuando las velas verdes dominan la pantalla:
El Inversor Promedio:
Ve una moneda subir un +40% en 24 horas.
Siente la urgencia de no quedarse fuera (FOMO).
Compra en el pico de la vela.
Sirve como "liquidez de salida" para los grandes fondos.
El Trader Profesional:
Ve una moneda subir un +40% en 24 horas.
Ejecuta un Take Profit parcial para asegurar capital.
Mueve su Stop Loss a zona de ganancias.
Reasigna liquidez a proyectos sólidos que aún no han explotado.
💡 La Regla del Espejo Inverso:
Si la idea de comprar te da miedo porque el mercado está rojo, probablemente sea un buen momento para analizar entradas. Si sientes una euforia incontrolable por comprar porque todo está subiendo, ya vas tarde.
El secreto del mercado no es adivinar el futuro, es dominar la química de tu cerebro antes de presionar el botón de Trade.
💬 ¿Cuál ha sido la lección más costosa que te ha enseñado la euforia del mercado? Te leo en los comentarios. 👇
#BinanceSquare
#Write2Earn
#Binance
#tradingtips
#CryptoInsights 👁️ El "Efecto Matriz": Por qué el 90% de los traders pierden dinero cuando el mercado está en verde 🟩
Cuerpo de la publicación:
Existe una paradoja no escrita en el trading de criptomonedas: las peores decisiones financieras casi nunca se toman durante un Crash, sino durante los días de euforia.
Psicológicamente, cuando el mercado se tiñe de verde, tu cerebro activa el mismo circuito de dopamina que una máquina tragamonedas. Dejas de analizar proyectos y comienzas a calcular cuánto dinero habrías ganado si hubieses invertido más.
Ese pensamiento tiene un nombre en finanzas conductuales: Sesgo de Sesgo de Retrospectiva y Euforia Proyectada.
Aquí tienes el mapa mental que distingue a un inversor promedio de un profesional cuando las velas verdes dominan la pantalla:
El Inversor Promedio:
Ve una moneda subir un +40% en 24 horas.
Siente la urgencia de no quedarse fuera (FOMO).
Compra en el pico de la vela.
Sirve como "liquidez de salida" para los grandes fondos.
El Trader Profesional:
Ve una moneda subir un +40% en 24 horas.
Ejecuta un Take Profit parcial para asegurar capital.
Mueve su Stop Loss a zona de ganancias.
Reasigna liquidez a proyectos sólidos que aún no han explotado.
💡 La Regla del Espejo Inverso:
Si la idea de comprar te da miedo porque el mercado está rojo, probablemente sea un buen momento para analizar entradas. Si sientes una euforia incontrolable por comprar porque todo está subiendo, ya vas tarde.
El secreto del mercado no es adivinar el futuro, es dominar la química de tu cerebro antes de presionar el botón de Trade.
💬 ¿Cuál ha sido la lección más costosa que te ha enseñado la euforia del mercado? Te leo en los comentarios. 👇
#BinanceSquare
#Write2Earn
#Binance
#tradingtips
Cuerpo de la publicación:
Existe una paradoja no escrita en el trading de criptomonedas: las peores decisiones financieras casi nunca se toman durante un Crash, sino durante los días de euforia.
Psicológicamente, cuando el mercado se tiñe de verde, tu cerebro activa el mismo circuito de dopamina que una máquina tragamonedas. Dejas de analizar proyectos y comienzas a calcular cuánto dinero habrías ganado si hubieses invertido más.
Ese pensamiento tiene un nombre en finanzas conductuales: Sesgo de Sesgo de Retrospectiva y Euforia Proyectada.
Aquí tienes el mapa mental que distingue a un inversor promedio de un profesional cuando las velas verdes dominan la pantalla:
El Inversor Promedio:
Ve una moneda subir un +40% en 24 horas.
Siente la urgencia de no quedarse fuera (FOMO).
Compra en el pico de la vela.
Sirve como "liquidez de salida" para los grandes fondos.
El Trader Profesional:
Ve una moneda subir un +40% en 24 horas.
Ejecuta un Take Profit parcial para asegurar capital.
Mueve su Stop Loss a zona de ganancias.
Reasigna liquidez a proyectos sólidos que aún no han explotado.
💡 La Regla del Espejo Inverso:
Si la idea de comprar te da miedo porque el mercado está rojo, probablemente sea un buen momento para analizar entradas. Si sientes una euforia incontrolable por comprar porque todo está subiendo, ya vas tarde.
El secreto del mercado no es adivinar el futuro, es dominar la química de tu cerebro antes de presionar el botón de Trade.
💬 ¿Cuál ha sido la lección más costosa que te ha enseñado la euforia del mercado? Te leo en los comentarios. 👇
#BinanceSquare
#Write2Earn
#Binance
#tradingtips
113

ヘイズ:円のアンワインドが暗号資産の次の流動性ラッシュを後押ししうる
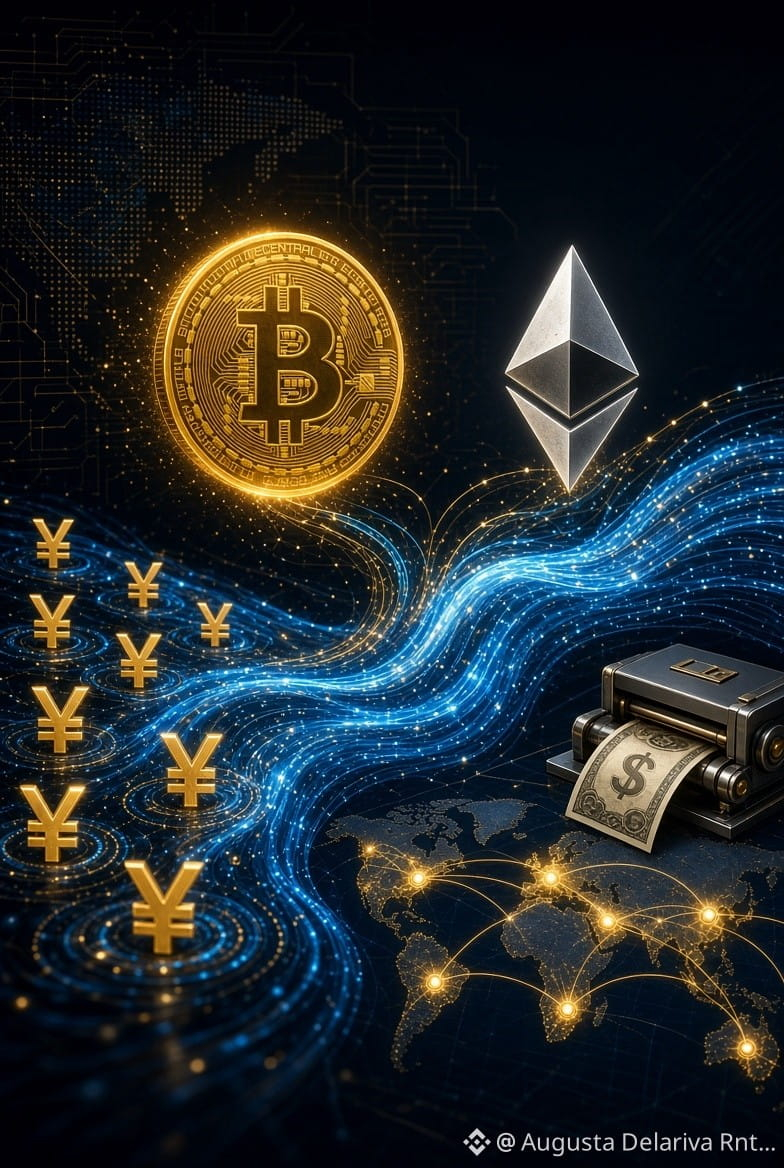
アーサー・ヘイズは、日本円のキャリートレード解消とフランス国債のストレスが重なることで、FRBがさらにドルを発行せざるを得なくなる可能性があり、それがビットコインとイーサリアムにとって「マネー印刷の大盤振る舞い」になり得ると述べています。
年末までにBTCが史上最高値を奪還する可能性がある一方で、ETHは「最も嫌われているメガキャップ」として、彼の最大級の大型株ベットだと見ています。
重要な理由
暗号資産は、これまでの4年サイクルから、資金フロー主導の動きへと移行しています。サイラーが言うように、ビットコインはすでにデジタル・キャピタルとして勝利を収めています。FXや債券における流動性ストレスが、純粋なチャートの形よりも今は重要になっているのです。
要点
EUR/JPYと長期ゾーンの利回りを注視しましょう。世界的に資金調達がタイトになる局面では、実物資産はしばしば、印刷されたマネーの次の波を吸収します。
市場構造と機関投資家の「パイプ」が、実際にその資本がどれだけ速く到達するかを決めることになります。
#CryptoInsights #Marketsentimentstoday #CryptoEducation💡🚀 #Bitcoin #Ethereum
ヘイズ:円のアンワインドが暗号資産の次の流動性ラッシュを後押ししうる
アーサー・ヘイズは、日本円のキャリートレード解消とフランス国債のストレスが重なることで、FRBがさらにドルを発行せざるを得なくなる可能性があり、それがビットコインとイーサリアムにとって「マネー印刷の大盤振る舞い」になり得ると述べています。
年末までにBTCが史上最高値を奪還する可能性がある一方で、ETHは「最も嫌われているメガキャップ」として、彼の最大級の大型株ベットだと見ています。
重要な理由
暗号資産は、これまでの4年サイクルから、資金フロー主導の動きへと移行しています。サイラーが言うように、ビットコインはすでにデジタル・キャピタルとして勝利を収めています。FXや債券における流動性ストレスが、純粋なチャートの形よりも今は重要になっているのです。
要点
EUR/JPYと長期ゾーンの利回りを注視しましょう。世界的に資金調達がタイトになる局面では、実物資産はしばしば、印刷されたマネーの次の波を吸収します。
市場構造と機関投資家の「パイプ」が、実際にその資本がどれだけ速く到達するかを決めることになります。
#CryptoInsights #Marketsentimentstoday #CryptoEducation💡🚀 #Bitcoin #Ethereum
アーサー・ヘイズは、日本円のキャリートレード解消とフランス国債のストレスが重なることで、FRBがさらにドルを発行せざるを得なくなる可能性があり、それがビットコインとイーサリアムにとって「マネー印刷の大盤振る舞い」になり得ると述べています。
年末までにBTCが史上最高値を奪還する可能性がある一方で、ETHは「最も嫌われているメガキャップ」として、彼の最大級の大型株ベットだと見ています。
重要な理由
暗号資産は、これまでの4年サイクルから、資金フロー主導の動きへと移行しています。サイラーが言うように、ビットコインはすでにデジタル・キャピタルとして勝利を収めています。FXや債券における流動性ストレスが、純粋なチャートの形よりも今は重要になっているのです。
要点
EUR/JPYと長期ゾーンの利回りを注視しましょう。世界的に資金調達がタイトになる局面では、実物資産はしばしば、印刷されたマネーの次の波を吸収します。
市場構造と機関投資家の「パイプ」が、実際にその資本がどれだけ速く到達するかを決めることになります。
#CryptoInsights #Marketsentimentstoday #CryptoEducation💡🚀 #Bitcoin #Ethereum
48
翻訳参照
Order blocks on Mira (MIRA) show a bullish breakout while trading volume surges, suggesting growing investor sentiment. Meanwhile, Jasmy (JASMY) is expanding its ecosystem with new data privacy solutions, driving adoption and liquidity. MrvLB (MRVLB) maintains steady momentum, attracting institutional interest through innovative staking protocols. Together, they illustrate a diversified momentum wave across the BSC space. 🚀 #CryptoInsights #SMC
Order blocks on Mira (MIRA) show a bullish breakout while trading volume surges, suggesting growing investor sentiment. Meanwhile, Jasmy (JASMY) is expanding its ecosystem with new data privacy solutions, driving adoption and liquidity. MrvLB (MRVLB) maintains steady momentum, attracting institutional interest through innovative staking protocols. Together, they illustrate a diversified momentum wave across the BSC space. 🚀 #CryptoInsights #SMC
1
358

·
--
📊 最新のスキャンでは、3つの非常に異なるモメンタム・プロファイルが見つかりました。
$RAY
{spot}(RAYUSDT)
が、このグループをはっきりとリードしています。
$1.685で、RSIは58.65。一方でトレンドの数値は+8.13%です。これは他の2つよりはるかに強いトレンド指標で、このスキャンにおけるRAYは明白なモメンタムのリーダーです。
$ETHFI
{spot}(ETHFIUSDT)
は、より落ち着いた動きです。
価格: $0.677
RSI: 53.04
トレンド: +2.92%
数値はプラスですが、RAYで見られるような加速感はありません。同じくらい重要であるのは、「最も高いRSIを探すこと」だけではなく、その差がどれだけ効くかという点です。
そして、$SOL
{future}(SOLUSDT)
があります。
$102.28の時点で、SOLは3つの中で最も高いRSI(60.65)を持っていますが、このスキャンでのトレンド読みはわずか+0.13%です。
では、どのシグナルをより信じるべきでしょうか?
🚀 RAY — 最強のトレンド
⚖️ ETHFI — バランスの取れた読み
🔥 SOL — 最強のRSI
同じ数字でも、違う物語を語ることがあります。だから私は、指標を1つだけ見るより、モメンタムを比較するほうが好きなんです。
もし最初に1つのチャートを見に行くなら、どれを見ますか?
#CryptoTrading #Altcoins #cryptoinsights
📊 最新のスキャンでは、3つの非常に異なるモメンタム・プロファイルが見つかりました。
$RAY
が、このグループをはっきりとリードしています。
$1.685で、RSIは58.65。一方でトレンドの数値は+8.13%です。これは他の2つよりはるかに強いトレンド指標で、このスキャンにおけるRAYは明白なモメンタムのリーダーです。
$ETHFI
は、より落ち着いた動きです。
価格: $0.677
RSI: 53.04
トレンド: +2.92%
数値はプラスですが、RAYで見られるような加速感はありません。同じくらい重要であるのは、「最も高いRSIを探すこと」だけではなく、その差がどれだけ効くかという点です。
そして、$SOL
があります。
$102.28の時点で、SOLは3つの中で最も高いRSI(60.65)を持っていますが、このスキャンでのトレンド読みはわずか+0.13%です。
では、どのシグナルをより信じるべきでしょうか?
🚀 RAY — 最強のトレンド
⚖️ ETHFI — バランスの取れた読み
🔥 SOL — 最強のRSI
同じ数字でも、違う物語を語ることがあります。だから私は、指標を1つだけ見るより、モメンタムを比較するほうが好きなんです。
もし最初に1つのチャートを見に行くなら、どれを見ますか?
#CryptoTrading #Altcoins #cryptoinsights
$RAY
が、このグループをはっきりとリードしています。
$1.685で、RSIは58.65。一方でトレンドの数値は+8.13%です。これは他の2つよりはるかに強いトレンド指標で、このスキャンにおけるRAYは明白なモメンタムのリーダーです。
$ETHFI
は、より落ち着いた動きです。
価格: $0.677
RSI: 53.04
トレンド: +2.92%
数値はプラスですが、RAYで見られるような加速感はありません。同じくらい重要であるのは、「最も高いRSIを探すこと」だけではなく、その差がどれだけ効くかという点です。
そして、$SOL
があります。
$102.28の時点で、SOLは3つの中で最も高いRSI(60.65)を持っていますが、このスキャンでのトレンド読みはわずか+0.13%です。
では、どのシグナルをより信じるべきでしょうか?
🚀 RAY — 最強のトレンド
⚖️ ETHFI — バランスの取れた読み
🔥 SOL — 最強のRSI
同じ数字でも、違う物語を語ることがあります。だから私は、指標を1つだけ見るより、モメンタムを比較するほうが好きなんです。
もし最初に1つのチャートを見に行くなら、どれを見ますか?
#CryptoTrading #Altcoins #cryptoinsights
🟢 RAY
20%
🔵 ETHFI
60%
🟣 SOL
16%
👀 None for now
4%
25 投票 • 投票は終了しました
795

·
--
🦈 $BTC REVEALS なぜ規律がクイックなミーム・ゲインに勝るのか 💥
賢い資金は、ミームの盛り上がりを追いかけることはめったにありません。彼らは、5年もの間のネット入金に耐えてきたオーダーブロックに根を張ります。📊 直近の4Hチャートでの流動性スイープは、機関投資家が需要ゾーンを再構築していることを示しており、典型的な🦈の動きで、長期的なバイアスを示唆します。
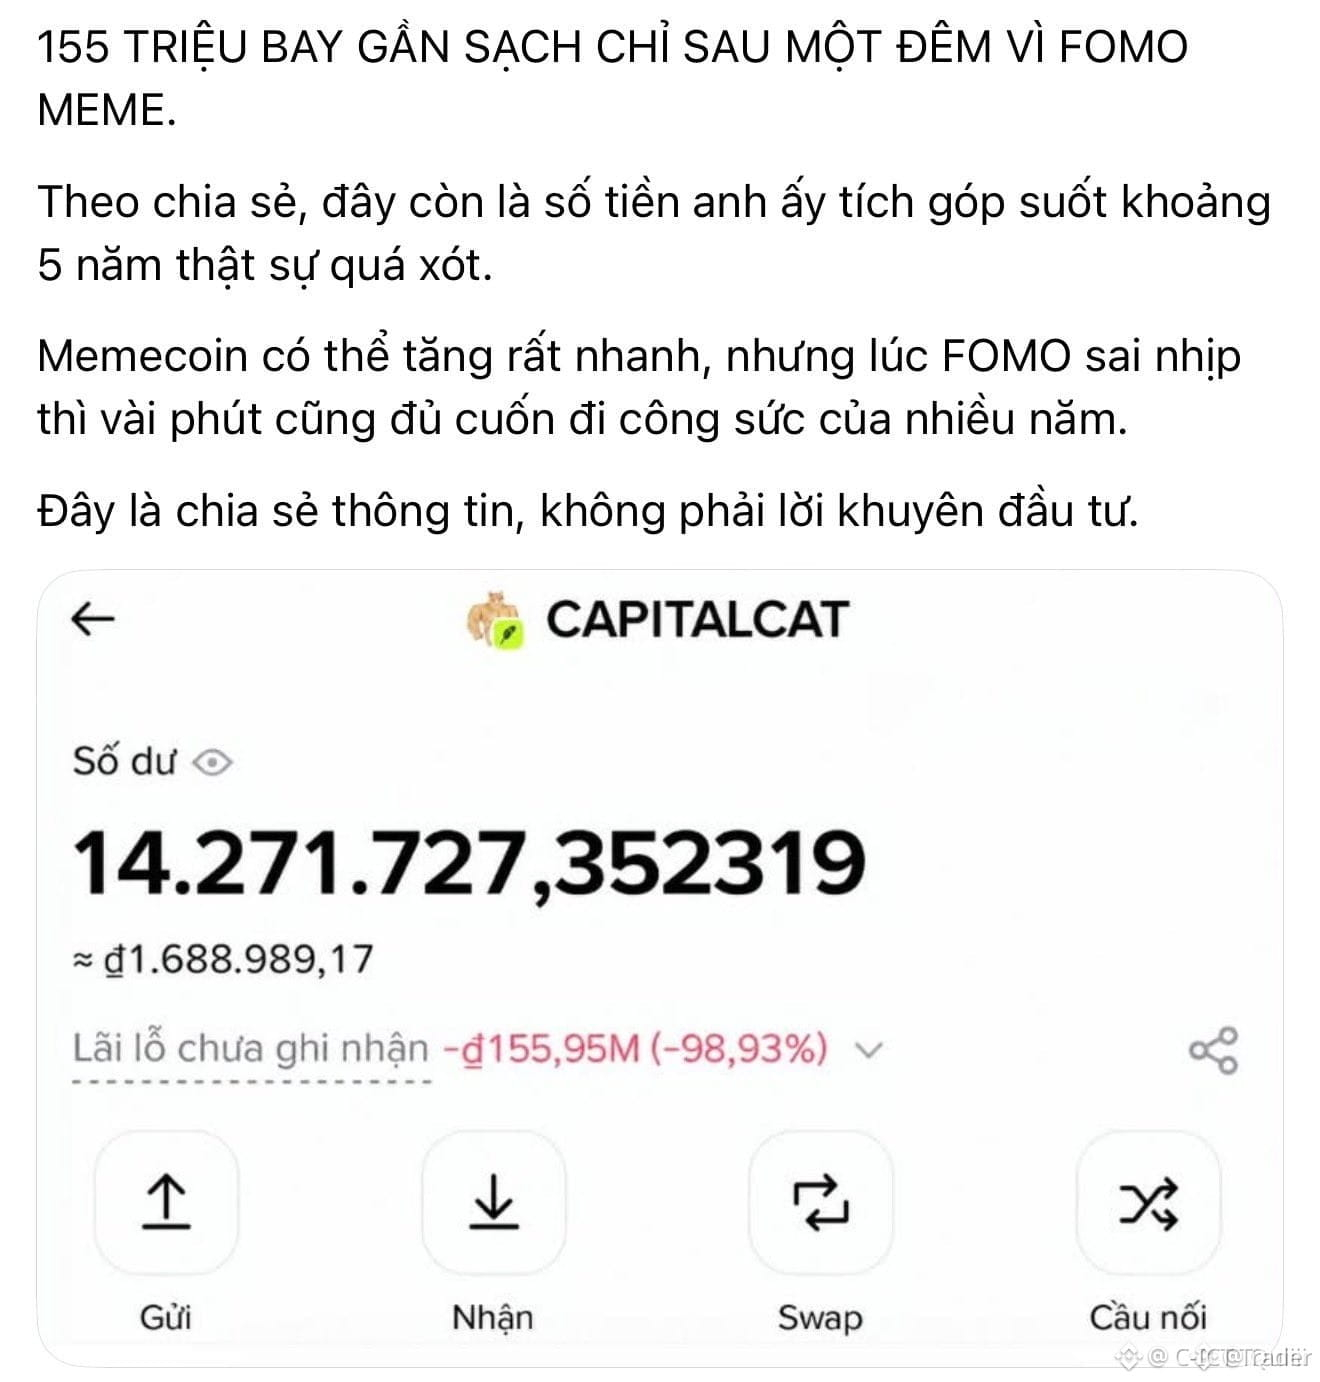
あなたの155 M VND(約$6k)の保有は、規律ある積み上げが一発のフラッシュ・ポンプ幻想より優れていることを証明しています。📈 リスクを尊重し、流動性プールが補充されるのを見守り、市場の非効率がフェアバリュー・ギャップを埋めるのを待ちましょう。💡
💬 覇気よりも規律を優先してトレードする準備はできていますか? 👇
⚠️ 金融助言ではありません。常にリスク管理をしてください。🛡️
🏷️ #BTC #Discipline #LongTerm #CryptoInsights
🔥 💎
🦈 $BTC REVEALS なぜ規律がクイックなミーム・ゲインに勝るのか 💥
賢い資金は、ミームの盛り上がりを追いかけることはめったにありません。彼らは、5年もの間のネット入金に耐えてきたオーダーブロックに根を張ります。📊 直近の4Hチャートでの流動性スイープは、機関投資家が需要ゾーンを再構築していることを示しており、典型的な🦈の動きで、長期的なバイアスを示唆します。
あなたの155 M VND(約$6k)の保有は、規律ある積み上げが一発のフラッシュ・ポンプ幻想より優れていることを証明しています。📈 リスクを尊重し、流動性プールが補充されるのを見守り、市場の非効率がフェアバリュー・ギャップを埋めるのを待ちましょう。💡
💬 覇気よりも規律を優先してトレードする準備はできていますか? 👇
⚠️ 金融助言ではありません。常にリスク管理をしてください。🛡️
🏷️ #BTC #Discipline #LongTerm #CryptoInsights
🔥 💎
賢い資金は、ミームの盛り上がりを追いかけることはめったにありません。彼らは、5年もの間のネット入金に耐えてきたオーダーブロックに根を張ります。📊 直近の4Hチャートでの流動性スイープは、機関投資家が需要ゾーンを再構築していることを示しており、典型的な🦈の動きで、長期的なバイアスを示唆します。
あなたの155 M VND(約$6k)の保有は、規律ある積み上げが一発のフラッシュ・ポンプ幻想より優れていることを証明しています。📈 リスクを尊重し、流動性プールが補充されるのを見守り、市場の非効率がフェアバリュー・ギャップを埋めるのを待ちましょう。💡
💬 覇気よりも規律を優先してトレードする準備はできていますか? 👇
⚠️ 金融助言ではありません。常にリスク管理をしてください。🛡️
🏷️ #BTC #Discipline #LongTerm #CryptoInsights
🔥 💎

14

·
--
記事
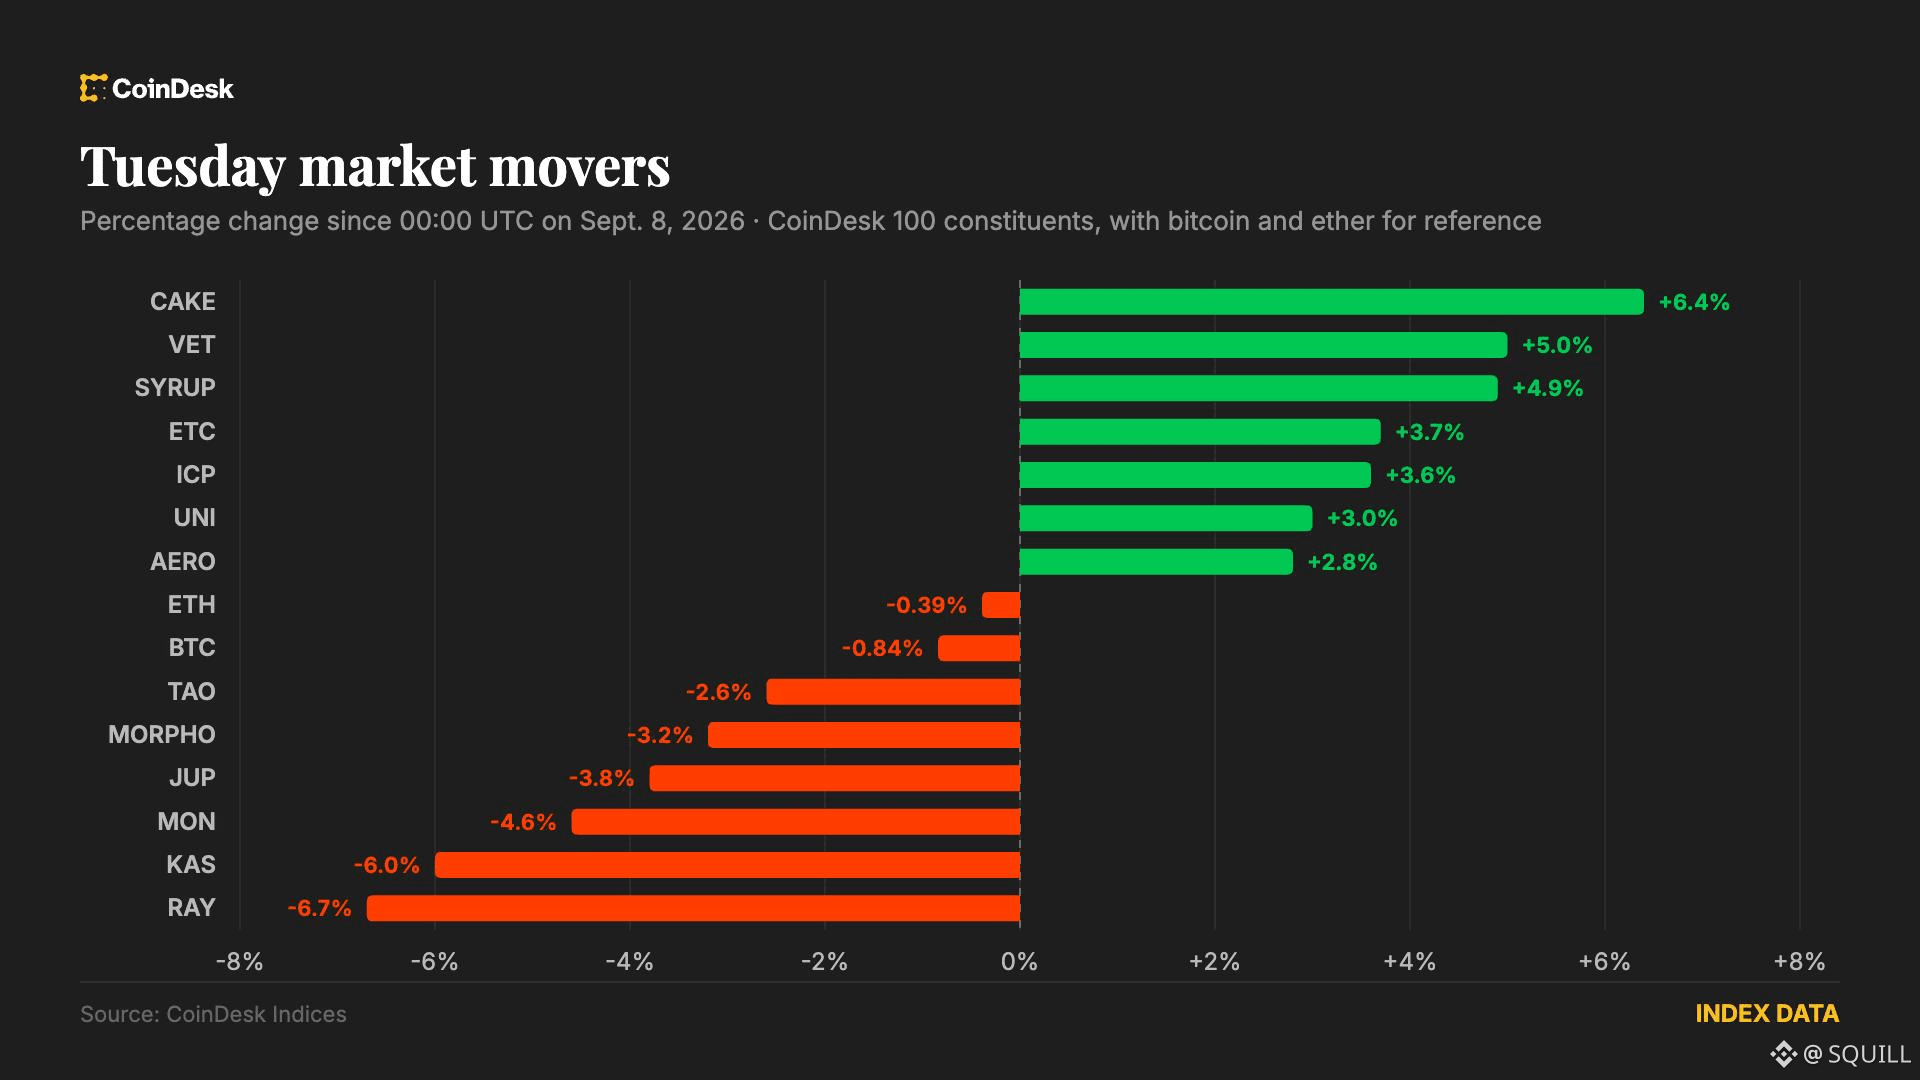
ビットコインの下落:なぜ$BTCは下がり、BNBチェーンとDeFiトークンは急騰したのかビットコインは78,874ドルまで下落し、0.42%の下げとなった一方で、BNBチェーンのトークンやDeFi資産は上昇し、市場のセンチメントが割れたことを示した。この変化は、暗号資産のエコシステムの異なるセグメントが、主要銘柄であるコインが圧力を受けていても、独立して動き得ることを浮き彫りにしている。
コンセプト
ビットコインの価格が下がると、多くの投資家は市場全体も追随すると考えがちです。しかし、今回の売りでは、アルトコイン、とりわけBNBチェーンのような特定のエコシステムに紐づく銘柄が、より広いトレンドに逆らえることが明らかになりました。ビットコインを市場の「ベンチマーク株」と捉えてみてください。その値動きが雰囲気を決めることが多い一方で、DeFiのような個別のセクターは、プロジェクトのファンダメンタルズ、提携、あるいはネットワークのアップグレードといった要因に基づいて、自分自身の進路を描くことができます。#CryptoInsights #DeFiDynamics
ビットコインの下落:なぜ$BTCは下がり、BNBチェーンとDeFiトークンは急騰したのか
ビットコインは78,874ドルまで下落し、0.42%の下げとなった一方で、BNBチェーンのトークンやDeFi資産は上昇し、市場のセンチメントが割れたことを示した。この変化は、暗号資産のエコシステムの異なるセグメントが、主要銘柄であるコインが圧力を受けていても、独立して動き得ることを浮き彫りにしている。
コンセプト
ビットコインの価格が下がると、多くの投資家は市場全体も追随すると考えがちです。しかし、今回の売りでは、アルトコイン、とりわけBNBチェーンのような特定のエコシステムに紐づく銘柄が、より広いトレンドに逆らえることが明らかになりました。ビットコインを市場の「ベンチマーク株」と捉えてみてください。その値動きが雰囲気を決めることが多い一方で、DeFiのような個別のセクターは、プロジェクトのファンダメンタルズ、提携、あるいはネットワークのアップグレードといった要因に基づいて、自分自身の進路を描くことができます。#CryptoInsights #DeFiDynamics
コンセプト
ビットコインの価格が下がると、多くの投資家は市場全体も追随すると考えがちです。しかし、今回の売りでは、アルトコイン、とりわけBNBチェーンのような特定のエコシステムに紐づく銘柄が、より広いトレンドに逆らえることが明らかになりました。ビットコインを市場の「ベンチマーク株」と捉えてみてください。その値動きが雰囲気を決めることが多い一方で、DeFiのような個別のセクターは、プロジェクトのファンダメンタルズ、提携、あるいはネットワークのアップグレードといった要因に基づいて、自分自身の進路を描くことができます。#CryptoInsights #DeFiDynamics
7

·
--
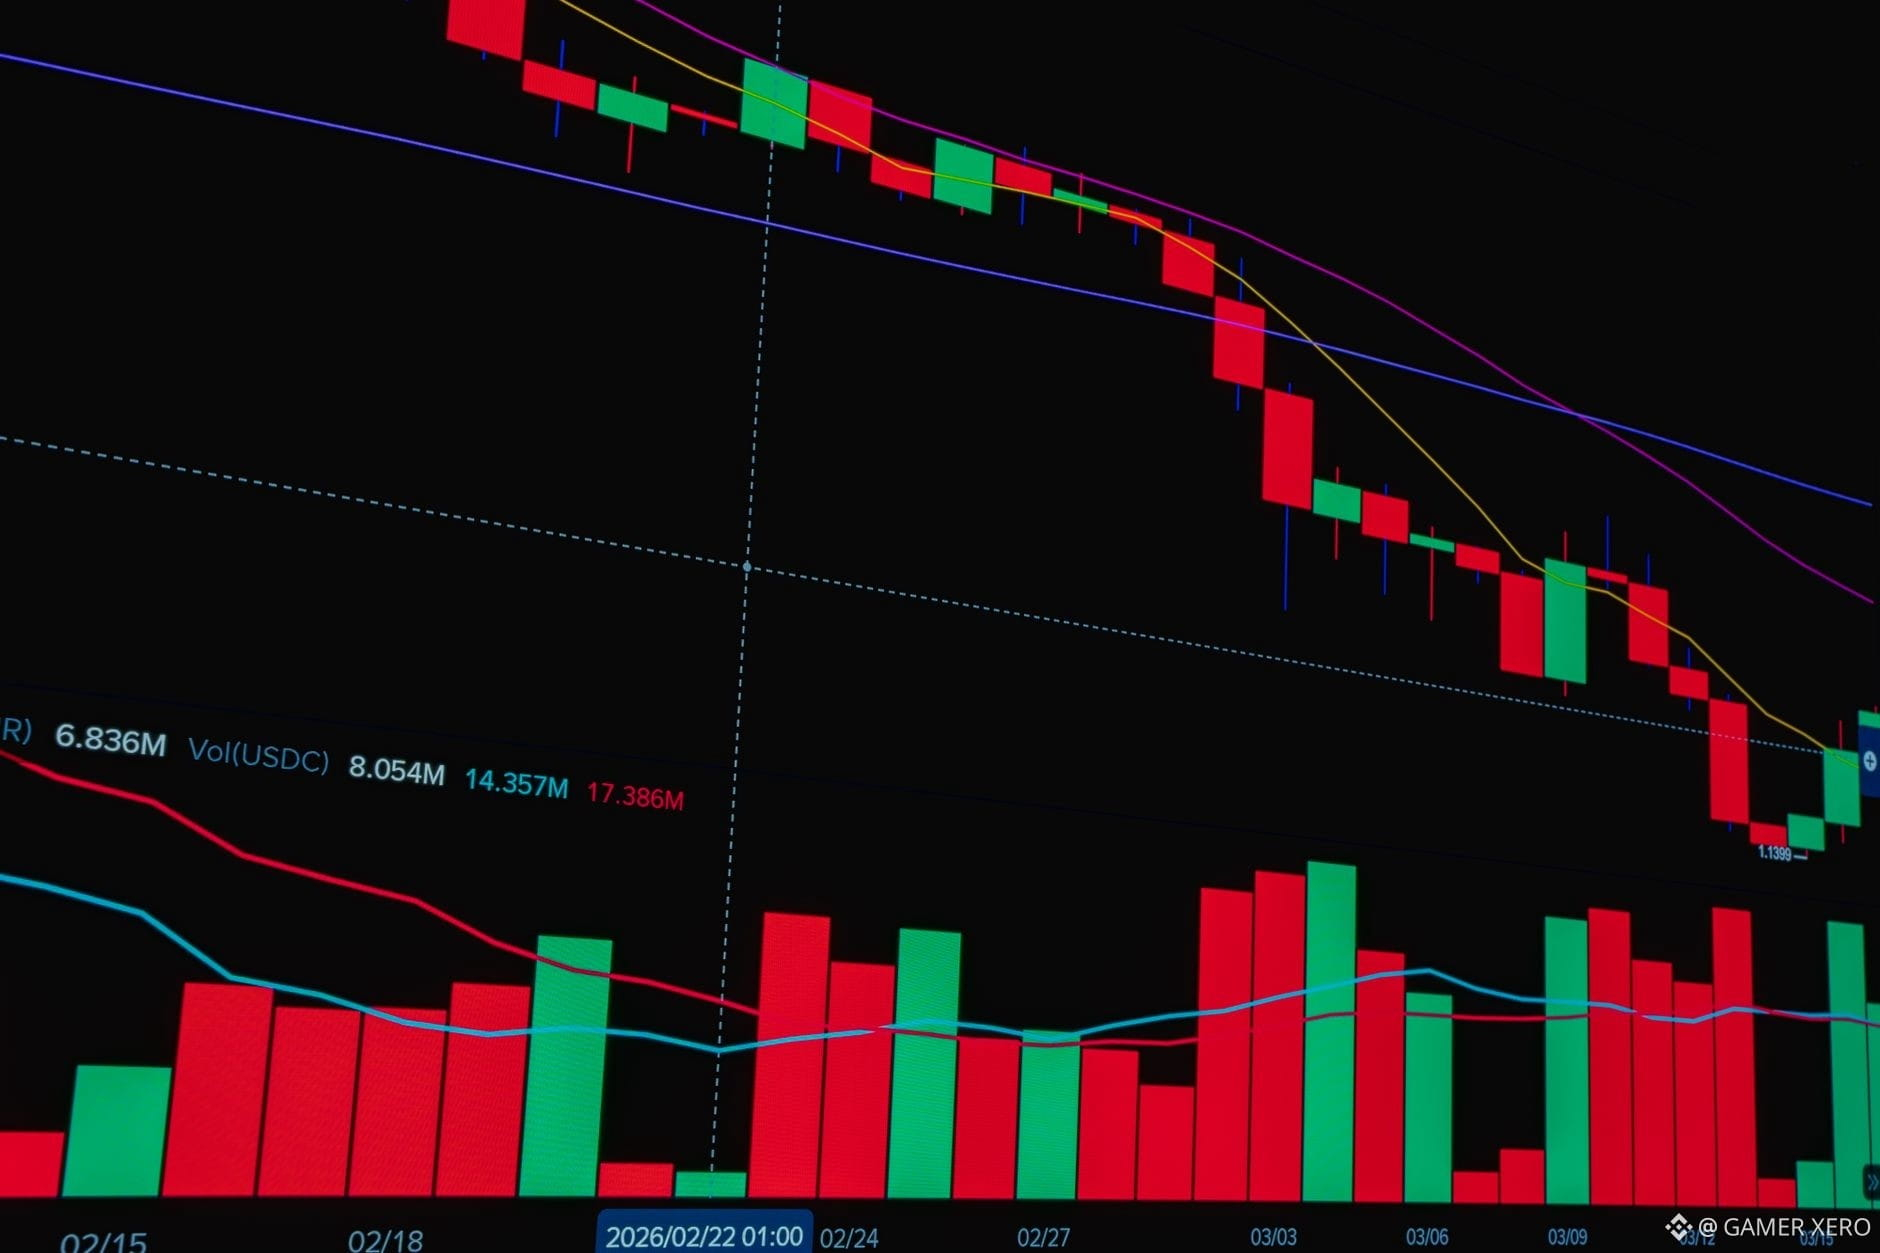
米国のCPI(消費者物価指数)発表が目前に迫っており、データはインフレが引き続きFRBの目標を上回って推移していることを示しています。暗号資産トレーダーにとっては、マクロ環境がしばらくタイトな金融政策寄りに傾いたままになり得る、ということになります。これは歴史的にリスク資産に圧力をかけ、証拠金ポジションの資金調達金利を引き締める要因にもなります。Binance Spotでは、$BTC が78,468ドル付近で推移しており、過去24時間の下落は控えめな1.2%です。一方で$ETH は2,478ドルで、下落は0.4%。これらの値動きは、市場がすでに慎重なムードを織り込んでいることを示唆しますが、本当の試金石は、CPIの数字が出た後に流動性プロバイダーがレバレッジ上限をどれだけ迅速に調整するかです。
資金調達金利が上昇すれば、板のスプレッドがよりタイトになり、防御的なポジショニングへとシフトする可能性があります。逆に、インフレが予想より弱ければ、適度な上振れの余地が再び開ける一方で、ボラティリティは抑えられるかもしれません。スポット板における売り買いの需給バランス(ビッド・アスクの不均衡)を注視することで、データが出揃っていく中で買い手と売り手のどちらが優位になっているのか、早い手がかりを得られます。
CPI発表に向けて、どのようにリスク・パラメータを調整していますか?
#CryptoInsights #Binance #Macro #GAMERXERO
米国のCPI(消費者物価指数)発表が目前に迫っており、データはインフレが引き続きFRBの目標を上回って推移していることを示しています。暗号資産トレーダーにとっては、マクロ環境がしばらくタイトな金融政策寄りに傾いたままになり得る、ということになります。これは歴史的にリスク資産に圧力をかけ、証拠金ポジションの資金調達金利を引き締める要因にもなります。Binance Spotでは、$BTC が78,468ドル付近で推移しており、過去24時間の下落は控えめな1.2%です。一方で$ETH は2,478ドルで、下落は0.4%。これらの値動きは、市場がすでに慎重なムードを織り込んでいることを示唆しますが、本当の試金石は、CPIの数字が出た後に流動性プロバイダーがレバレッジ上限をどれだけ迅速に調整するかです。
資金調達金利が上昇すれば、板のスプレッドがよりタイトになり、防御的なポジショニングへとシフトする可能性があります。逆に、インフレが予想より弱ければ、適度な上振れの余地が再び開ける一方で、ボラティリティは抑えられるかもしれません。スポット板における売り買いの需給バランス(ビッド・アスクの不均衡)を注視することで、データが出揃っていく中で買い手と売り手のどちらが優位になっているのか、早い手がかりを得られます。
CPI発表に向けて、どのようにリスク・パラメータを調整していますか?
#CryptoInsights #Binance #Macro #GAMERXERO
資金調達金利が上昇すれば、板のスプレッドがよりタイトになり、防御的なポジショニングへとシフトする可能性があります。逆に、インフレが予想より弱ければ、適度な上振れの余地が再び開ける一方で、ボラティリティは抑えられるかもしれません。スポット板における売り買いの需給バランス(ビッド・アスクの不均衡)を注視することで、データが出揃っていく中で買い手と売り手のどちらが優位になっているのか、早い手がかりを得られます。
CPI発表に向けて、どのようにリスク・パラメータを調整していますか?
#CryptoInsights #Binance #Macro #GAMERXERO
34
·
--
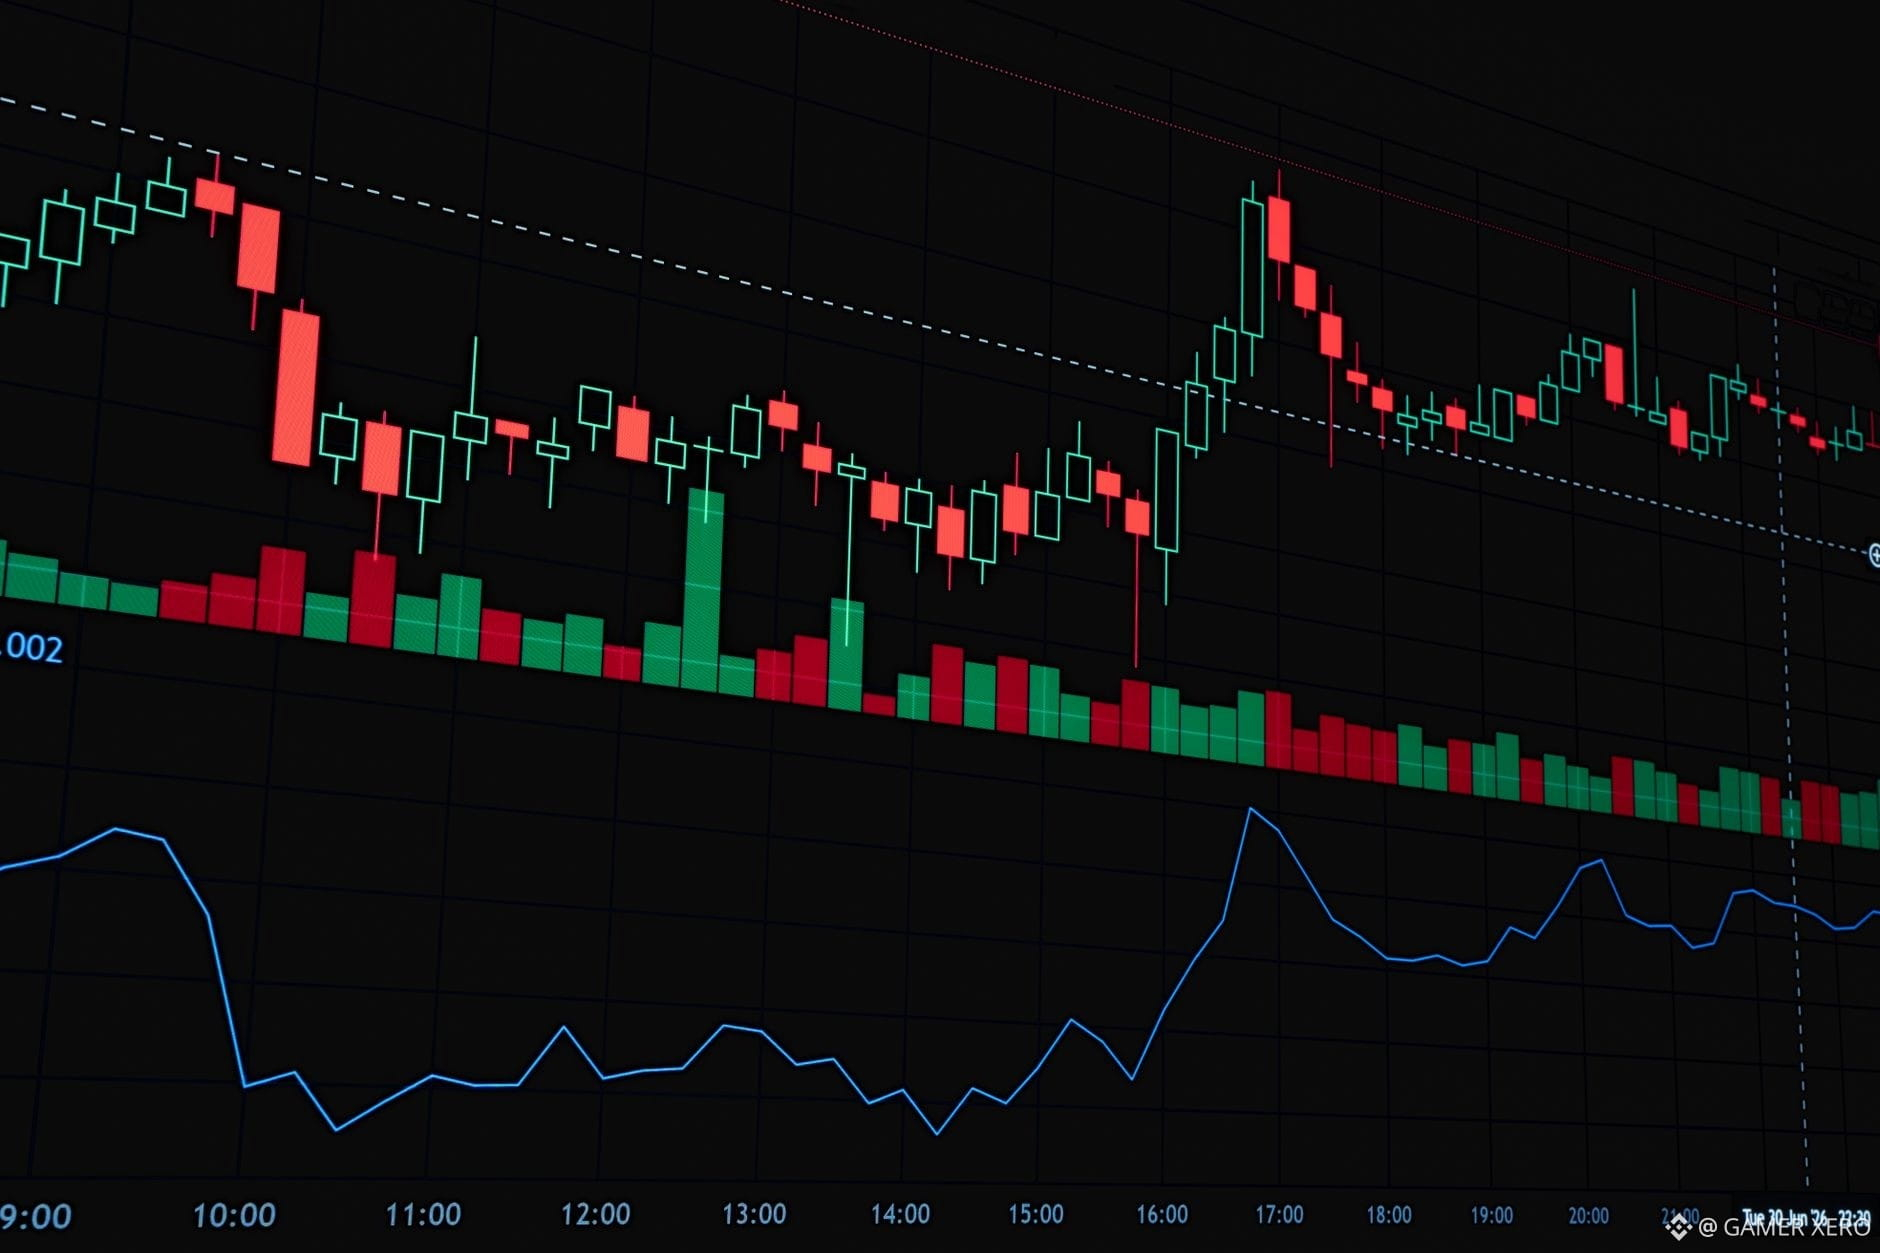
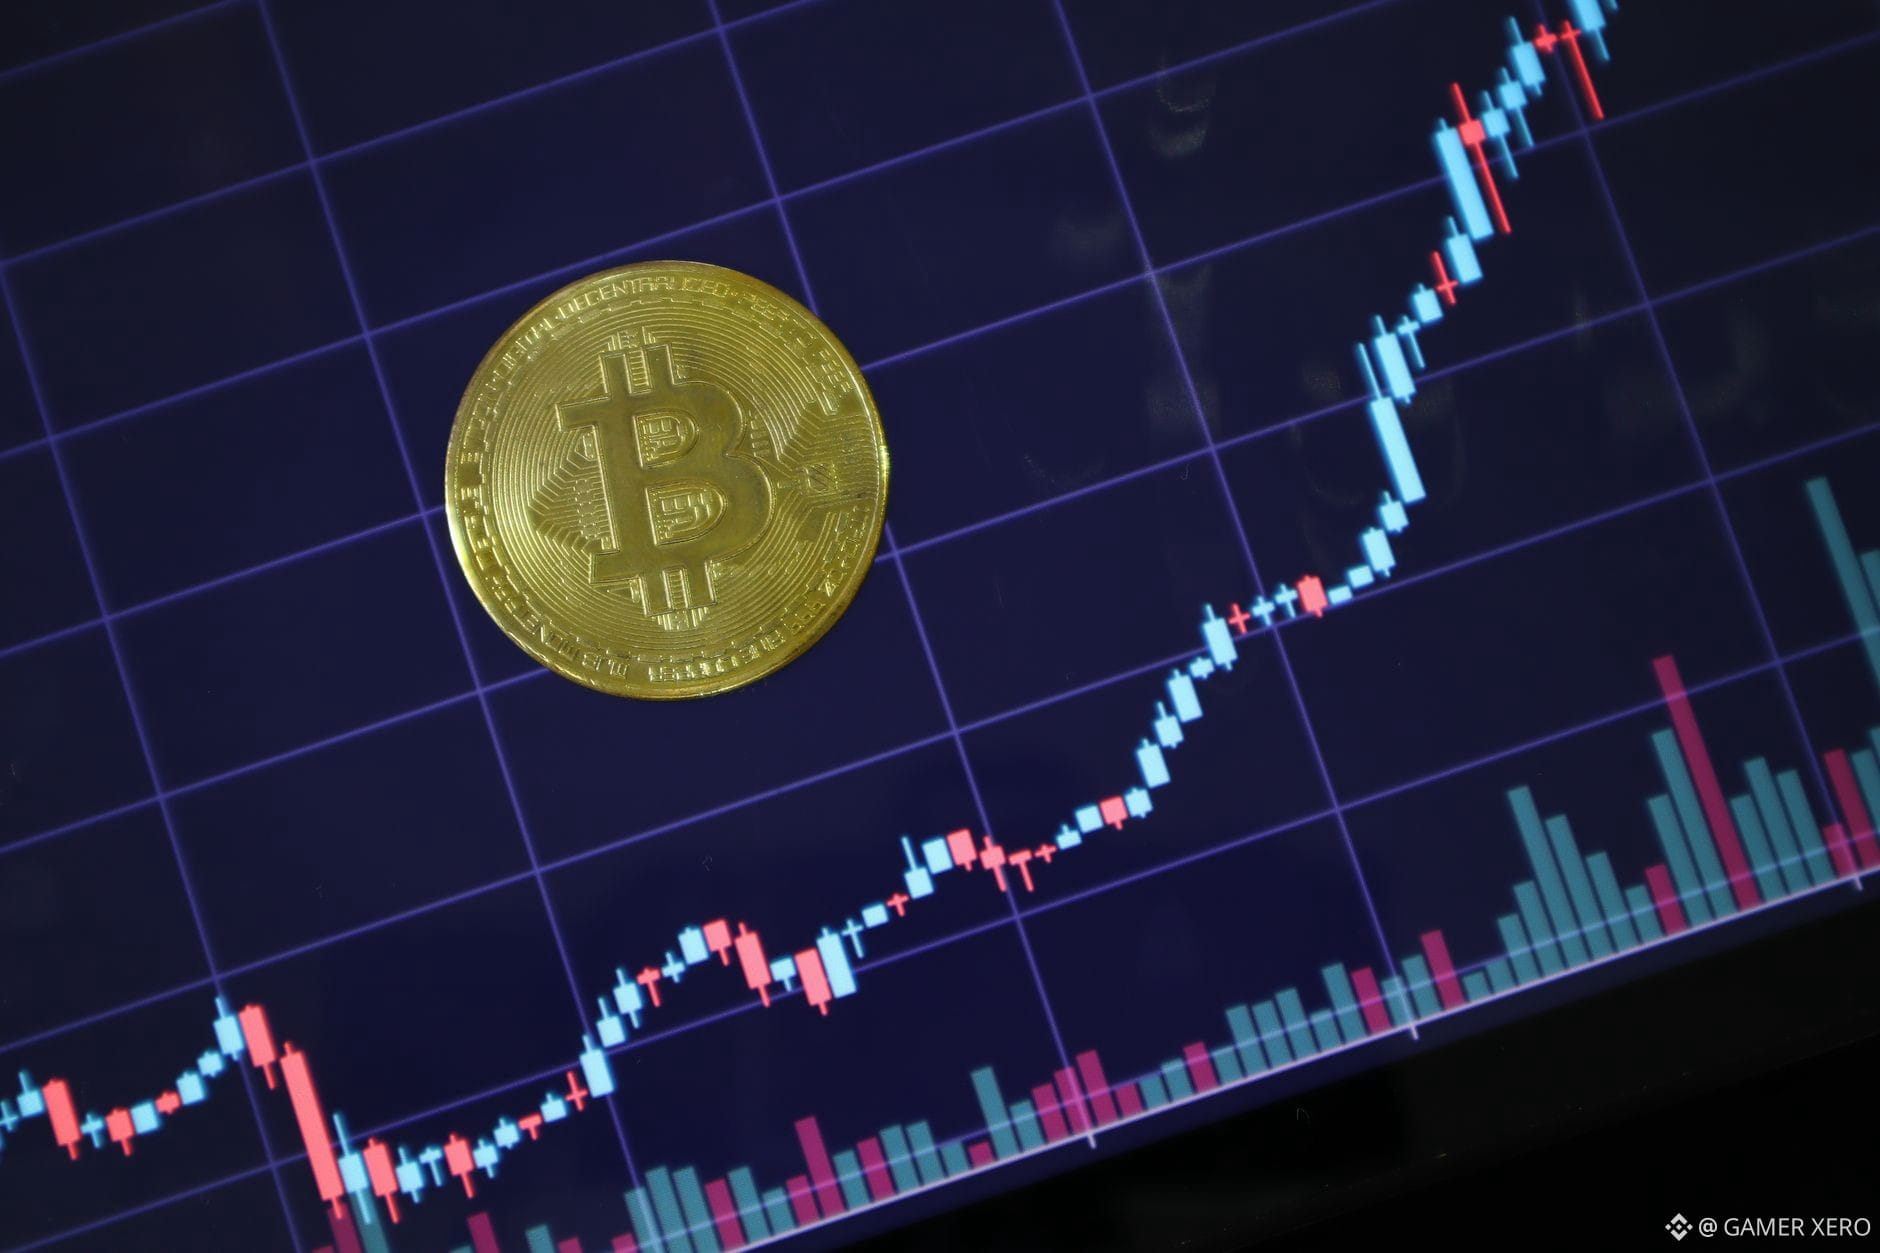
USDCの1週間にわたる5億8400万ドル規模の急騰は、単なる見出し以上の意味があります。安定性コインの流動性が、数少ない主要プレイヤーの周りで締まってきているというシグナルです。Binanceでは、$USDC がスポット・マージンの担保として存在感を増し続けており、複数のペッグ・トークンを追いかけることなく、より低コストの資金調達を確保できるようになります。この影響は市場全体にも波及します。安定性コインの供給が急速に拡大すると、裏付けとなる法定通貨の流入が、特に旗艦ペアの$BTC/USDCのように7万9700ドル直下で推移している銘柄の出来高の多い板を支えることが多いのです。こうした追加の厚みは短期のスリッページを抑え、大きなポジションを市場を動かさずに執行しやすくします。
同時に、$USDC の流入は他の安定性コインに、実用性や競争力のある利回りを証明するよう圧力をかけます。これにより、Binanceのレンディング・プラットフォームにおける手数料体系が再構成される可能性もあります。ヘッジや裁定取引のために安定性コインを使うトレーダーにとって、USDCの優位性が高まることはスプレッドの縮小につながる一方で、ストレスの兆候を示すために準備比率やオンチェーン活動を監視する必要も意味します。
USDCが市場を締め付ける中で、あなたはどのように安定性コイン戦略を調整していますか?
#CryptoInsights #Stablecoins #Binance #GAMERXERO
USDCの1週間にわたる5億8400万ドル規模の急騰は、単なる見出し以上の意味があります。安定性コインの流動性が、数少ない主要プレイヤーの周りで締まってきているというシグナルです。Binanceでは、$USDC がスポット・マージンの担保として存在感を増し続けており、複数のペッグ・トークンを追いかけることなく、より低コストの資金調達を確保できるようになります。この影響は市場全体にも波及します。安定性コインの供給が急速に拡大すると、裏付けとなる法定通貨の流入が、特に旗艦ペアの$BTC /USDCのように7万9700ドル直下で推移している銘柄の出来高の多い板を支えることが多いのです。こうした追加の厚みは短期のスリッページを抑え、大きなポジションを市場を動かさずに執行しやすくします。
同時に、$USDC の流入は他の安定性コインに、実用性や競争力のある利回りを証明するよう圧力をかけます。これにより、Binanceのレンディング・プラットフォームにおける手数料体系が再構成される可能性もあります。ヘッジや裁定取引のために安定性コインを使うトレーダーにとって、USDCの優位性が高まることはスプレッドの縮小につながる一方で、ストレスの兆候を示すために準備比率やオンチェーン活動を監視する必要も意味します。
USDCが市場を締め付ける中で、あなたはどのように安定性コイン戦略を調整していますか?
#CryptoInsights #Stablecoins #Binance #GAMERXERO
同時に、$USDC の流入は他の安定性コインに、実用性や競争力のある利回りを証明するよう圧力をかけます。これにより、Binanceのレンディング・プラットフォームにおける手数料体系が再構成される可能性もあります。ヘッジや裁定取引のために安定性コインを使うトレーダーにとって、USDCの優位性が高まることはスプレッドの縮小につながる一方で、ストレスの兆候を示すために準備比率やオンチェーン活動を監視する必要も意味します。
USDCが市場を締め付ける中で、あなたはどのように安定性コイン戦略を調整していますか?
#CryptoInsights #Stablecoins #Binance #GAMERXERO
23

·
--
DeFiの流動性は進化している——そして多くのトレーダーはまだ旧来のやり方を使っている
長年、DeFiの流動性といえば「1つのこと」を意味していました。AMMです。資産を50/50に分けてプールに預け、手数料を稼ぎ、そして事業コストとして発生するインパーマネントロスを受け入れる——それが当たり前でした。
そのモデルは今も機能します。しかし、それですべてではありません。
今起きているのは構造的な転換です。流動性は、受動的なプール型モデルから、インテント駆動の実行へと移行しています。つまり、ユーザーが「やりたいこと」をブロードキャストし、競争的なソルバーのレイヤーが、複数の取引所(会場)・チェーン・流動性ソースにまたがって最適な約定(フィル)を同時に見つけます。
これが重要なのは、エコシステム内での価値の流れの捉え方そのものが変わるからです。
旧モデルでは、流動性は分断されていました。各プールが独立して競い合い、資本は固定されがちで、遊休のままになりやすく、価格は反応的でした。インテントモデルでは、集約された流動性がプログラム可能になります。ソルバーは実行品質を競います。スリッページは圧縮され、ユーザーはルートではなく、結果を得られます。
ソルバーが動作する決済・調整レイヤーを構築しているチェーンが、この移行で勝つことになります。$ETH remains the deepest settlement base. $BNB delivers high-throughput clearing rails. $AVAX subnet architecture enables institutional-grade execution isolation. これらは単なるエコシステムではなく、次のDeFi時代のインフラ・スタックです。
DeFiの流動性は大人になりつつあります。機関投資家のフローを捉えるプロトコルとは、利回りだけでなく、実行品質を主要プロダクトとして扱うものです。
ソルバーが稼働する場所を見てください。そこに、次にDeFiの価値が蓄積していきます。
#DeFi #Crypto #Web3 #CryptoInsights
DeFiの流動性は進化している——そして多くのトレーダーはまだ旧来のやり方を使っている
長年、DeFiの流動性といえば「1つのこと」を意味していました。AMMです。資産を50/50に分けてプールに預け、手数料を稼ぎ、そして事業コストとして発生するインパーマネントロスを受け入れる——それが当たり前でした。
そのモデルは今も機能します。しかし、それですべてではありません。
今起きているのは構造的な転換です。流動性は、受動的なプール型モデルから、インテント駆動の実行へと移行しています。つまり、ユーザーが「やりたいこと」をブロードキャストし、競争的なソルバーのレイヤーが、複数の取引所(会場)・チェーン・流動性ソースにまたがって最適な約定(フィル)を同時に見つけます。
これが重要なのは、エコシステム内での価値の流れの捉え方そのものが変わるからです。
旧モデルでは、流動性は分断されていました。各プールが独立して競い合い、資本は固定されがちで、遊休のままになりやすく、価格は反応的でした。インテントモデルでは、集約された流動性がプログラム可能になります。ソルバーは実行品質を競います。スリッページは圧縮され、ユーザーはルートではなく、結果を得られます。
ソルバーが動作する決済・調整レイヤーを構築しているチェーンが、この移行で勝つことになります。$ETH remains the deepest settlement base. $BNB delivers high-throughput clearing rails. $AVAX subnet architecture enables institutional-grade execution isolation. これらは単なるエコシステムではなく、次のDeFi時代のインフラ・スタックです。
DeFiの流動性は大人になりつつあります。機関投資家のフローを捉えるプロトコルとは、利回りだけでなく、実行品質を主要プロダクトとして扱うものです。
ソルバーが稼働する場所を見てください。そこに、次にDeFiの価値が蓄積していきます。
#DeFi #Crypto #Web3 #CryptoInsights
長年、DeFiの流動性といえば「1つのこと」を意味していました。AMMです。資産を50/50に分けてプールに預け、手数料を稼ぎ、そして事業コストとして発生するインパーマネントロスを受け入れる——それが当たり前でした。
そのモデルは今も機能します。しかし、それですべてではありません。
今起きているのは構造的な転換です。流動性は、受動的なプール型モデルから、インテント駆動の実行へと移行しています。つまり、ユーザーが「やりたいこと」をブロードキャストし、競争的なソルバーのレイヤーが、複数の取引所(会場)・チェーン・流動性ソースにまたがって最適な約定(フィル)を同時に見つけます。
これが重要なのは、エコシステム内での価値の流れの捉え方そのものが変わるからです。
旧モデルでは、流動性は分断されていました。各プールが独立して競い合い、資本は固定されがちで、遊休のままになりやすく、価格は反応的でした。インテントモデルでは、集約された流動性がプログラム可能になります。ソルバーは実行品質を競います。スリッページは圧縮され、ユーザーはルートではなく、結果を得られます。
ソルバーが動作する決済・調整レイヤーを構築しているチェーンが、この移行で勝つことになります。$ETH remains the deepest settlement base. $BNB delivers high-throughput clearing rails. $AVAX subnet architecture enables institutional-grade execution isolation. これらは単なるエコシステムではなく、次のDeFi時代のインフラ・スタックです。
DeFiの流動性は大人になりつつあります。機関投資家のフローを捉えるプロトコルとは、利回りだけでなく、実行品質を主要プロダクトとして扱うものです。
ソルバーが稼働する場所を見てください。そこに、次にDeFiの価値が蓄積していきます。
#DeFi #Crypto #Web3 #CryptoInsights
88
·
--
なぜWSJの規制の膠着状態に関する見方は、ルールブックなしでプロリーグの試合を見ているように感じるのだろうか?
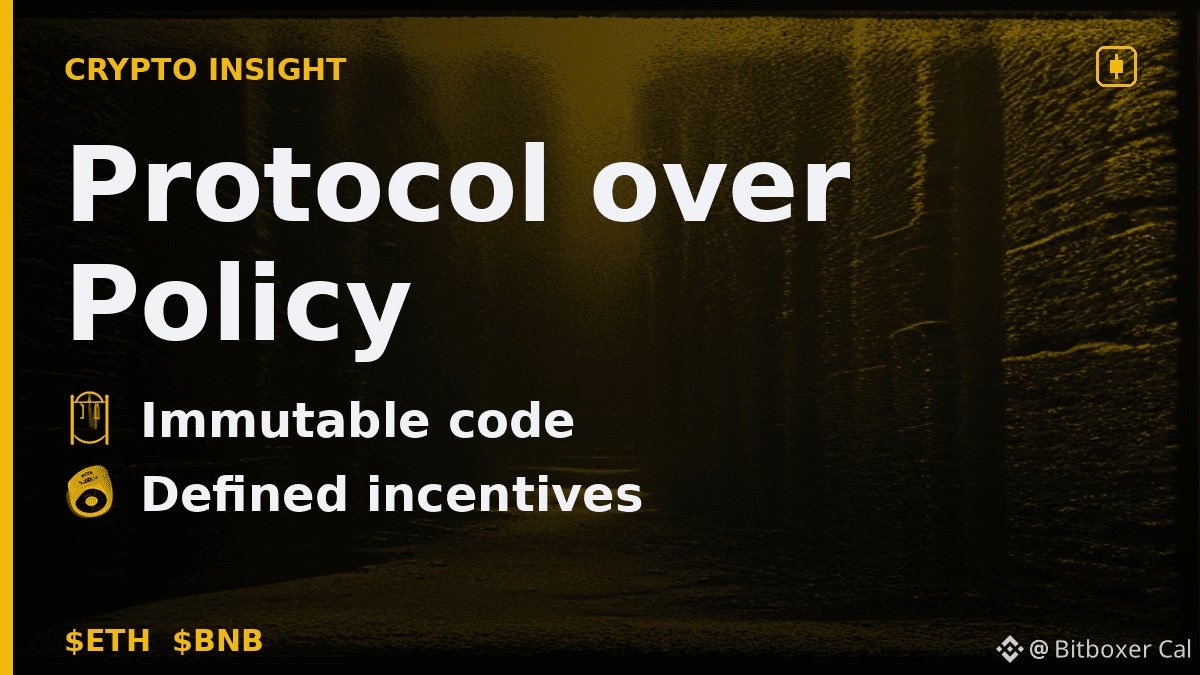
$ETH or $BNB scaleは、政策の気まぐれに左右されるのではなく、コードの確実性に賭けている。真の価値はプロトコル層にとどまり、そこではルールは不変で透明だ。議員たちが最終的に合意に至るかどうかだけが、機関投資家による採用に残された唯一の不確定要素である。
#CryptoInsights #RegulatoryClarity #CryptoNews
なぜWSJの規制の膠着状態に関する見方は、ルールブックなしでプロリーグの試合を見ているように感じるのだろうか?
$ETH or $BNB scaleは、政策の気まぐれに左右されるのではなく、コードの確実性に賭けている。真の価値はプロトコル層にとどまり、そこではルールは不変で透明だ。議員たちが最終的に合意に至るかどうかだけが、機関投資家による採用に残された唯一の不確定要素である。
#CryptoInsights #RegulatoryClarity #CryptoNews
$ETH or $BNB scaleは、政策の気まぐれに左右されるのではなく、コードの確実性に賭けている。真の価値はプロトコル層にとどまり、そこではルールは不変で透明だ。議員たちが最終的に合意に至るかどうかだけが、機関投資家による採用に残された唯一の不確定要素である。
#CryptoInsights #RegulatoryClarity #CryptoNews
23
·
--
米国の機関では現在、戦後の中東に関する計画について公然と議論が交わされており、話題の中心は概ね外交的なもののようですが、その波及効果は暗号資産市場にまで及ぶ可能性があります。地政学的な背景が安定すると、通常は越境決済が容易になり、制裁によるボラティリティに対するヘッジとしての暗号資産に上乗せされるプレミアムが抑えられます。もしこの計画がイランとの緊張を和らげるなら、「リスクオフ」プレミアムの小幅な低下が見られるかもしれません。このプレミアムは、代替の価値保存手段としてビットコインやイーサリアムに資金が流れ込む要因となることがよくあります。
マクロ主導の資金フローを追っている方は、$BTC and $ETH のデプス・テーブルに注目することで、地政学的な物語が変化するにつれて機関投資家の関心が残っているのか、薄れているのかが分かるかもしれません。中東での潜在的な緊張緩和は、ビットコインとイーサリアムにおける短期のポジショニングにどのような影響を与えると思いますか?
#CryptoInsights #MarketDynamics #GAMERXERO #Binance #MacroWatch
米国の機関では現在、戦後の中東に関する計画について公然と議論が交わされており、話題の中心は概ね外交的なもののようですが、その波及効果は暗号資産市場にまで及ぶ可能性があります。地政学的な背景が安定すると、通常は越境決済が容易になり、制裁によるボラティリティに対するヘッジとしての暗号資産に上乗せされるプレミアムが抑えられます。もしこの計画がイランとの緊張を和らげるなら、「リスクオフ」プレミアムの小幅な低下が見られるかもしれません。このプレミアムは、代替の価値保存手段としてビットコインやイーサリアムに資金が流れ込む要因となることがよくあります。
マクロ主導の資金フローを追っている方は、$BTC and $ETH のデプス・テーブルに注目することで、地政学的な物語が変化するにつれて機関投資家の関心が残っているのか、薄れているのかが分かるかもしれません。中東での潜在的な緊張緩和は、ビットコインとイーサリアムにおける短期のポジショニングにどのような影響を与えると思いますか?
#CryptoInsights #MarketDynamics #GAMERXERO #Binance #MacroWatch
マクロ主導の資金フローを追っている方は、$BTC and $ETH のデプス・テーブルに注目することで、地政学的な物語が変化するにつれて機関投資家の関心が残っているのか、薄れているのかが分かるかもしれません。中東での潜在的な緊張緩和は、ビットコインとイーサリアムにおける短期のポジショニングにどのような影響を与えると思いますか?
#CryptoInsights #MarketDynamics #GAMERXERO #Binance #MacroWatch
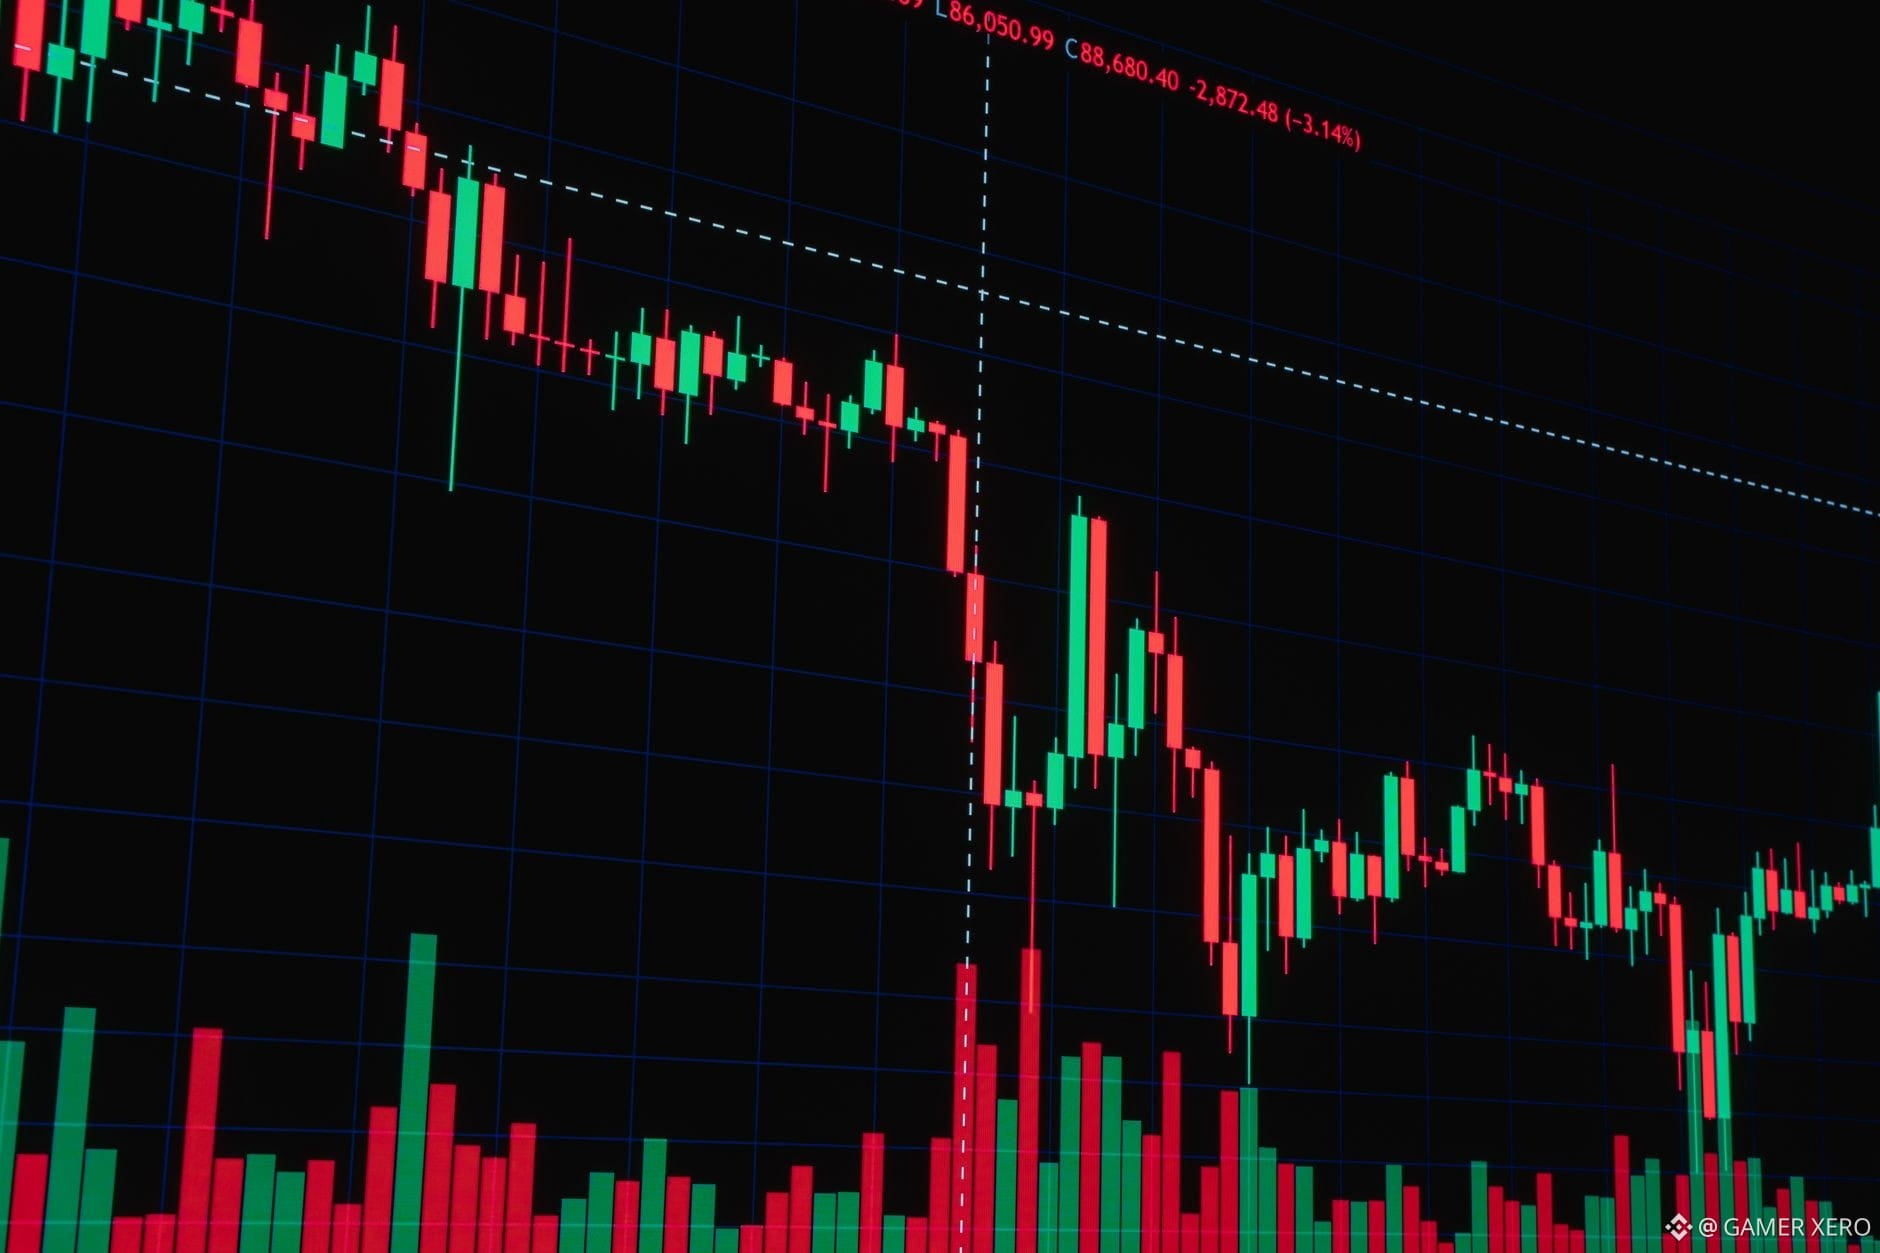
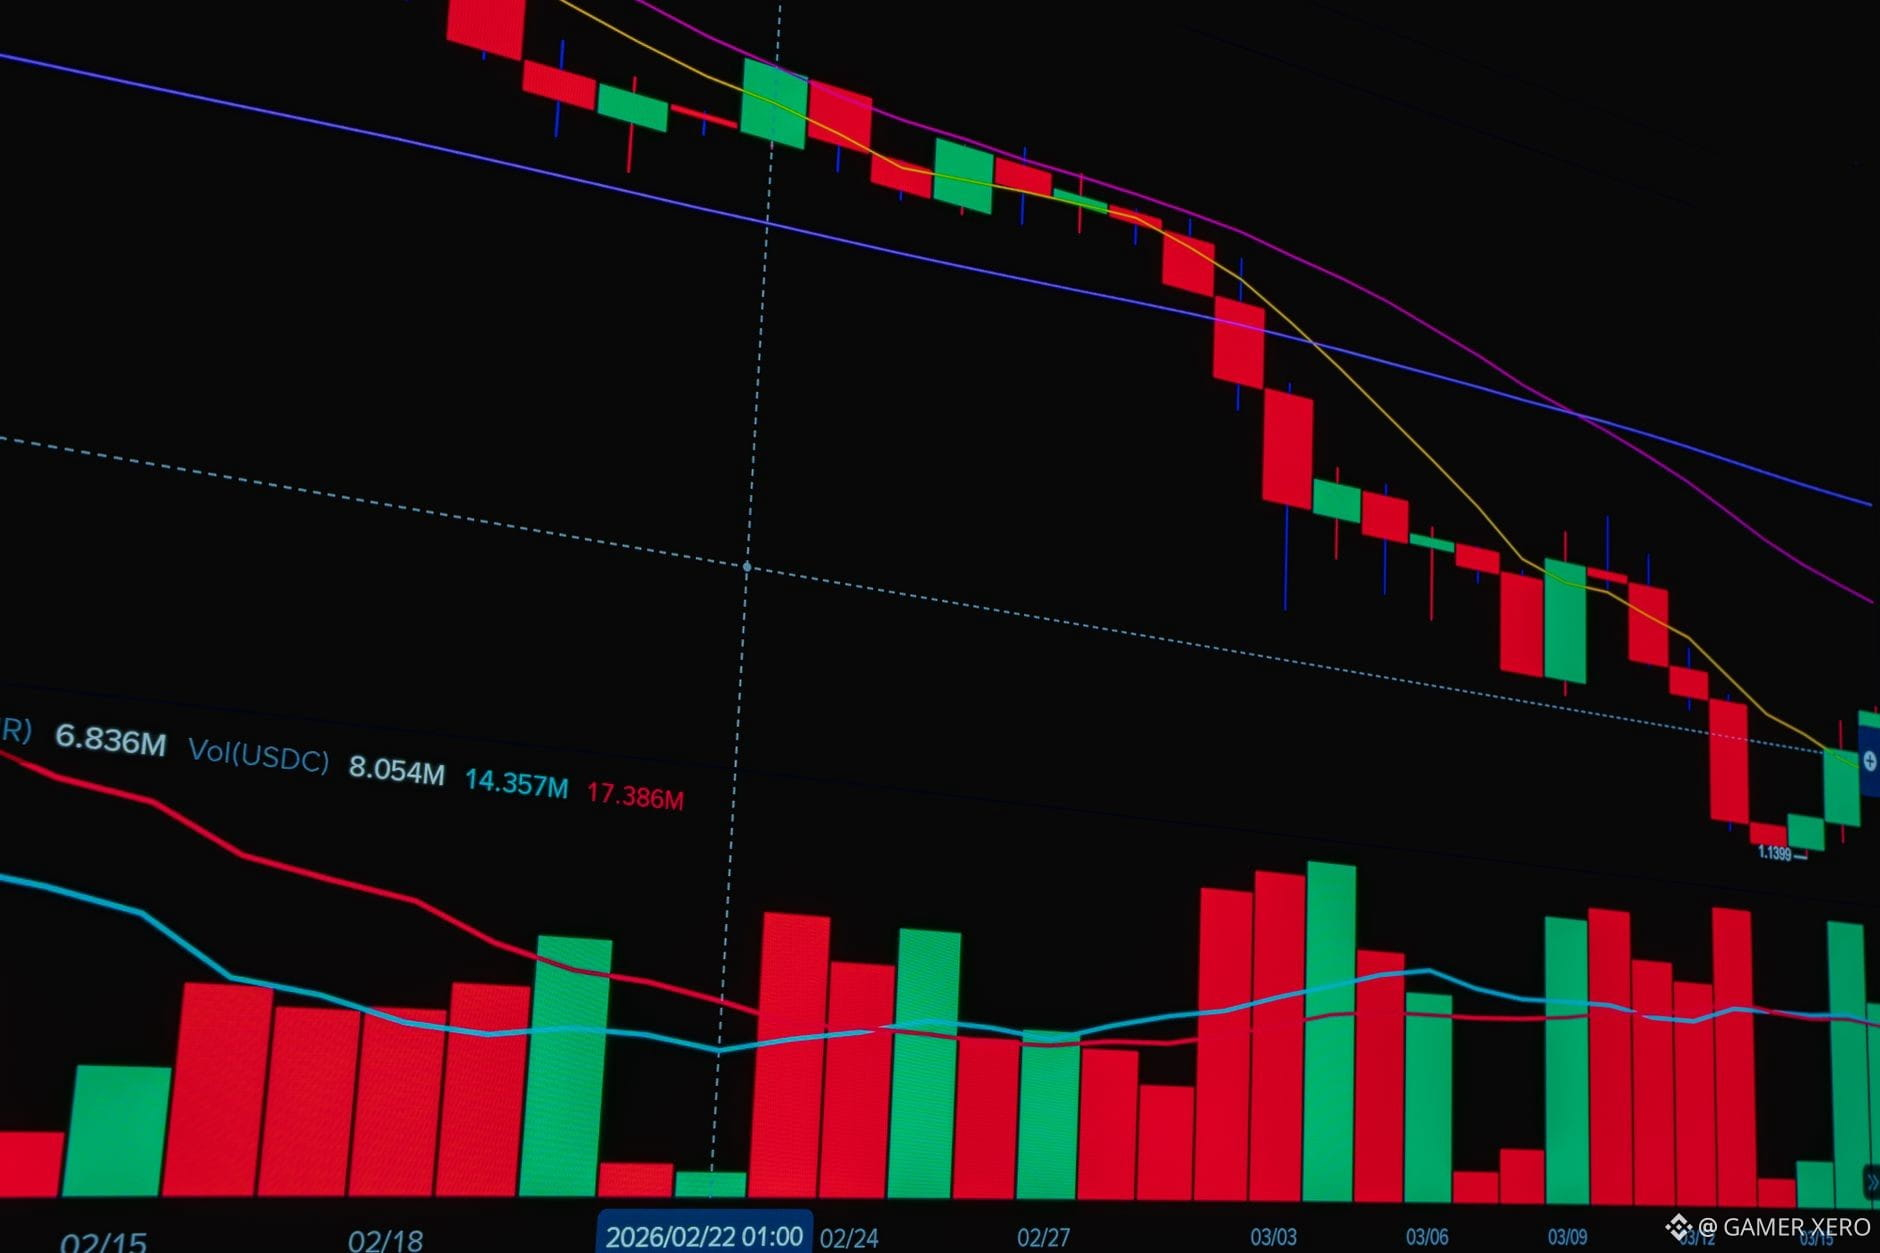
20

📊 Glassnodeの分析: ビットコインは蓄積ゾーンと厚い供給ゾーンの間に挟まれている
Glassnodeによる最近の分析では、ビットコイン価格は狭いレンジで取引されており、投資家の蓄積ゾーンを示す強いサポート水準と、現在価格の上にある売り手による厚い供給の間に挟まれていることが明らかになった。この状況は、レジスタンスを突破するには、売り圧力と潜在的な利益確定を吸収する必要があることを示している。
━━━━━━━━━━━━━━
📊 影響: 📈 高い
🏷️ BITCOIN
#Bitcoin #Glassnode #MarketAnalysis #CryptoInsights
📰 ソース: cryptobriefing.com
📊 Glassnodeの分析: ビットコインは蓄積ゾーンと厚い供給ゾーンの間に挟まれている
Glassnodeによる最近の分析では、ビットコイン価格は狭いレンジで取引されており、投資家の蓄積ゾーンを示す強いサポート水準と、現在価格の上にある売り手による厚い供給の間に挟まれていることが明らかになった。この状況は、レジスタンスを突破するには、売り圧力と潜在的な利益確定を吸収する必要があることを示している。
━━━━━━━━━━━━━━
📊 影響: 📈 高い
🏷️ BITCOIN
#Bitcoin #Glassnode #MarketAnalysis #CryptoInsights
📰 ソース: cryptobriefing.com
Glassnodeによる最近の分析では、ビットコイン価格は狭いレンジで取引されており、投資家の蓄積ゾーンを示す強いサポート水準と、現在価格の上にある売り手による厚い供給の間に挟まれていることが明らかになった。この状況は、レジスタンスを突破するには、売り圧力と潜在的な利益確定を吸収する必要があることを示している。
━━━━━━━━━━━━━━
📊 影響: 📈 高い
🏷️ BITCOIN
#Bitcoin #Glassnode #MarketAnalysis #CryptoInsights
📰 ソース: cryptobriefing.com
15
·
--
中東の新たな緊張を受けて、ドルが約2週間ぶり高値圏で粘り強く推移していることが、Binanceの暗号資産の流動性を静かに組み替えました。より強いドルは通常、米ドル建ての暗号資産ペアを押し上げる傾向があります。投資家が法定通貨のボラティリティから逃れようとするためです。いま、$BTC は$77,472.13で取引されており、24時間安値をわずかに上回る水準です。一方で$ETH は$2,393.03で、直近の高値からは小幅に下落しています。主要アルトのこの控えめな上昇は、より大きな変化を映しています。つまり、ドル金利が高いことで、伝統的な債券市場と直接結びついていない資産へ資金を呼び込む可能性はありますが、その効果は、インフレ懸念に火をつける原油価格の急騰が続いていることによって抑制されています。
こうしたマクロ環境のもとで、ドル高はより安定した暗号資産への資金流入の引き金になると思いますか?それとも、くすぶり続けるインフレ懸念がトレーダーを様子見のままにしてしまうでしょうか?
#CryptoInsights #MarketStructure #Binance #GAMERXERO
中東の新たな緊張を受けて、ドルが約2週間ぶり高値圏で粘り強く推移していることが、Binanceの暗号資産の流動性を静かに組み替えました。より強いドルは通常、米ドル建ての暗号資産ペアを押し上げる傾向があります。投資家が法定通貨のボラティリティから逃れようとするためです。いま、$BTC は$77,472.13で取引されており、24時間安値をわずかに上回る水準です。一方で$ETH は$2,393.03で、直近の高値からは小幅に下落しています。主要アルトのこの控えめな上昇は、より大きな変化を映しています。つまり、ドル金利が高いことで、伝統的な債券市場と直接結びついていない資産へ資金を呼び込む可能性はありますが、その効果は、インフレ懸念に火をつける原油価格の急騰が続いていることによって抑制されています。
こうしたマクロ環境のもとで、ドル高はより安定した暗号資産への資金流入の引き金になると思いますか?それとも、くすぶり続けるインフレ懸念がトレーダーを様子見のままにしてしまうでしょうか?
#CryptoInsights #MarketStructure #Binance #GAMERXERO
こうしたマクロ環境のもとで、ドル高はより安定した暗号資産への資金流入の引き金になると思いますか?それとも、くすぶり続けるインフレ懸念がトレーダーを様子見のままにしてしまうでしょうか?
#CryptoInsights #MarketStructure #Binance #GAMERXERO
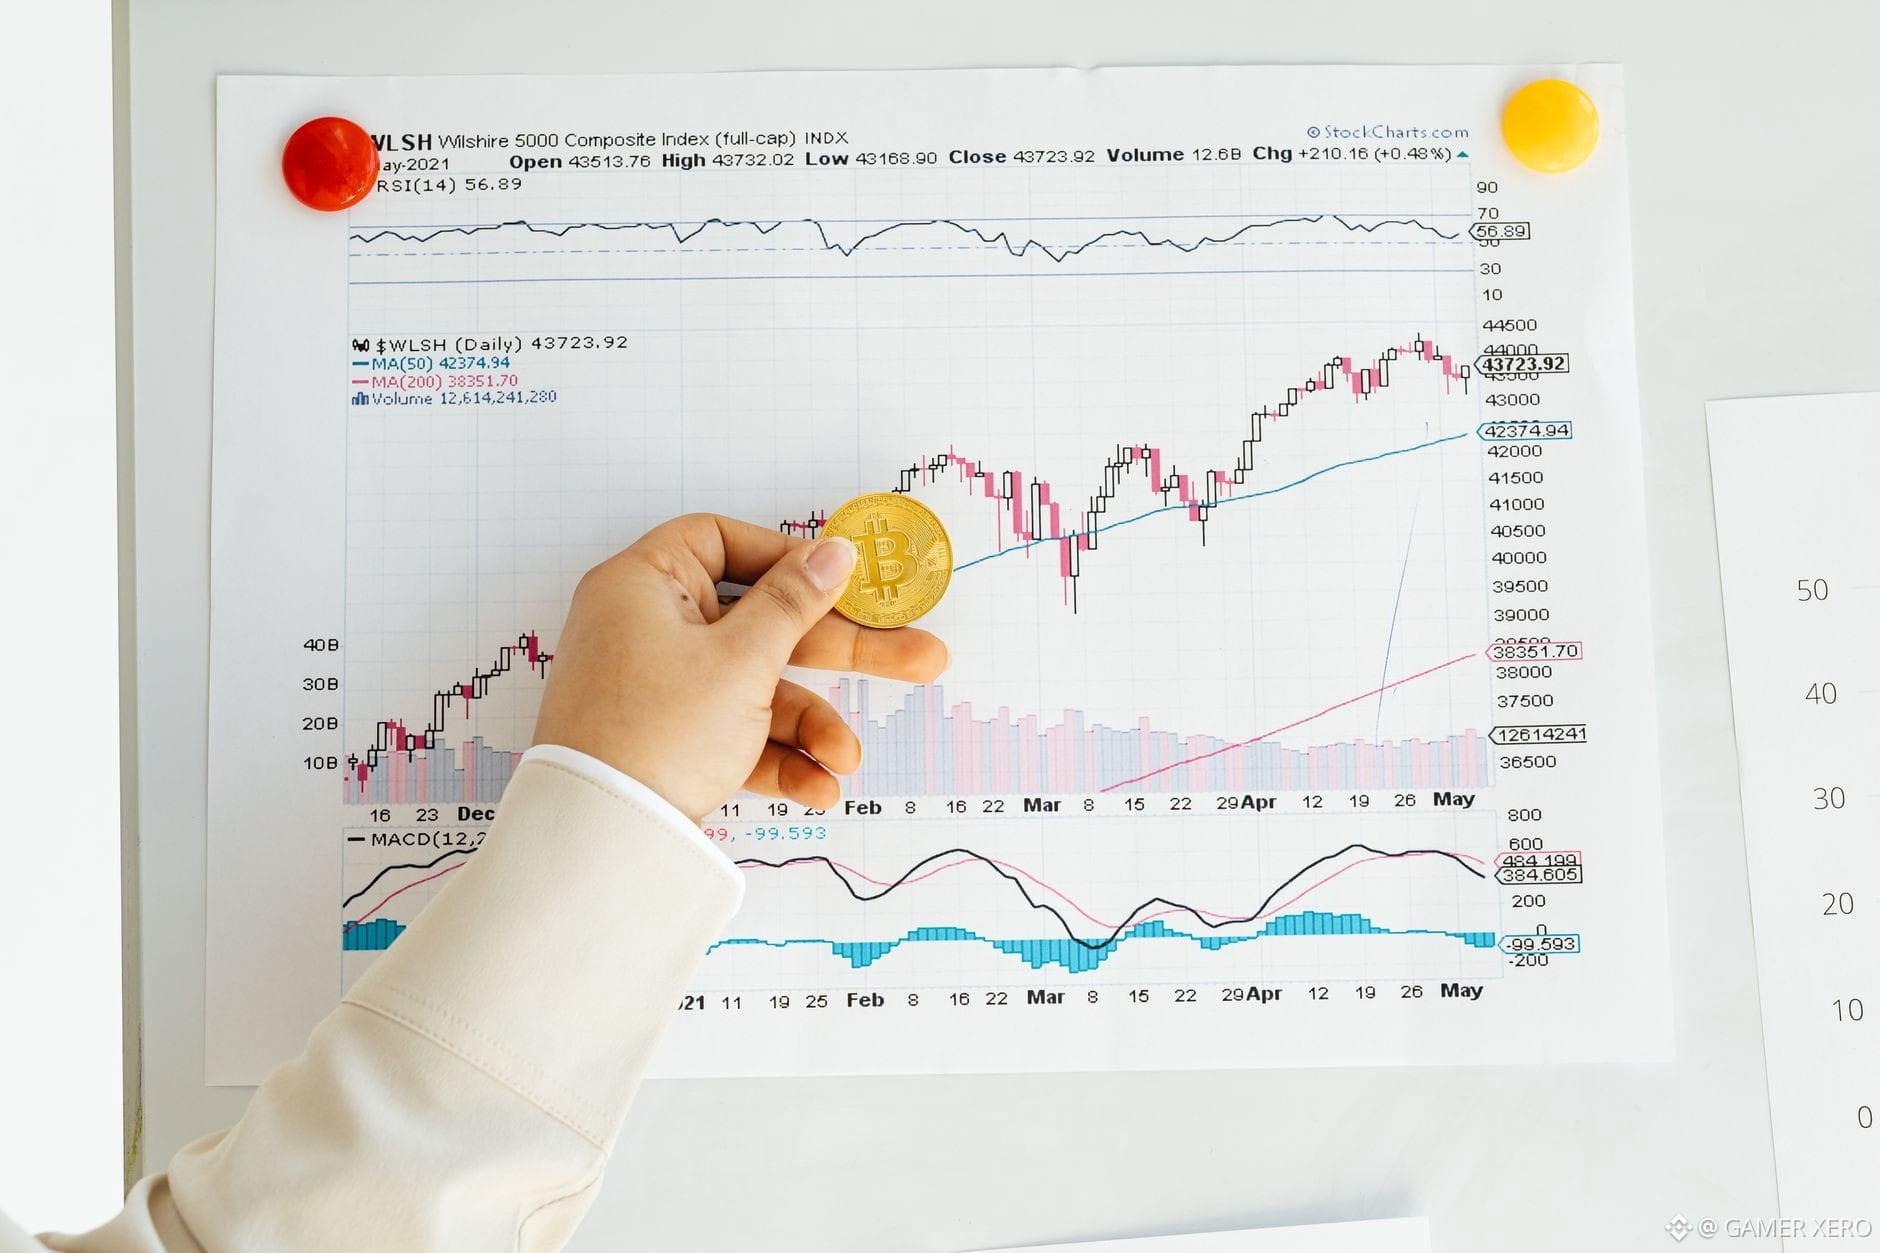
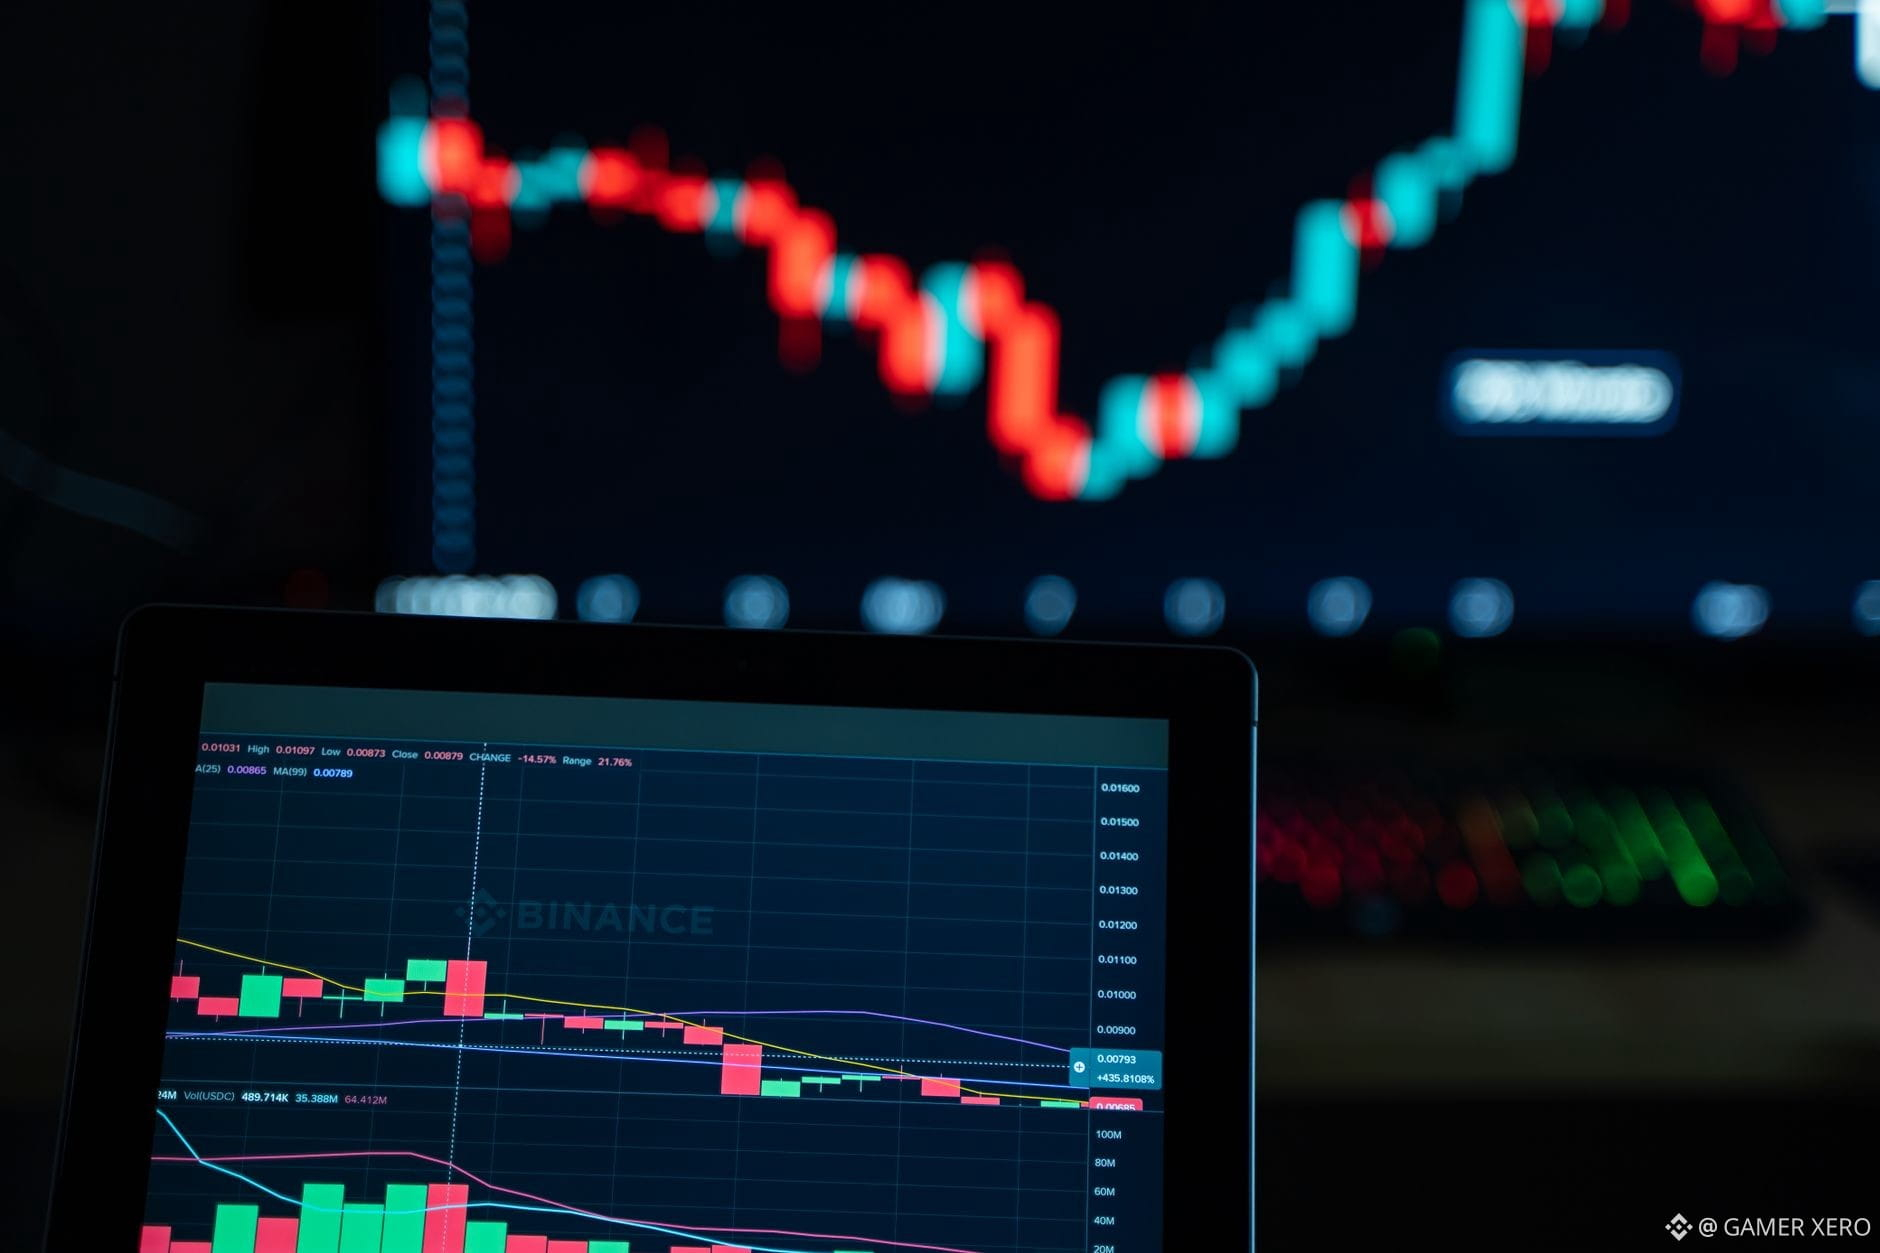
71

·
--
<jp>$FORはたった24時間で16.85%も急落し、時価総額のごくわずかな369kボリュームしかなく――市場の警報サイレンが大音量で鳴り響いている。
本当の致命打は「貪欲に突き動かされたラリー」という煽りではない。次の30日以内に予定されている12%の供給アンロックが差し迫っていることだ。希薄化はやって来るのに、コミュニティはまだ強気のナンセンスを唱え続けている。
$CLVが停滞気味のまま($ETH )上昇を続けている一方で、賢い資金はすでに荷造りを済ませている。新しいコインの大量流入で押し流される直前のトークンを、じっと握っていたい人はいない。
もし$FORがこの途方もない流入を生き延びられると思うなら、それは底へ向かう片道切符を買っているのと同じだ。今すぐショートするか、残酷な調整に備えろ。
監視する価値のある唯一の話題はアンロックのスケジュール――これこそが次のクラッシュの真の引き金だ。
#DeFi #Altcoins #CryptoInsights</jp>
<jp>$FORはたった24時間で16.85%も急落し、時価総額のごくわずかな369kボリュームしかなく――市場の警報サイレンが大音量で鳴り響いている。
本当の致命打は「貪欲に突き動かされたラリー」という煽りではない。次の30日以内に予定されている12%の供給アンロックが差し迫っていることだ。希薄化はやって来るのに、コミュニティはまだ強気のナンセンスを唱え続けている。
$CLVが停滞気味のまま($ETH )上昇を続けている一方で、賢い資金はすでに荷造りを済ませている。新しいコインの大量流入で押し流される直前のトークンを、じっと握っていたい人はいない。
もし$FORがこの途方もない流入を生き延びられると思うなら、それは底へ向かう片道切符を買っているのと同じだ。今すぐショートするか、残酷な調整に備えろ。
監視する価値のある唯一の話題はアンロックのスケジュール――これこそが次のクラッシュの真の引き金だ。
#DeFi #Altcoins #CryptoInsights</jp>
本当の致命打は「貪欲に突き動かされたラリー」という煽りではない。次の30日以内に予定されている12%の供給アンロックが差し迫っていることだ。希薄化はやって来るのに、コミュニティはまだ強気のナンセンスを唱え続けている。
$CLVが停滞気味のまま($ETH )上昇を続けている一方で、賢い資金はすでに荷造りを済ませている。新しいコインの大量流入で押し流される直前のトークンを、じっと握っていたい人はいない。
もし$FORがこの途方もない流入を生き延びられると思うなら、それは底へ向かう片道切符を買っているのと同じだ。今すぐショートするか、残酷な調整に備えろ。
監視する価値のある唯一の話題はアンロックのスケジュール――これこそが次のクラッシュの真の引き金だ。
#DeFi #Altcoins #CryptoInsights</jp>
20
·
--
$BTC は直近24時間で0.23%の下落にとどまり、7万7,888ドルでほぼ横ばいを維持しています。一方で$ETH は約2,444ドルで推移しており、0.29%安です。価格の動きは、イスラエルの指導者に対してトルコがジェノサイドを非難したことを受け、地域の外交ストーリーを変え得るこの動きの後、相場が慎重なトーンになっていることを反映しています。地政学的な摩擦は短期のリスク回避につながることが多く、トレーダーが高リスクなアルトコインよりも「価値の保存手段」と見なされる資産を選びやすくなります。
Binanceでは、両ペアの板(オーダーブック)の厚みが引き続き均衡しており、流動性提供者がポジションを積極的に解消しようとしていないことを示唆します。この均衡に、限定的な下方向の圧力が加わっていることから、ブレイクアウトというよりは一時的な持ち合いの可能性がうかがえます。
地域の緊張が強まれば、資本の保全(キャピタル・プリザベーション)に向けた小幅なシフトが起きるかもしれません。具体的には、スプレッドの縮小や、ステーブルコインを用いたヘッジの利用増加が考えられます。逆に、外交面での緊張緩和が見られれば、信頼が回復し、リスクオン資産への緩やかな資金流入につながる可能性があります。
今後数週間で、台頭する地政学的な見出しは主要コインとステーブルコインの配分にどのように影響すると考えますか?
#CryptoInsights #MarketStructure #RiskManagement #GAMERXERO
$BTC は直近24時間で0.23%の下落にとどまり、7万7,888ドルでほぼ横ばいを維持しています。一方で$ETH は約2,444ドルで推移しており、0.29%安です。価格の動きは、イスラエルの指導者に対してトルコがジェノサイドを非難したことを受け、地域の外交ストーリーを変え得るこの動きの後、相場が慎重なトーンになっていることを反映しています。地政学的な摩擦は短期のリスク回避につながることが多く、トレーダーが高リスクなアルトコインよりも「価値の保存手段」と見なされる資産を選びやすくなります。
Binanceでは、両ペアの板(オーダーブック)の厚みが引き続き均衡しており、流動性提供者がポジションを積極的に解消しようとしていないことを示唆します。この均衡に、限定的な下方向の圧力が加わっていることから、ブレイクアウトというよりは一時的な持ち合いの可能性がうかがえます。
地域の緊張が強まれば、資本の保全(キャピタル・プリザベーション)に向けた小幅なシフトが起きるかもしれません。具体的には、スプレッドの縮小や、ステーブルコインを用いたヘッジの利用増加が考えられます。逆に、外交面での緊張緩和が見られれば、信頼が回復し、リスクオン資産への緩やかな資金流入につながる可能性があります。
今後数週間で、台頭する地政学的な見出しは主要コインとステーブルコインの配分にどのように影響すると考えますか?
#CryptoInsights #MarketStructure #RiskManagement #GAMERXERO
Binanceでは、両ペアの板(オーダーブック)の厚みが引き続き均衡しており、流動性提供者がポジションを積極的に解消しようとしていないことを示唆します。この均衡に、限定的な下方向の圧力が加わっていることから、ブレイクアウトというよりは一時的な持ち合いの可能性がうかがえます。
地域の緊張が強まれば、資本の保全(キャピタル・プリザベーション)に向けた小幅なシフトが起きるかもしれません。具体的には、スプレッドの縮小や、ステーブルコインを用いたヘッジの利用増加が考えられます。逆に、外交面での緊張緩和が見られれば、信頼が回復し、リスクオン資産への緩やかな資金流入につながる可能性があります。
今後数週間で、台頭する地政学的な見出しは主要コインとステーブルコインの配分にどのように影響すると考えますか?
#CryptoInsights #MarketStructure #RiskManagement #GAMERXERO
11

·
--
計算された戦略:なぜ次のブルマーケットの鍵は「ソーシャルと経済の深い統合」にあると言われているのか?♟️
暗号化市場全体を巨大な交通プールに例えるなら、過去にすべてのパブリック・ブロックチェーンが「資本準備」を獲得しようと躍起になりながら、最も重要な要因である **「注目の増加」** を見落としてきたことがわかります。
誰でもユーザーの注目を掴める者が、価格を決める力を持ちます。
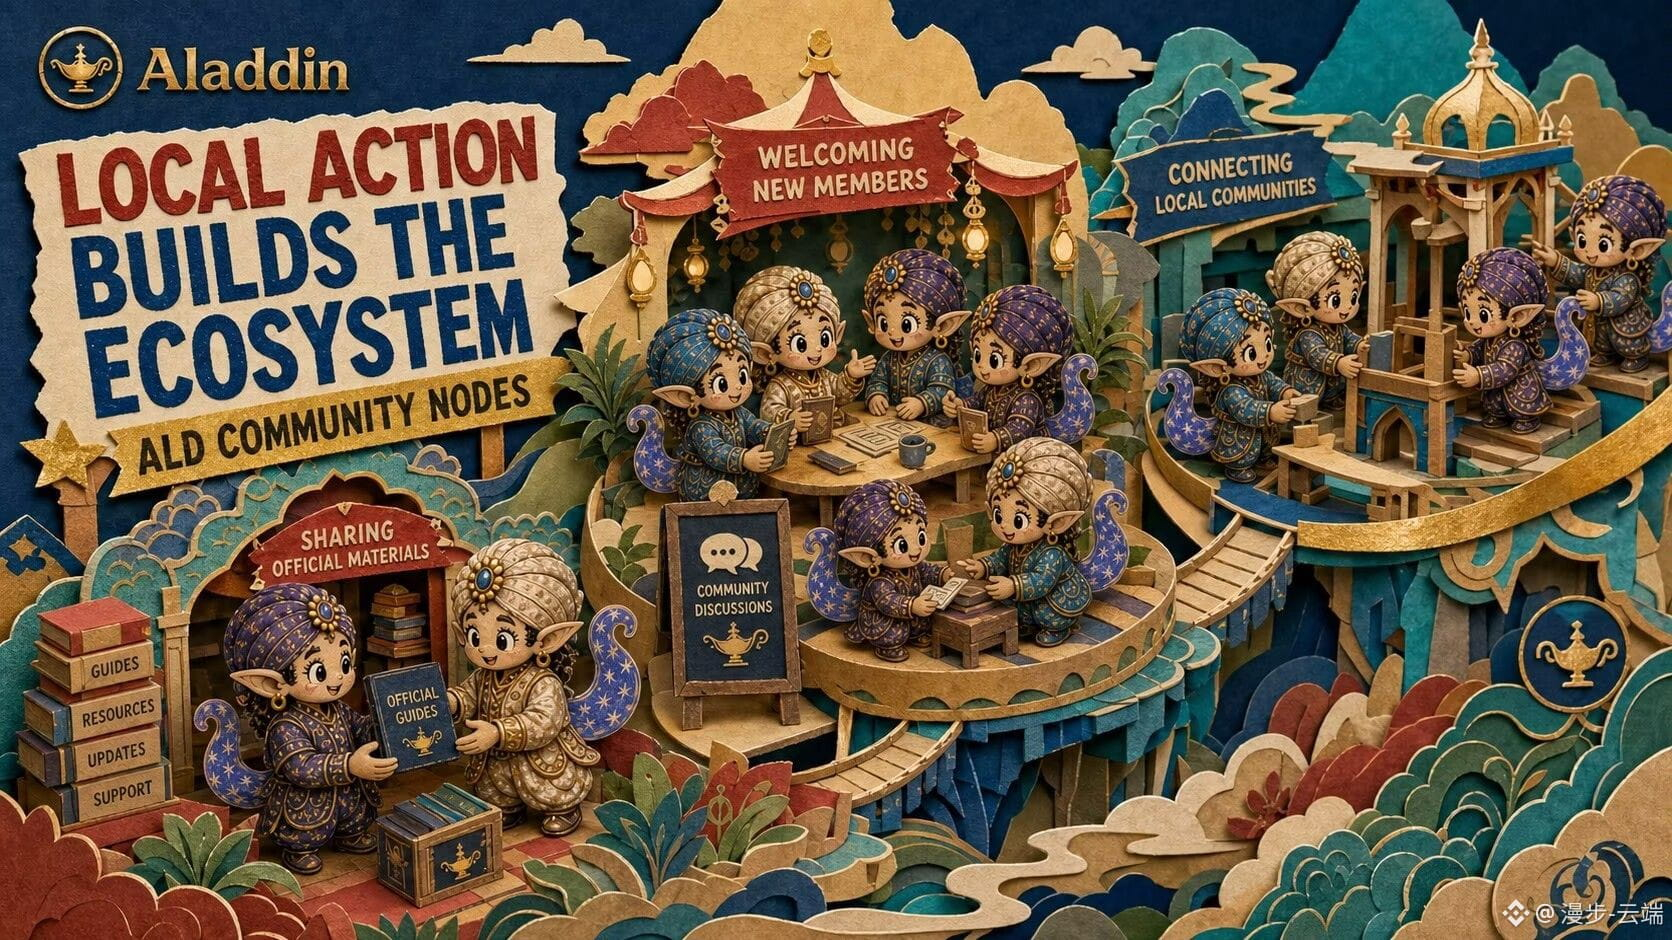
実は、ACO/ALDの根本ロジックは「注目を価値へ変換するための高度に洗練されたクローズドループ」です:
注目を獲得:分散型ソーシャルネットワーキング、暗号化されたIM通信、そしてプラットフォーム上の日々のコンテンツを活用することで、ユーザーの余暇をそこに留め続けます。
資産側を維持:誰もがチャットやライブ配信を見ている一方で、ネイティブDEXや資産配分システムが自然に取引ニーズを満たします。
生態系の発展に貢献:定常的に生み出されるガス消費と取引手数料は、スマートコントラクトを通じて、担保を保有するノードおよびコミュニティへリアルタイムで還元されます。
これは単にチェーンを作ることではありません。自己維持可能なデジタル経済を築くことなのです。
#IndustryTrends #ACO #ALDToken #Web3EconomicModel
#CryptoInsights
計算された戦略:なぜ次のブルマーケットの鍵は「ソーシャルと経済の深い統合」にあると言われているのか?♟️
暗号化市場全体を巨大な交通プールに例えるなら、過去にすべてのパブリック・ブロックチェーンが「資本準備」を獲得しようと躍起になりながら、最も重要な要因である **「注目の増加」** を見落としてきたことがわかります。
誰でもユーザーの注目を掴める者が、価格を決める力を持ちます。
実は、ACO/ALDの根本ロジックは「注目を価値へ変換するための高度に洗練されたクローズドループ」です:
注目を獲得:分散型ソーシャルネットワーキング、暗号化されたIM通信、そしてプラットフォーム上の日々のコンテンツを活用することで、ユーザーの余暇をそこに留め続けます。
資産側を維持:誰もがチャットやライブ配信を見ている一方で、ネイティブDEXや資産配分システムが自然に取引ニーズを満たします。
生態系の発展に貢献:定常的に生み出されるガス消費と取引手数料は、スマートコントラクトを通じて、担保を保有するノードおよびコミュニティへリアルタイムで還元されます。
これは単にチェーンを作ることではありません。自己維持可能なデジタル経済を築くことなのです。
#IndustryTrends #ACO #ALDToken #Web3EconomicModel
#CryptoInsights
暗号化市場全体を巨大な交通プールに例えるなら、過去にすべてのパブリック・ブロックチェーンが「資本準備」を獲得しようと躍起になりながら、最も重要な要因である **「注目の増加」** を見落としてきたことがわかります。
誰でもユーザーの注目を掴める者が、価格を決める力を持ちます。
実は、ACO/ALDの根本ロジックは「注目を価値へ変換するための高度に洗練されたクローズドループ」です:
注目を獲得:分散型ソーシャルネットワーキング、暗号化されたIM通信、そしてプラットフォーム上の日々のコンテンツを活用することで、ユーザーの余暇をそこに留め続けます。
資産側を維持:誰もがチャットやライブ配信を見ている一方で、ネイティブDEXや資産配分システムが自然に取引ニーズを満たします。
生態系の発展に貢献:定常的に生み出されるガス消費と取引手数料は、スマートコントラクトを通じて、担保を保有するノードおよびコミュニティへリアルタイムで還元されます。
これは単にチェーンを作ることではありません。自己維持可能なデジタル経済を築くことなのです。
#IndustryTrends #ACO #ALDToken #Web3EconomicModel
#CryptoInsights
78
·
--
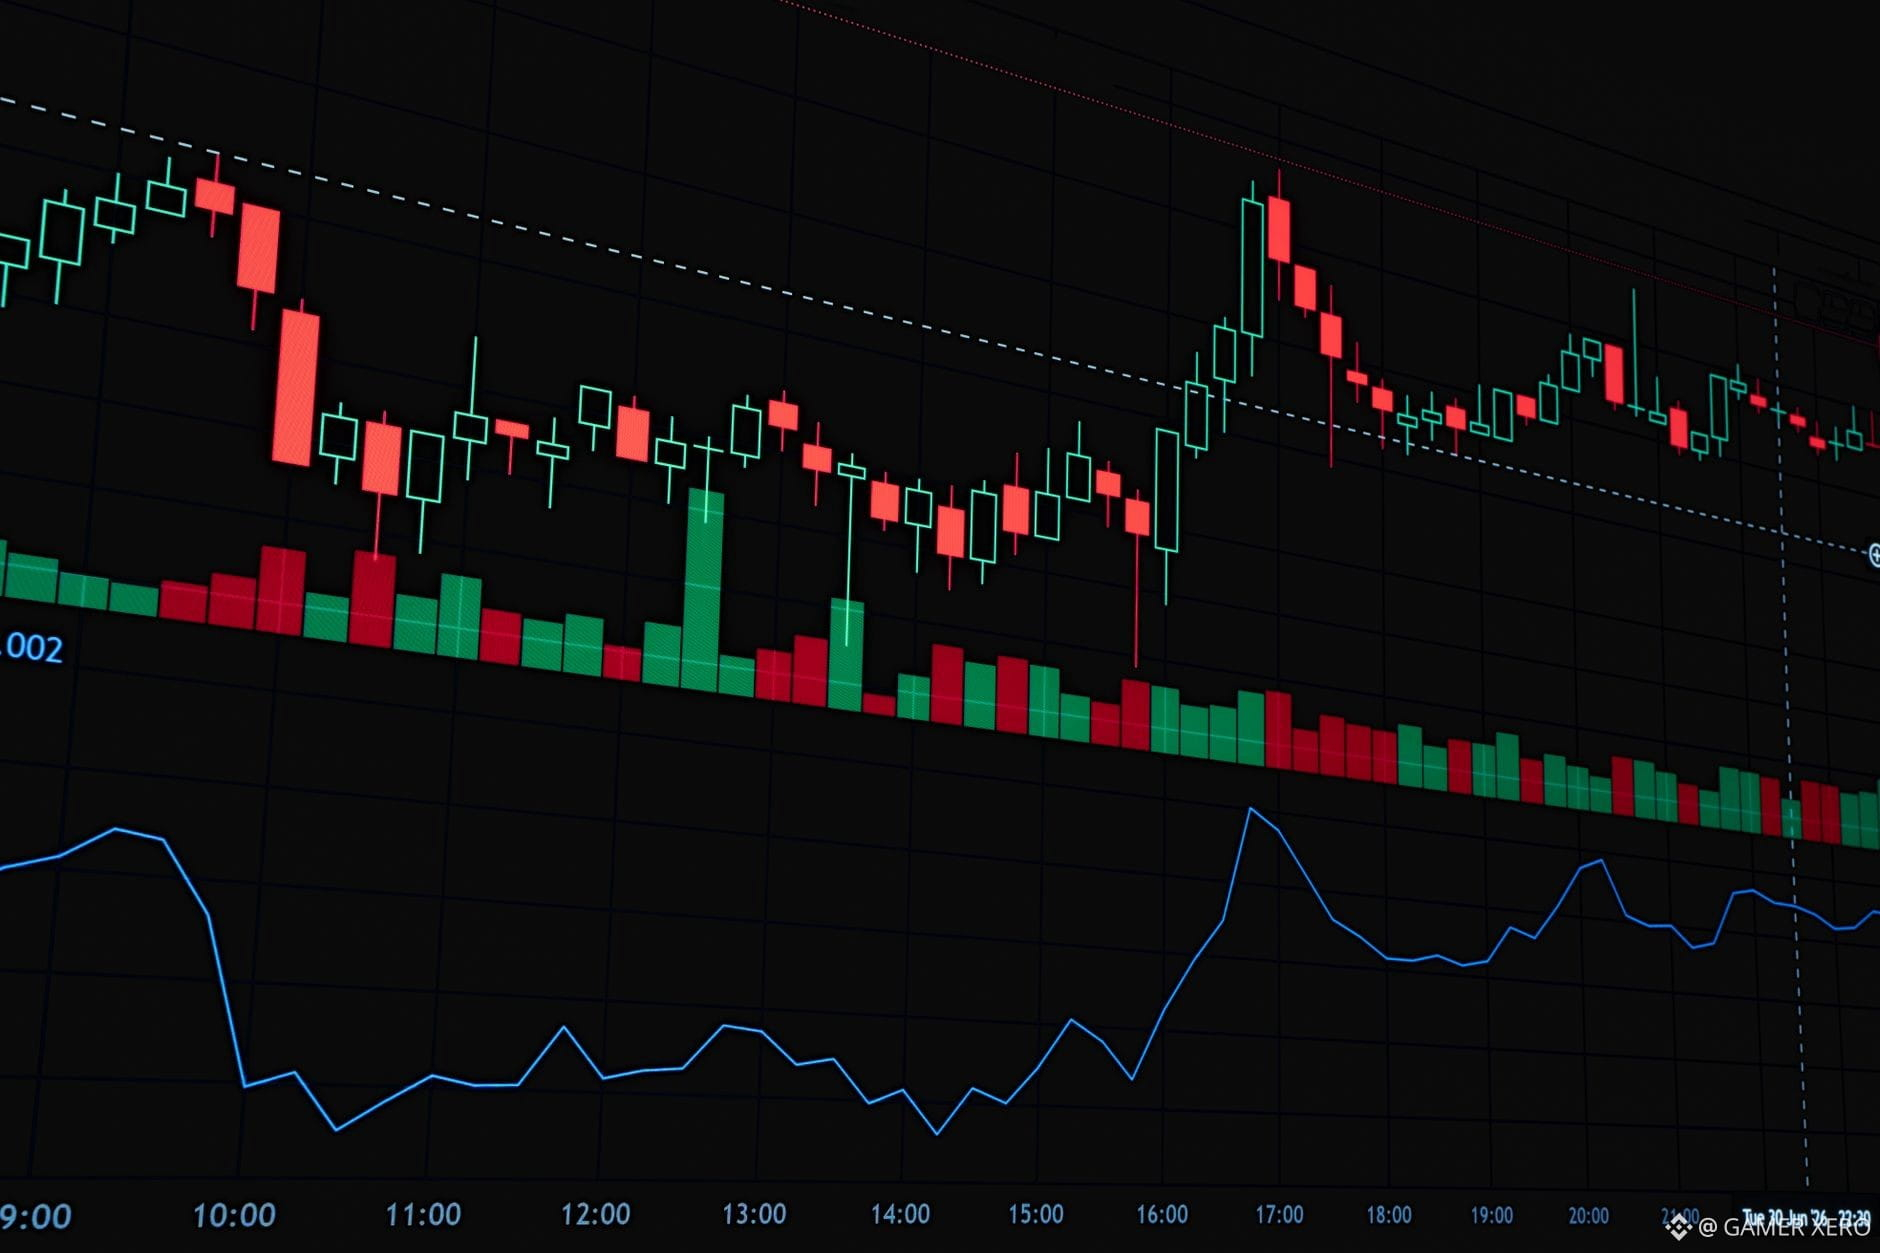
$BTC 静かに過去24時間で0.74%下落し、約77,650ドル近辺で推移している。より広い市場は別の動きを注視している。ビットコイン初期以来眠ったままだったウォレットが、突然再び動き出したのだ。CoinDeskは、2011年から2014年の間に休眠していた6つのアドレスが、8月16日から8月26日にかけて約4,000万ドルを移動させたことを確認した。
長期保有者が古い鍵を再び動かすと、いくつかの意味が考えられる。第一に、アクセスの技術的なハードルが下がったことだ――より良いウォレットUX、カストディ(管理)サービス、そしてAI駆動のツールなどにより、失われた資金の回収が以前よりリスクを抑えられるようになっている。第二に、休眠供給の再流入は、わずかながら流動性を追加し、市場がすでに77,000ドルから79,400ドルのレンジに挟まれている中では、短期的な価格の振れを和らげる可能性がある。
あなたは、古いウォレットの復活が毎年の季節要因として定着すると思うか、それとも最近の技術改善に結びついた単発の出来事だろうか。
#CryptoInsights #OnChainActivity #MarketStructure #GAMERXERO
$BTC 静かに過去24時間で0.74%下落し、約77,650ドル近辺で推移している。より広い市場は別の動きを注視している。ビットコイン初期以来眠ったままだったウォレットが、突然再び動き出したのだ。CoinDeskは、2011年から2014年の間に休眠していた6つのアドレスが、8月16日から8月26日にかけて約4,000万ドルを移動させたことを確認した。
長期保有者が古い鍵を再び動かすと、いくつかの意味が考えられる。第一に、アクセスの技術的なハードルが下がったことだ――より良いウォレットUX、カストディ(管理)サービス、そしてAI駆動のツールなどにより、失われた資金の回収が以前よりリスクを抑えられるようになっている。第二に、休眠供給の再流入は、わずかながら流動性を追加し、市場がすでに77,000ドルから79,400ドルのレンジに挟まれている中では、短期的な価格の振れを和らげる可能性がある。
あなたは、古いウォレットの復活が毎年の季節要因として定着すると思うか、それとも最近の技術改善に結びついた単発の出来事だろうか。
#CryptoInsights #OnChainActivity #MarketStructure #GAMERXERO
長期保有者が古い鍵を再び動かすと、いくつかの意味が考えられる。第一に、アクセスの技術的なハードルが下がったことだ――より良いウォレットUX、カストディ(管理)サービス、そしてAI駆動のツールなどにより、失われた資金の回収が以前よりリスクを抑えられるようになっている。第二に、休眠供給の再流入は、わずかながら流動性を追加し、市場がすでに77,000ドルから79,400ドルのレンジに挟まれている中では、短期的な価格の振れを和らげる可能性がある。
あなたは、古いウォレットの復活が毎年の季節要因として定着すると思うか、それとも最近の技術改善に結びついた単発の出来事だろうか。
#CryptoInsights #OnChainActivity #MarketStructure #GAMERXERO
119
·
--
規制は、クリプトの高速道路に設置されたスピードバンプのようなものです。
$BTC と $ETH のビルダーは現在、新たな法的な明確さに直面しています。この摩擦によって、チームは生のスピードよりもコンプライアンスを優先せざるを得なくなります。開発者たちは、地平線ではなく地面にロードマップをつなぎ止めています。公道とは違い、これらの段差をなめらかにする中央の権限は存在しません。
#CryptoInsights #RegulatoryLandscape #OnChain
規制は、クリプトの高速道路に設置されたスピードバンプのようなものです。
$BTC と $ETH のビルダーは現在、新たな法的な明確さに直面しています。この摩擦によって、チームは生のスピードよりもコンプライアンスを優先せざるを得なくなります。開発者たちは、地平線ではなく地面にロードマップをつなぎ止めています。公道とは違い、これらの段差をなめらかにする中央の権限は存在しません。
#CryptoInsights #RegulatoryLandscape #OnChain
$BTC と $ETH のビルダーは現在、新たな法的な明確さに直面しています。この摩擦によって、チームは生のスピードよりもコンプライアンスを優先せざるを得なくなります。開発者たちは、地平線ではなく地面にロードマップをつなぎ止めています。公道とは違い、これらの段差をなめらかにする中央の権限は存在しません。
#CryptoInsights #RegulatoryLandscape #OnChain

81
·
--
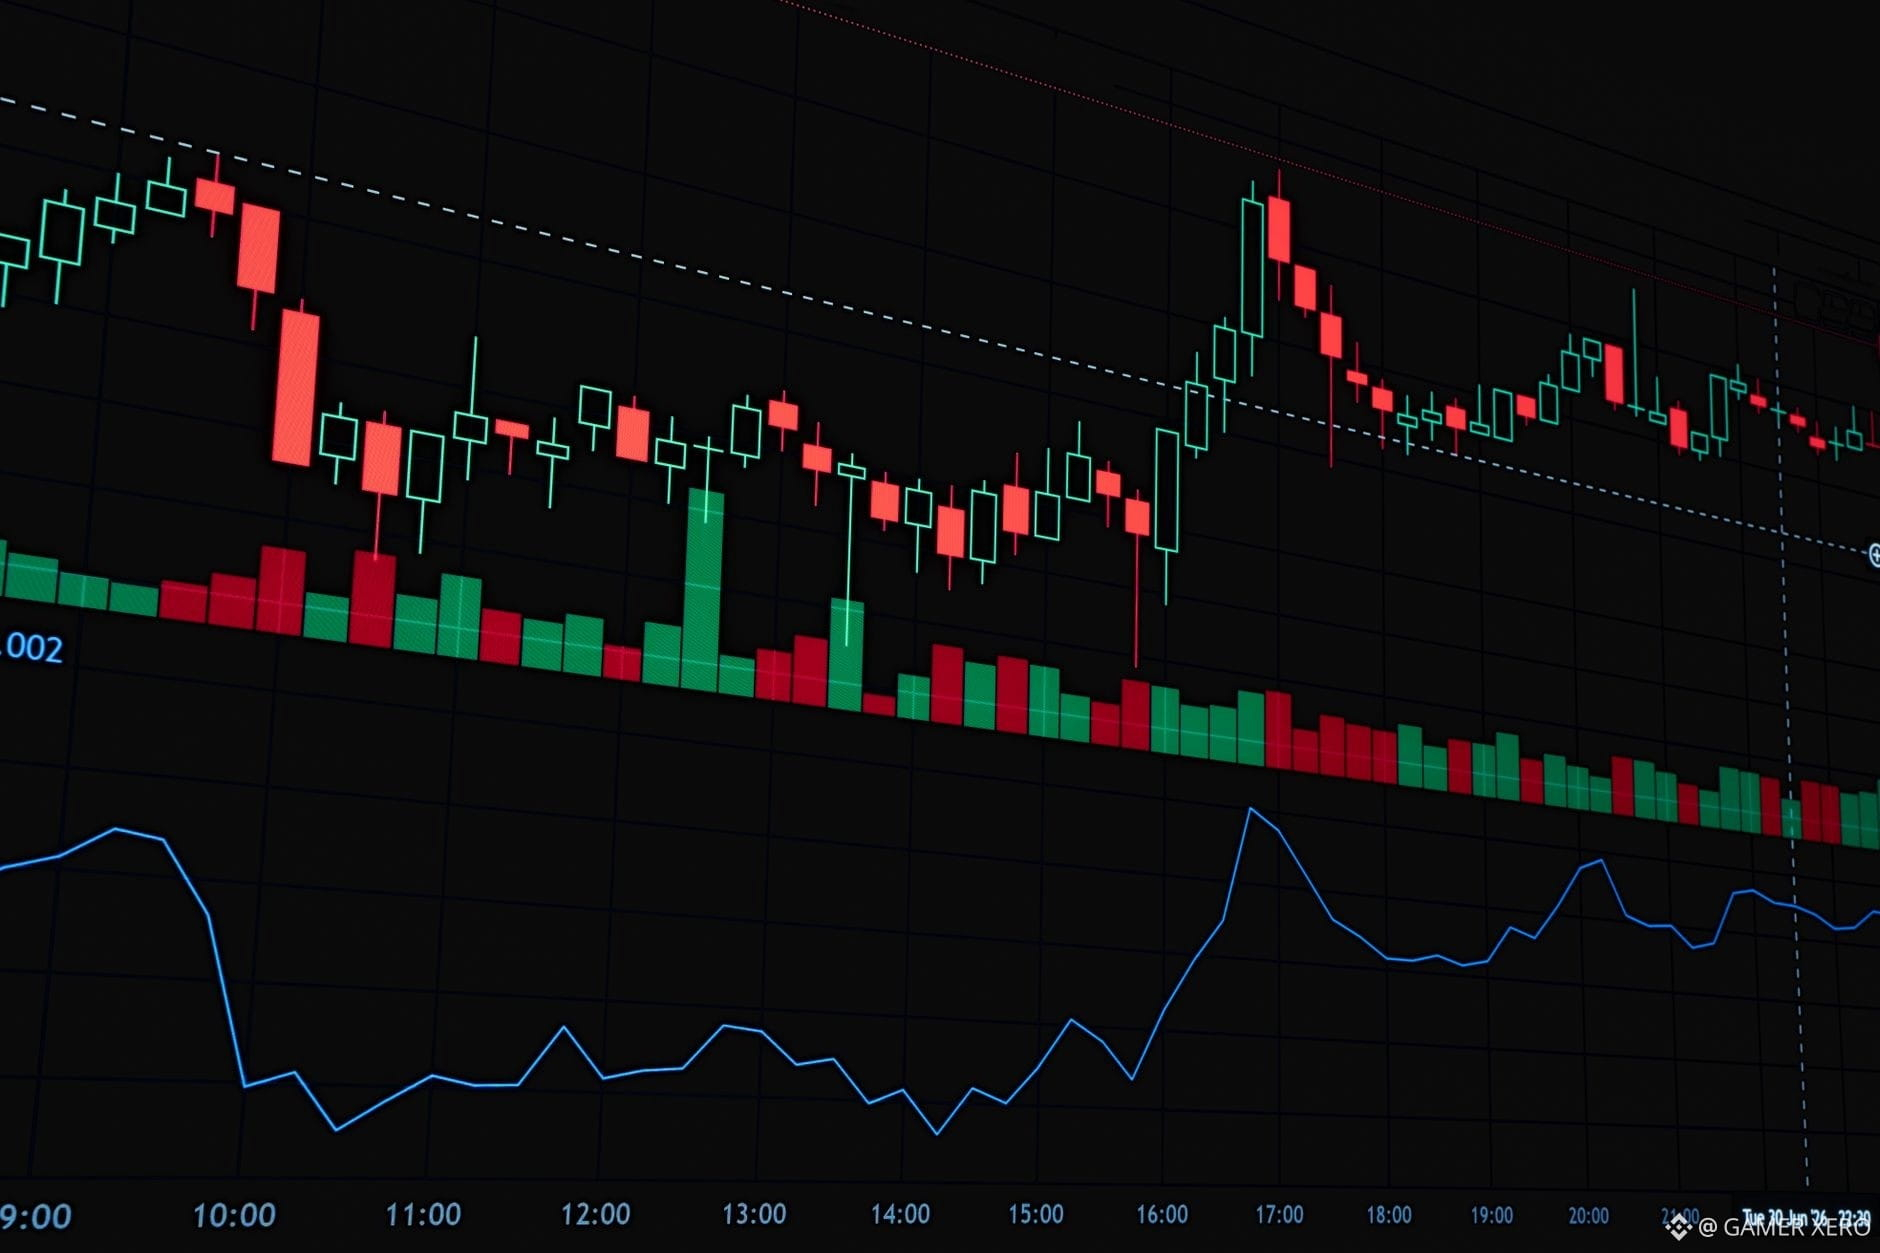
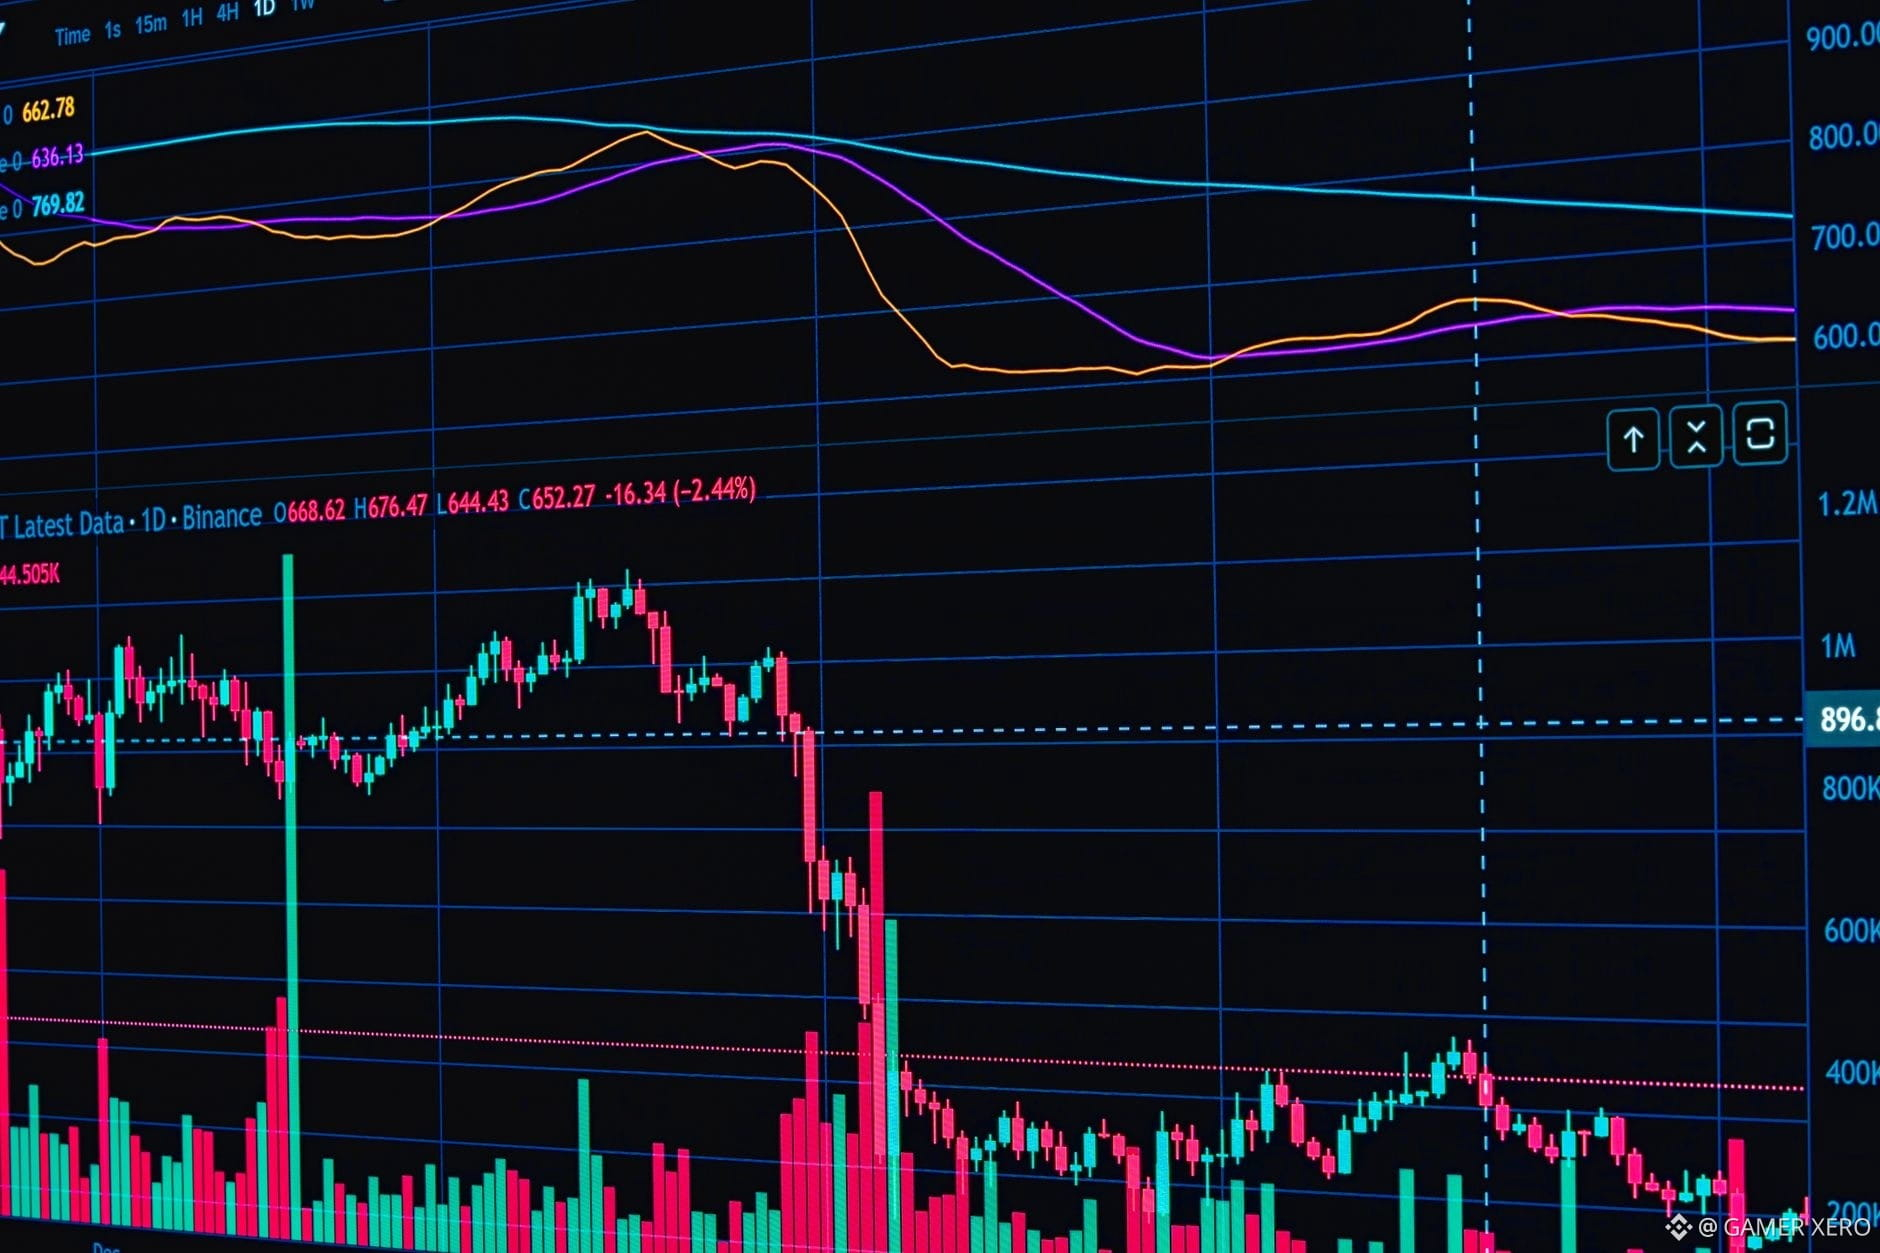
第2四半期のレポートでは、暗号資産関連の売上が11%低下した一方で、市場規模も同じ割合で下落したことが示されました。しかし同じデータからは、サービス全体での分散がより強まっていることも明らかになっています。フロアでの私たちにとって意味するところは、エコシステムがノン・トレーディング収入へと傾いている、というより明確なシグナルです。たとえばステーキングのサービス提供(Staking-as-a-Service)、ブロックチェーン分析のライセンス、そして機関投資家向けのカストディ・ソリューションなどです。これらの収益源は短期の価格変動の影響を受けにくい傾向があるため、ポートフォリオ・マネージャーは純粋なマーケットメイキングの利益ではなく、安定した手数料収入を生むプラットフォームへのエクスポージャーの比重を高め始めるかもしれません。
業界が収益基盤をさらに広げていけば、今後の四半期において取引ボリュームのボラティリティが低下し、価格調整もより緩やかに進む可能性があります。想定される、より動きの遅い手数料主導の市場に対応するため、リスク指標はどのように調整していますか?
#CryptoInsights #MarketStructure #Diversification #GAMERXERO
第2四半期のレポートでは、暗号資産関連の売上が11%低下した一方で、市場規模も同じ割合で下落したことが示されました。しかし同じデータからは、サービス全体での分散がより強まっていることも明らかになっています。フロアでの私たちにとって意味するところは、エコシステムがノン・トレーディング収入へと傾いている、というより明確なシグナルです。たとえばステーキングのサービス提供(Staking-as-a-Service)、ブロックチェーン分析のライセンス、そして機関投資家向けのカストディ・ソリューションなどです。これらの収益源は短期の価格変動の影響を受けにくい傾向があるため、ポートフォリオ・マネージャーは純粋なマーケットメイキングの利益ではなく、安定した手数料収入を生むプラットフォームへのエクスポージャーの比重を高め始めるかもしれません。
業界が収益基盤をさらに広げていけば、今後の四半期において取引ボリュームのボラティリティが低下し、価格調整もより緩やかに進む可能性があります。想定される、より動きの遅い手数料主導の市場に対応するため、リスク指標はどのように調整していますか?
#CryptoInsights #MarketStructure #Diversification #GAMERXERO
業界が収益基盤をさらに広げていけば、今後の四半期において取引ボリュームのボラティリティが低下し、価格調整もより緩やかに進む可能性があります。想定される、より動きの遅い手数料主導の市場に対応するため、リスク指標はどのように調整していますか?
#CryptoInsights #MarketStructure #Diversification #GAMERXERO
15
·
--
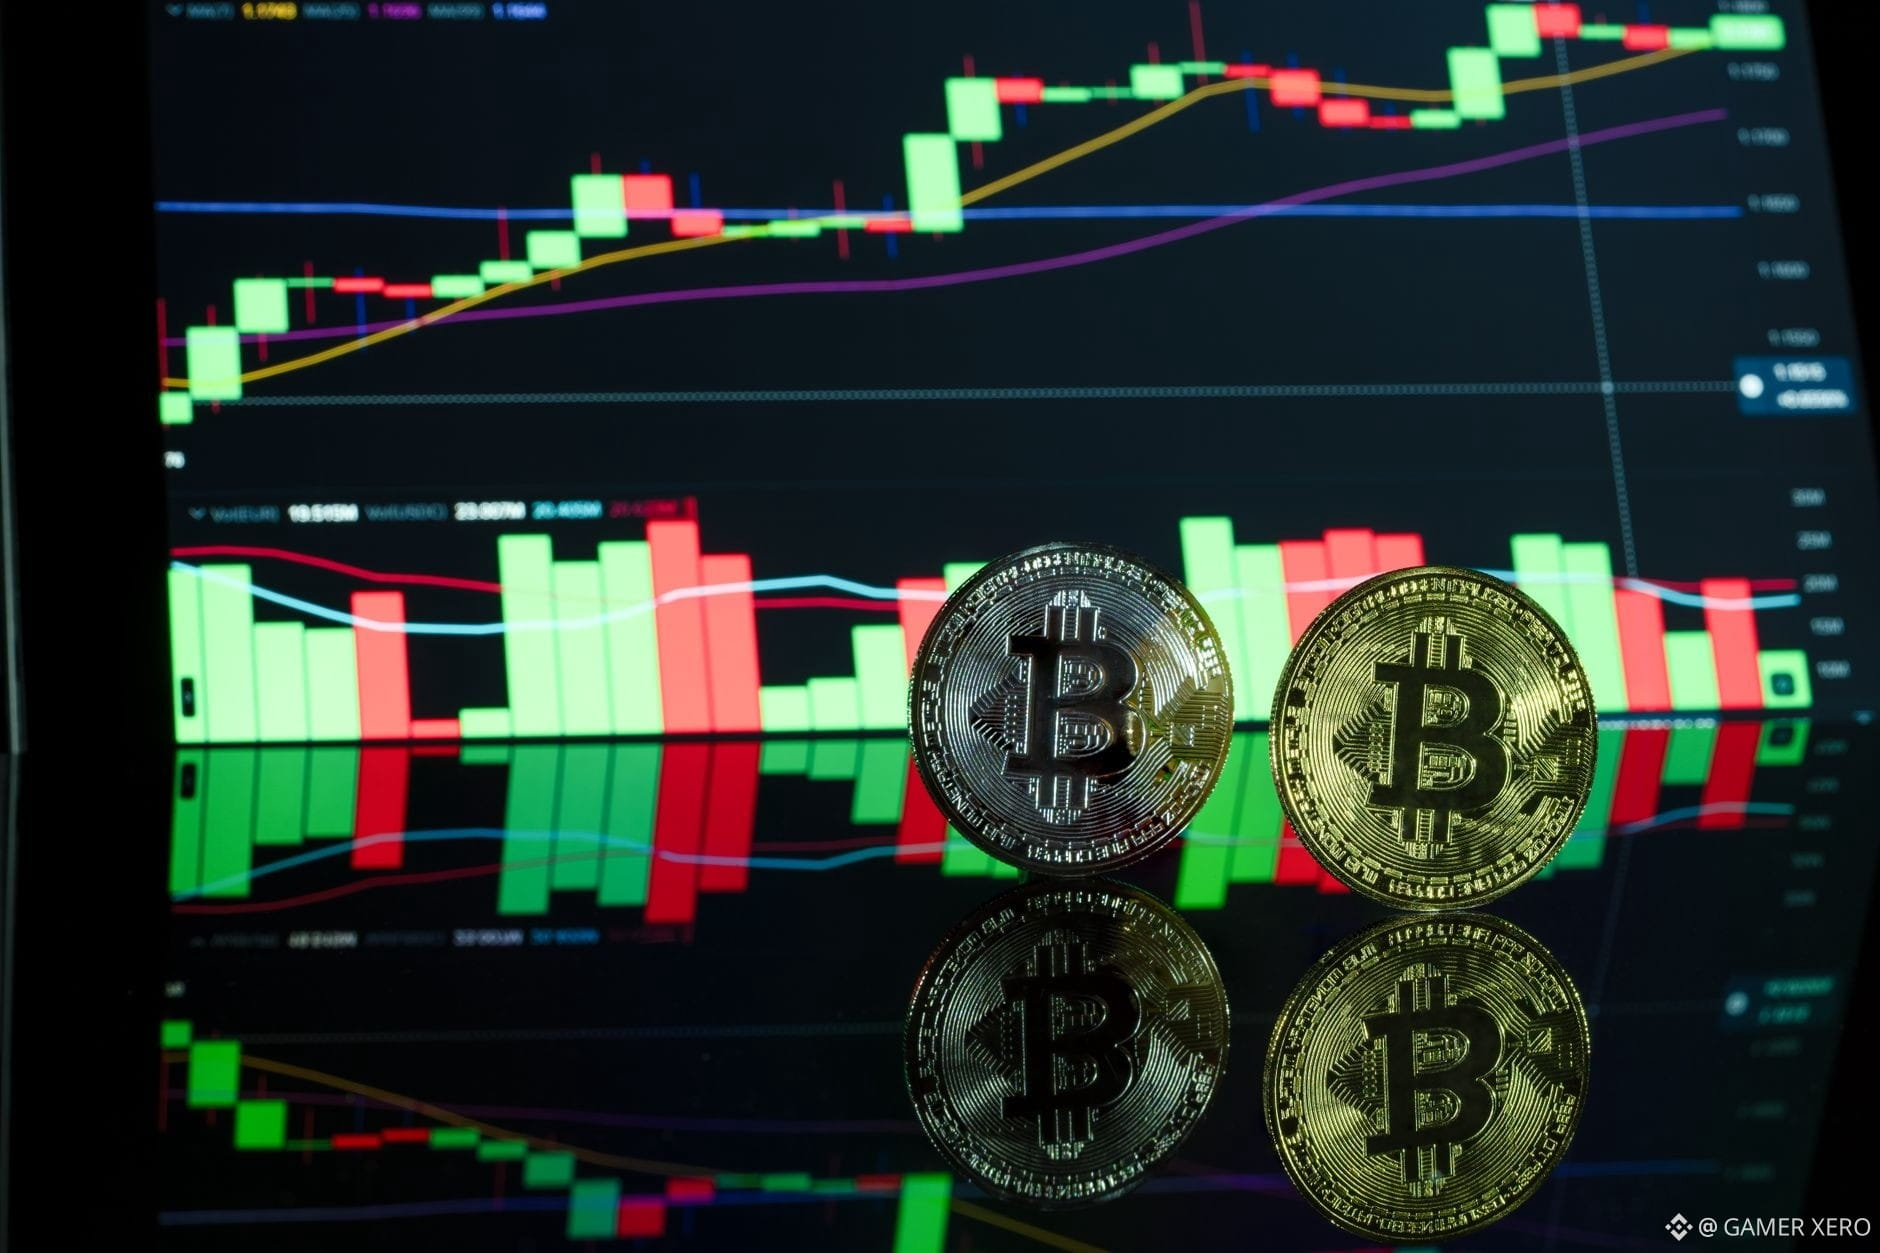
DeepSeekの創業者は、AI駆動のクオンツモデルを使って規制当局の提出書類をふるいにかけ、発行量を予測しながら、中国の好調なIPO市場へと舵を切ろうとしている。これは、暗号分野で多くの投資ファンドがオンチェーンデータに機械学習を適用しているのと似た発想だが、対象は伝統的に不透明だった株式の領域だ。もし新規上場のうち、勢いがつきそうな銘柄を確実に予測できるなら、既に決済レイヤーとして$BTC and $ETH を支えているプラットフォーム上で、そうした資産をトークン化するためのパイプラインが開ける可能性がある。
Binanceでは、$BTC が約$77,790で推移し、$ETH は$2,444近辺で取引されており、いずれも直近のマクロ関連の見出し後に広がったリスク回避の機運を反映している。AIを活用したクオンツファンドがトークン化されたIPOへ資金配分を始めれば、安定性が高く流動性の大きい決済コインへの需要が(小幅に)増えるかもしれず、それによってクロスアセット・ブリッジングにおける主要ブロックチェーンの役割が強まるだろう。
本当の論点は、中国における規制環境が、DeepSeekが獲得したいと望むクオンツの優位性を停滞させることなく、このようなトークン化の道筋を受け入れられるかどうかだ。AI駆動のクオンツ戦略は、次の暗号連動型証券の波にどのような影響を与えると思う?
#CryptoInsights #AIQuant #Tokenization #GAMERXERO
DeepSeekの創業者は、AI駆動のクオンツモデルを使って規制当局の提出書類をふるいにかけ、発行量を予測しながら、中国の好調なIPO市場へと舵を切ろうとしている。これは、暗号分野で多くの投資ファンドがオンチェーンデータに機械学習を適用しているのと似た発想だが、対象は伝統的に不透明だった株式の領域だ。もし新規上場のうち、勢いがつきそうな銘柄を確実に予測できるなら、既に決済レイヤーとして$BTC and $ETH を支えているプラットフォーム上で、そうした資産をトークン化するためのパイプラインが開ける可能性がある。
Binanceでは、$BTC が約$77,790で推移し、$ETH は$2,444近辺で取引されており、いずれも直近のマクロ関連の見出し後に広がったリスク回避の機運を反映している。AIを活用したクオンツファンドがトークン化されたIPOへ資金配分を始めれば、安定性が高く流動性の大きい決済コインへの需要が(小幅に)増えるかもしれず、それによってクロスアセット・ブリッジングにおける主要ブロックチェーンの役割が強まるだろう。
本当の論点は、中国における規制環境が、DeepSeekが獲得したいと望むクオンツの優位性を停滞させることなく、このようなトークン化の道筋を受け入れられるかどうかだ。AI駆動のクオンツ戦略は、次の暗号連動型証券の波にどのような影響を与えると思う?
#CryptoInsights #AIQuant #Tokenization #GAMERXERO
Binanceでは、$BTC が約$77,790で推移し、$ETH は$2,444近辺で取引されており、いずれも直近のマクロ関連の見出し後に広がったリスク回避の機運を反映している。AIを活用したクオンツファンドがトークン化されたIPOへ資金配分を始めれば、安定性が高く流動性の大きい決済コインへの需要が(小幅に)増えるかもしれず、それによってクロスアセット・ブリッジングにおける主要ブロックチェーンの役割が強まるだろう。
本当の論点は、中国における規制環境が、DeepSeekが獲得したいと望むクオンツの優位性を停滞させることなく、このようなトークン化の道筋を受け入れられるかどうかだ。AI駆動のクオンツ戦略は、次の暗号連動型証券の波にどのような影響を与えると思う?
#CryptoInsights #AIQuant #Tokenization #GAMERXERO
1
98
ログインして、さらにコンテンツを読む
厳選トピックで世界の暗号資産トレーダーの仲間入り
⚡️ 暗号資産に関する最新かつ有益な情報が見つかります。
💬 世界最大の暗号資産取引所から信頼されています。
👍 認証を受けたクリエイターから、有益なインサイトを得られます。
メール / 電話番号
トレンドトピック
1
#FedRateWatch
閲覧回数 1.2M
5,842人が討論中
2
#ZcashRises6%
閲覧回数 13,972
274人が討論中
3
#XRPSinks10%
閲覧回数 8,069
173人が討論中
4
#BitcoinETFsShed$450M
閲覧回数 1,168
43人が討論中
5
#CircleOpensArcMainnet
閲覧回数 4,805
117人が討論中
6
#ZcashHoldersBackNU7Upgrade
閲覧回数 13,995
284人が討論中
7
#MSTRTradingVolumeSurpassesMorganStanley
閲覧回数 16,344
469人が討論中
8
#BitcoinFalls4%
閲覧回数 35,121
759人が討論中
9
#SKHynixInTalksToMakeMemoryChipsInUS
閲覧回数 15,844
311人が討論中
10
#OpenAIDiscussesNewFundingAt$1.2TValuation
閲覧回数 3,587
52人が討論中