
SunspotAlgo
1.3k Posts

SunspotAlgo
Report
Block User
全职交易员|趋势交易者|全品种交易
技术指标开发者|AI 工程师
专注趋势跟踪与多市场交易,覆盖指数、商品、外汇、加密等全品种。作为指标与AI开发者,我用代码将交易逻辑系统化,让信号可验证、可执行、可复盘。信奉顺势、风控与纪律,不预测市场,只跟随趋势。
“万种行情归一势,半由心法半由机。”
0 Following
77 Followers
45 Liked
Posts
PINNED
·
--
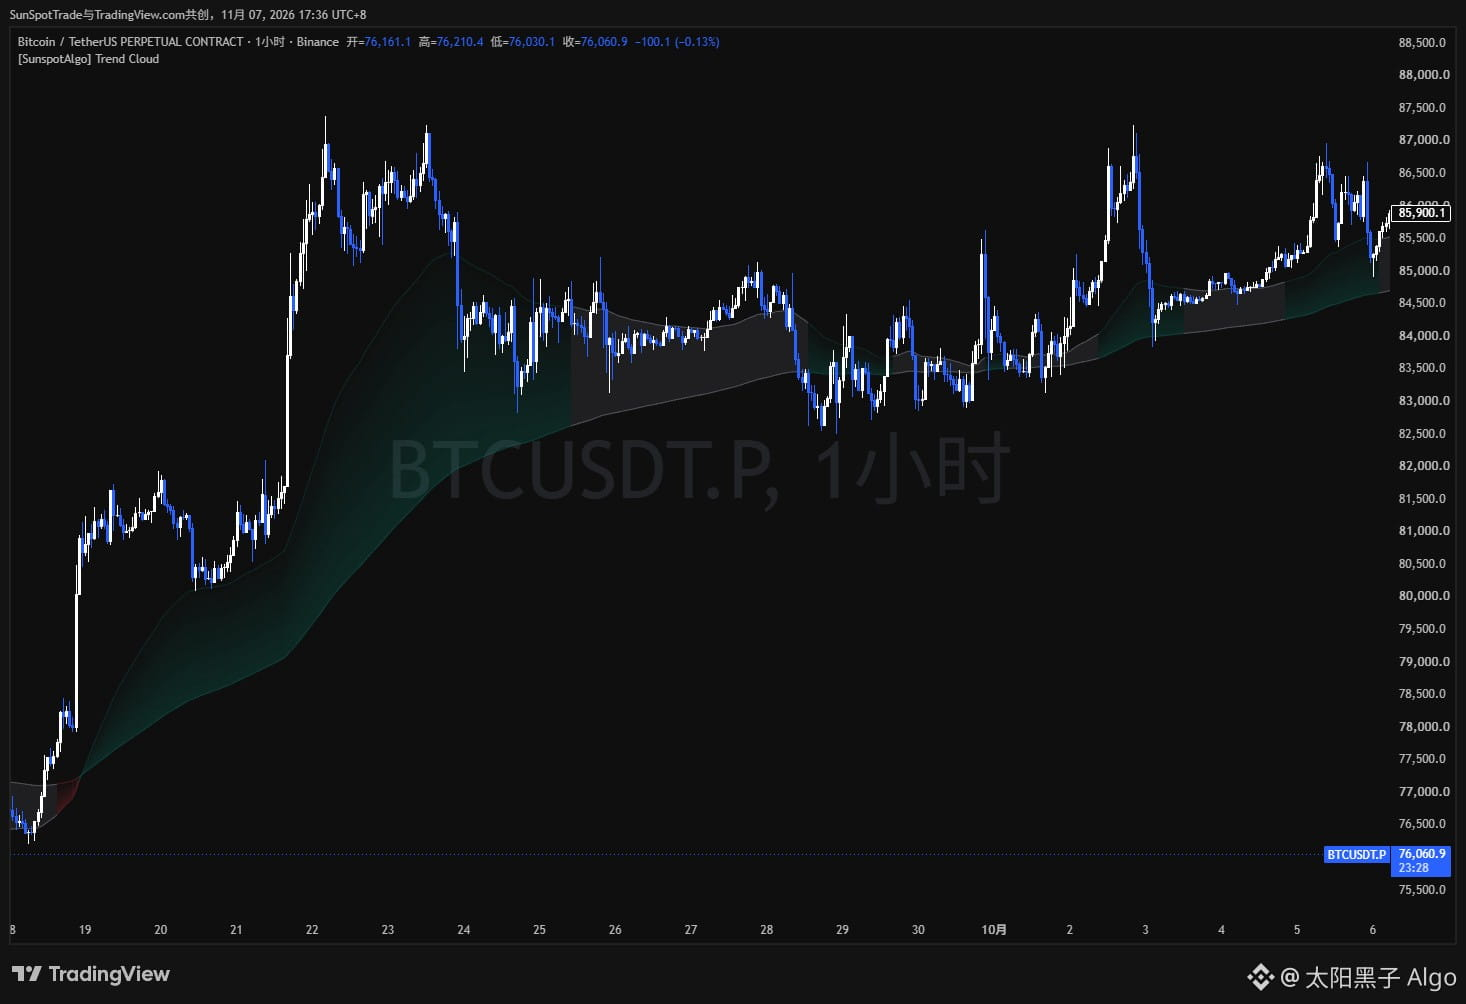
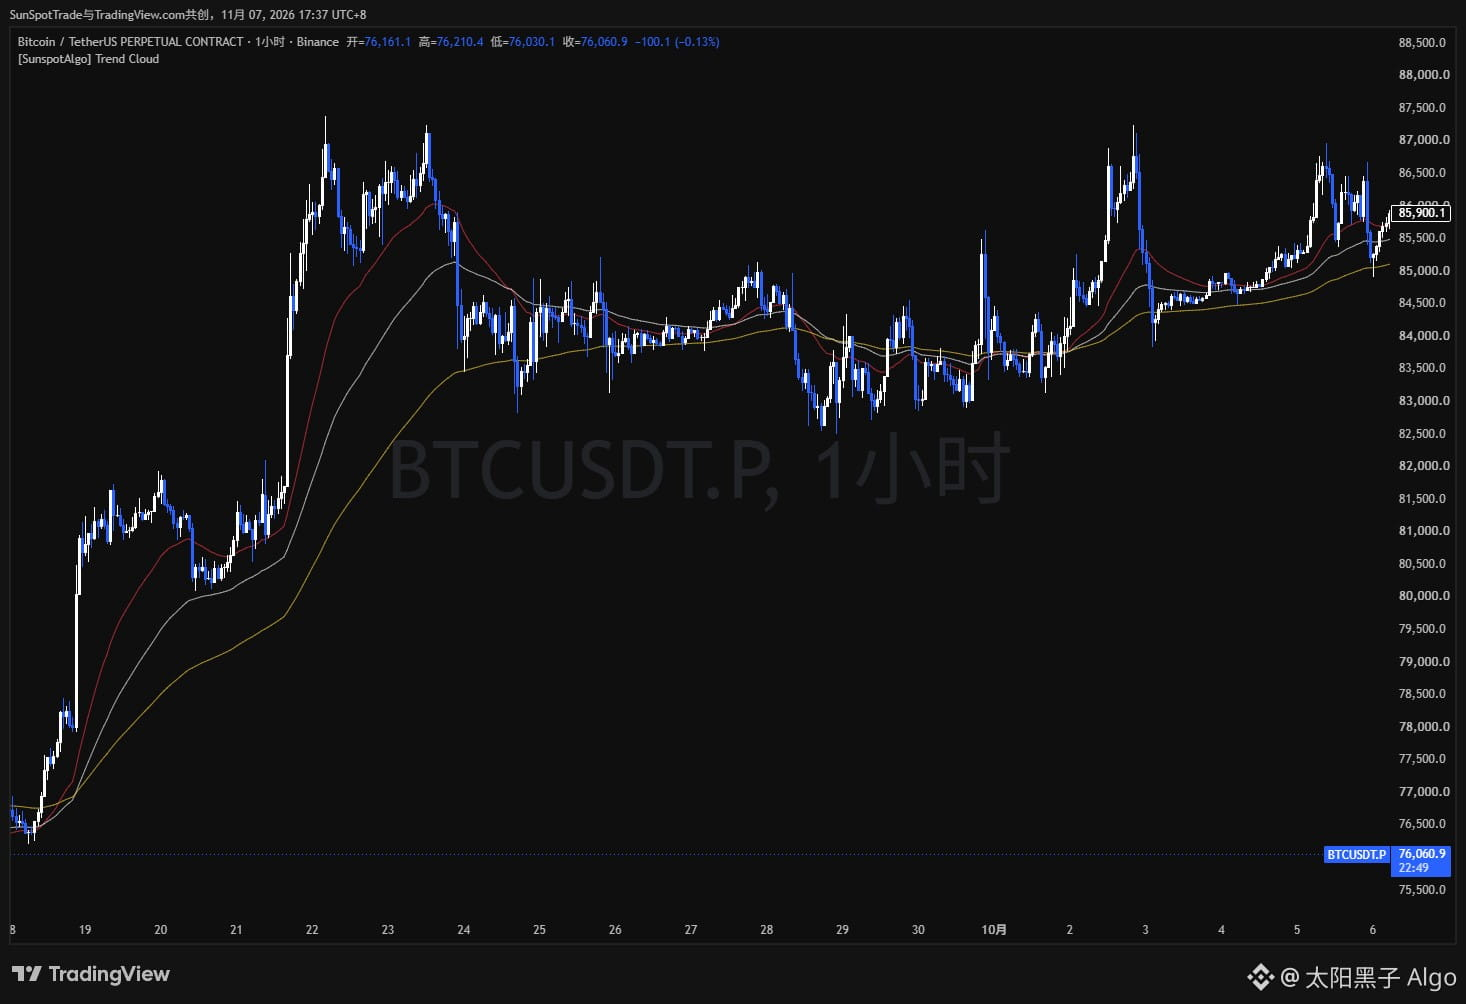
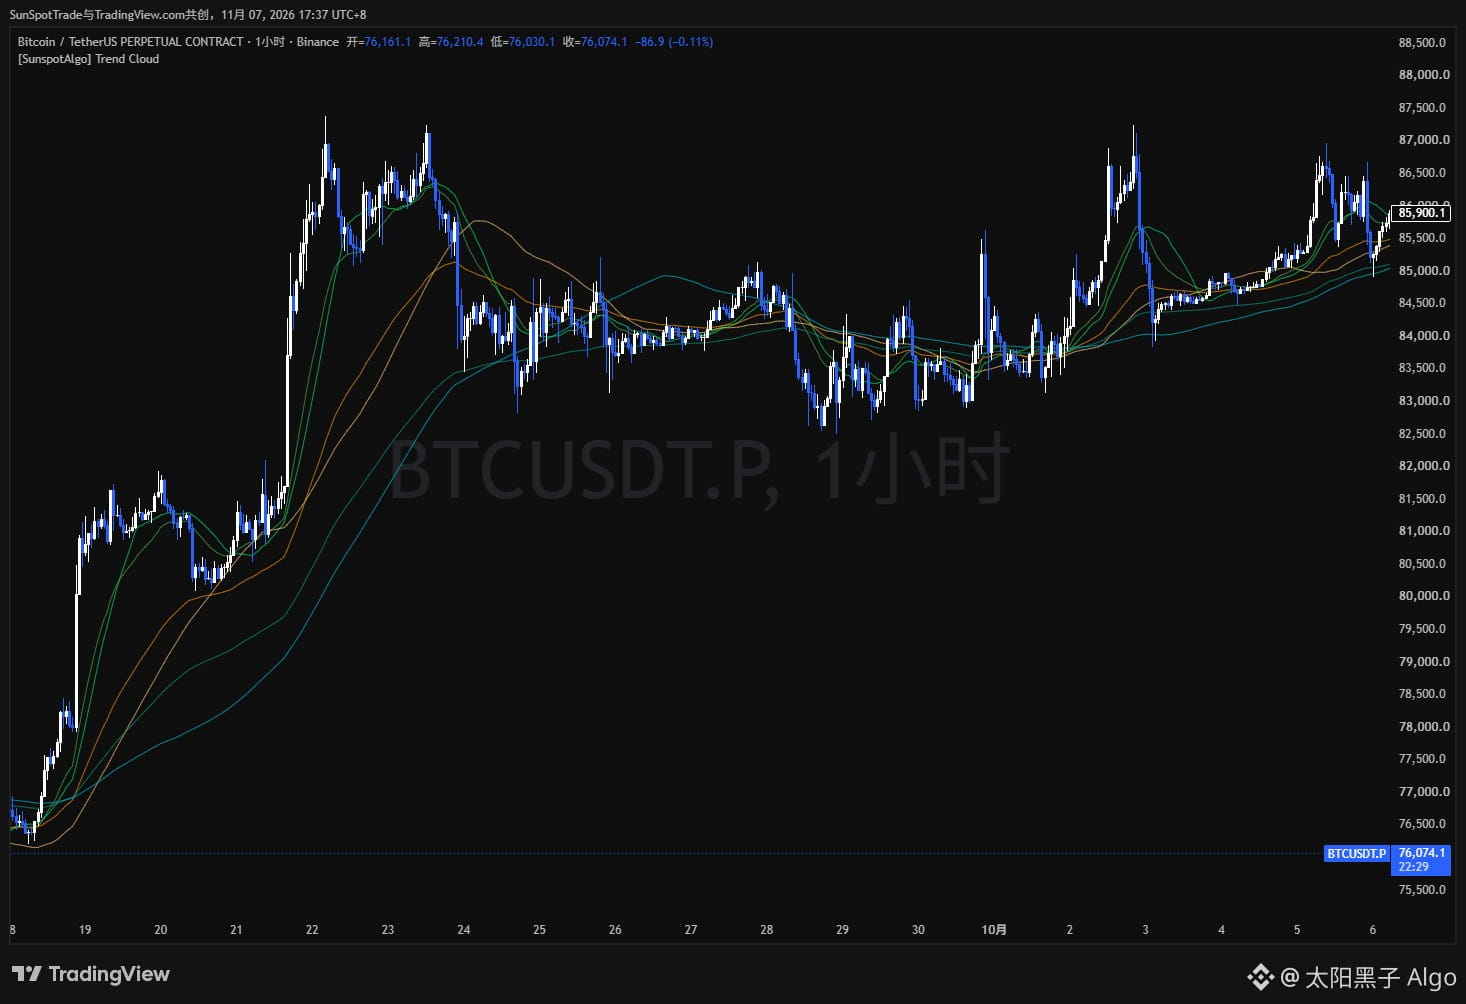
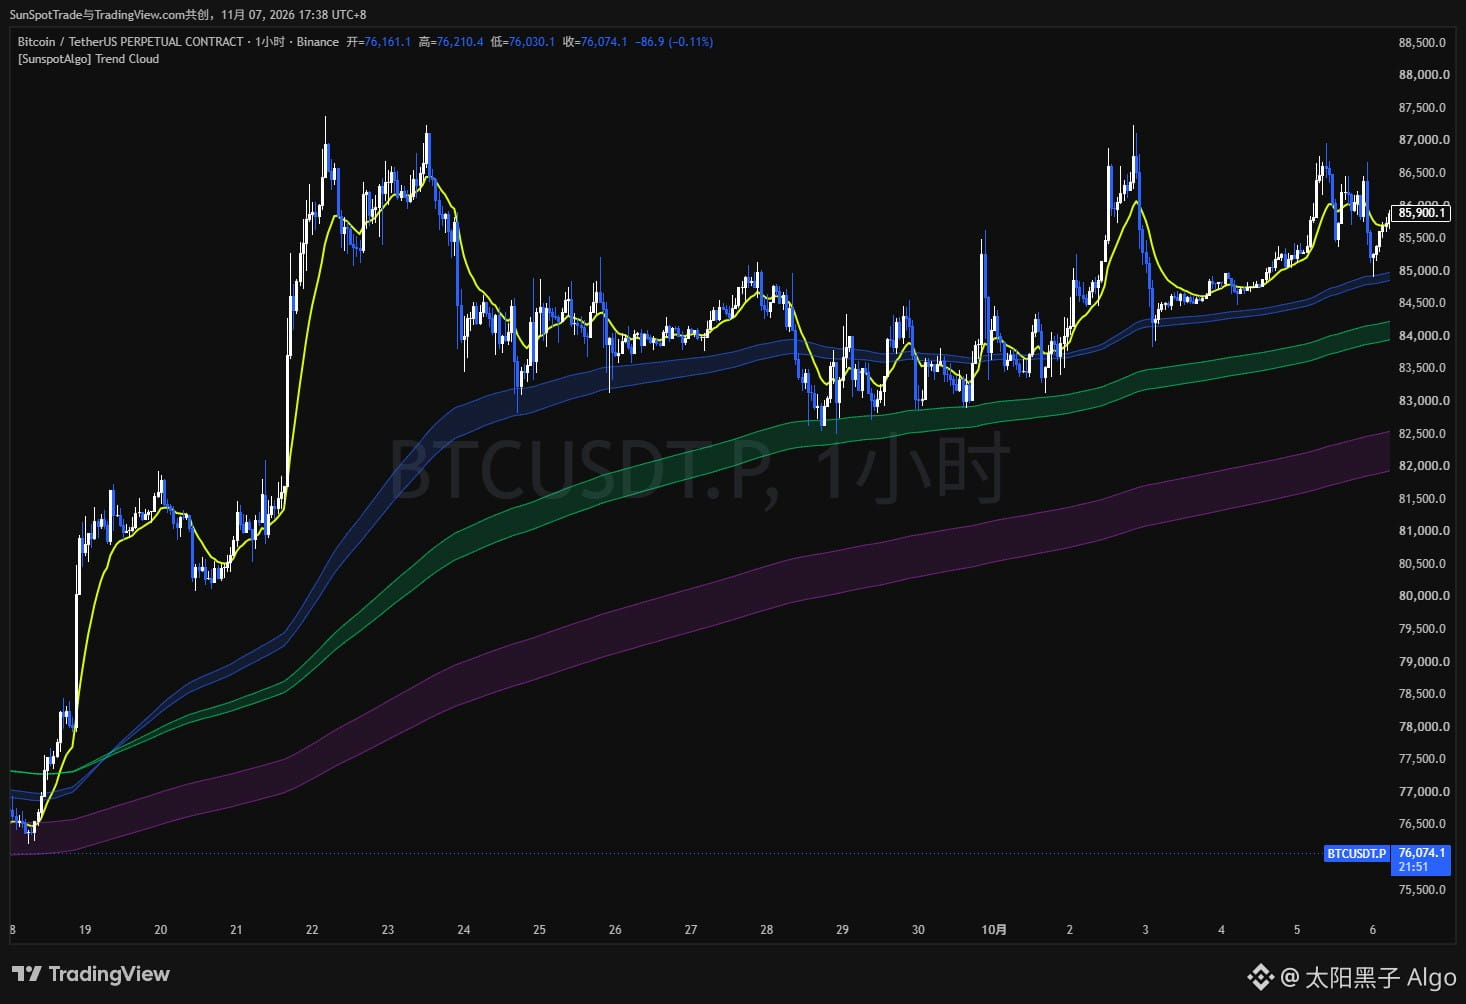
I’ve published a free indicator: Trend Cloud & MA Toolkit. It brings four moving-average setups together in one chart; Figures 1–4 show each of the four configurations.
The main cloud compares a fast and a slow moving average, set by default to EMA 55 and EMA 200. You can change both the lengths and the methods. When the fast line is above, the cloud shows a bullish color; when the slow line is above, it shows a bearish color. ADX filtering is enabled by default, with a threshold of 20. Below that threshold, the cloud turns neutral to indicate that trend strength is weak. Turn filtering off, and the cloud will reflect only the relationship between the fast and slow lines.
The three optional modules operate independently. The three-MA cluster is set by default to 30, 60, and 120, with a separate color for each. The dual-MA groups plot EMA and SMA side by side at 20, 60, and 120, making it easy to compare the two methods over the same periods. The VEGAS module is off by default. When enabled, it displays an EMA 12 filter line, along with short-term tunnels at 144 and 169, a medium-term tunnel at 288 and 338, and a long-term tunnel at 576 and 676. Each tunnel and its fill can be controlled individually.
This is a visual tool; it does not generate entry or exit signals or place orders. Moving averages and ADX are based on historical prices and lag, and performance varies across instruments and timeframes.
This indicator is public on TradingView. Its source code is protected, and you can use it by adding it directly to your chart—no application is required.
——————————————
Thanks for following! You’re also welcome to share your observations and ideas in the comments. I’ll continue sharing chart notes and market observations for your reference.
I’ve published a free indicator: Trend Cloud & MA Toolkit. It brings four moving-average setups together in one chart; Figures 1–4 show each of the four configurations.
The main cloud compares a fast and a slow moving average, set by default to EMA 55 and EMA 200. You can change both the lengths and the methods. When the fast line is above, the cloud shows a bullish color; when the slow line is above, it shows a bearish color. ADX filtering is enabled by default, with a threshold of 20. Below that threshold, the cloud turns neutral to indicate that trend strength is weak. Turn filtering off, and the cloud will reflect only the relationship between the fast and slow lines.
The three optional modules operate independently. The three-MA cluster is set by default to 30, 60, and 120, with a separate color for each. The dual-MA groups plot EMA and SMA side by side at 20, 60, and 120, making it easy to compare the two methods over the same periods. The VEGAS module is off by default. When enabled, it displays an EMA 12 filter line, along with short-term tunnels at 144 and 169, a medium-term tunnel at 288 and 338, and a long-term tunnel at 576 and 676. Each tunnel and its fill can be controlled individually.
This is a visual tool; it does not generate entry or exit signals or place orders. Moving averages and ADX are based on historical prices and lag, and performance varies across instruments and timeframes.
This indicator is public on TradingView. Its source code is protected, and you can use it by adding it directly to your chart—no application is required.
——————————————
Thanks for following! You’re also welcome to share your observations and ideas in the comments. I’ll continue sharing chart notes and market observations for your reference.
The main cloud compares a fast and a slow moving average, set by default to EMA 55 and EMA 200. You can change both the lengths and the methods. When the fast line is above, the cloud shows a bullish color; when the slow line is above, it shows a bearish color. ADX filtering is enabled by default, with a threshold of 20. Below that threshold, the cloud turns neutral to indicate that trend strength is weak. Turn filtering off, and the cloud will reflect only the relationship between the fast and slow lines.
The three optional modules operate independently. The three-MA cluster is set by default to 30, 60, and 120, with a separate color for each. The dual-MA groups plot EMA and SMA side by side at 20, 60, and 120, making it easy to compare the two methods over the same periods. The VEGAS module is off by default. When enabled, it displays an EMA 12 filter line, along with short-term tunnels at 144 and 169, a medium-term tunnel at 288 and 338, and a long-term tunnel at 576 and 676. Each tunnel and its fill can be controlled individually.
This is a visual tool; it does not generate entry or exit signals or place orders. Moving averages and ADX are based on historical prices and lag, and performance varies across instruments and timeframes.
This indicator is public on TradingView. Its source code is protected, and you can use it by adding it directly to your chart—no application is required.
——————————————
Thanks for following! You’re also welcome to share your observations and ideas in the comments. I’ll continue sharing chart notes and market observations for your reference.
1
146
·
--
#CL $CL 🟢 CL-4-hour-countertrend long
• Real-time price: 85.14
• Signal type: MIX reversal signal
• Instrument information: Crude oil contract
Sunspot Trading Signal @ 00:00:18
#CL $CL 🟢 CL-4-hour-countertrend long
• Real-time price: 85.14
• Signal type: MIX reversal signal
• Instrument information: Crude oil contract
Sunspot Trading Signal @ 00:00:18
• Real-time price: 85.14
• Signal type: MIX reversal signal
• Instrument information: Crude oil contract
Sunspot Trading Signal @ 00:00:18
10
·
--
#COIN $COIN 🔴 COIN-4-hour trend-following short
• Real-time price: 130.54
• Signal type: MIX trend signal
• Instrument: Coinbase stock
Sunspot trading signal @ 00:00:14
#COIN $COIN 🔴 COIN-4-hour trend-following short
• Real-time price: 130.54
• Signal type: MIX trend signal
• Instrument: Coinbase stock
Sunspot trading signal @ 00:00:14
• Real-time price: 130.54
• Signal type: MIX trend signal
• Instrument: Coinbase stock
Sunspot trading signal @ 00:00:14
5
·
--
#DELL $DELL 🔴 DELL-4-hour trend-following short
• Real-time price: 331.27
• Signal type: MIX trend signal
• Instrument: Dell stock
Sunspot trading signal @ 00:00:12
#DELL $DELL 🔴 DELL-4-hour trend-following short
• Real-time price: 331.27
• Signal type: MIX trend signal
• Instrument: Dell stock
Sunspot trading signal @ 00:00:12
• Real-time price: 331.27
• Signal type: MIX trend signal
• Instrument: Dell stock
Sunspot trading signal @ 00:00:12
4
·
--
#XAU $XAU 🔴 XAU-4H – Trend-following short
• Live price: 4049.03
• Signal type: VGS trend pullback signal T1
• Instrument: Gold contract
Sunspot Trading Signal @ 00:00:07
#XAU $XAU 🔴 XAU-4H – Trend-following short
• Live price: 4049.03
• Signal type: VGS trend pullback signal T1
• Instrument: Gold contract
Sunspot Trading Signal @ 00:00:07
• Live price: 4049.03
• Signal type: VGS trend pullback signal T1
• Instrument: Gold contract
Sunspot Trading Signal @ 00:00:07
86
·
--
🔴 AUDUSD-4-hour-trend-following short
• Current price: 0.68730
• Signal type: MIX trend signal
• Instrument: Australian dollar/US dollar
Sunspot trading signal @ 22:01:02
🔴 AUDUSD-4-hour-trend-following short
• Current price: 0.68730
• Signal type: MIX trend signal
• Instrument: Australian dollar/US dollar
Sunspot trading signal @ 22:01:02
• Current price: 0.68730
• Signal type: MIX trend signal
• Instrument: Australian dollar/US dollar
Sunspot trading signal @ 22:01:02
17
·
--
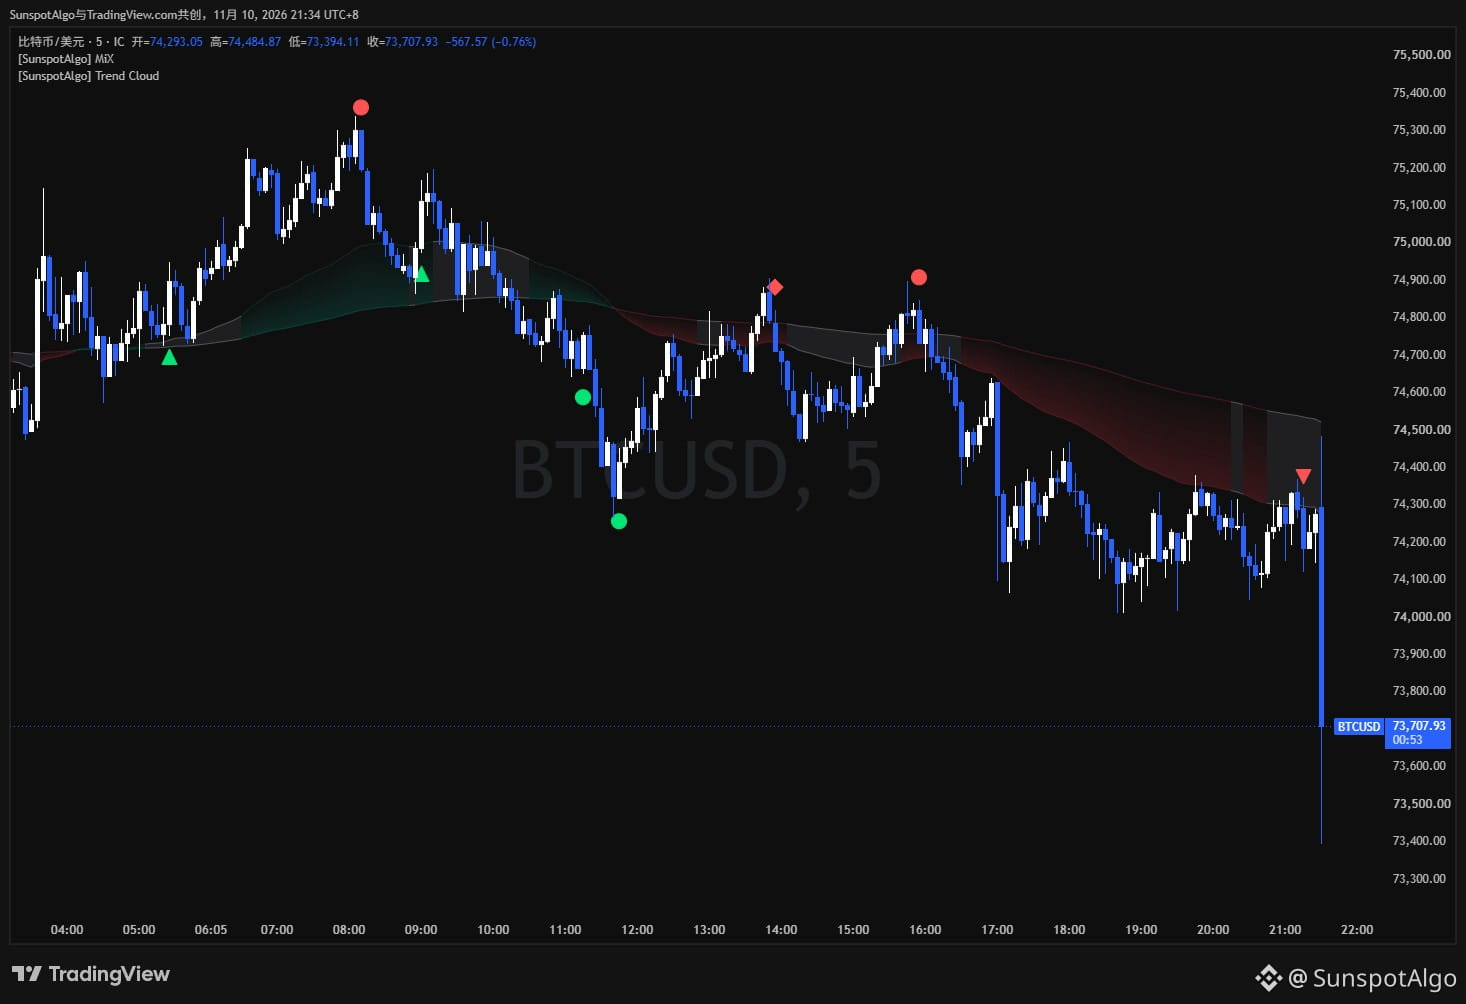
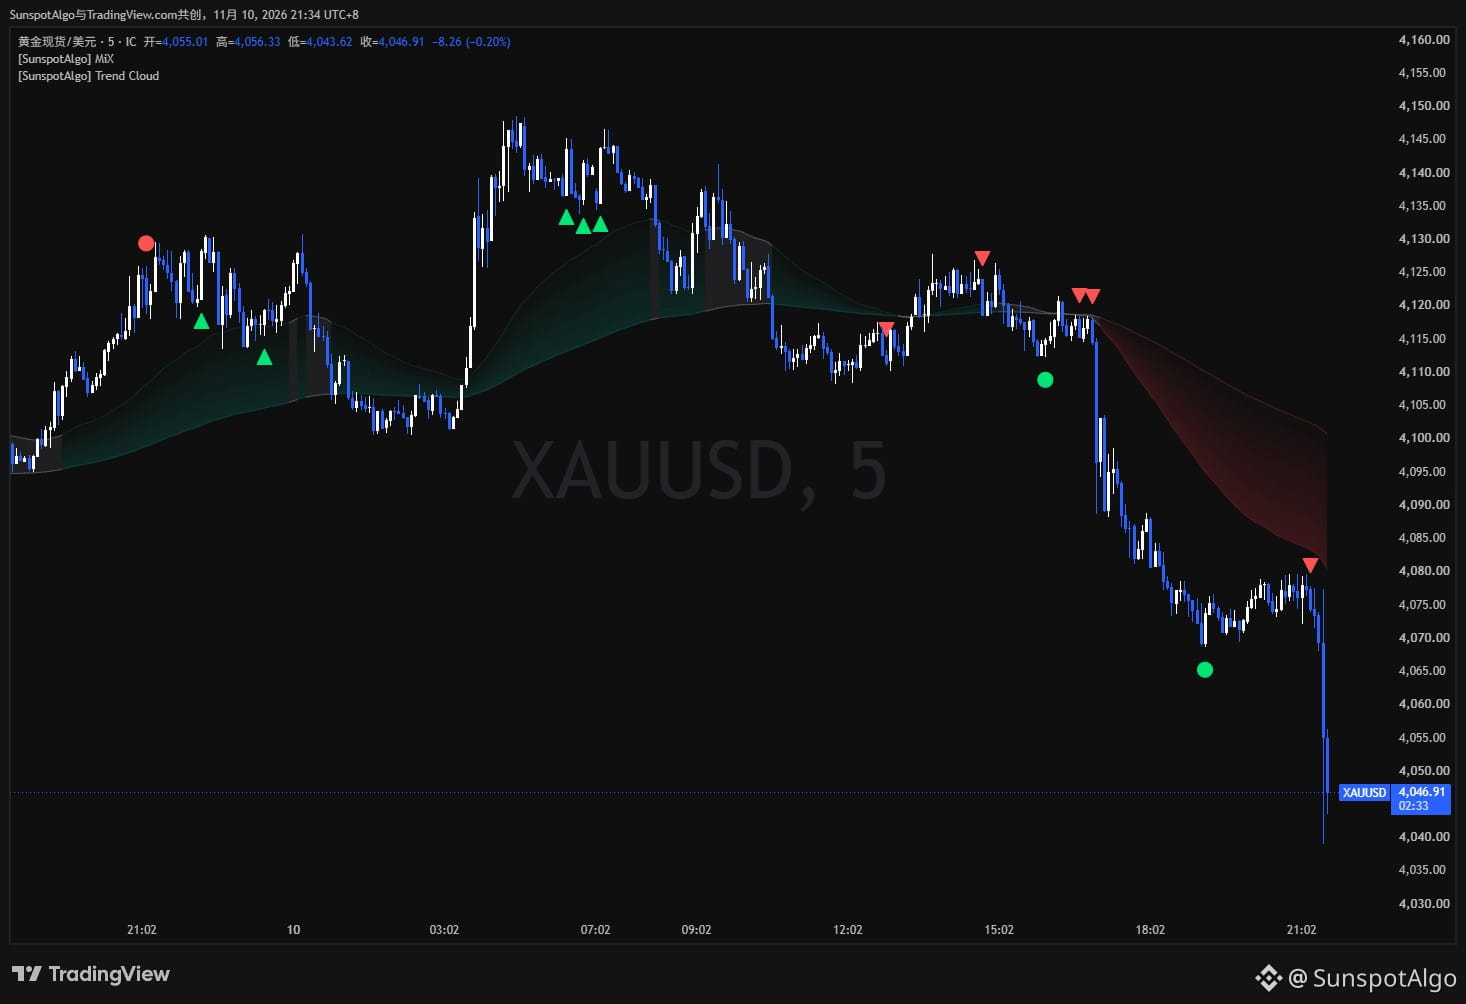
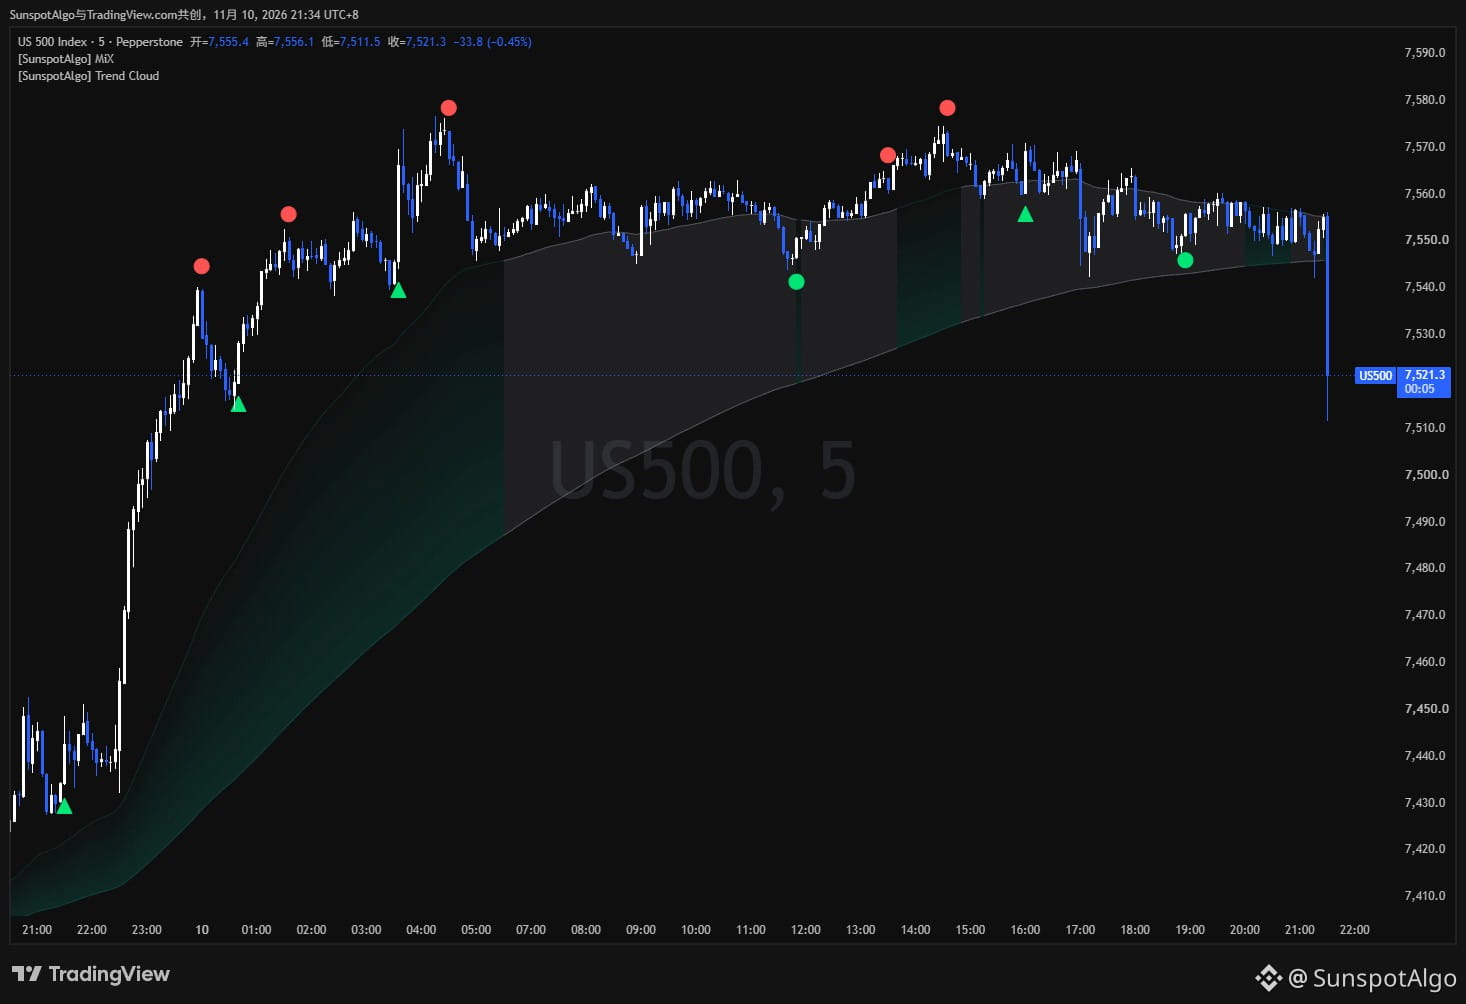
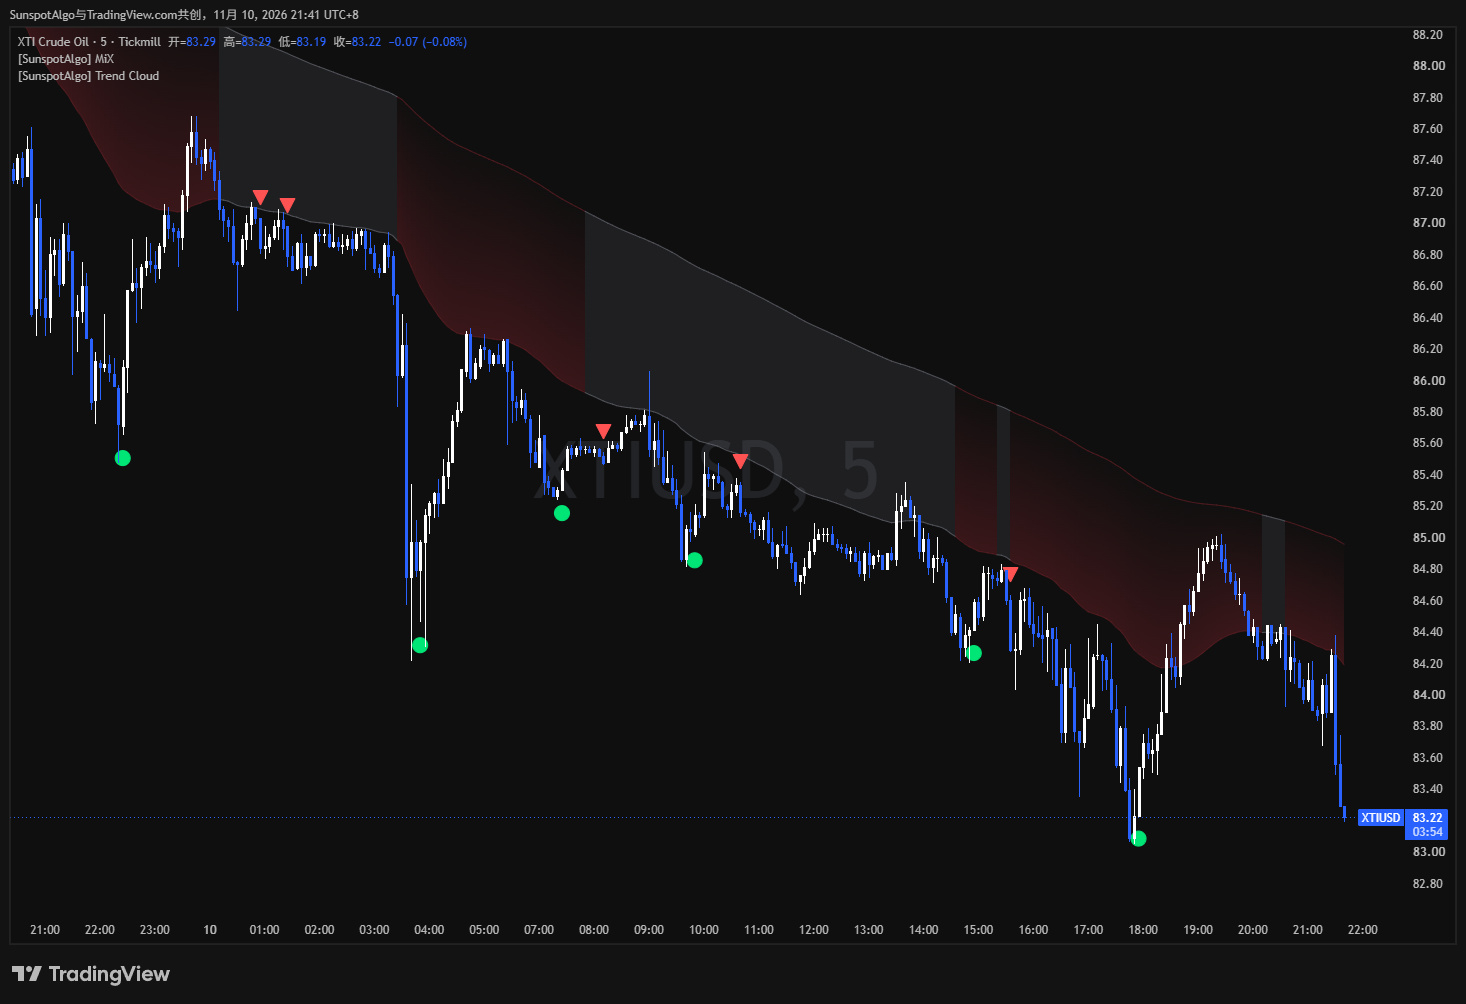
I created MIX on TradingView, a predictive signal indicator.
Red indicates a short signal, and green indicates a long signal. Dots indicate reversals, while triangles indicate trend-following signals. All four charts are on the 5-minute timeframe: Bitcoin, gold, the S&P 500, and crude oil. They record how the signals change over the same market period.
MIX generates and locks each signal when the candle closes. It uses no future data and does not repaint; once locked, a signal will not change. This is a fundamental design principle, hard-coded into the script.
It is not individually tuned for any particular instrument or timeframe. If an instrument has a candlestick chart on TradingView, you can use it on that instrument and timeframe. The same rules apply across everything from crypto to energy, and from 5-minute to 4-hour charts. Changing the timeframe only changes the signal frequency.
Achieving both a high win rate and a high reward-to-risk ratio without repainting is not easy, and no one can accurately predict the next candle's movement. So I recommend taking screenshots and tracking the win rate and reward-to-risk ratio yourself. Place the charts back in the context of the full price action, then review each candle using consistent criteria.
What I can promise is that there are no future functions, signals are locked at candle close, and alerts will be forwarded in real time once you set them up.
The 4-hour signals I usually post are on a higher timeframe, so there aren't many of them. These short-timeframe charts are for my own use when examining the details.
——————————————
Thanks for following, and feel free to share your observations and ideas in the comments. I'll continue sharing chart records and market observations for everyone to refer to.
I created MIX on TradingView, a predictive signal indicator.
Red indicates a short signal, and green indicates a long signal. Dots indicate reversals, while triangles indicate trend-following signals. All four charts are on the 5-minute timeframe: Bitcoin, gold, the S&P 500, and crude oil. They record how the signals change over the same market period.
MIX generates and locks each signal when the candle closes. It uses no future data and does not repaint; once locked, a signal will not change. This is a fundamental design principle, hard-coded into the script.
It is not individually tuned for any particular instrument or timeframe. If an instrument has a candlestick chart on TradingView, you can use it on that instrument and timeframe. The same rules apply across everything from crypto to energy, and from 5-minute to 4-hour charts. Changing the timeframe only changes the signal frequency.
Achieving both a high win rate and a high reward-to-risk ratio without repainting is not easy, and no one can accurately predict the next candle's movement. So I recommend taking screenshots and tracking the win rate and reward-to-risk ratio yourself. Place the charts back in the context of the full price action, then review each candle using consistent criteria.
What I can promise is that there are no future functions, signals are locked at candle close, and alerts will be forwarded in real time once you set them up.
The 4-hour signals I usually post are on a higher timeframe, so there aren't many of them. These short-timeframe charts are for my own use when examining the details.
——————————————
Thanks for following, and feel free to share your observations and ideas in the comments. I'll continue sharing chart records and market observations for everyone to refer to.
Red indicates a short signal, and green indicates a long signal. Dots indicate reversals, while triangles indicate trend-following signals. All four charts are on the 5-minute timeframe: Bitcoin, gold, the S&P 500, and crude oil. They record how the signals change over the same market period.
MIX generates and locks each signal when the candle closes. It uses no future data and does not repaint; once locked, a signal will not change. This is a fundamental design principle, hard-coded into the script.
It is not individually tuned for any particular instrument or timeframe. If an instrument has a candlestick chart on TradingView, you can use it on that instrument and timeframe. The same rules apply across everything from crypto to energy, and from 5-minute to 4-hour charts. Changing the timeframe only changes the signal frequency.
Achieving both a high win rate and a high reward-to-risk ratio without repainting is not easy, and no one can accurately predict the next candle's movement. So I recommend taking screenshots and tracking the win rate and reward-to-risk ratio yourself. Place the charts back in the context of the full price action, then review each candle using consistent criteria.
What I can promise is that there are no future functions, signals are locked at candle close, and alerts will be forwarded in real time once you set them up.
The 4-hour signals I usually post are on a higher timeframe, so there aren't many of them. These short-timeframe charts are for my own use when examining the details.
——————————————
Thanks for following, and feel free to share your observations and ideas in the comments. I'll continue sharing chart records and market observations for everyone to refer to.
82
·
--
#比特币 $BTC Bitcoin has been moving sideways below 75,000 today. It can’t seem to fall any further, but it can’t get back up either. There’s not much to say about the price itself; what’s worth talking about is the mismatch between the price and the direction of money flows.
U.S. spot Bitcoin ETFs saw net outflows of over a billion dollars last week, and another 200 million flowed out on Monday. The largest fund has seen redemptions for seven consecutive trading days, and its year-to-date flows have already flipped from net inflows to net outflows. Two months ago, redemptions on this scale would have been enough to send the market plunging. Not today.
I’m watching three things.
First, volume. Trading volume picked up during this decline, which shows that people were genuinely selling. But volume has tapered off during today’s move up. I’m generally skeptical of a rebound on declining volume, but the fact that it hasn’t been knocked back down despite lower volume suggests selling pressure is fading.
Second, leverage. Perpetual funding rates are below the benchmark, while open interest is actually rising. Low funding rates suggest that a round of long chasers has already been cleared out, so positioning isn’t crowded. Rising open interest suggests someone is stepping in at these lower levels. As for who, I don’t know.
Third, the direction of liquidations. Over the past 24 hours, the value of liquidated long positions was about one and a half times that of short positions. This decline was pushed down by stop-loss orders; sellers didn’t do much of the heavy lifting. These two kinds of declines tend to play out differently: the former can bottom in one go, while the latter is more likely to drag on.
I’m inclined to think this move is grinding out a short-term bottom. A short-term bottom and the bottom are two different things; the former can still break lower.
What’s uncertain is tonight’s CPI. If core inflation comes in hotter than expected, interest-rate expectations will have to be repriced, and the weight I give to the positioning observations above will have to come down. That’s not a matter of market structure.
Here’s what would invalidate my view: if we get another four-hour close below this week’s low, I’ll treat this as a continuation lower and stop waiting. Conversely, if price can reclaim the upper half of this week’s range, I’ll consider this a routine shakeout.
#比特币 $BTC Bitcoin has been moving sideways below 75,000 today. It can’t seem to fall any further, but it can’t get back up either. There’s not much to say about the price itself; what’s worth talking about is the mismatch between the price and the direction of money flows.
U.S. spot Bitcoin ETFs saw net outflows of over a billion dollars last week, and another 200 million flowed out on Monday. The largest fund has seen redemptions for seven consecutive trading days, and its year-to-date flows have already flipped from net inflows to net outflows. Two months ago, redemptions on this scale would have been enough to send the market plunging. Not today.
I’m watching three things.
First, volume. Trading volume picked up during this decline, which shows that people were genuinely selling. But volume has tapered off during today’s move up. I’m generally skeptical of a rebound on declining volume, but the fact that it hasn’t been knocked back down despite lower volume suggests selling pressure is fading.
Second, leverage. Perpetual funding rates are below the benchmark, while open interest is actually rising. Low funding rates suggest that a round of long chasers has already been cleared out, so positioning isn’t crowded. Rising open interest suggests someone is stepping in at these lower levels. As for who, I don’t know.
Third, the direction of liquidations. Over the past 24 hours, the value of liquidated long positions was about one and a half times that of short positions. This decline was pushed down by stop-loss orders; sellers didn’t do much of the heavy lifting. These two kinds of declines tend to play out differently: the former can bottom in one go, while the latter is more likely to drag on.
I’m inclined to think this move is grinding out a short-term bottom. A short-term bottom and the bottom are two different things; the former can still break lower.
What’s uncertain is tonight’s CPI. If core inflation comes in hotter than expected, interest-rate expectations will have to be repriced, and the weight I give to the positioning observations above will have to come down. That’s not a matter of market structure.
Here’s what would invalidate my view: if we get another four-hour close below this week’s low, I’ll treat this as a continuation lower and stop waiting. Conversely, if price can reclaim the upper half of this week’s range, I’ll consider this a routine shakeout.
U.S. spot Bitcoin ETFs saw net outflows of over a billion dollars last week, and another 200 million flowed out on Monday. The largest fund has seen redemptions for seven consecutive trading days, and its year-to-date flows have already flipped from net inflows to net outflows. Two months ago, redemptions on this scale would have been enough to send the market plunging. Not today.
I’m watching three things.
First, volume. Trading volume picked up during this decline, which shows that people were genuinely selling. But volume has tapered off during today’s move up. I’m generally skeptical of a rebound on declining volume, but the fact that it hasn’t been knocked back down despite lower volume suggests selling pressure is fading.
Second, leverage. Perpetual funding rates are below the benchmark, while open interest is actually rising. Low funding rates suggest that a round of long chasers has already been cleared out, so positioning isn’t crowded. Rising open interest suggests someone is stepping in at these lower levels. As for who, I don’t know.
Third, the direction of liquidations. Over the past 24 hours, the value of liquidated long positions was about one and a half times that of short positions. This decline was pushed down by stop-loss orders; sellers didn’t do much of the heavy lifting. These two kinds of declines tend to play out differently: the former can bottom in one go, while the latter is more likely to drag on.
I’m inclined to think this move is grinding out a short-term bottom. A short-term bottom and the bottom are two different things; the former can still break lower.
What’s uncertain is tonight’s CPI. If core inflation comes in hotter than expected, interest-rate expectations will have to be repriced, and the weight I give to the positioning observations above will have to come down. That’s not a matter of market structure.
Here’s what would invalidate my view: if we get another four-hour close below this week’s low, I’ll treat this as a continuation lower and stop waiting. Conversely, if price can reclaim the upper half of this week’s range, I’ll consider this a routine shakeout.
50
·
--
#AAPL $AAPL 🔴 AAPL-4-hour countertrend short
• Current price: 351.03
• Signal type: MIX reversal signal
• Instrument: Apple stock
Sunspot trading signal @ 16:00:30
#AAPL $AAPL 🔴 AAPL-4-hour countertrend short
• Current price: 351.03
• Signal type: MIX reversal signal
• Instrument: Apple stock
Sunspot trading signal @ 16:00:30
• Current price: 351.03
• Signal type: MIX reversal signal
• Instrument: Apple stock
Sunspot trading signal @ 16:00:30
58
·
--
#比特币 #BTC走势分析 $BTC People watching the market over the past couple of days have probably had the same feeling: it won't fall any further, but it can't go up either. The price has been grinding back and forth within a narrow range. The 24-hour volatility is under 2.5%, and the seven-day total is still down a little over 3%. After the drop, nobody is stepping in to buy, but nobody is rushing to chase it either.
On the futures side, open interest has risen to $51.7 billion, up another 1.8% in a day, while funding rates remain positive. Leverage is building, and bulls are still paying to hold their positions.
Spot markets are telling the opposite story. U.S. spot ETFs saw net outflows of $201 million yesterday, following $1.28 billion in outflows over the previous full week, most of it from one provider. Spot Ethereum ETFs also saw outflows of more than $300 million over the same period.
The sentiment index has climbed from 29 to 32, but it's still in fear territory. I generally don't take this kind of rebound as a bullish sign. Catching your breath after being oversold and a reversal are two different things.
Taken together, these three things make me uneasy. A sideways price, rising leverage, and spot outflows—this combination has historically looked more like a pause in the trend than a starting point.
What I'm unsure about is tomorrow. If U.S. inflation data comes in softer than expected, this whole view could be invalidated overnight. So the invalidation conditions are very clear: if the price reclaims the top of this week's range and spot ETFs record net inflows for two consecutive days, I'll consider this week's analysis a waste of time.
Until then, I'd rather treat this as a stretch we have to sit through.
#比特币 #BTC走势分析 $BTC People watching the market over the past couple of days have probably had the same feeling: it won't fall any further, but it can't go up either. The price has been grinding back and forth within a narrow range. The 24-hour volatility is under 2.5%, and the seven-day total is still down a little over 3%. After the drop, nobody is stepping in to buy, but nobody is rushing to chase it either.
On the futures side, open interest has risen to $51.7 billion, up another 1.8% in a day, while funding rates remain positive. Leverage is building, and bulls are still paying to hold their positions.
Spot markets are telling the opposite story. U.S. spot ETFs saw net outflows of $201 million yesterday, following $1.28 billion in outflows over the previous full week, most of it from one provider. Spot Ethereum ETFs also saw outflows of more than $300 million over the same period.
The sentiment index has climbed from 29 to 32, but it's still in fear territory. I generally don't take this kind of rebound as a bullish sign. Catching your breath after being oversold and a reversal are two different things.
Taken together, these three things make me uneasy. A sideways price, rising leverage, and spot outflows—this combination has historically looked more like a pause in the trend than a starting point.
What I'm unsure about is tomorrow. If U.S. inflation data comes in softer than expected, this whole view could be invalidated overnight. So the invalidation conditions are very clear: if the price reclaims the top of this week's range and spot ETFs record net inflows for two consecutive days, I'll consider this week's analysis a waste of time.
Until then, I'd rather treat this as a stretch we have to sit through.
On the futures side, open interest has risen to $51.7 billion, up another 1.8% in a day, while funding rates remain positive. Leverage is building, and bulls are still paying to hold their positions.
Spot markets are telling the opposite story. U.S. spot ETFs saw net outflows of $201 million yesterday, following $1.28 billion in outflows over the previous full week, most of it from one provider. Spot Ethereum ETFs also saw outflows of more than $300 million over the same period.
The sentiment index has climbed from 29 to 32, but it's still in fear territory. I generally don't take this kind of rebound as a bullish sign. Catching your breath after being oversold and a reversal are two different things.
Taken together, these three things make me uneasy. A sideways price, rising leverage, and spot outflows—this combination has historically looked more like a pause in the trend than a starting point.
What I'm unsure about is tomorrow. If U.S. inflation data comes in softer than expected, this whole view could be invalidated overnight. So the invalidation conditions are very clear: if the price reclaims the top of this week's range and spot ETFs record net inflows for two consecutive days, I'll consider this week's analysis a waste of time.
Until then, I'd rather treat this as a stretch we have to sit through.
94
·
--
#Bitcoin
Bitcoin has been stepping lower on the four-hour chart lately.
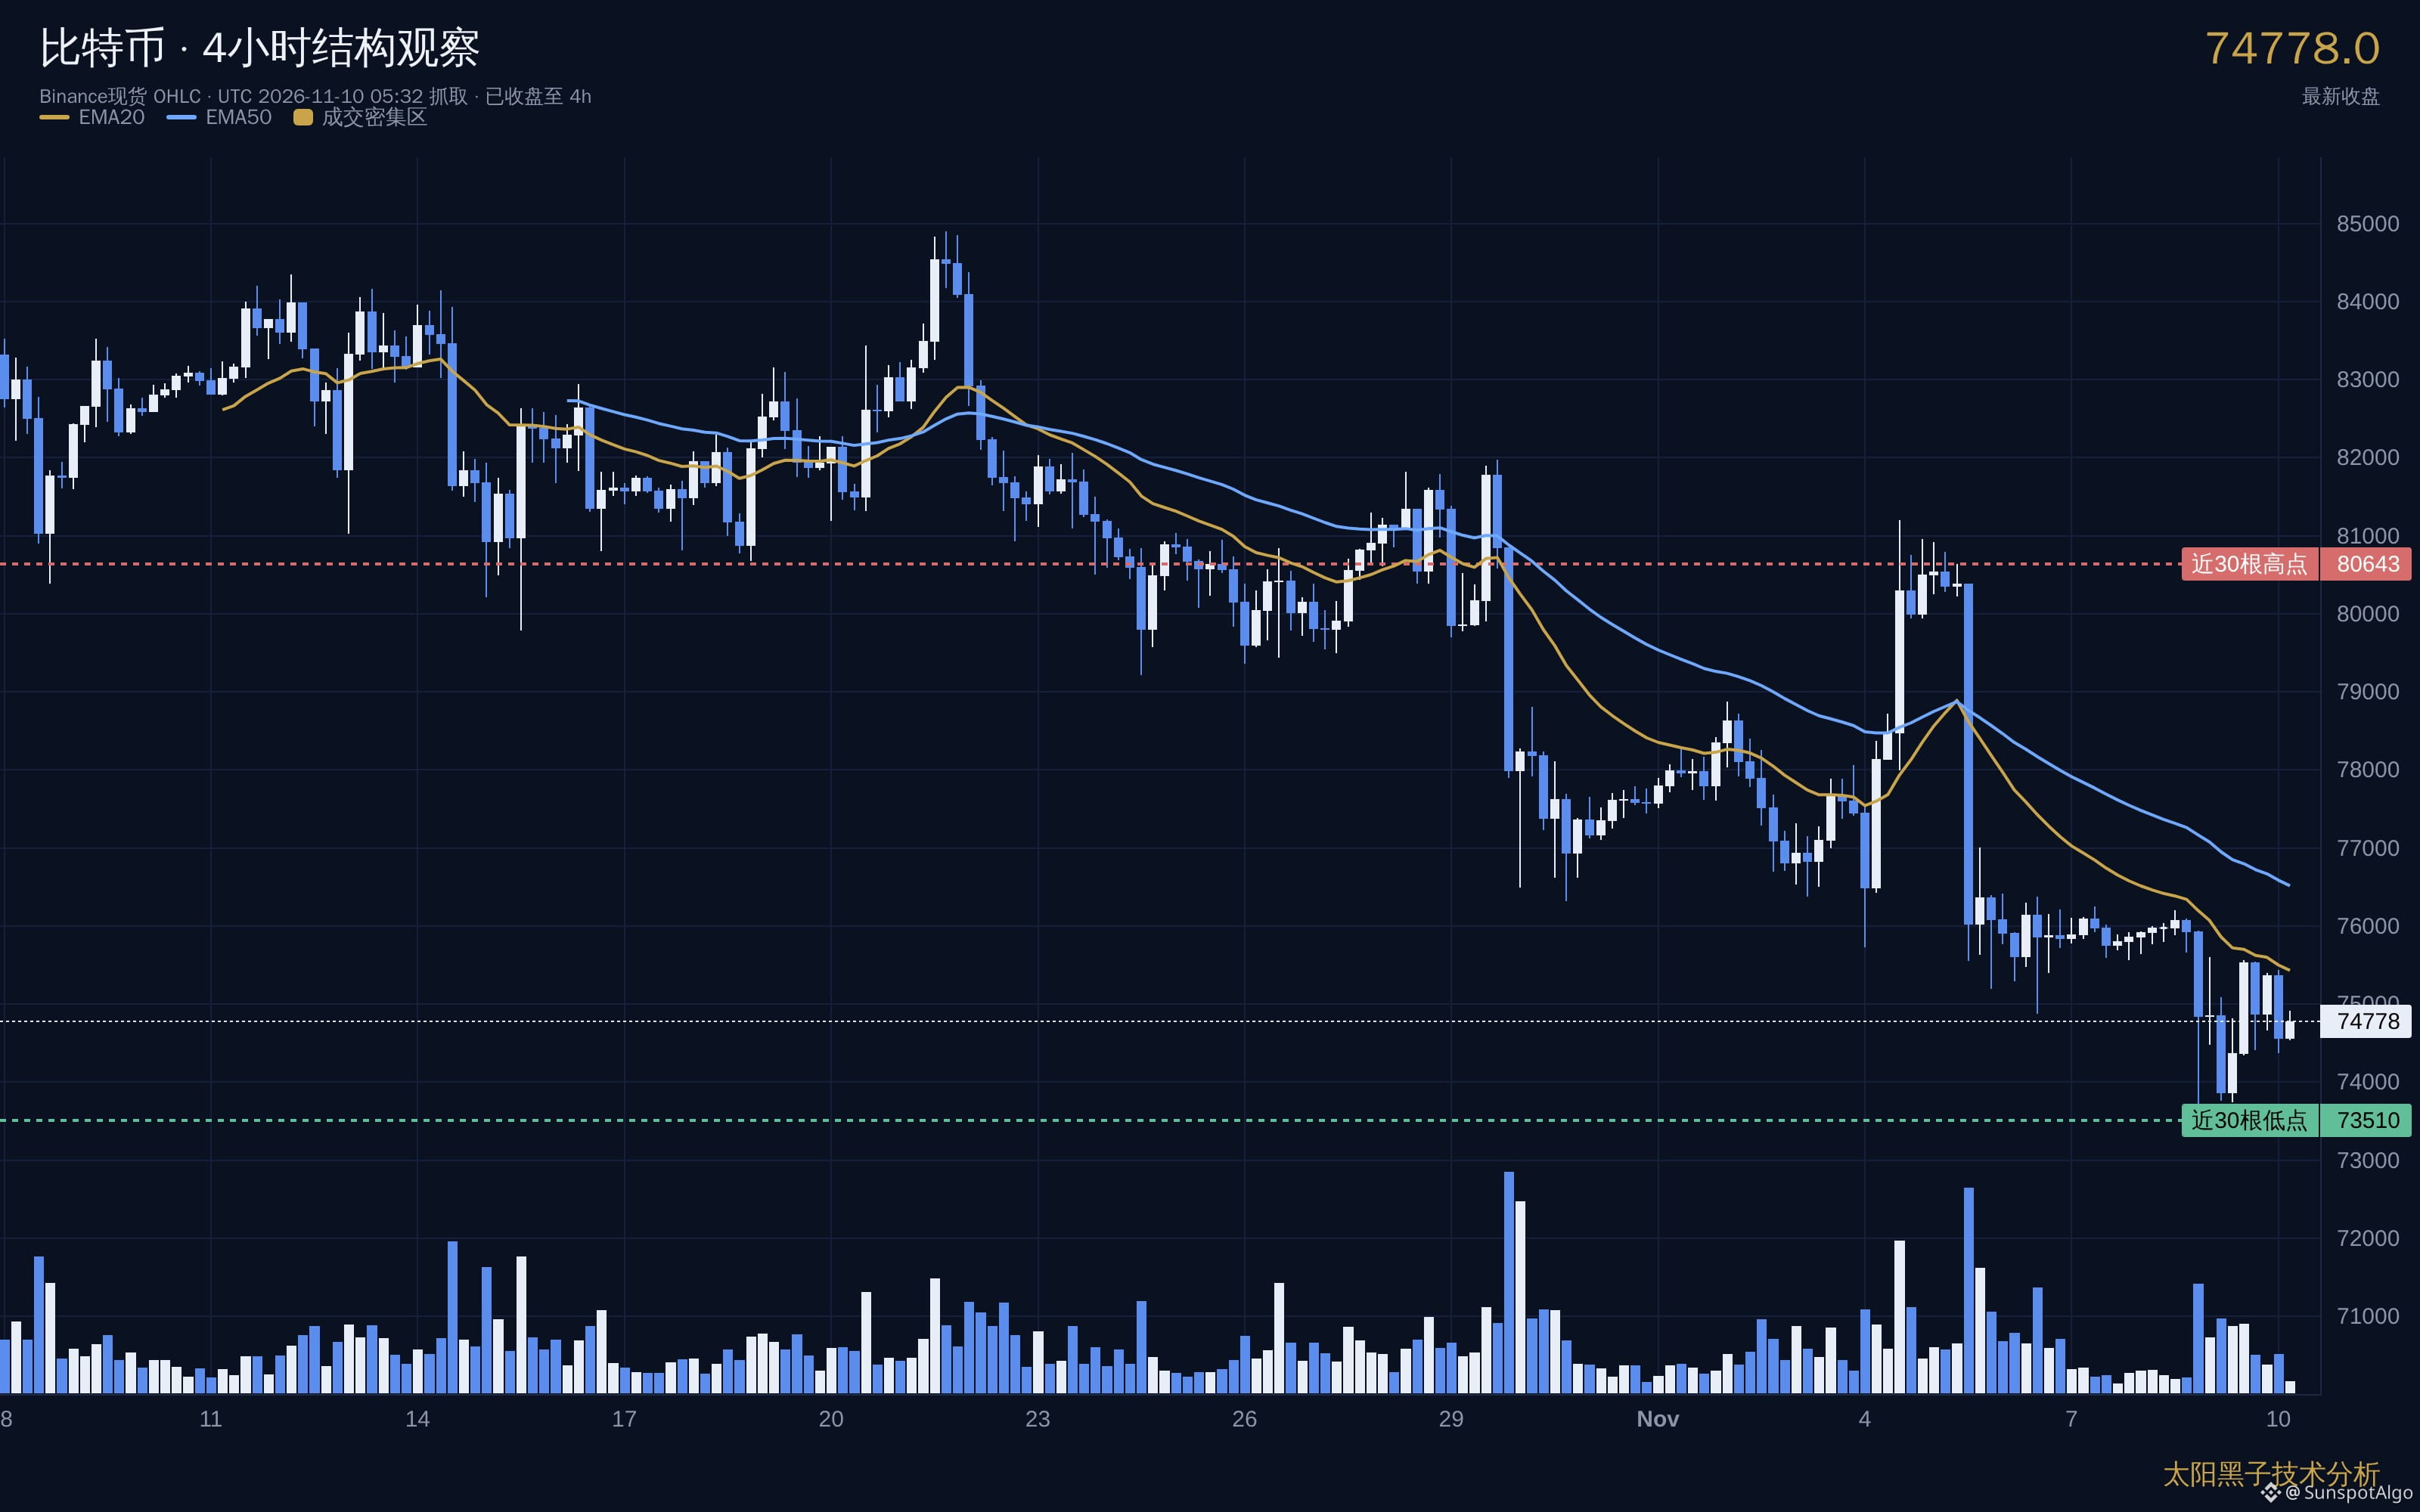
The last rally reached around 80643 but couldn’t hold there, and prices quickly turned lower. It kept breaking support on the way down, finally bottoming out at 73510, with almost no meaningful bounce along the way.
The price is now back at 74778, recovering some ground from that low, but still well below the previous high.
The key thing to watch here is whether the rebound can hold.
If the price just inches higher on declining volume, touches a moving average, then turns back down, that would be a continuation of the downtrend, and 73510 would need to hold again. If it climbs back above the moving average on strong volume, then this leg down may have paused for now, and we can see whether it can make up more ground.
If 73510 breaks again, there won’t be any meaningful support below, and the decline could continue.
I’m in no rush to act. Trying to catch a bounce during a downtrend is like catching a falling knife—nine times out of ten, you get cut. Waiting for the four-hour chart to show that prices have stabilized feels safer than trying to guess the bottom.
The chart shows Bitcoin’s four-hour closing prices, with the key levels marked. Take a look for yourself.
——————————————
Thanks for following, and feel free to share your observations and thoughts in the comments. I’ll continue sharing chart notes and market observations for reference.
#Bitcoin
Bitcoin has been stepping lower on the four-hour chart lately.
The last rally reached around 80643 but couldn’t hold there, and prices quickly turned lower. It kept breaking support on the way down, finally bottoming out at 73510, with almost no meaningful bounce along the way.
The price is now back at 74778, recovering some ground from that low, but still well below the previous high.
The key thing to watch here is whether the rebound can hold.
If the price just inches higher on declining volume, touches a moving average, then turns back down, that would be a continuation of the downtrend, and 73510 would need to hold again. If it climbs back above the moving average on strong volume, then this leg down may have paused for now, and we can see whether it can make up more ground.
If 73510 breaks again, there won’t be any meaningful support below, and the decline could continue.
I’m in no rush to act. Trying to catch a bounce during a downtrend is like catching a falling knife—nine times out of ten, you get cut. Waiting for the four-hour chart to show that prices have stabilized feels safer than trying to guess the bottom.
The chart shows Bitcoin’s four-hour closing prices, with the key levels marked. Take a look for yourself.
——————————————
Thanks for following, and feel free to share your observations and thoughts in the comments. I’ll continue sharing chart notes and market observations for reference.
Bitcoin has been stepping lower on the four-hour chart lately.
The last rally reached around 80643 but couldn’t hold there, and prices quickly turned lower. It kept breaking support on the way down, finally bottoming out at 73510, with almost no meaningful bounce along the way.
The price is now back at 74778, recovering some ground from that low, but still well below the previous high.
The key thing to watch here is whether the rebound can hold.
If the price just inches higher on declining volume, touches a moving average, then turns back down, that would be a continuation of the downtrend, and 73510 would need to hold again. If it climbs back above the moving average on strong volume, then this leg down may have paused for now, and we can see whether it can make up more ground.
If 73510 breaks again, there won’t be any meaningful support below, and the decline could continue.
I’m in no rush to act. Trying to catch a bounce during a downtrend is like catching a falling knife—nine times out of ten, you get cut. Waiting for the four-hour chart to show that prices have stabilized feels safer than trying to guess the bottom.
The chart shows Bitcoin’s four-hour closing prices, with the key levels marked. Take a look for yourself.
——————————————
Thanks for following, and feel free to share your observations and thoughts in the comments. I’ll continue sharing chart notes and market observations for reference.
1
74
·
--
For the past couple of weeks, gold has been grinding sideways within a range on the four-hour chart.
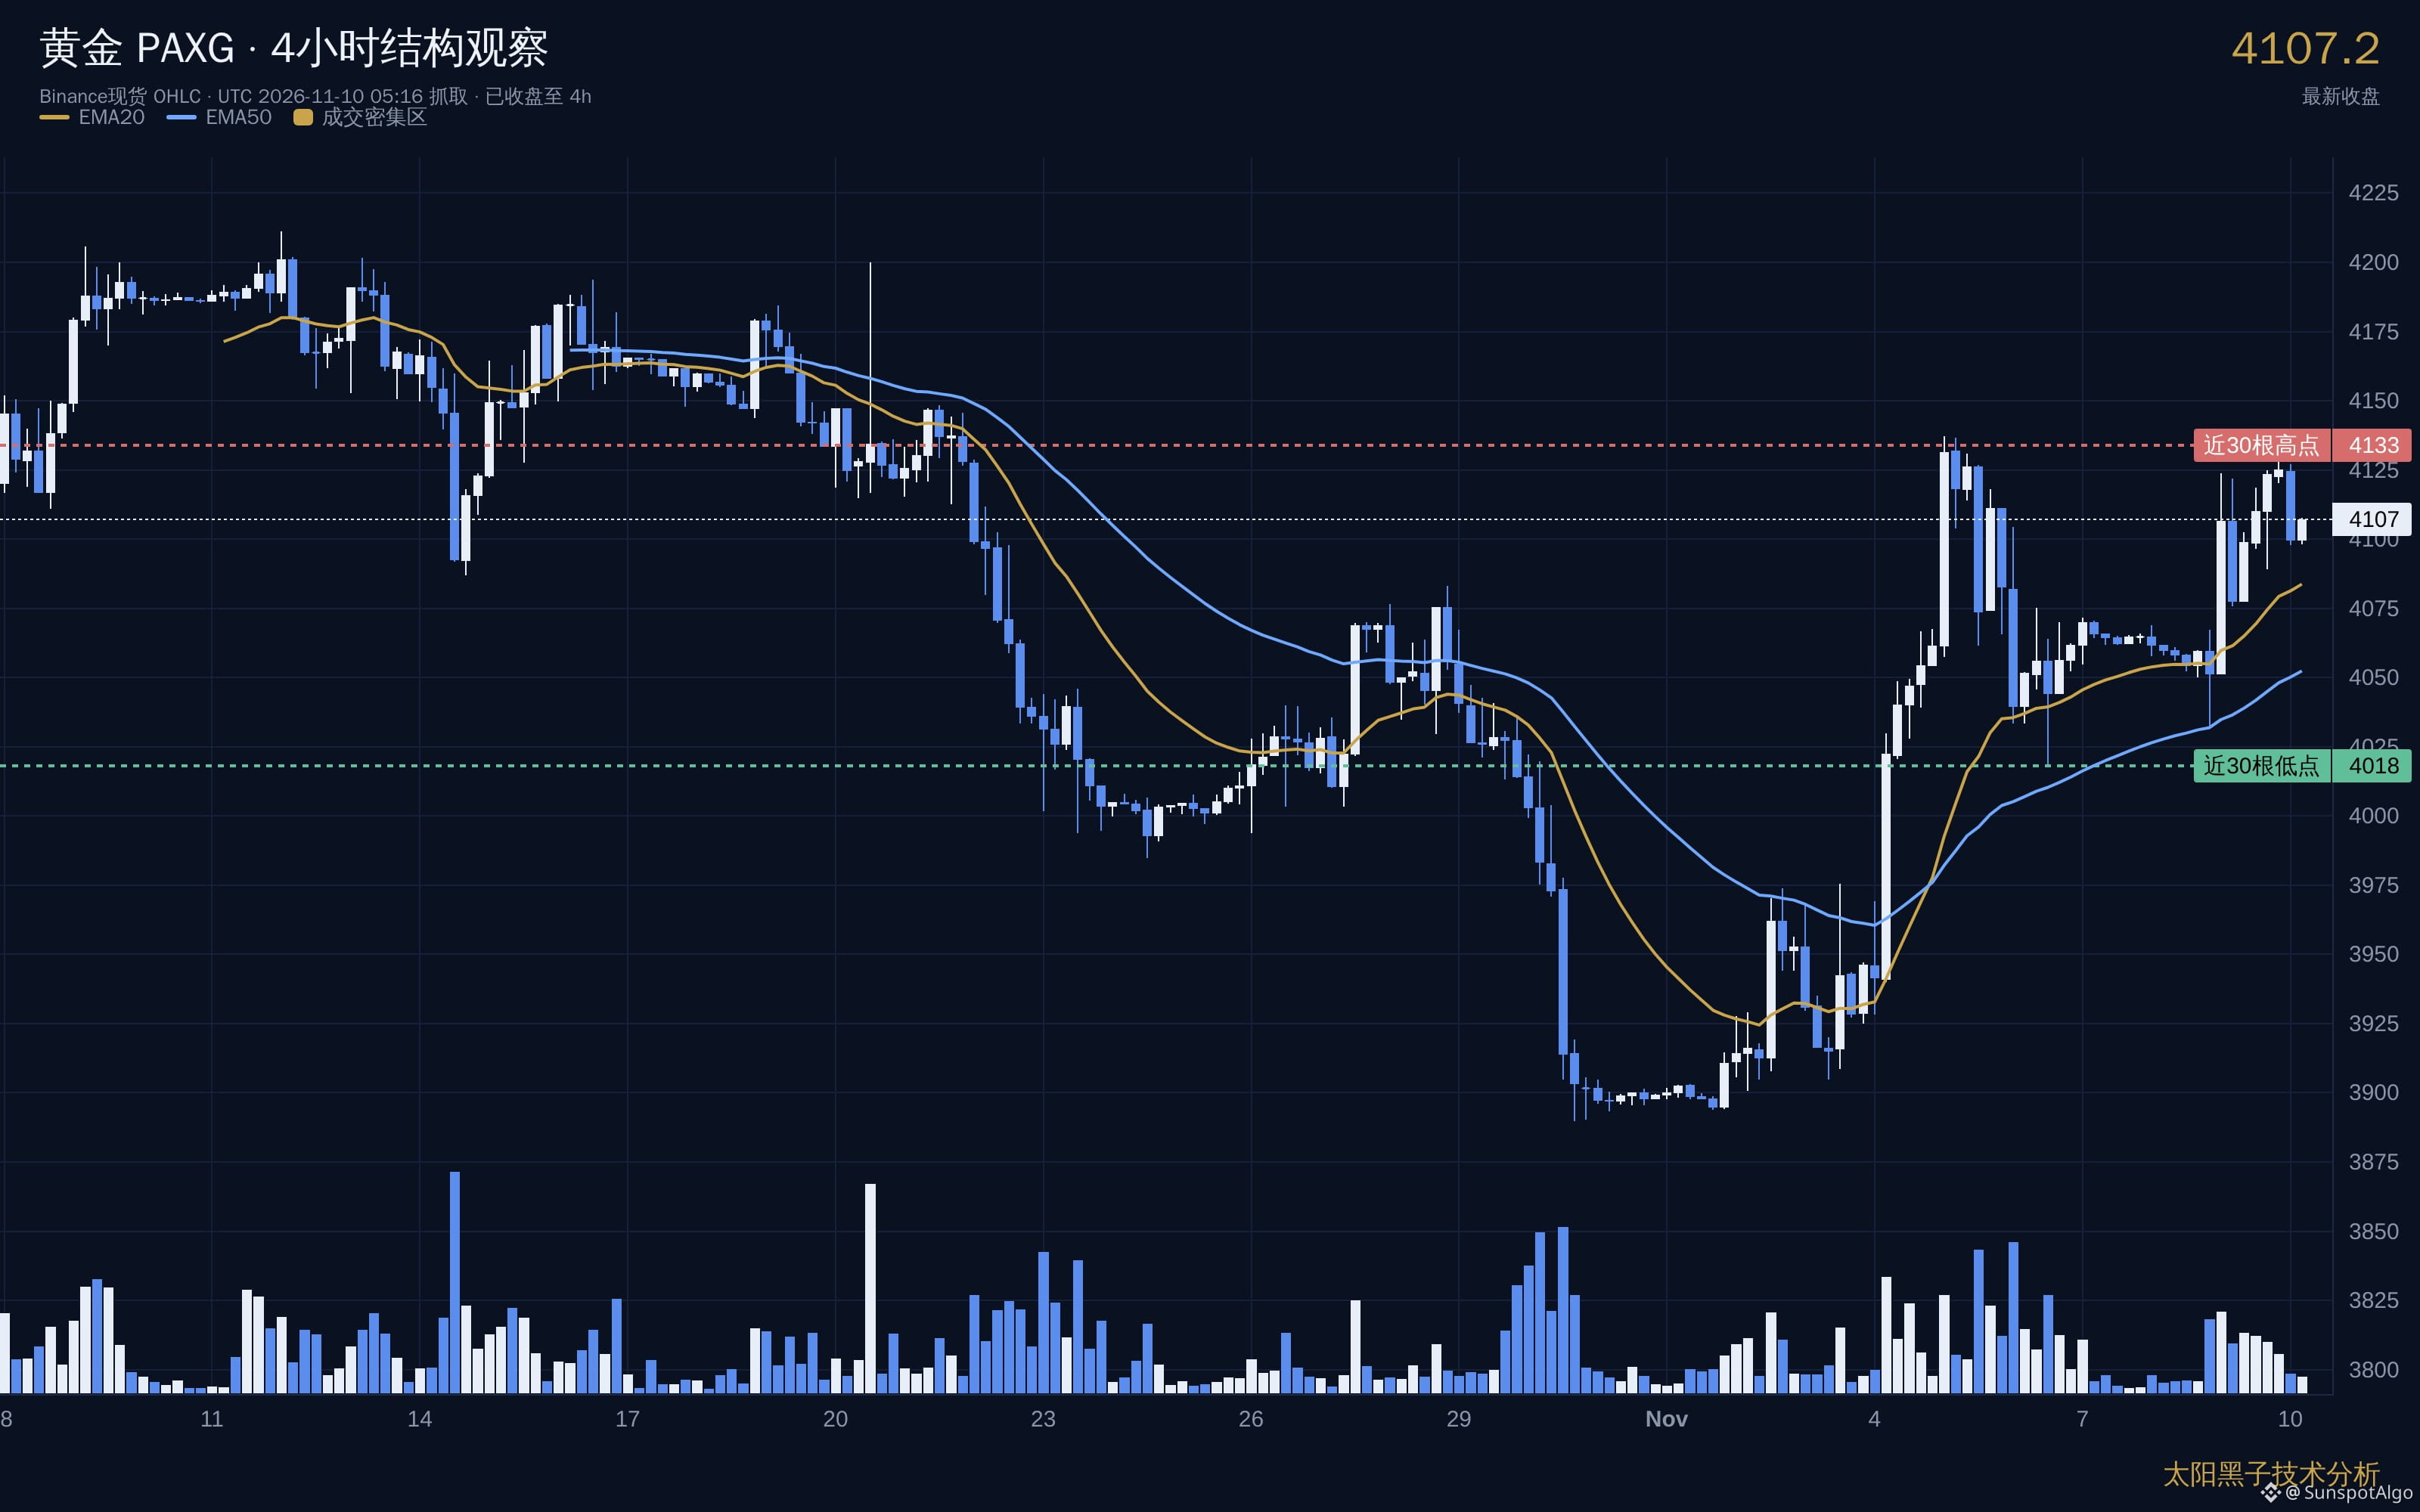
The upper boundary is 4134, and the lower boundary is 4018. Price has moved back and forth between them for more than a dozen candles—neither breaking higher nor falling lower, just churning around.
Today’s four-hour candle looks a little different.
Price lifted from near the lower boundary and climbed back above 4100 in one go. But the rally only reached 4130 before pulling back, just short of the upper boundary. It didn’t close above it, so the range remains intact.
What’s worth watching is volume.
On the recent moves higher, volume has expanded along with price rather than shrinking. That’s different from the previous bounces off the lower boundary, which all came on declining volume. This time, the move is backed by volume, suggesting real buying interest below.
So the outlook from here is simple.
4134 is the hurdle. If a four-hour candle closes above it, the range will have broken to the upside, and the next thing to watch is how price behaves as it moves toward new highs. If it can’t get above that level, it will keep churning inside the range, with 4018 at the lower boundary still holding.
A break below 4018 is where you really need to be cautious. There’s a gap between that level and the previous high-volume trading area below, with no support in between if price falls into it.
I’m in no rush to act. Until the range breaks, any directional call is just a guess. It’s more reassuring to wait for the four-hour close to give us an answer than to place a bet early.
The chart shows gold on the four-hour timeframe at the close, with all the key levels marked. Take a look for yourself.
——————————————
Thanks for following, and feel free to share your observations and thoughts in the comments. I’ll continue sharing chart notes and market observations for your reference.
For the past couple of weeks, gold has been grinding sideways within a range on the four-hour chart.
The upper boundary is 4134, and the lower boundary is 4018. Price has moved back and forth between them for more than a dozen candles—neither breaking higher nor falling lower, just churning around.
Today’s four-hour candle looks a little different.
Price lifted from near the lower boundary and climbed back above 4100 in one go. But the rally only reached 4130 before pulling back, just short of the upper boundary. It didn’t close above it, so the range remains intact.
What’s worth watching is volume.
On the recent moves higher, volume has expanded along with price rather than shrinking. That’s different from the previous bounces off the lower boundary, which all came on declining volume. This time, the move is backed by volume, suggesting real buying interest below.
So the outlook from here is simple.
4134 is the hurdle. If a four-hour candle closes above it, the range will have broken to the upside, and the next thing to watch is how price behaves as it moves toward new highs. If it can’t get above that level, it will keep churning inside the range, with 4018 at the lower boundary still holding.
A break below 4018 is where you really need to be cautious. There’s a gap between that level and the previous high-volume trading area below, with no support in between if price falls into it.
I’m in no rush to act. Until the range breaks, any directional call is just a guess. It’s more reassuring to wait for the four-hour close to give us an answer than to place a bet early.
The chart shows gold on the four-hour timeframe at the close, with all the key levels marked. Take a look for yourself.
——————————————
Thanks for following, and feel free to share your observations and thoughts in the comments. I’ll continue sharing chart notes and market observations for your reference.
The upper boundary is 4134, and the lower boundary is 4018. Price has moved back and forth between them for more than a dozen candles—neither breaking higher nor falling lower, just churning around.
Today’s four-hour candle looks a little different.
Price lifted from near the lower boundary and climbed back above 4100 in one go. But the rally only reached 4130 before pulling back, just short of the upper boundary. It didn’t close above it, so the range remains intact.
What’s worth watching is volume.
On the recent moves higher, volume has expanded along with price rather than shrinking. That’s different from the previous bounces off the lower boundary, which all came on declining volume. This time, the move is backed by volume, suggesting real buying interest below.
So the outlook from here is simple.
4134 is the hurdle. If a four-hour candle closes above it, the range will have broken to the upside, and the next thing to watch is how price behaves as it moves toward new highs. If it can’t get above that level, it will keep churning inside the range, with 4018 at the lower boundary still holding.
A break below 4018 is where you really need to be cautious. There’s a gap between that level and the previous high-volume trading area below, with no support in between if price falls into it.
I’m in no rush to act. Until the range breaks, any directional call is just a guess. It’s more reassuring to wait for the four-hour close to give us an answer than to place a bet early.
The chart shows gold on the four-hour timeframe at the close, with all the key levels marked. Take a look for yourself.
——————————————
Thanks for following, and feel free to share your observations and thoughts in the comments. I’ll continue sharing chart notes and market observations for your reference.
221
·
--
#AMZN $AMZN 🔴 AMZN-4-hour-countertrend short
• Live price: 267.91
• Signal type: MIX reversal signal
• Instrument: Amazon stock
Sunspot trading signal @ 12:00:31
#AMZN $AMZN 🔴 AMZN-4-hour-countertrend short
• Live price: 267.91
• Signal type: MIX reversal signal
• Instrument: Amazon stock
Sunspot trading signal @ 12:00:31
• Live price: 267.91
• Signal type: MIX reversal signal
• Instrument: Amazon stock
Sunspot trading signal @ 12:00:31
8
·
--
#比特币连续五周下跌 $BTC After five straight weeks of declines, half the people on the forum are saying this is a deep correction in a bull market, while the other half say the trend has changed. I’m inclined to treat it as inconclusive for now. A weekly close below the long-term moving average only shows that prices have been trending lower over the past five weeks; it doesn’t tell us what the next five weeks will bring.
There are only two things worth watching. Can we recover half of last week’s losses this week? If not, it means sellers are still in control. And is volume shrinking or growing during the decline? A slow slide on shrinking volume and a breakdown on rising volume are two different situations: one means there are no buyers stepping in; the other means someone is actively selling.
The only thing I’m sure of is that I don’t know where the bottom is. So I won’t try to call it. I’ll just watch for a signal in the price structure—if one appears, I’ll follow it; if not, I’ll wait.
I’ll write down the invalidation condition too. If prices move back above the long-term moving average this week and hold there, this bearish assessment is invalidated. There’s no need to come up with excuses to explain it away.
#比特币连续五周下跌 $BTC After five straight weeks of declines, half the people on the forum are saying this is a deep correction in a bull market, while the other half say the trend has changed. I’m inclined to treat it as inconclusive for now. A weekly close below the long-term moving average only shows that prices have been trending lower over the past five weeks; it doesn’t tell us what the next five weeks will bring.
There are only two things worth watching. Can we recover half of last week’s losses this week? If not, it means sellers are still in control. And is volume shrinking or growing during the decline? A slow slide on shrinking volume and a breakdown on rising volume are two different situations: one means there are no buyers stepping in; the other means someone is actively selling.
The only thing I’m sure of is that I don’t know where the bottom is. So I won’t try to call it. I’ll just watch for a signal in the price structure—if one appears, I’ll follow it; if not, I’ll wait.
I’ll write down the invalidation condition too. If prices move back above the long-term moving average this week and hold there, this bearish assessment is invalidated. There’s no need to come up with excuses to explain it away.
There are only two things worth watching. Can we recover half of last week’s losses this week? If not, it means sellers are still in control. And is volume shrinking or growing during the decline? A slow slide on shrinking volume and a breakdown on rising volume are two different situations: one means there are no buyers stepping in; the other means someone is actively selling.
The only thing I’m sure of is that I don’t know where the bottom is. So I won’t try to call it. I’ll just watch for a signal in the price structure—if one appears, I’ll follow it; if not, I’ll wait.
I’ll write down the invalidation condition too. If prices move back above the long-term moving average this week and hold there, this bearish assessment is invalidated. There’s no need to come up with excuses to explain it away.
1
1
3.6k
·
--
🟢 BTC - 4-hour - Countertrend Long
• Real-time price: 75500.0
• Signal type: MIX reversal signal
• Instrument: Bitcoin futures
Sunspot Trading Signal @ 00:00:03
🟢 BTC - 4-hour - Countertrend Long
• Real-time price: 75500.0
• Signal type: MIX reversal signal
• Instrument: Bitcoin futures
Sunspot Trading Signal @ 00:00:03
• Real-time price: 75500.0
• Signal type: MIX reversal signal
• Instrument: Bitcoin futures
Sunspot Trading Signal @ 00:00:03
21
·
--
🟢 MSTR-4-hour-countertrend long
• Real-time price: 129.13
• Signal type: MIX reversal signal
• Instrument: MicroStrategy stock
Sunspot trading signal @ 00:00:01
🟢 MSTR-4-hour-countertrend long
• Real-time price: 129.13
• Signal type: MIX reversal signal
• Instrument: MicroStrategy stock
Sunspot trading signal @ 00:00:01
• Real-time price: 129.13
• Signal type: MIX reversal signal
• Instrument: MicroStrategy stock
Sunspot trading signal @ 00:00:01
6
·
--
The weekly candle closed below the 50-week moving average for the first time since early September.
I see this as a test of the level, not a verdict on the trend. Three reasons: five straight weeks of declines, but this week’s drop was only a little over 4%, so the pace is slowing; the weekend wick dipped lower, but the price recovered within two hours; and the sentiment indicator entered the fear zone, so those who were going to panic have already panicked.
The uncertainty is trading volume. A breakdown on high volume and one on low volume are two very different things. I haven’t finished analyzing this week’s volume, so I’m not calling a direction yet.
Here’s what would invalidate this view: if the price doesn’t close back above the moving average within a week, this assessment is void. I’ll then look to the lower end of the range, and treat the preceding rally as resistance. $BTC
The weekly candle closed below the 50-week moving average for the first time since early September.
I see this as a test of the level, not a verdict on the trend. Three reasons: five straight weeks of declines, but this week’s drop was only a little over 4%, so the pace is slowing; the weekend wick dipped lower, but the price recovered within two hours; and the sentiment indicator entered the fear zone, so those who were going to panic have already panicked.
The uncertainty is trading volume. A breakdown on high volume and one on low volume are two very different things. I haven’t finished analyzing this week’s volume, so I’m not calling a direction yet.
Here’s what would invalidate this view: if the price doesn’t close back above the moving average within a week, this assessment is void. I’ll then look to the lower end of the range, and treat the preceding rally as resistance. $BTC
I see this as a test of the level, not a verdict on the trend. Three reasons: five straight weeks of declines, but this week’s drop was only a little over 4%, so the pace is slowing; the weekend wick dipped lower, but the price recovered within two hours; and the sentiment indicator entered the fear zone, so those who were going to panic have already panicked.
The uncertainty is trading volume. A breakdown on high volume and one on low volume are two very different things. I haven’t finished analyzing this week’s volume, so I’m not calling a direction yet.
Here’s what would invalidate this view: if the price doesn’t close back above the moving average within a week, this assessment is void. I’ll then look to the lower end of the range, and treat the preceding rally as resistance. $BTC
193
·
--
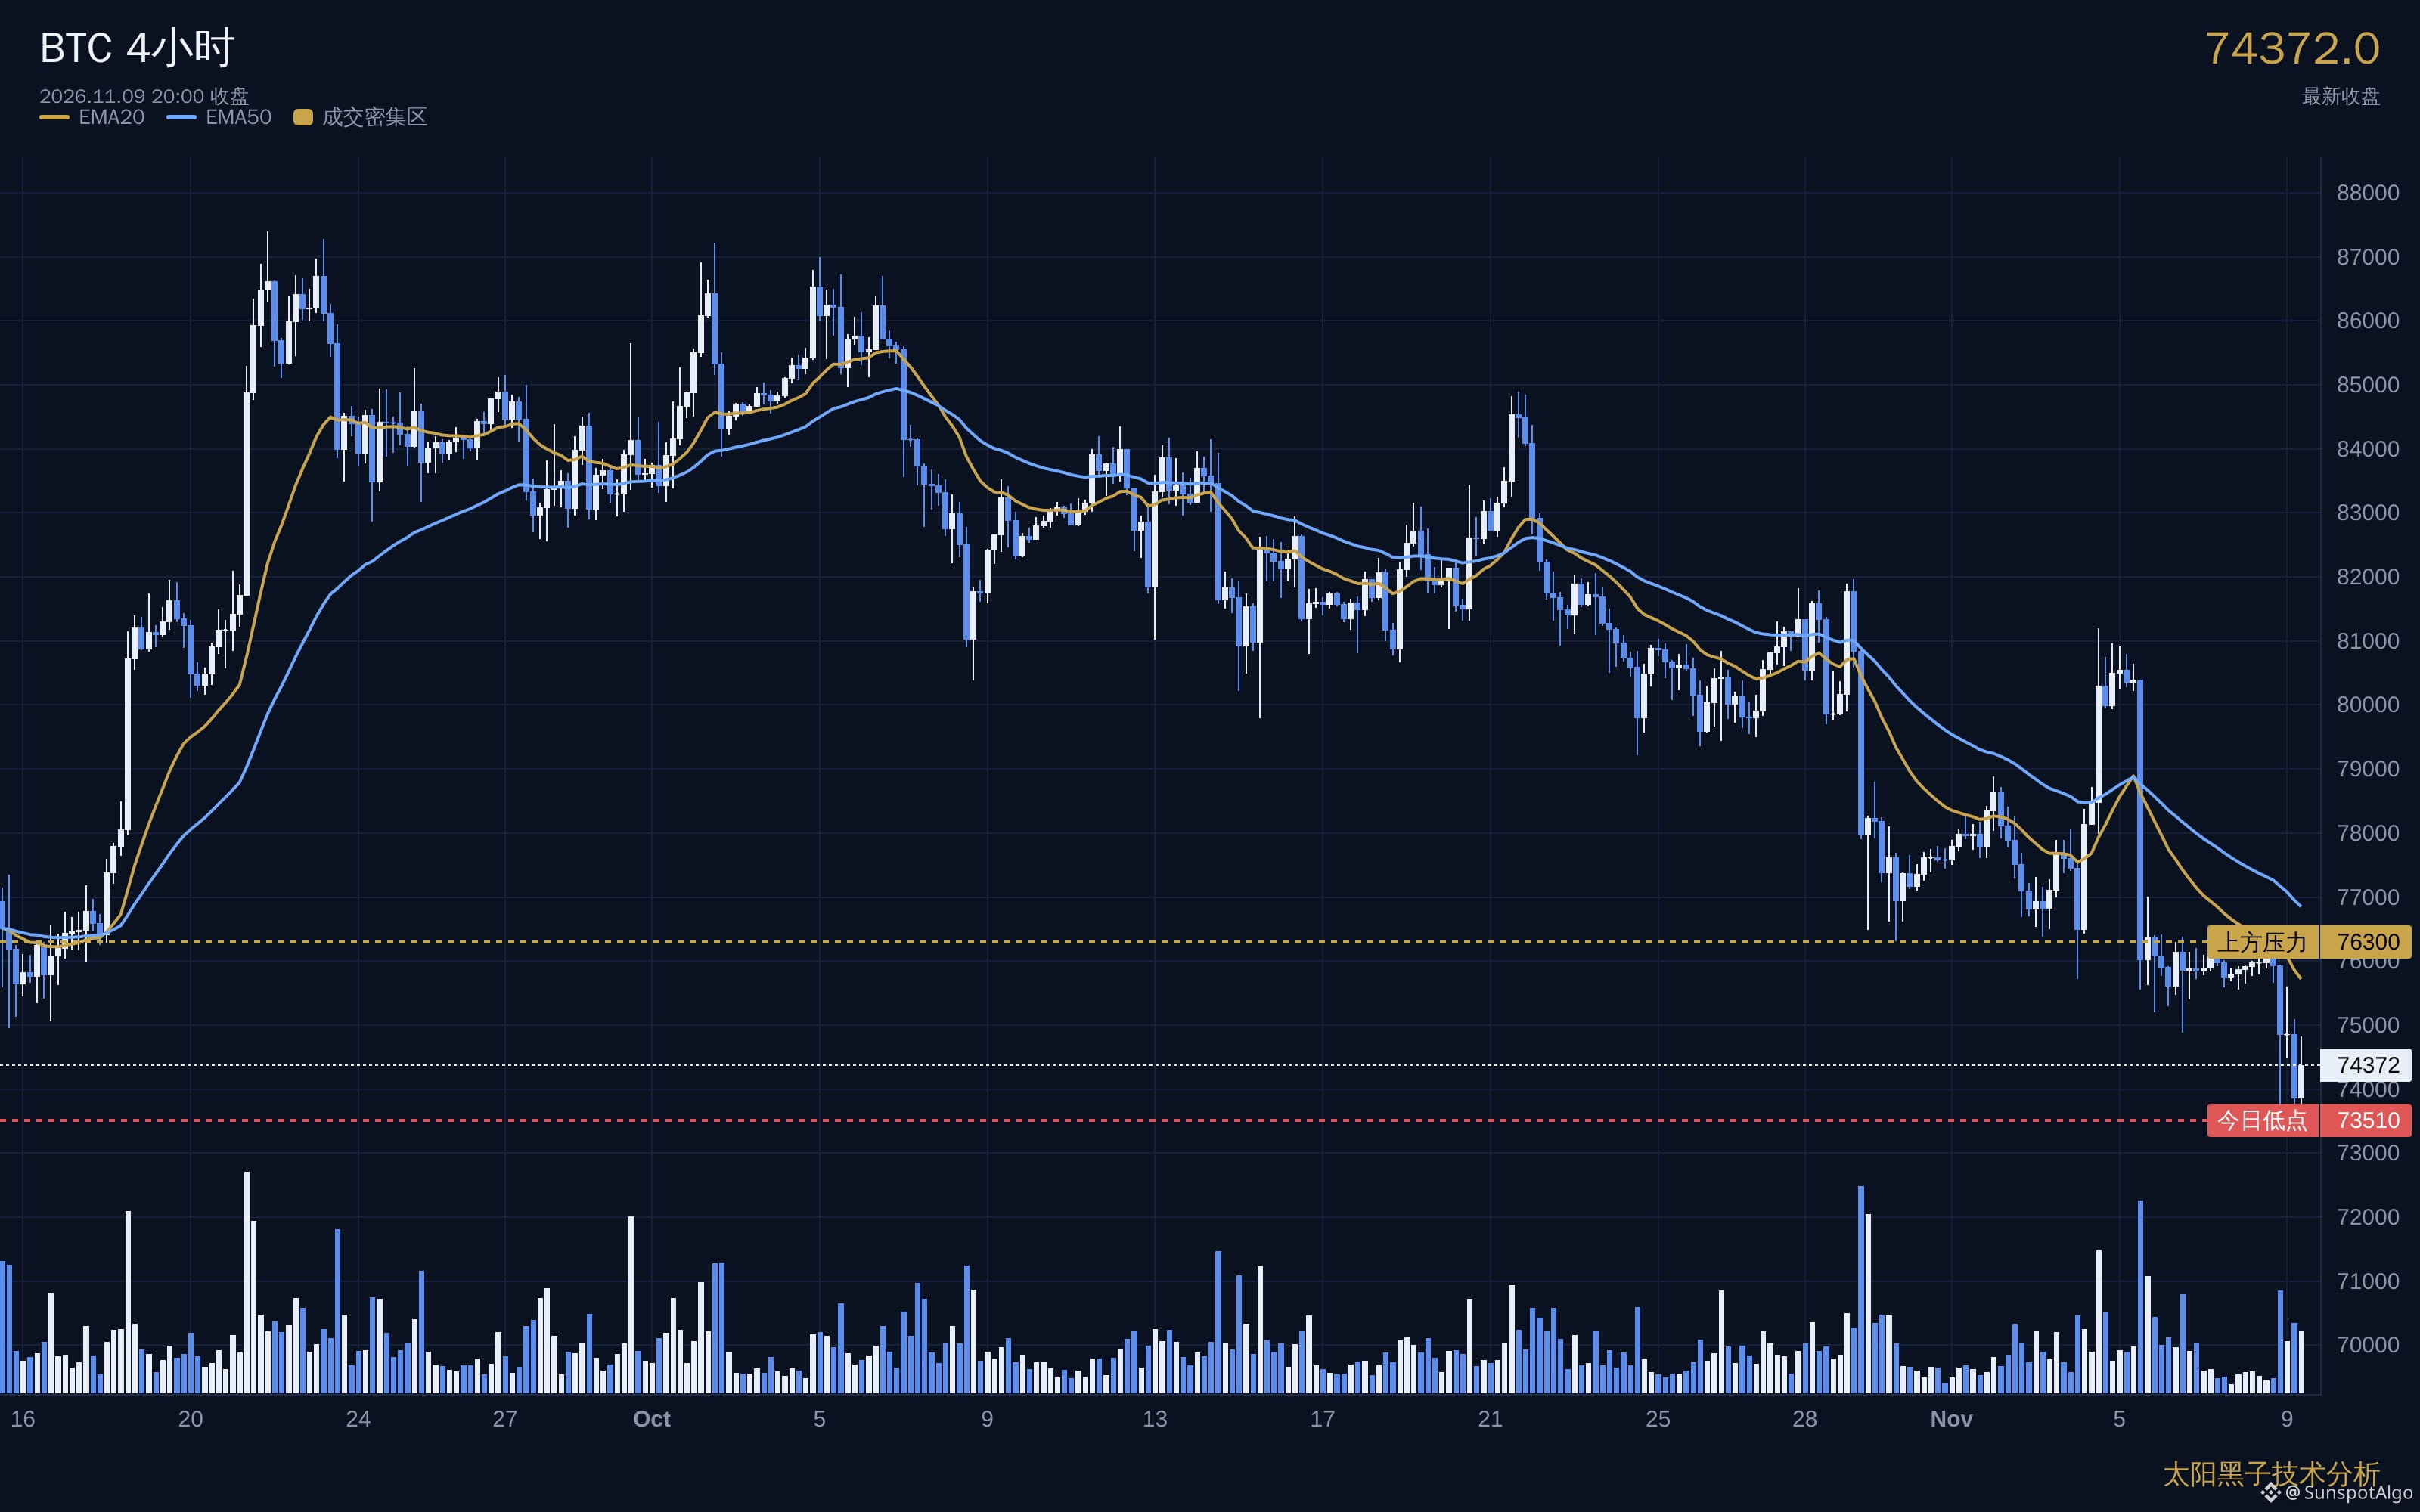
That four-hour candle in the early hours broke through a range that had held for more than two months.
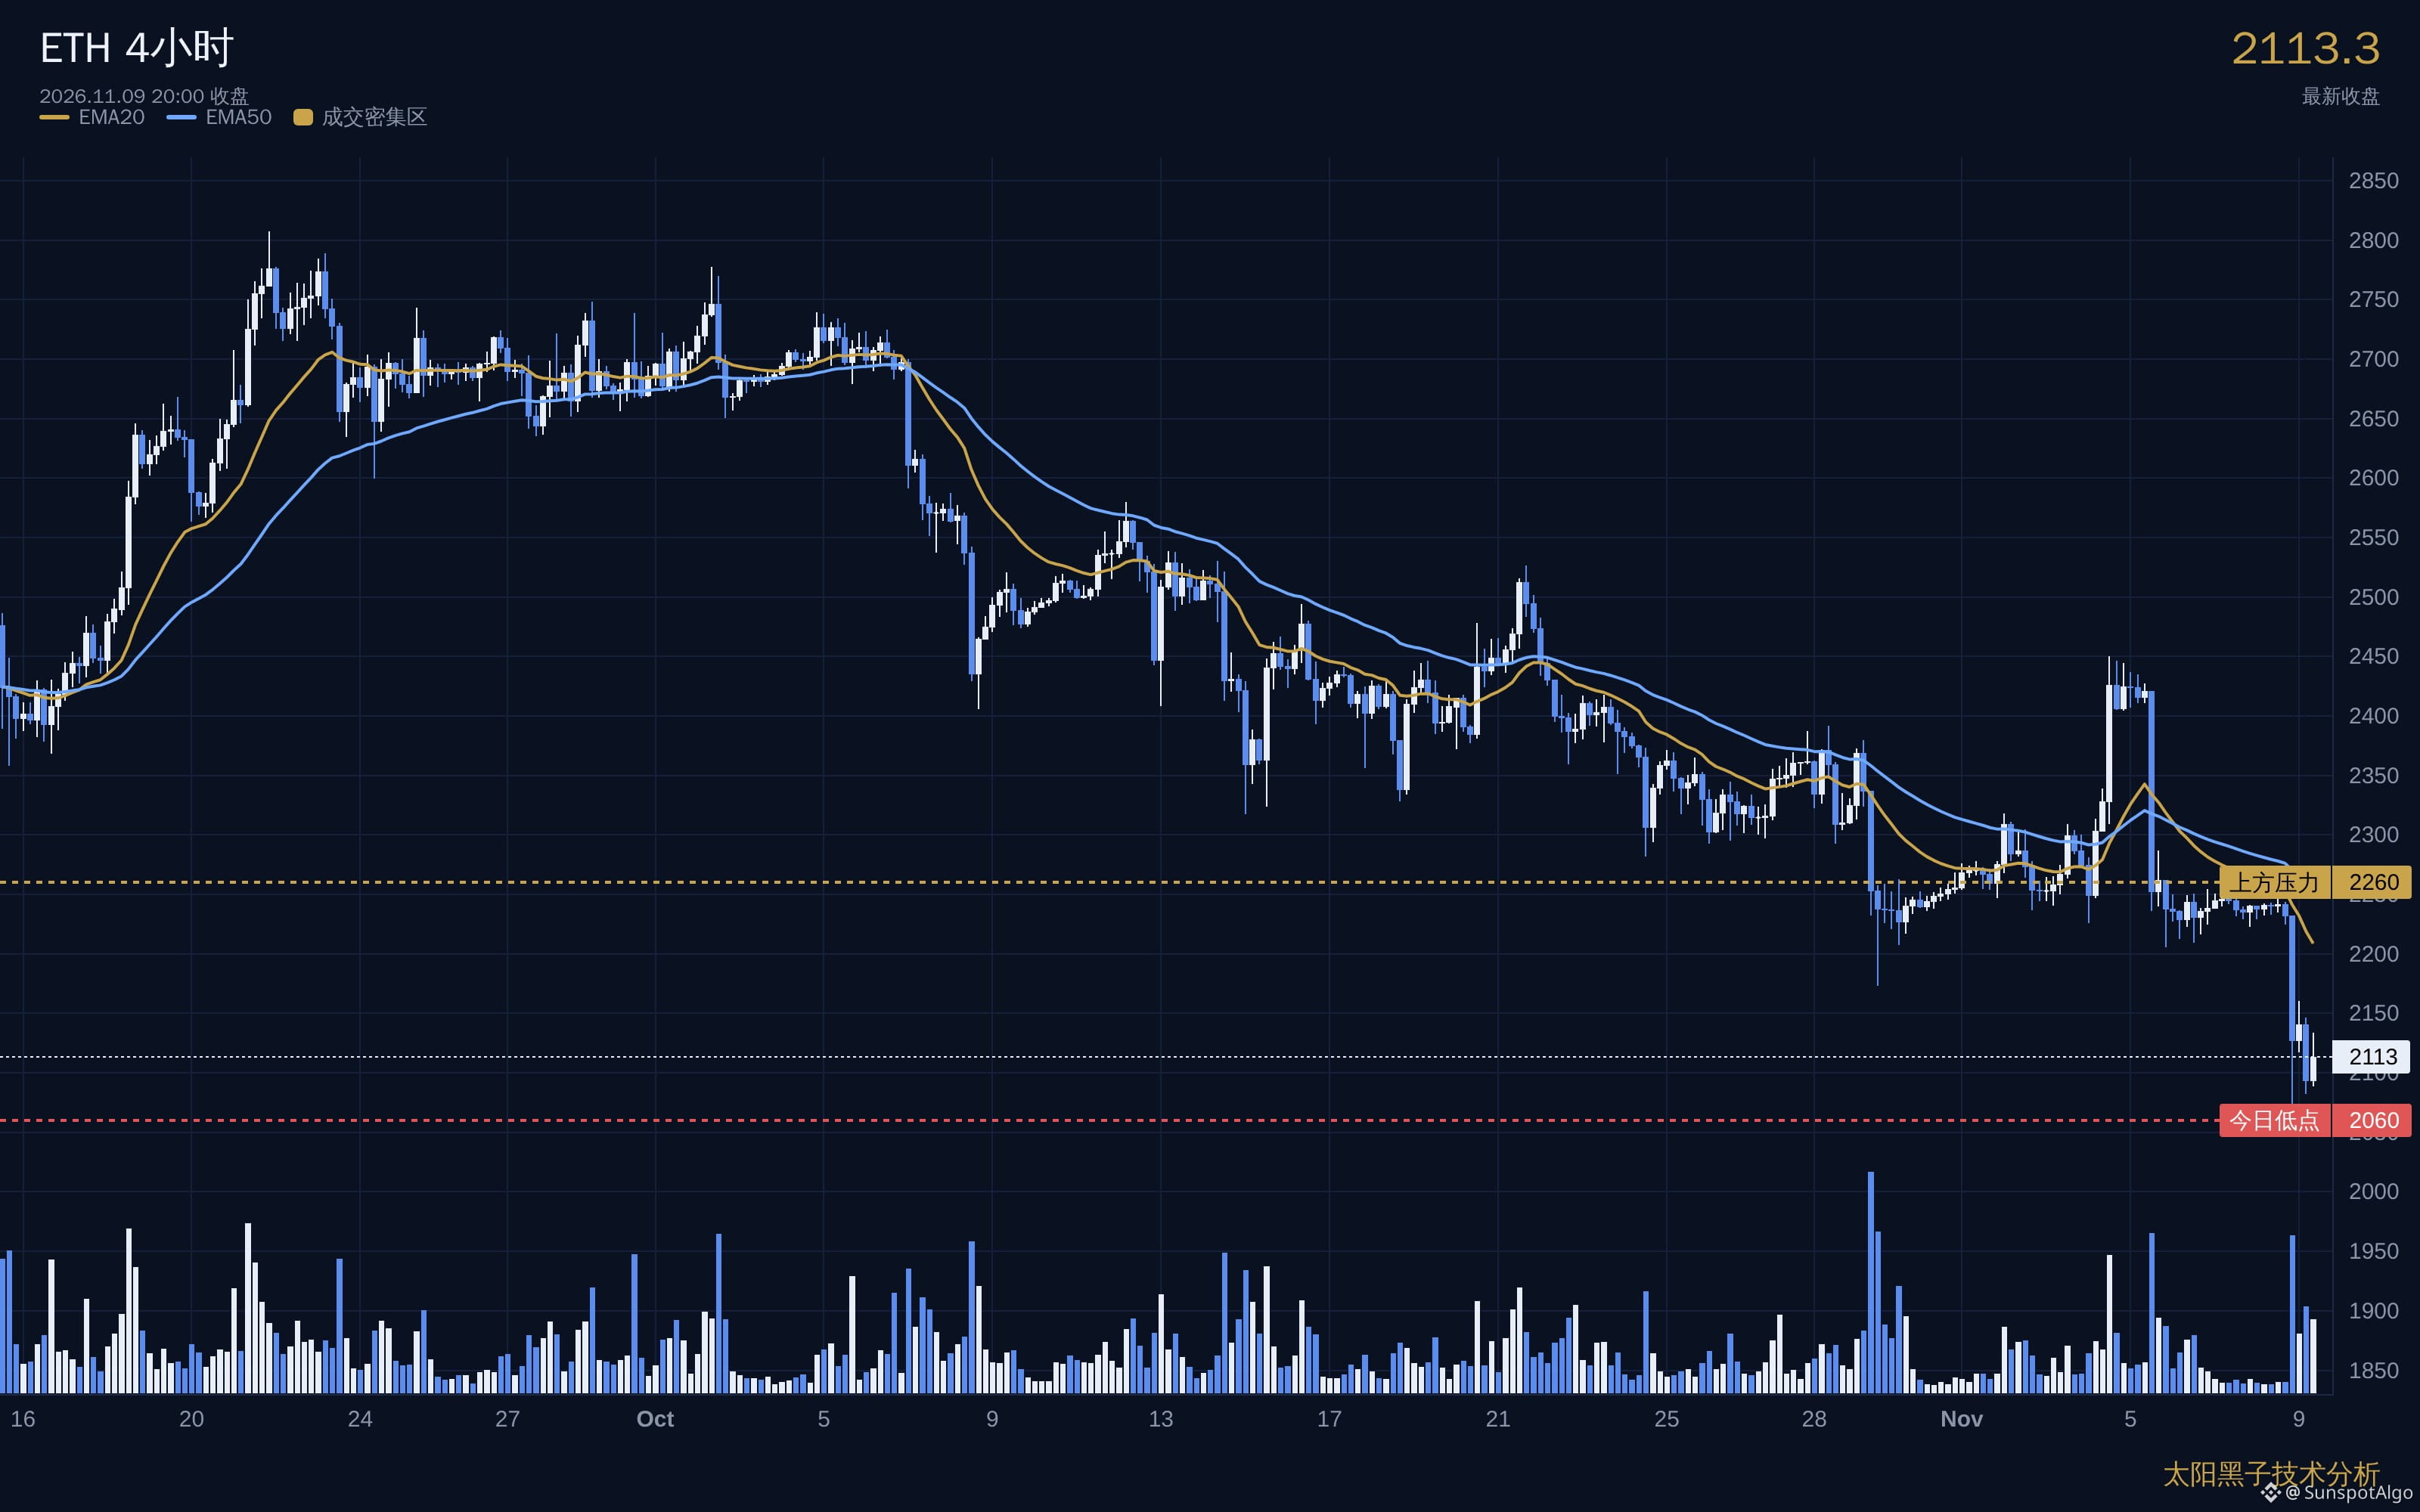
BTC plunged straight to 73,500, with volume twice the average of the previous 20 candles. ETH was even more decisive: one candle dropped more than 7% intraday, on volume 4.5 times higher.
The fact that they fell at different speeds matters more than the drop itself.
Measured from their respective highs, BTC is down less than 15%, while ETH is down nearly 25%. If this were rotation, with money moving from ETH into BTC, BTC should be rising while ETH falls. Today they both went down, and ETH fell harder. This isn’t rotation. Someone is pulling money out; BTC is just retreating more slowly.
After a breakdown, the question is whether the rebound can reclaim the level.
BTC bounced to 75,600, which looked like a recovery, but not one of the next four closes held above 75,000. An intraday move above the level doesn’t count; a close above it does.
Then there’s volume. The breakdown candle had twice the average volume, and the next three candles didn’t fall back below average either. This isn’t one candle’s worth of selling pressure—it’s the kind that can keep going.
The downside levels are also fairly straightforward.
Below BTC’s breakdown point and down to the June–July low, there’s almost no volume support. If it really drops into that area, there’s nothing in between to catch it.
ETH is in a tougher spot. The September low was lost long ago, and today’s low is the last line of defense. Meaningful volume only appears below 2,000; the area in between is empty, with little support if price falls.
My move today is to do nothing.
I didn’t chase the rebound or short the drop. On the day of a breakdown, it’s easy to get stopped out on either side: chase the short, and one snapback can take you out; buy the dip, and there’s still room to fall. I’ll wait for the four-hour close to give me an answer—if it closes below the breakdown point, I’ll treat this move as continuing downward; if it closes back above, I’ll consider it a false alarm.
I size my positions for the worst-case scenario. If I’m wrong, I don’t add or average down. That’s the only part I can control.
Here are today’s two closing charts, with the key levels marked. Take a look for yourself.
——————————————
Thanks for following, and feel free to share your observations and ideas in the comments. I’ll continue sharing chart notes and market observations for everyone’s reference.
That four-hour candle in the early hours broke through a range that had held for more than two months.
BTC plunged straight to 73,500, with volume twice the average of the previous 20 candles. ETH was even more decisive: one candle dropped more than 7% intraday, on volume 4.5 times higher.
The fact that they fell at different speeds matters more than the drop itself.
Measured from their respective highs, BTC is down less than 15%, while ETH is down nearly 25%. If this were rotation, with money moving from ETH into BTC, BTC should be rising while ETH falls. Today they both went down, and ETH fell harder. This isn’t rotation. Someone is pulling money out; BTC is just retreating more slowly.
After a breakdown, the question is whether the rebound can reclaim the level.
BTC bounced to 75,600, which looked like a recovery, but not one of the next four closes held above 75,000. An intraday move above the level doesn’t count; a close above it does.
Then there’s volume. The breakdown candle had twice the average volume, and the next three candles didn’t fall back below average either. This isn’t one candle’s worth of selling pressure—it’s the kind that can keep going.
The downside levels are also fairly straightforward.
Below BTC’s breakdown point and down to the June–July low, there’s almost no volume support. If it really drops into that area, there’s nothing in between to catch it.
ETH is in a tougher spot. The September low was lost long ago, and today’s low is the last line of defense. Meaningful volume only appears below 2,000; the area in between is empty, with little support if price falls.
My move today is to do nothing.
I didn’t chase the rebound or short the drop. On the day of a breakdown, it’s easy to get stopped out on either side: chase the short, and one snapback can take you out; buy the dip, and there’s still room to fall. I’ll wait for the four-hour close to give me an answer—if it closes below the breakdown point, I’ll treat this move as continuing downward; if it closes back above, I’ll consider it a false alarm.
I size my positions for the worst-case scenario. If I’m wrong, I don’t add or average down. That’s the only part I can control.
Here are today’s two closing charts, with the key levels marked. Take a look for yourself.
——————————————
Thanks for following, and feel free to share your observations and ideas in the comments. I’ll continue sharing chart notes and market observations for everyone’s reference.
BTC plunged straight to 73,500, with volume twice the average of the previous 20 candles. ETH was even more decisive: one candle dropped more than 7% intraday, on volume 4.5 times higher.
The fact that they fell at different speeds matters more than the drop itself.
Measured from their respective highs, BTC is down less than 15%, while ETH is down nearly 25%. If this were rotation, with money moving from ETH into BTC, BTC should be rising while ETH falls. Today they both went down, and ETH fell harder. This isn’t rotation. Someone is pulling money out; BTC is just retreating more slowly.
After a breakdown, the question is whether the rebound can reclaim the level.
BTC bounced to 75,600, which looked like a recovery, but not one of the next four closes held above 75,000. An intraday move above the level doesn’t count; a close above it does.
Then there’s volume. The breakdown candle had twice the average volume, and the next three candles didn’t fall back below average either. This isn’t one candle’s worth of selling pressure—it’s the kind that can keep going.
The downside levels are also fairly straightforward.
Below BTC’s breakdown point and down to the June–July low, there’s almost no volume support. If it really drops into that area, there’s nothing in between to catch it.
ETH is in a tougher spot. The September low was lost long ago, and today’s low is the last line of defense. Meaningful volume only appears below 2,000; the area in between is empty, with little support if price falls.
My move today is to do nothing.
I didn’t chase the rebound or short the drop. On the day of a breakdown, it’s easy to get stopped out on either side: chase the short, and one snapback can take you out; buy the dip, and there’s still room to fall. I’ll wait for the four-hour close to give me an answer—if it closes below the breakdown point, I’ll treat this move as continuing downward; if it closes back above, I’ll consider it a false alarm.
I size my positions for the worst-case scenario. If I’m wrong, I don’t add or average down. That’s the only part I can control.
Here are today’s two closing charts, with the key levels marked. Take a look for yourself.
——————————————
Thanks for following, and feel free to share your observations and ideas in the comments. I’ll continue sharing chart notes and market observations for everyone’s reference.
290
·
--
🔴 CL-4-hour trend-following short
• Real-time price: 89.88
• Signal type: MIX trend signal
• Instrument information: Crude oil contract
Sunspot Trading Signal @ 16:00:06
🔴 CL-4-hour trend-following short
• Real-time price: 89.88
• Signal type: MIX trend signal
• Instrument information: Crude oil contract
Sunspot Trading Signal @ 16:00:06
• Real-time price: 89.88
• Signal type: MIX trend signal
• Instrument information: Crude oil contract
Sunspot Trading Signal @ 16:00:06
20
·
--
🔴 QQQ-4-hour - Trend-following short
• Real-time price: 651.11
• Signal type: MIX trend signal
• Instrument: Nasdaq-100 ETF
Sunspot Trading Signal @ 16:00:04
🔴 QQQ-4-hour - Trend-following short
• Real-time price: 651.11
• Signal type: MIX trend signal
• Instrument: Nasdaq-100 ETF
Sunspot Trading Signal @ 16:00:04
• Real-time price: 651.11
• Signal type: MIX trend signal
• Instrument: Nasdaq-100 ETF
Sunspot Trading Signal @ 16:00:04
85
Log in to explore more content
Join global crypto users on Binance Square
⚡️ Get latest and useful information about crypto.
💬 Trusted by the world’s largest crypto exchange.
👍 Discover real insights from verified creators.
Email / Phone number
Trending Topics
HotCPIDecemberHikePriced
40,579 views
758 Discussing
CPI Market Watch | US CPI Rises 0.4% in October, Hotter Than 0.3% Forecast
Binance News
·19 Likes
·35.7k views
AnthropicRejectsIPODelayValuationinQuestion
175,625 views
1,586 Discussing
NvidiaInvestigatesAfterHuang’sAffairApology
448,668 views
3,051 Discussing