#Bitcoin
Bitcoin has been stepping lower on the four-hour chart lately.
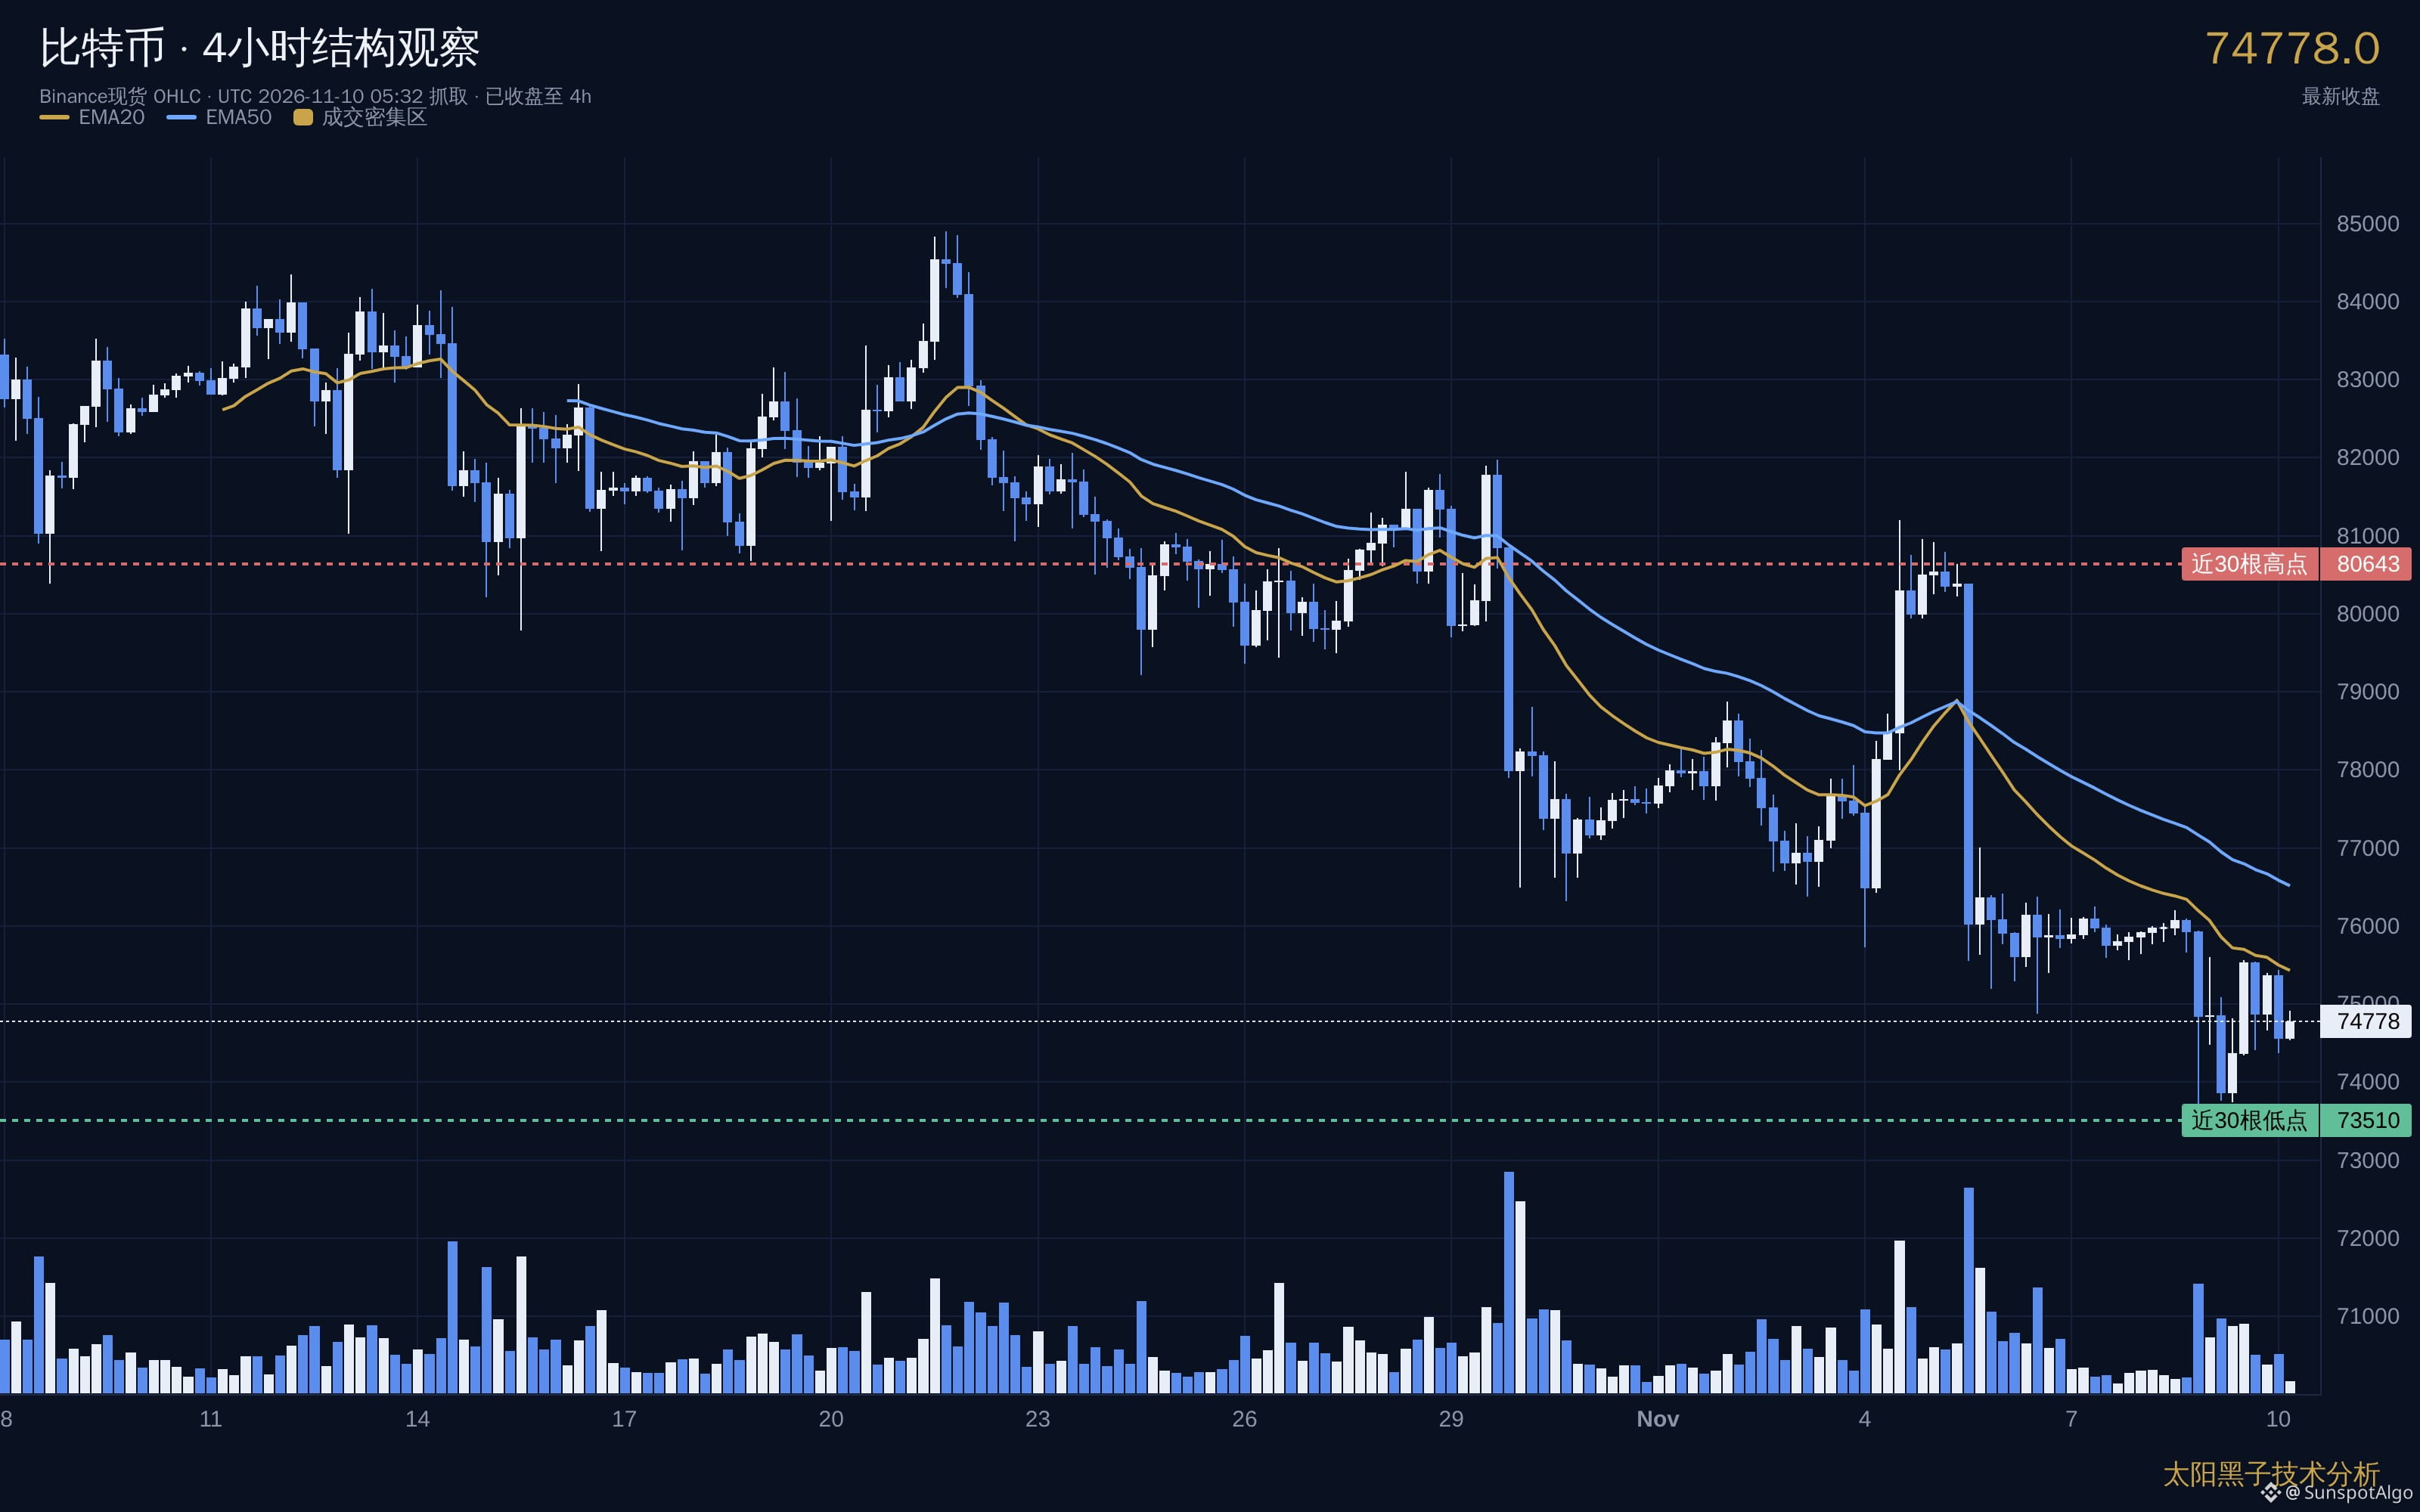
The last rally reached around 80643 but couldn’t hold there, and prices quickly turned lower. It kept breaking support on the way down, finally bottoming out at 73510, with almost no meaningful bounce along the way.
The price is now back at 74778, recovering some ground from that low, but still well below the previous high.
The key thing to watch here is whether the rebound can hold.
If the price just inches higher on declining volume, touches a moving average, then turns back down, that would be a continuation of the downtrend, and 73510 would need to hold again. If it climbs back above the moving average on strong volume, then this leg down may have paused for now, and we can see whether it can make up more ground.
If 73510 breaks again, there won’t be any meaningful support below, and the decline could continue.
I’m in no rush to act. Trying to catch a bounce during a downtrend is like catching a falling knife—nine times out of ten, you get cut. Waiting for the four-hour chart to show that prices have stabilized feels safer than trying to guess the bottom.
The chart shows Bitcoin’s four-hour closing prices, with the key levels marked. Take a look for yourself.
——————————————
Thanks for following, and feel free to share your observations and thoughts in the comments. I’ll continue sharing chart notes and market observations for reference.
Bitcoin has been stepping lower on the four-hour chart lately.
The last rally reached around 80643 but couldn’t hold there, and prices quickly turned lower. It kept breaking support on the way down, finally bottoming out at 73510, with almost no meaningful bounce along the way.
The price is now back at 74778, recovering some ground from that low, but still well below the previous high.
The key thing to watch here is whether the rebound can hold.
If the price just inches higher on declining volume, touches a moving average, then turns back down, that would be a continuation of the downtrend, and 73510 would need to hold again. If it climbs back above the moving average on strong volume, then this leg down may have paused for now, and we can see whether it can make up more ground.
If 73510 breaks again, there won’t be any meaningful support below, and the decline could continue.
I’m in no rush to act. Trying to catch a bounce during a downtrend is like catching a falling knife—nine times out of ten, you get cut. Waiting for the four-hour chart to show that prices have stabilized feels safer than trying to guess the bottom.
The chart shows Bitcoin’s four-hour closing prices, with the key levels marked. Take a look for yourself.
——————————————
Thanks for following, and feel free to share your observations and thoughts in the comments. I’ll continue sharing chart notes and market observations for reference.