For the past couple of weeks, gold has been grinding sideways within a range on the four-hour chart.
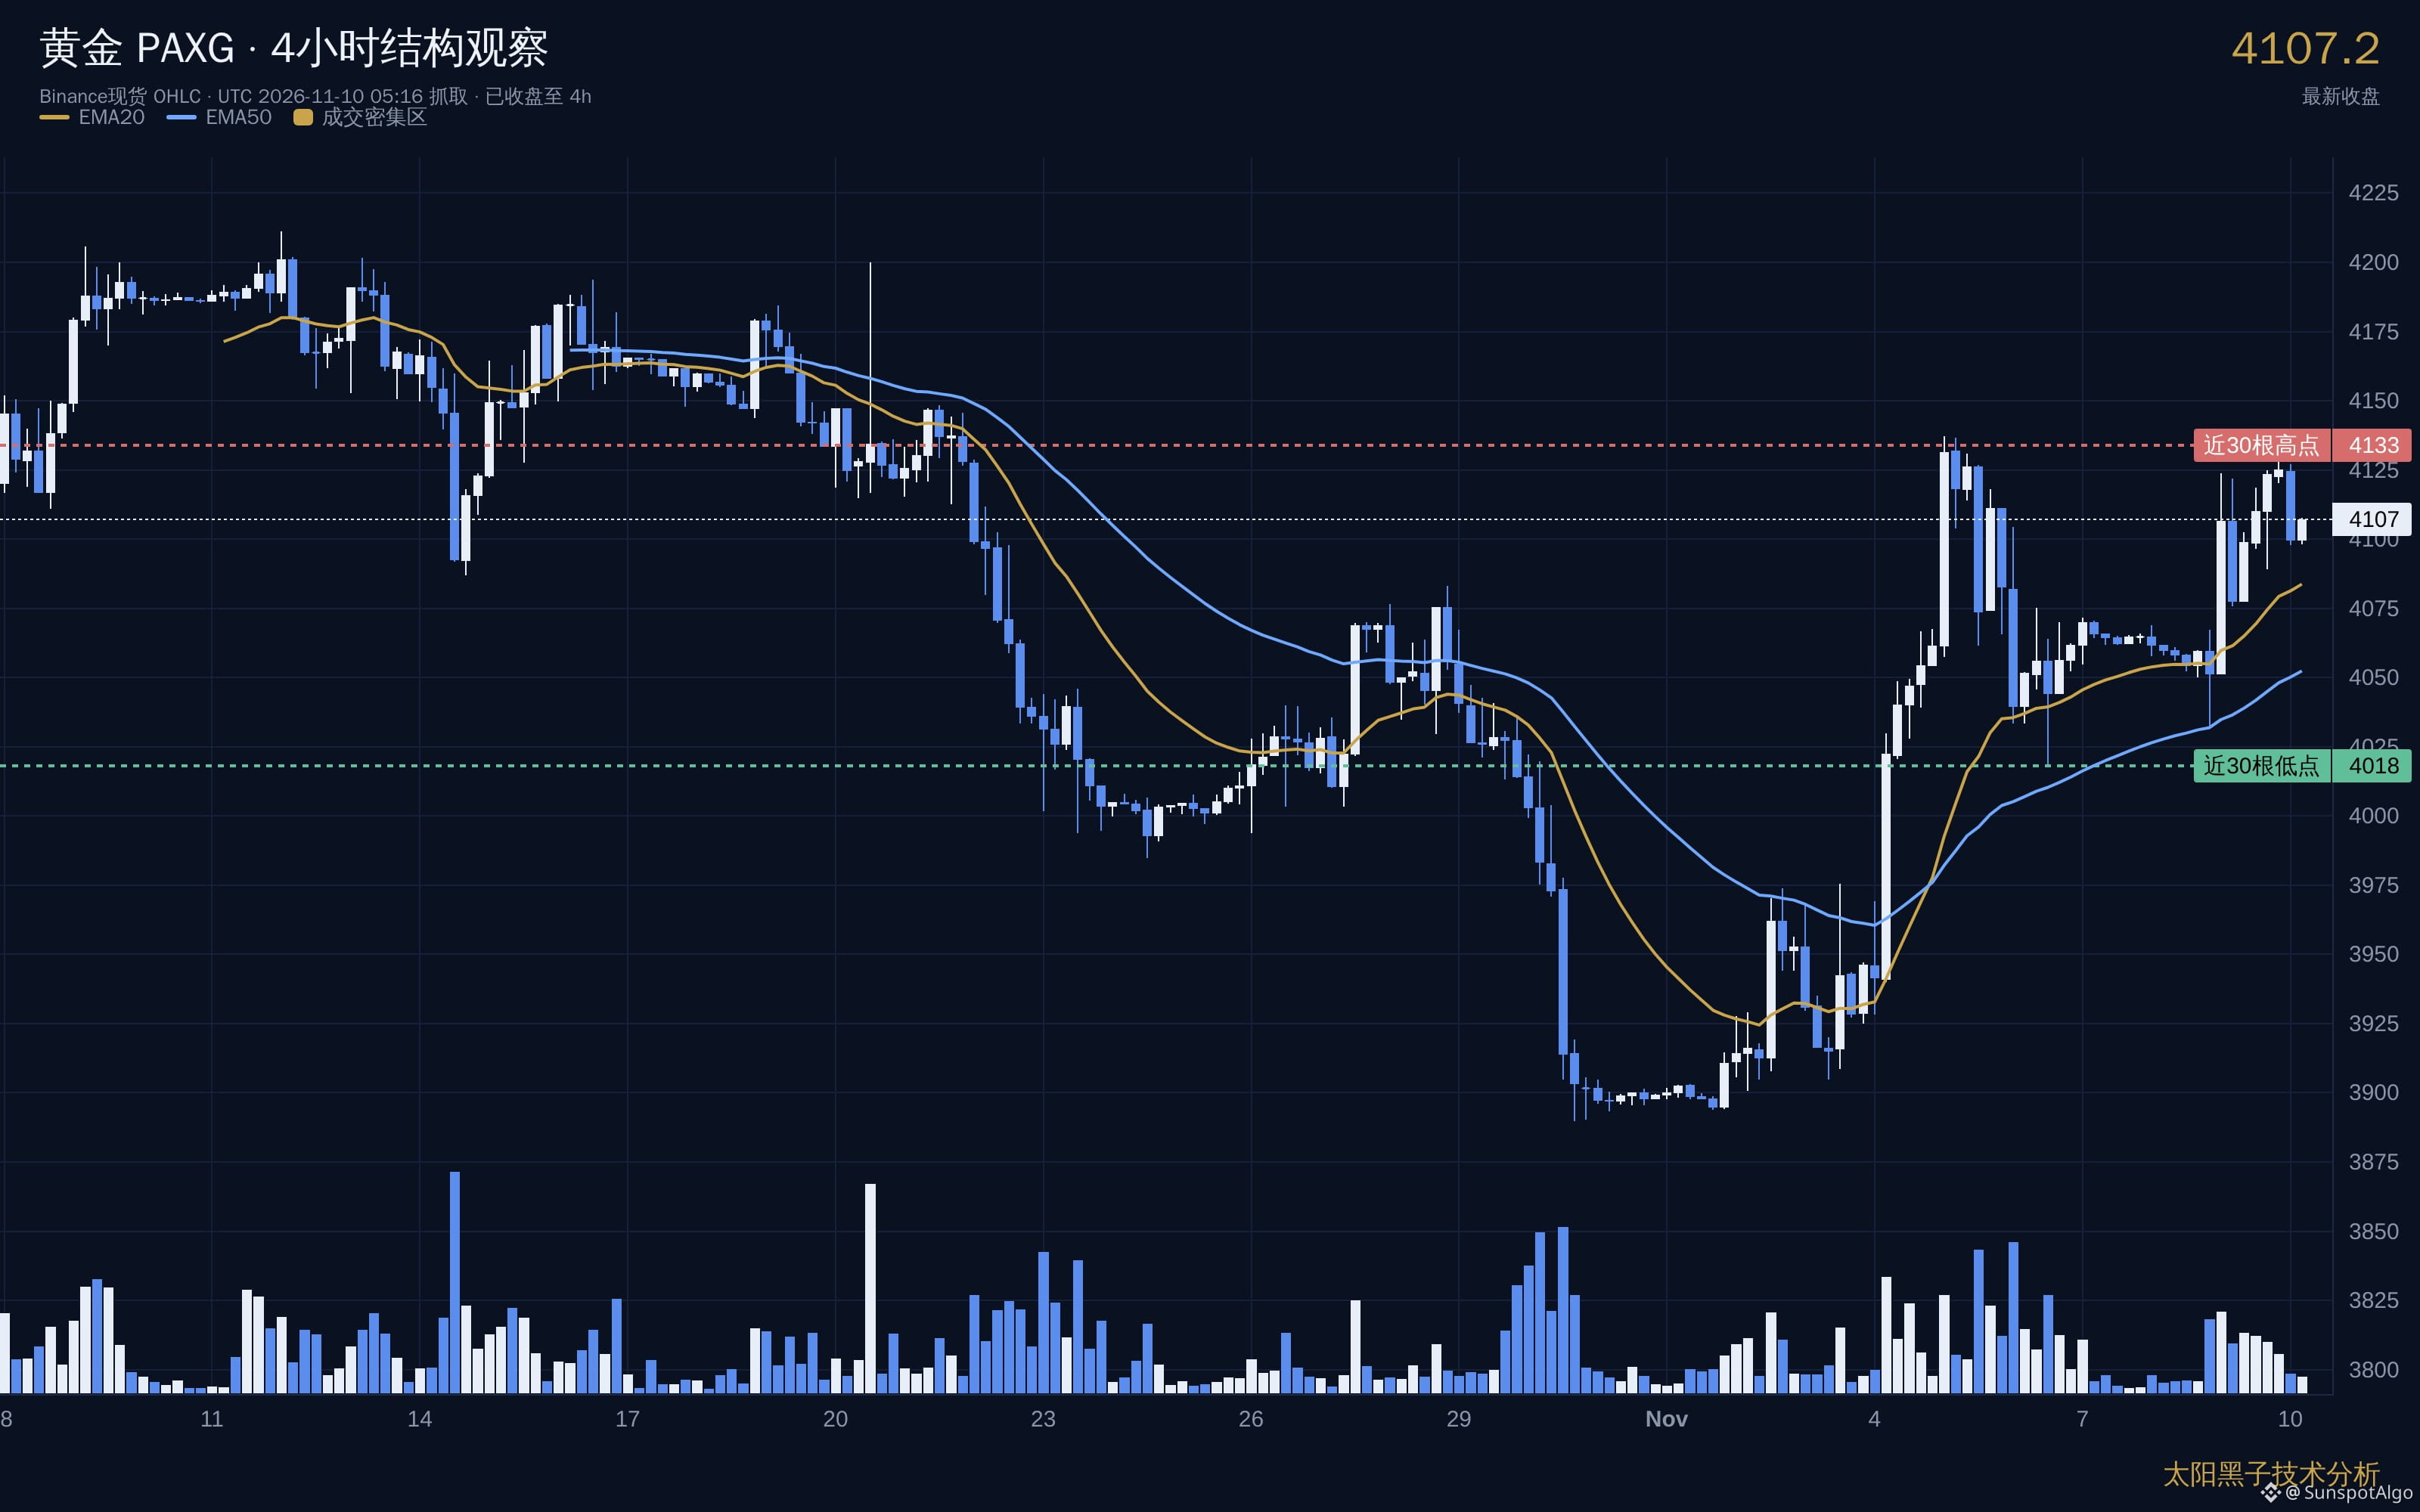
The upper boundary is 4134, and the lower boundary is 4018. Price has moved back and forth between them for more than a dozen candles—neither breaking higher nor falling lower, just churning around.
Today’s four-hour candle looks a little different.
Price lifted from near the lower boundary and climbed back above 4100 in one go. But the rally only reached 4130 before pulling back, just short of the upper boundary. It didn’t close above it, so the range remains intact.
What’s worth watching is volume.
On the recent moves higher, volume has expanded along with price rather than shrinking. That’s different from the previous bounces off the lower boundary, which all came on declining volume. This time, the move is backed by volume, suggesting real buying interest below.
So the outlook from here is simple.
4134 is the hurdle. If a four-hour candle closes above it, the range will have broken to the upside, and the next thing to watch is how price behaves as it moves toward new highs. If it can’t get above that level, it will keep churning inside the range, with 4018 at the lower boundary still holding.
A break below 4018 is where you really need to be cautious. There’s a gap between that level and the previous high-volume trading area below, with no support in between if price falls into it.
I’m in no rush to act. Until the range breaks, any directional call is just a guess. It’s more reassuring to wait for the four-hour close to give us an answer than to place a bet early.
The chart shows gold on the four-hour timeframe at the close, with all the key levels marked. Take a look for yourself.
——————————————
Thanks for following, and feel free to share your observations and thoughts in the comments. I’ll continue sharing chart notes and market observations for your reference.
The upper boundary is 4134, and the lower boundary is 4018. Price has moved back and forth between them for more than a dozen candles—neither breaking higher nor falling lower, just churning around.
Today’s four-hour candle looks a little different.
Price lifted from near the lower boundary and climbed back above 4100 in one go. But the rally only reached 4130 before pulling back, just short of the upper boundary. It didn’t close above it, so the range remains intact.
What’s worth watching is volume.
On the recent moves higher, volume has expanded along with price rather than shrinking. That’s different from the previous bounces off the lower boundary, which all came on declining volume. This time, the move is backed by volume, suggesting real buying interest below.
So the outlook from here is simple.
4134 is the hurdle. If a four-hour candle closes above it, the range will have broken to the upside, and the next thing to watch is how price behaves as it moves toward new highs. If it can’t get above that level, it will keep churning inside the range, with 4018 at the lower boundary still holding.
A break below 4018 is where you really need to be cautious. There’s a gap between that level and the previous high-volume trading area below, with no support in between if price falls into it.
I’m in no rush to act. Until the range breaks, any directional call is just a guess. It’s more reassuring to wait for the four-hour close to give us an answer than to place a bet early.
The chart shows gold on the four-hour timeframe at the close, with all the key levels marked. Take a look for yourself.
——————————————
Thanks for following, and feel free to share your observations and thoughts in the comments. I’ll continue sharing chart notes and market observations for your reference.