
Algorithmic Aura
428 Posts

Algorithmic Aura
Report
Block User
Welcome to crypto MAQ ! Your one-stop shop for all things cryptocurrency. Join Crypto MAQ as he breaks down complex crypto concepts, analyzes market trends
Frequent Trader
3.6 Years
12 Following
150 Followers
96 Liked
Posts
All
Quotes
Videos
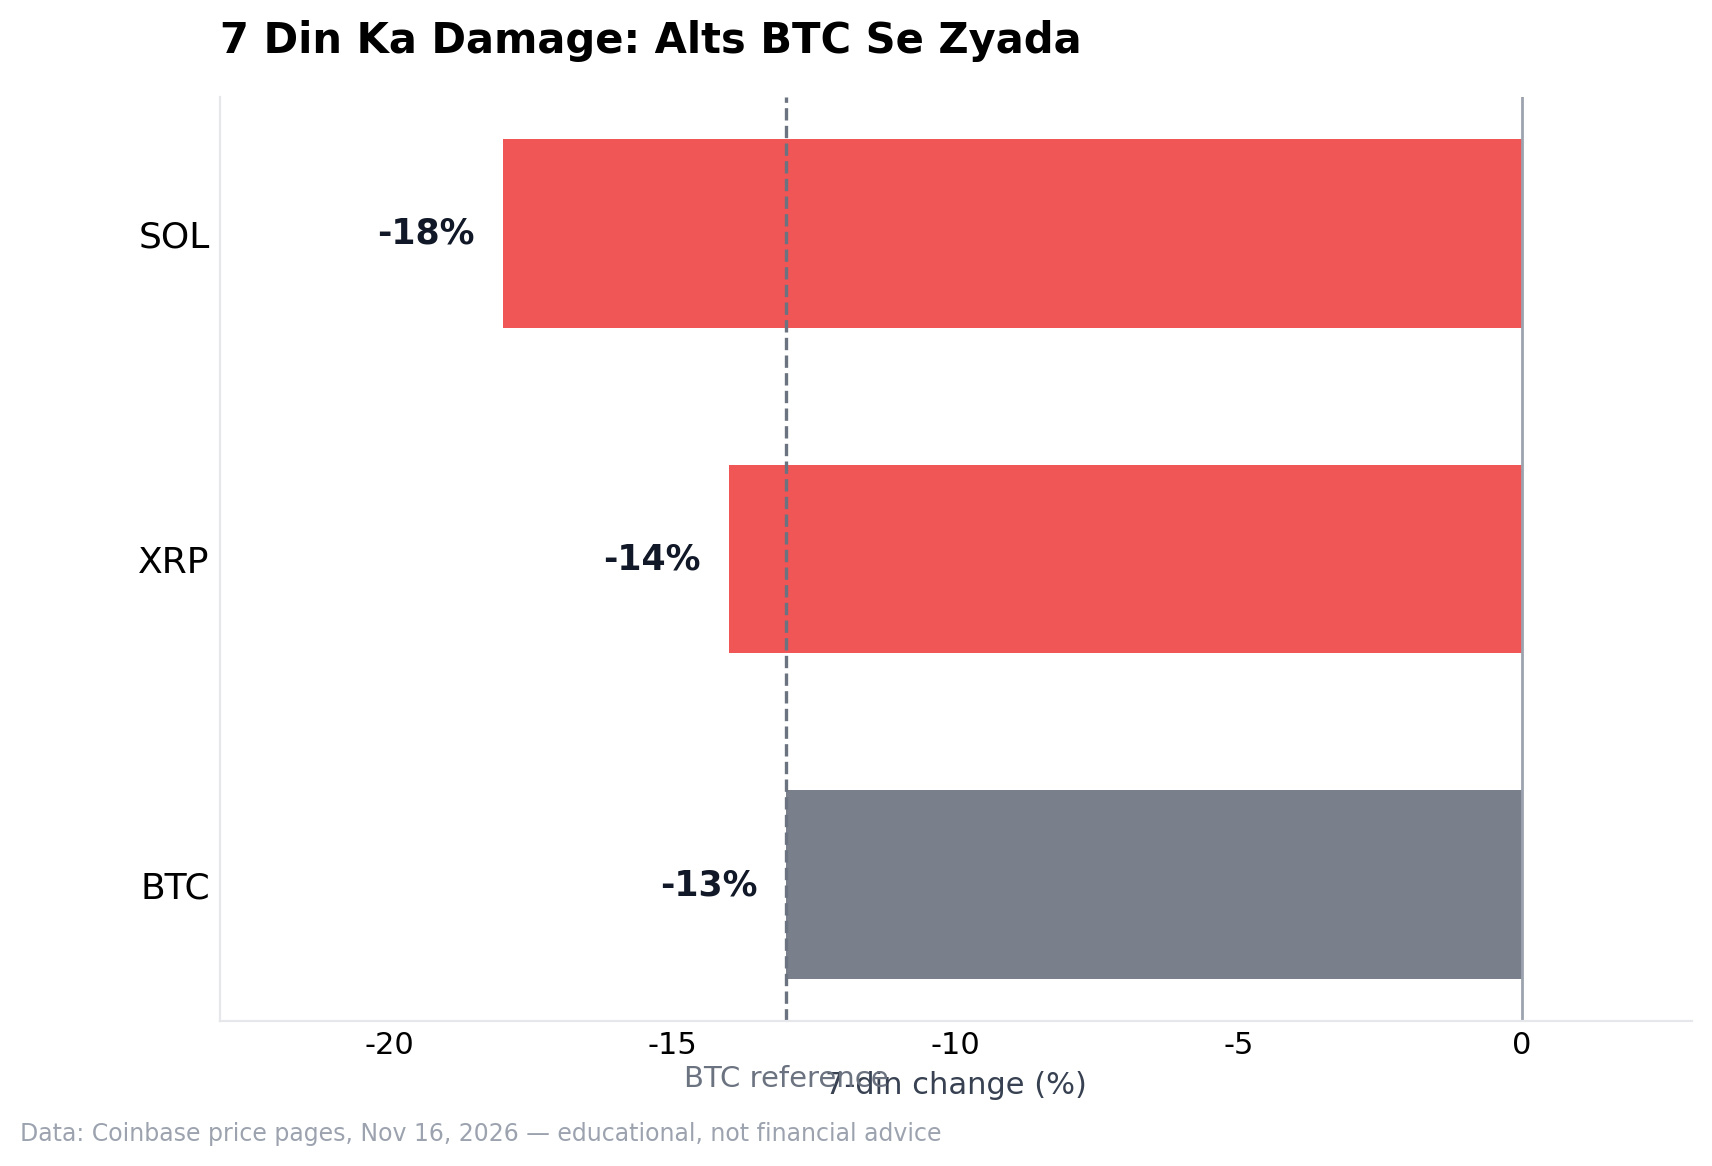
📊 7-day scoreboard — alts are down more than BTC.
1️⃣ BTC: ~-13% for the week (from 74.4K to the 64K zone)
2️⃣ XRP: ~-14% — the $1 round number has now been broken
3️⃣ SOL: ~-18% — the biggest weekly drop among the majors
Alts tend to fall more during downturns — they have a higher risk premium and thinner liquidity, and when markets go risk-off, money flows first toward BTC/USD. This isn’t a sign of weakness; it’s market math.
Scoreboard in the chart. 📉
Data: Coinbase price pages, today. 🔍
$BTC $SOL $XRP
#Altcoins #CryptoNews #MarketUpdate
📊 7-day scoreboard — alts are down more than BTC.
1️⃣ BTC: ~-13% for the week (from 74.4K to the 64K zone)
2️⃣ XRP: ~-14% — the $1 round number has now been broken
3️⃣ SOL: ~-18% — the biggest weekly drop among the majors
Alts tend to fall more during downturns — they have a higher risk premium and thinner liquidity, and when markets go risk-off, money flows first toward BTC/USD. This isn’t a sign of weakness; it’s market math.
Scoreboard in the chart. 📉
Data: Coinbase price pages, today. 🔍
$BTC $SOL $XRP
#Altcoins #CryptoNews #MarketUpdate
1️⃣ BTC: ~-13% for the week (from 74.4K to the 64K zone)
2️⃣ XRP: ~-14% — the $1 round number has now been broken
3️⃣ SOL: ~-18% — the biggest weekly drop among the majors
Alts tend to fall more during downturns — they have a higher risk premium and thinner liquidity, and when markets go risk-off, money flows first toward BTC/USD. This isn’t a sign of weakness; it’s market math.
Scoreboard in the chart. 📉
Data: Coinbase price pages, today. 🔍
$BTC $SOL $XRP
#Altcoins #CryptoNews #MarketUpdate
📋 Copy trading and “VIP signal groups” — straight into scam-risk territory.
1️⃣ Screenshots can lie — profits get cropped, losses get deleted
2️⃣ Anyone who guarantees profits is the biggest red flag of all
3️⃣ Understand the business model: if their system is so profitable, why are they asking you to subscribe? Fees are their real income
If you want to learn: keep your own journal, build your own strategy, and start small. No one else will work for you — they have different incentives. 🚫
Scam awareness is part of protecting your capital. 🛡️
$BTC
#ScamAwareness #CryptoTrading #TradingPsychology
📋 Copy trading and “VIP signal groups” — straight into scam-risk territory.
1️⃣ Screenshots can lie — profits get cropped, losses get deleted
2️⃣ Anyone who guarantees profits is the biggest red flag of all
3️⃣ Understand the business model: if their system is so profitable, why are they asking you to subscribe? Fees are their real income
If you want to learn: keep your own journal, build your own strategy, and start small. No one else will work for you — they have different incentives. 🚫
Scam awareness is part of protecting your capital. 🛡️
$BTC
#ScamAwareness #CryptoTrading #TradingPsychology
1️⃣ Screenshots can lie — profits get cropped, losses get deleted
2️⃣ Anyone who guarantees profits is the biggest red flag of all
3️⃣ Understand the business model: if their system is so profitable, why are they asking you to subscribe? Fees are their real income
If you want to learn: keep your own journal, build your own strategy, and start small. No one else will work for you — they have different incentives. 🚫
Scam awareness is part of protecting your capital. 🛡️
$BTC
#ScamAwareness #CryptoTrading #TradingPsychology
🏦 ETF outflows offer a lesson in concentration: 77% of Friday’s outflows came from IBIT alone.
1️⃣ Friday: $185.4M flowed out of US spot BTC ETFs — the 7th consecutive day in the red
2️⃣ November total so far: ~$2.1B in outflows
3️⃣ The concentration point: when the industry’s largest fund is also net negative, the comfort of saying “only smaller funds are seeing outflows” disappears
The takeaway: look at both the size of the flows and who the LEADER is — concentration is hidden information. 🧮
Data: Yahoo Finance / FinanceFeeds, Nov 14-15. 🔍
$BTC
#Bitcoin #ETF #CryptoNews
🏦 ETF outflows offer a lesson in concentration: 77% of Friday’s outflows came from IBIT alone.
1️⃣ Friday: $185.4M flowed out of US spot BTC ETFs — the 7th consecutive day in the red
2️⃣ November total so far: ~$2.1B in outflows
3️⃣ The concentration point: when the industry’s largest fund is also net negative, the comfort of saying “only smaller funds are seeing outflows” disappears
The takeaway: look at both the size of the flows and who the LEADER is — concentration is hidden information. 🧮
Data: Yahoo Finance / FinanceFeeds, Nov 14-15. 🔍
$BTC
#Bitcoin #ETF #CryptoNews
1️⃣ Friday: $185.4M flowed out of US spot BTC ETFs — the 7th consecutive day in the red
2️⃣ November total so far: ~$2.1B in outflows
3️⃣ The concentration point: when the industry’s largest fund is also net negative, the comfort of saying “only smaller funds are seeing outflows” disappears
The takeaway: look at both the size of the flows and who the LEADER is — concentration is hidden information. 🧮
Data: Yahoo Finance / FinanceFeeds, Nov 14-15. 🔍
$BTC
#Bitcoin #ETF #CryptoNews
🎯 XRP below 1 dollar — the round number everyone was watching has now broken.
1️⃣ Now in the 0.95 zone — in the lower part of the 52-week range (with the bottom near 0.894)
2️⃣ A break below a round number has a heavy psychological impact — this is where the crowd of stops is
3️⃣ The question after the break: does it reclaim the level, or does the lower range become its new home?
Round numbers aren't walls — they're memories. Memories break, then new ones are made. 📏
This is a data point, not a signal — read the structure yourself. 🔍
$XRP
#XRP #CryptoNews #TradingPsychology
🎯 XRP below 1 dollar — the round number everyone was watching has now broken.
1️⃣ Now in the 0.95 zone — in the lower part of the 52-week range (with the bottom near 0.894)
2️⃣ A break below a round number has a heavy psychological impact — this is where the crowd of stops is
3️⃣ The question after the break: does it reclaim the level, or does the lower range become its new home?
Round numbers aren't walls — they're memories. Memories break, then new ones are made. 📏
This is a data point, not a signal — read the structure yourself. 🔍
$XRP
#XRP #CryptoNews #TradingPsychology
1️⃣ Now in the 0.95 zone — in the lower part of the 52-week range (with the bottom near 0.894)
2️⃣ A break below a round number has a heavy psychological impact — this is where the crowd of stops is
3️⃣ The question after the break: does it reclaim the level, or does the lower range become its new home?
Round numbers aren't walls — they're memories. Memories break, then new ones are made. 📏
This is a data point, not a signal — read the structure yourself. 🔍
$XRP
#XRP #CryptoNews #TradingPsychology
2
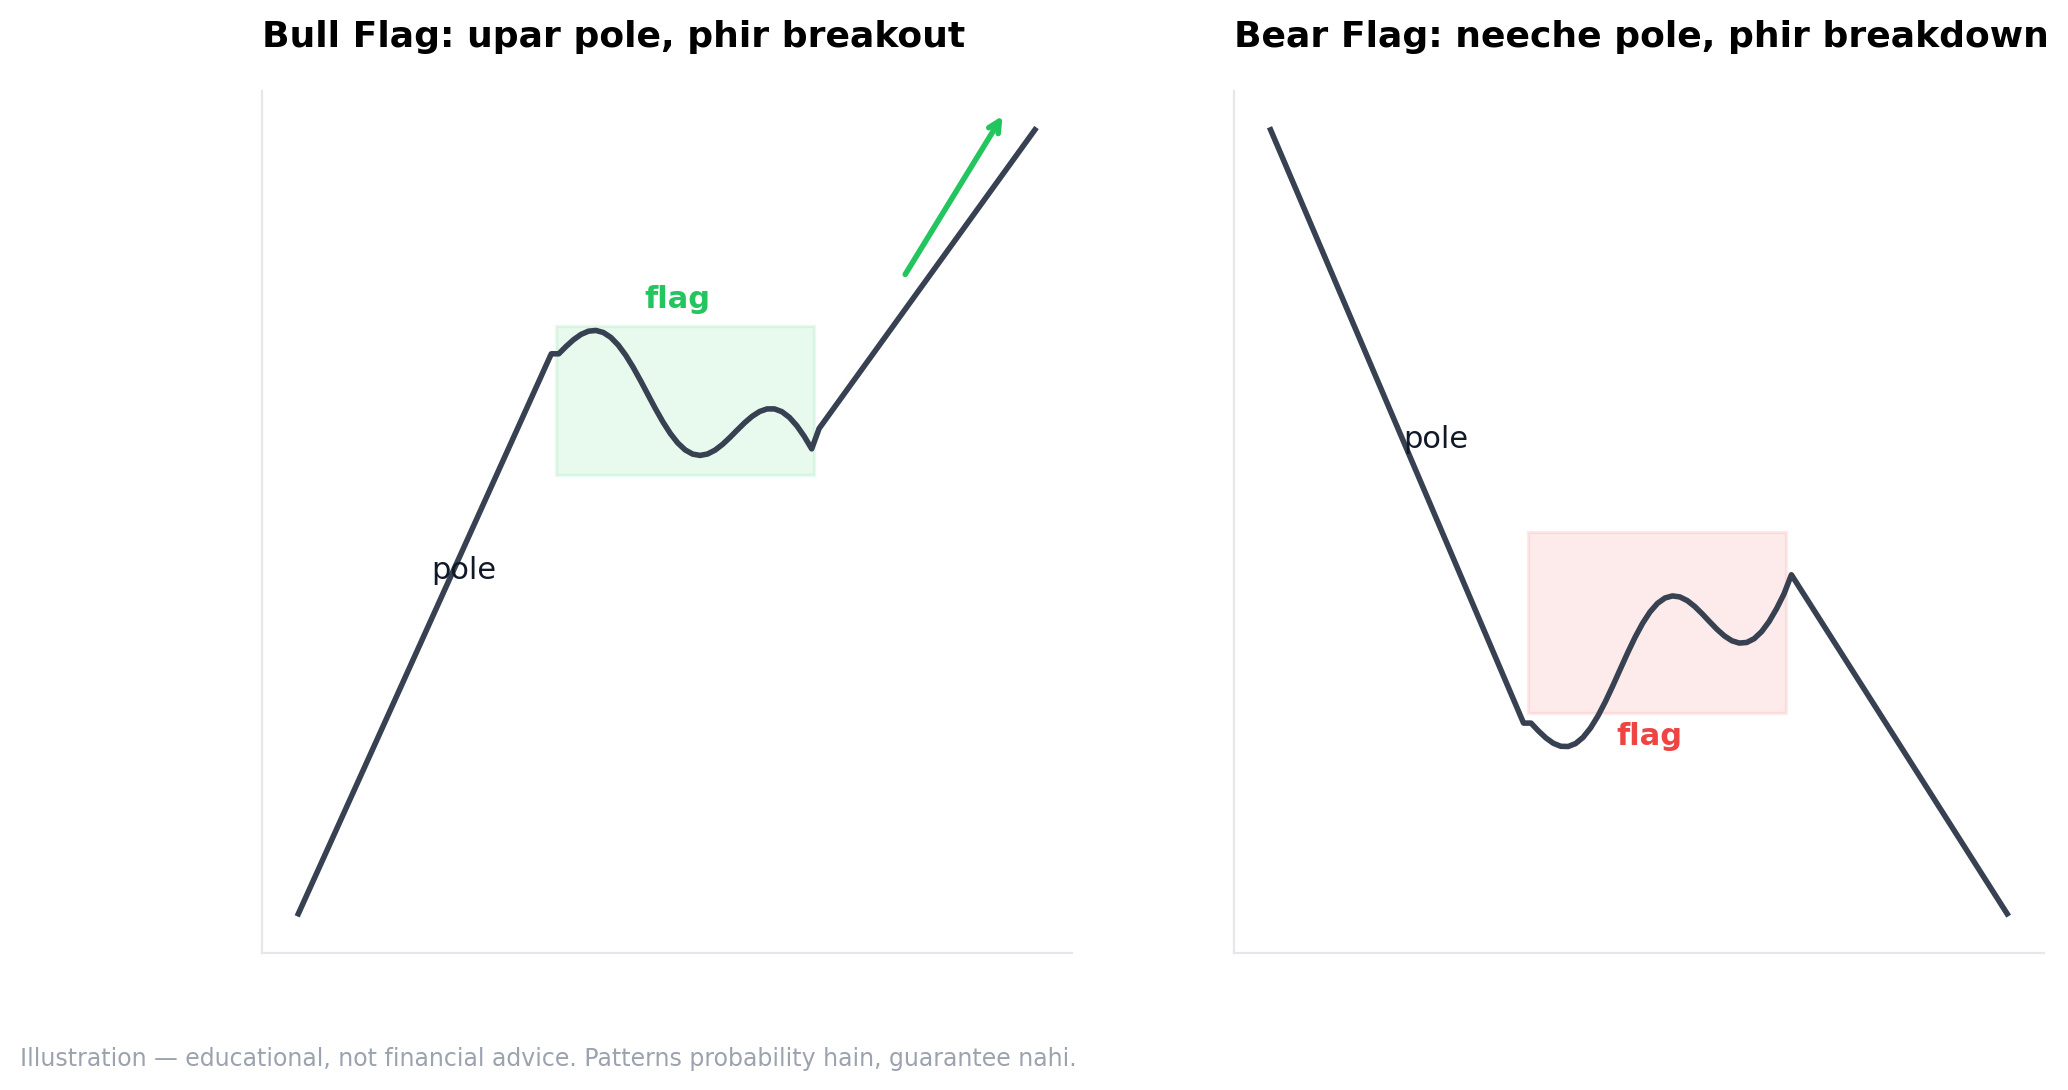
🚩 Flag patterns — a breather in the middle of a trend.
1️⃣ Pole: a sharp directional move (up in a bull market, down in a bear market)
2️⃣ Flag: a narrow, opposite-drifting consolidation after that move — the market is catching its breath
3️⃣ Breakout or breakdown: a close outside the flag — a classic (but not guaranteed) continuation signal
Bear flags are most common in bear markets — a bounce comes, a flag forms, then a breakdown.
A pattern is a probability template — write down your invalidation level first. 📐
Both flags side by side on the chart. 📊
Illustration — educational. 🔍
$BTC
#ChartPatterns #TechnicalAnalysis #CryptoTrading
🚩 Flag patterns — a breather in the middle of a trend.
1️⃣ Pole: a sharp directional move (up in a bull market, down in a bear market)
2️⃣ Flag: a narrow, opposite-drifting consolidation after that move — the market is catching its breath
3️⃣ Breakout or breakdown: a close outside the flag — a classic (but not guaranteed) continuation signal
Bear flags are most common in bear markets — a bounce comes, a flag forms, then a breakdown.
A pattern is a probability template — write down your invalidation level first. 📐
Both flags side by side on the chart. 📊
Illustration — educational. 🔍
$BTC
#ChartPatterns #TechnicalAnalysis #CryptoTrading
1️⃣ Pole: a sharp directional move (up in a bull market, down in a bear market)
2️⃣ Flag: a narrow, opposite-drifting consolidation after that move — the market is catching its breath
3️⃣ Breakout or breakdown: a close outside the flag — a classic (but not guaranteed) continuation signal
Bear flags are most common in bear markets — a bounce comes, a flag forms, then a breakdown.
A pattern is a probability template — write down your invalidation level first. 📐
Both flags side by side on the chart. 📊
Illustration — educational. 🔍
$BTC
#ChartPatterns #TechnicalAnalysis #CryptoTrading
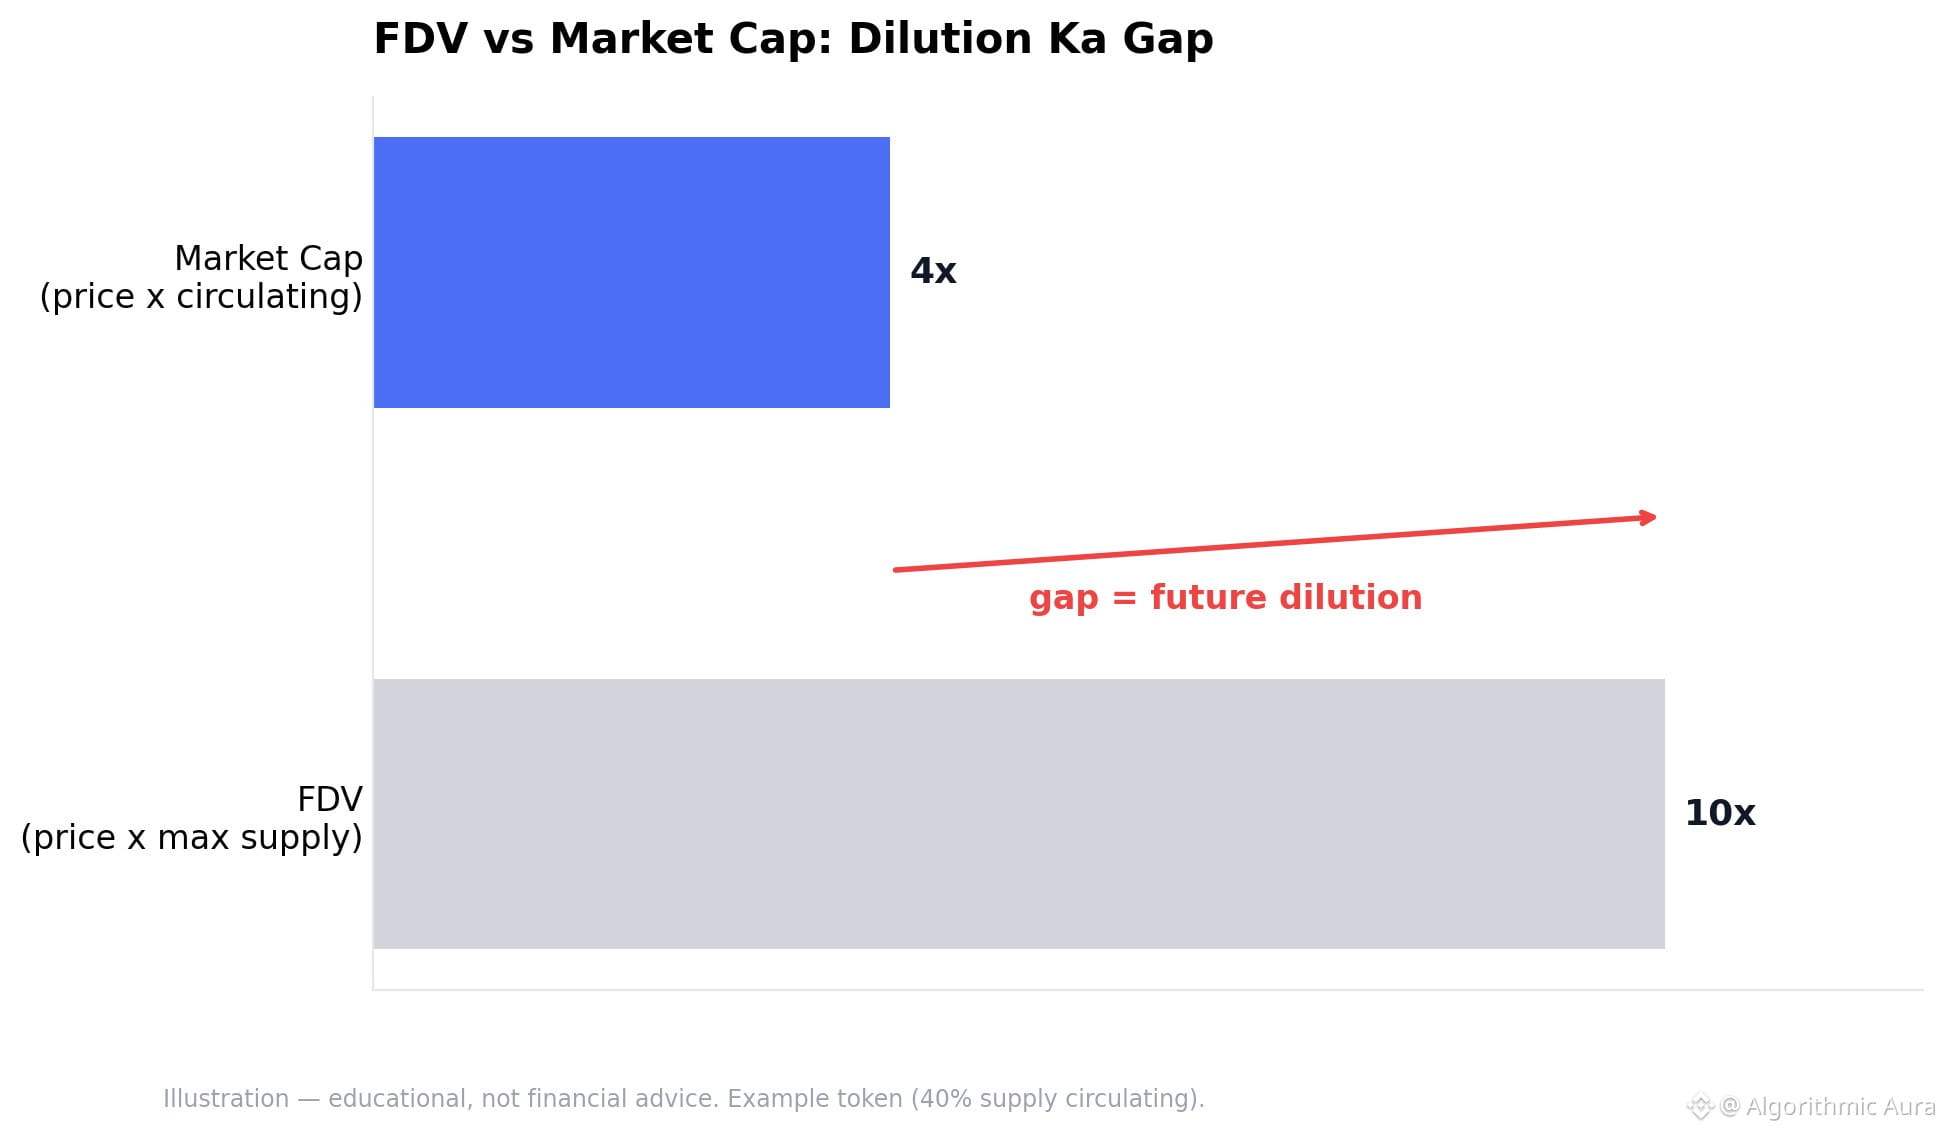
🧮 FDV vs market cap — the two-number valuation test.
1️⃣ Market cap = price x circulating supply — what’s trading RIGHT NOW
2️⃣ FDV = price x max supply — what the total supply could EVER be (including team, treasury, rewards, and everything else)
3️⃣ Gap = future dilution — the bigger the gap, the greater the potential future selling pressure
When looking at a new coin, it’s important to check the FDV — a small market cap alone can be misleading if the FDV is many times larger.
The gap between the two in the chart. 📏
Illustration — educational. 🔍
$BTC
#Tokenomics #CryptoEducation #Altcoins
🧮 FDV vs market cap — the two-number valuation test.
1️⃣ Market cap = price x circulating supply — what’s trading RIGHT NOW
2️⃣ FDV = price x max supply — what the total supply could EVER be (including team, treasury, rewards, and everything else)
3️⃣ Gap = future dilution — the bigger the gap, the greater the potential future selling pressure
When looking at a new coin, it’s important to check the FDV — a small market cap alone can be misleading if the FDV is many times larger.
The gap between the two in the chart. 📏
Illustration — educational. 🔍
$BTC
#Tokenomics #CryptoEducation #Altcoins
1️⃣ Market cap = price x circulating supply — what’s trading RIGHT NOW
2️⃣ FDV = price x max supply — what the total supply could EVER be (including team, treasury, rewards, and everything else)
3️⃣ Gap = future dilution — the bigger the gap, the greater the potential future selling pressure
When looking at a new coin, it’s important to check the FDV — a small market cap alone can be misleading if the FDV is many times larger.
The gap between the two in the chart. 📏
Illustration — educational. 🔍
$BTC
#Tokenomics #CryptoEducation #Altcoins
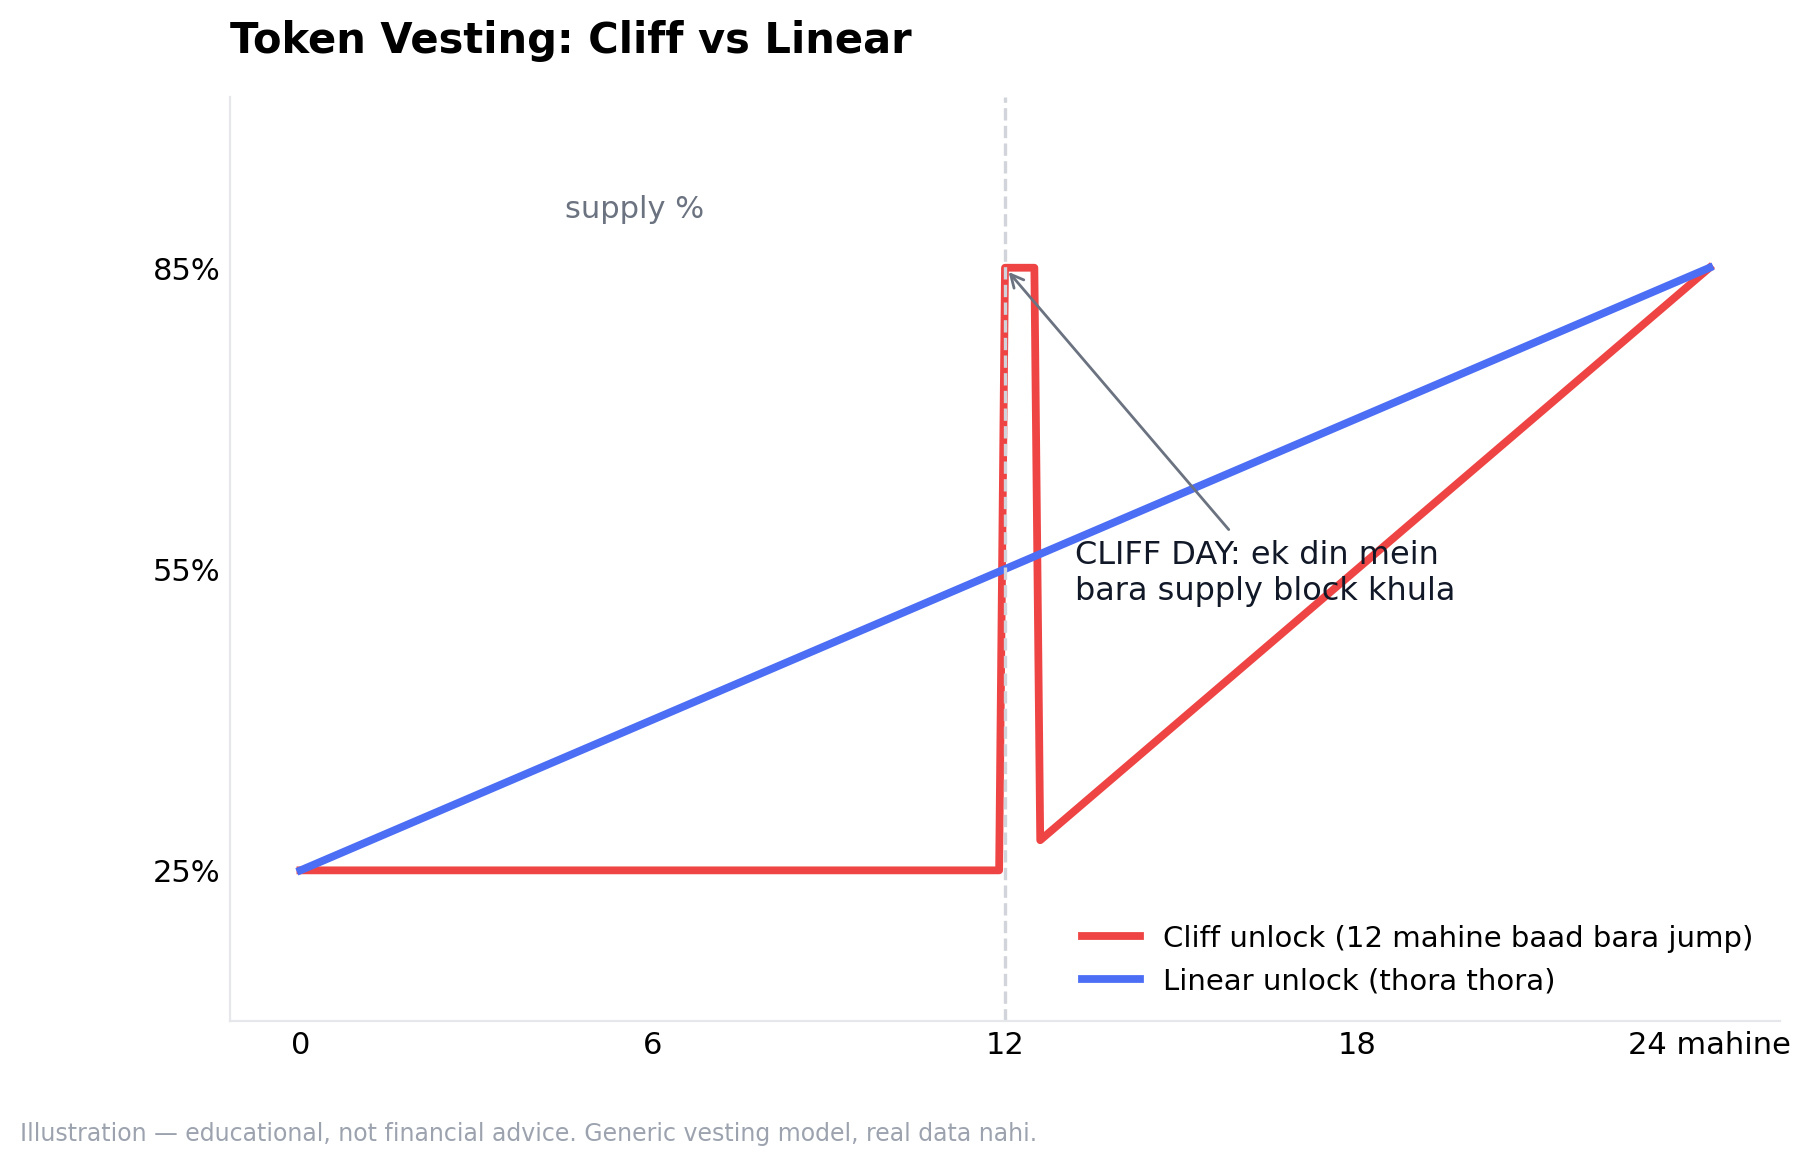
🗓️ Token unlocks — a quiet factor behind altcoin bleeding.
1️⃣ Projects release tokens according to a vesting schedule — for the team, investors, and ecosystem funds
2️⃣ CLIFF unlock: a large block of supply is released all at once — the queue of sellers gets long in a single day
3️⃣ LINEAR unlock: a little at a time each day — pressure is spread out and less dramatic
When the market is weak (like now), the unlock calendar adds extra supply weight — the coin’s fundamentals are a separate question.
The chart shows the difference between cliff and linear unlocks. 📊
Illustration — for educational purposes, not financial advice. 🔍
$SOL
#Tokenomics #Altcoins #CryptoEducation
🗓️ Token unlocks — a quiet factor behind altcoin bleeding.
1️⃣ Projects release tokens according to a vesting schedule — for the team, investors, and ecosystem funds
2️⃣ CLIFF unlock: a large block of supply is released all at once — the queue of sellers gets long in a single day
3️⃣ LINEAR unlock: a little at a time each day — pressure is spread out and less dramatic
When the market is weak (like now), the unlock calendar adds extra supply weight — the coin’s fundamentals are a separate question.
The chart shows the difference between cliff and linear unlocks. 📊
Illustration — for educational purposes, not financial advice. 🔍
$SOL
#Tokenomics #Altcoins #CryptoEducation
1️⃣ Projects release tokens according to a vesting schedule — for the team, investors, and ecosystem funds
2️⃣ CLIFF unlock: a large block of supply is released all at once — the queue of sellers gets long in a single day
3️⃣ LINEAR unlock: a little at a time each day — pressure is spread out and less dramatic
When the market is weak (like now), the unlock calendar adds extra supply weight — the coin’s fundamentals are a separate question.
The chart shows the difference between cliff and linear unlocks. 📊
Illustration — for educational purposes, not financial advice. 🔍
$SOL
#Tokenomics #Altcoins #CryptoEducation
1
📉 The level that was being tested last week has broken: BTC closed BELOW the 200-day MA on Nov 12.
1️⃣ A break doesn’t mean doom — it means the long-term trend context is now on the bearish side
2️⃣ Classic sequence: break → retest (the MA now acts like resistance) → reaction
3️⃣ What to watch: volume and reaction at the retest — a wick back inside, or acceptance and a move further down
A level breaking is an event, not a prediction — the reaction is the real information. 📏
Sunday homework: add the MA200 to your chart and watch this sequence. 🔍
$BTC
#Bitcoin #TechnicalAnalysis #CryptoEducation
📉 The level that was being tested last week has broken: BTC closed BELOW the 200-day MA on Nov 12.
1️⃣ A break doesn’t mean doom — it means the long-term trend context is now on the bearish side
2️⃣ Classic sequence: break → retest (the MA now acts like resistance) → reaction
3️⃣ What to watch: volume and reaction at the retest — a wick back inside, or acceptance and a move further down
A level breaking is an event, not a prediction — the reaction is the real information. 📏
Sunday homework: add the MA200 to your chart and watch this sequence. 🔍
$BTC
#Bitcoin #TechnicalAnalysis #CryptoEducation
1️⃣ A break doesn’t mean doom — it means the long-term trend context is now on the bearish side
2️⃣ Classic sequence: break → retest (the MA now acts like resistance) → reaction
3️⃣ What to watch: volume and reaction at the retest — a wick back inside, or acceptance and a move further down
A level breaking is an event, not a prediction — the reaction is the real information. 📏
Sunday homework: add the MA200 to your chart and watch this sequence. 🔍
$BTC
#Bitcoin #TechnicalAnalysis #CryptoEducation
🌆 Evening Wrap — Nov 16: BTC has touched its lowest level since July.
1️⃣ Nov 15: BTC at $61,946 (Coinbase low) — a 4-month low; around $750M in liquidations that day, ~80% of them longs
2️⃣ Now in the ~64–65K zone, down 13% over the week | ETH ~1,800 | SOL ~72
3️⃣ Drivers: ETF outflows (7 days in a row) + AI stock selloff + leverage unwind — all three at once
The market will still be open tomorrow — make decisions with a cool head, not in a panic. 🧭
Educational wrap — not financial advice. 📚
$BTC $ETH
#Bitcoin #CryptoNews #MarketWrap
🌆 Evening Wrap — Nov 16: BTC has touched its lowest level since July.
1️⃣ Nov 15: BTC at $61,946 (Coinbase low) — a 4-month low; around $750M in liquidations that day, ~80% of them longs
2️⃣ Now in the ~64–65K zone, down 13% over the week | ETH ~1,800 | SOL ~72
3️⃣ Drivers: ETF outflows (7 days in a row) + AI stock selloff + leverage unwind — all three at once
The market will still be open tomorrow — make decisions with a cool head, not in a panic. 🧭
Educational wrap — not financial advice. 📚
$BTC $ETH
#Bitcoin #CryptoNews #MarketWrap
1️⃣ Nov 15: BTC at $61,946 (Coinbase low) — a 4-month low; around $750M in liquidations that day, ~80% of them longs
2️⃣ Now in the ~64–65K zone, down 13% over the week | ETH ~1,800 | SOL ~72
3️⃣ Drivers: ETF outflows (7 days in a row) + AI stock selloff + leverage unwind — all three at once
The market will still be open tomorrow — make decisions with a cool head, not in a panic. 🧭
Educational wrap — not financial advice. 📚
$BTC $ETH
#Bitcoin #CryptoNews #MarketWrap
2
🎯 Options basics — calls and puts, in 60 seconds.
1️⃣ Call = the right (not the obligation) to buy ABOVE a certain price
2️⃣ Put = the right to sell BELOW a certain price
3️⃣ Premium = the price you pay for this right — like insurance: it keeps burning away over time
The real thing you get from the options market: INFORMATION — implied odds show the whole market’s expectations (like what’s priced in around Christmas).
The real cost of the premium: time decay — theta eats away at it every day, even when the market is asleep. ⏳
Start with the basics — spreads and straddles are coming. 🔍
$BTC
#Options #Derivatives #CryptoEducation
🎯 Options basics — calls and puts, in 60 seconds.
1️⃣ Call = the right (not the obligation) to buy ABOVE a certain price
2️⃣ Put = the right to sell BELOW a certain price
3️⃣ Premium = the price you pay for this right — like insurance: it keeps burning away over time
The real thing you get from the options market: INFORMATION — implied odds show the whole market’s expectations (like what’s priced in around Christmas).
The real cost of the premium: time decay — theta eats away at it every day, even when the market is asleep. ⏳
Start with the basics — spreads and straddles are coming. 🔍
$BTC
#Options #Derivatives #CryptoEducation
1️⃣ Call = the right (not the obligation) to buy ABOVE a certain price
2️⃣ Put = the right to sell BELOW a certain price
3️⃣ Premium = the price you pay for this right — like insurance: it keeps burning away over time
The real thing you get from the options market: INFORMATION — implied odds show the whole market’s expectations (like what’s priced in around Christmas).
The real cost of the premium: time decay — theta eats away at it every day, even when the market is asleep. ⏳
Start with the basics — spreads and straddles are coming. 🔍
$BTC
#Options #Derivatives #CryptoEducation
🌡️ MVRV — the on-chain world's thermometer.
1️⃣ MVRV = market cap ÷ realized cap (realized cap = each coin is counted at the price it last moved at)
2️⃣ High MVRV = many holders are in profit — historically, a zone of selling pressure
3️⃣ Low MVRV = coins have shifted into losses — historically, near accumulation zones
This isn't a “magical indicator” — it's a lens that connects sentiment with cost basis. Extreme readings matter, not the noise in between. 🧮
The benefit of on-chain data: emotions can't make claims. 🔍
$BTC
#OnChain #MVRV #CryptoEducation
🌡️ MVRV — the on-chain world's thermometer.
1️⃣ MVRV = market cap ÷ realized cap (realized cap = each coin is counted at the price it last moved at)
2️⃣ High MVRV = many holders are in profit — historically, a zone of selling pressure
3️⃣ Low MVRV = coins have shifted into losses — historically, near accumulation zones
This isn't a “magical indicator” — it's a lens that connects sentiment with cost basis. Extreme readings matter, not the noise in between. 🧮
The benefit of on-chain data: emotions can't make claims. 🔍
$BTC
#OnChain #MVRV #CryptoEducation
1️⃣ MVRV = market cap ÷ realized cap (realized cap = each coin is counted at the price it last moved at)
2️⃣ High MVRV = many holders are in profit — historically, a zone of selling pressure
3️⃣ Low MVRV = coins have shifted into losses — historically, near accumulation zones
This isn't a “magical indicator” — it's a lens that connects sentiment with cost basis. Extreme readings matter, not the noise in between. 🧮
The benefit of on-chain data: emotions can't make claims. 🔍
$BTC
#OnChain #MVRV #CryptoEducation
🔭 Top-down analysis — from the larger timeframe to the smaller one, not the other way around.
1️⃣ Weekly: What’s the trend? — where bias takes shape
2️⃣ Daily: What’s the structure? — where levels take shape
3️⃣ 4H/1H: Timing — execution happens here
Mistake: looking for a “setup” on the 1-minute chart while ignoring the weekly trend — like sailing a small boat against the ocean. ⛵
Each timeframe has its own job — when all three tell the same story, that’s called “confluence,” and that’s where the probabilistic edge lies. 🎯
One asset, three perspectives. 👀
$BTC
#TechnicalAnalysis #TradingPlan #CryptoTrading
🔭 Top-down analysis — from the larger timeframe to the smaller one, not the other way around.
1️⃣ Weekly: What’s the trend? — where bias takes shape
2️⃣ Daily: What’s the structure? — where levels take shape
3️⃣ 4H/1H: Timing — execution happens here
Mistake: looking for a “setup” on the 1-minute chart while ignoring the weekly trend — like sailing a small boat against the ocean. ⛵
Each timeframe has its own job — when all three tell the same story, that’s called “confluence,” and that’s where the probabilistic edge lies. 🎯
One asset, three perspectives. 👀
$BTC
#TechnicalAnalysis #TradingPlan #CryptoTrading
1️⃣ Weekly: What’s the trend? — where bias takes shape
2️⃣ Daily: What’s the structure? — where levels take shape
3️⃣ 4H/1H: Timing — execution happens here
Mistake: looking for a “setup” on the 1-minute chart while ignoring the weekly trend — like sailing a small boat against the ocean. ⛵
Each timeframe has its own job — when all three tell the same story, that’s called “confluence,” and that’s where the probabilistic edge lies. 🎯
One asset, three perspectives. 👀
$BTC
#TechnicalAnalysis #TradingPlan #CryptoTrading
🧪 Dust attack / address poisoning — a scam that plays with your wallet’s mailbox.
1️⃣ The scammer sends a tiny “dust” token to your wallet — sneaking into your address history
2️⃣ Then they show a fake transaction from a look-alike address — when you copy and paste, you accidentally use THEIR address
3️⃣ Protection: checking just the first/last characters isn’t enough — verify the FULL address, and even better: use an address book
Wallet hygiene is like banking hygiene — don’t worry, but being a little paranoid is a good thing. 🛡️
Security is in your hands. 🔐
$BTC
#CryptoSecurity #WalletSafety #ScamAwareness
🧪 Dust attack / address poisoning — a scam that plays with your wallet’s mailbox.
1️⃣ The scammer sends a tiny “dust” token to your wallet — sneaking into your address history
2️⃣ Then they show a fake transaction from a look-alike address — when you copy and paste, you accidentally use THEIR address
3️⃣ Protection: checking just the first/last characters isn’t enough — verify the FULL address, and even better: use an address book
Wallet hygiene is like banking hygiene — don’t worry, but being a little paranoid is a good thing. 🛡️
Security is in your hands. 🔐
$BTC
#CryptoSecurity #WalletSafety #ScamAwareness
1️⃣ The scammer sends a tiny “dust” token to your wallet — sneaking into your address history
2️⃣ Then they show a fake transaction from a look-alike address — when you copy and paste, you accidentally use THEIR address
3️⃣ Protection: checking just the first/last characters isn’t enough — verify the FULL address, and even better: use an address book
Wallet hygiene is like banking hygiene — don’t worry, but being a little paranoid is a good thing. 🛡️
Security is in your hands. 🔐
$BTC
#CryptoSecurity #WalletSafety #ScamAwareness
🥤 Impermanent loss — the hidden cost of LPing.
1️⃣ LPing = putting two tokens into a pool to earn fees — like an ETH/USDC pair
2️⃣ If one token moves sharply against the other, the pool "rebalances" your holdings — and the math works against you
3️⃣ The difference between the value you get when exiting the pool and what you’d have had by "just holding" — that’s impermanent loss (if it doesn’t recover, it’s permanent!)
Fees + rewards > IL is the real LP business model — otherwise, it’s charity, not farming. 🧮
Learn the basics first — advanced versions like concentrated liquidity can come later. 🔍
$ETH
#DeFi #LiquidityPools #CryptoEducation
🥤 Impermanent loss — the hidden cost of LPing.
1️⃣ LPing = putting two tokens into a pool to earn fees — like an ETH/USDC pair
2️⃣ If one token moves sharply against the other, the pool "rebalances" your holdings — and the math works against you
3️⃣ The difference between the value you get when exiting the pool and what you’d have had by "just holding" — that’s impermanent loss (if it doesn’t recover, it’s permanent!)
Fees + rewards > IL is the real LP business model — otherwise, it’s charity, not farming. 🧮
Learn the basics first — advanced versions like concentrated liquidity can come later. 🔍
$ETH
#DeFi #LiquidityPools #CryptoEducation
1️⃣ LPing = putting two tokens into a pool to earn fees — like an ETH/USDC pair
2️⃣ If one token moves sharply against the other, the pool "rebalances" your holdings — and the math works against you
3️⃣ The difference between the value you get when exiting the pool and what you’d have had by "just holding" — that’s impermanent loss (if it doesn’t recover, it’s permanent!)
Fees + rewards > IL is the real LP business model — otherwise, it’s charity, not farming. 🧮
Learn the basics first — advanced versions like concentrated liquidity can come later. 🔍
$ETH
#DeFi #LiquidityPools #CryptoEducation
🎫 Order types 101 — how your order gets executed is also an edge.
1️⃣ Market order: right now, at the current price — you pay for speed with slippage
2️⃣ Limit order: your price, your control — but a fill isn’t guaranteed (it only works if the market reaches your price)
3️⃣ Stop-market: becomes a market order as soon as the trigger is hit — the standard tool for a stop-loss
The mistake everyone makes: leaving the exit plan to the “urgency of a market order” — if your entry is planned, your exit should be planned too. 📏
Order type = execution discipline. 🔧
$BTC
#TradingBasics #OrderTypes #CryptoEducation
🎫 Order types 101 — how your order gets executed is also an edge.
1️⃣ Market order: right now, at the current price — you pay for speed with slippage
2️⃣ Limit order: your price, your control — but a fill isn’t guaranteed (it only works if the market reaches your price)
3️⃣ Stop-market: becomes a market order as soon as the trigger is hit — the standard tool for a stop-loss
The mistake everyone makes: leaving the exit plan to the “urgency of a market order” — if your entry is planned, your exit should be planned too. 📏
Order type = execution discipline. 🔧
$BTC
#TradingBasics #OrderTypes #CryptoEducation
1️⃣ Market order: right now, at the current price — you pay for speed with slippage
2️⃣ Limit order: your price, your control — but a fill isn’t guaranteed (it only works if the market reaches your price)
3️⃣ Stop-market: becomes a market order as soon as the trigger is hit — the standard tool for a stop-loss
The mistake everyone makes: leaving the exit plan to the “urgency of a market order” — if your entry is planned, your exit should be planned too. 📏
Order type = execution discipline. 🔧
$BTC
#TradingBasics #OrderTypes #CryptoEducation
🌙 Weekend effect — crypto runs 24/7, but liquidity doesn’t.
1️⃣ Banks are closed on weekends and institutions are offline — order books get thinner
2️⃣ Thin liquidity = even a small order can trigger a big move — volatility comes free
3️⃣ Wicks look more dramatic on weekends — there are fewer buyers to catch the fall
Check this: if a big move happens over the weekend, look at the volume too — if it’s thin, question the quality of the move. 🕵️
Your trading plan should also ask “which day” — the market calendar has a say in your trading. 📅
$BTC
#Bitcoin #Liquidity #CryptoTrading
🌙 Weekend effect — crypto runs 24/7, but liquidity doesn’t.
1️⃣ Banks are closed on weekends and institutions are offline — order books get thinner
2️⃣ Thin liquidity = even a small order can trigger a big move — volatility comes free
3️⃣ Wicks look more dramatic on weekends — there are fewer buyers to catch the fall
Check this: if a big move happens over the weekend, look at the volume too — if it’s thin, question the quality of the move. 🕵️
Your trading plan should also ask “which day” — the market calendar has a say in your trading. 📅
$BTC
#Bitcoin #Liquidity #CryptoTrading
1️⃣ Banks are closed on weekends and institutions are offline — order books get thinner
2️⃣ Thin liquidity = even a small order can trigger a big move — volatility comes free
3️⃣ Wicks look more dramatic on weekends — there are fewer buyers to catch the fall
Check this: if a big move happens over the weekend, look at the volume too — if it’s thin, question the quality of the move. 🕵️
Your trading plan should also ask “which day” — the market calendar has a say in your trading. 📅
$BTC
#Bitcoin #Liquidity #CryptoTrading
⚓ Stablecoin depeg — when “stable” forgets its promise.
1️⃣ How the peg works: every 1 USDT/USDC should be backed by reserves (cash, T-bills, etc.)
2️⃣ Depeg = the market price moves away from 1.00 — a small deviation (0.99) is normal; a larger one (0.95 or lower) is a red flag
3️⃣ Remember the history: depeg events are bigger than panic — the redemption mechanism is the real test
A stablecoin isn’t just a “cash drawer”; it’s an engineered instrument. You have to ask how it’s designed: what backs it? 🏗️
Audits and redemption history — that’s where real peace of mind comes from. 🔍
$USDT $USDC
#Stablecoins #DeFi #CryptoEducation
⚓ Stablecoin depeg — when “stable” forgets its promise.
1️⃣ How the peg works: every 1 USDT/USDC should be backed by reserves (cash, T-bills, etc.)
2️⃣ Depeg = the market price moves away from 1.00 — a small deviation (0.99) is normal; a larger one (0.95 or lower) is a red flag
3️⃣ Remember the history: depeg events are bigger than panic — the redemption mechanism is the real test
A stablecoin isn’t just a “cash drawer”; it’s an engineered instrument. You have to ask how it’s designed: what backs it? 🏗️
Audits and redemption history — that’s where real peace of mind comes from. 🔍
$USDT $USDC
#Stablecoins #DeFi #CryptoEducation
1️⃣ How the peg works: every 1 USDT/USDC should be backed by reserves (cash, T-bills, etc.)
2️⃣ Depeg = the market price moves away from 1.00 — a small deviation (0.99) is normal; a larger one (0.95 or lower) is a red flag
3️⃣ Remember the history: depeg events are bigger than panic — the redemption mechanism is the real test
A stablecoin isn’t just a “cash drawer”; it’s an engineered instrument. You have to ask how it’s designed: what backs it? 🏗️
Audits and redemption history — that’s where real peace of mind comes from. 🔍
$USDT $USDC
#Stablecoins #DeFi #CryptoEducation
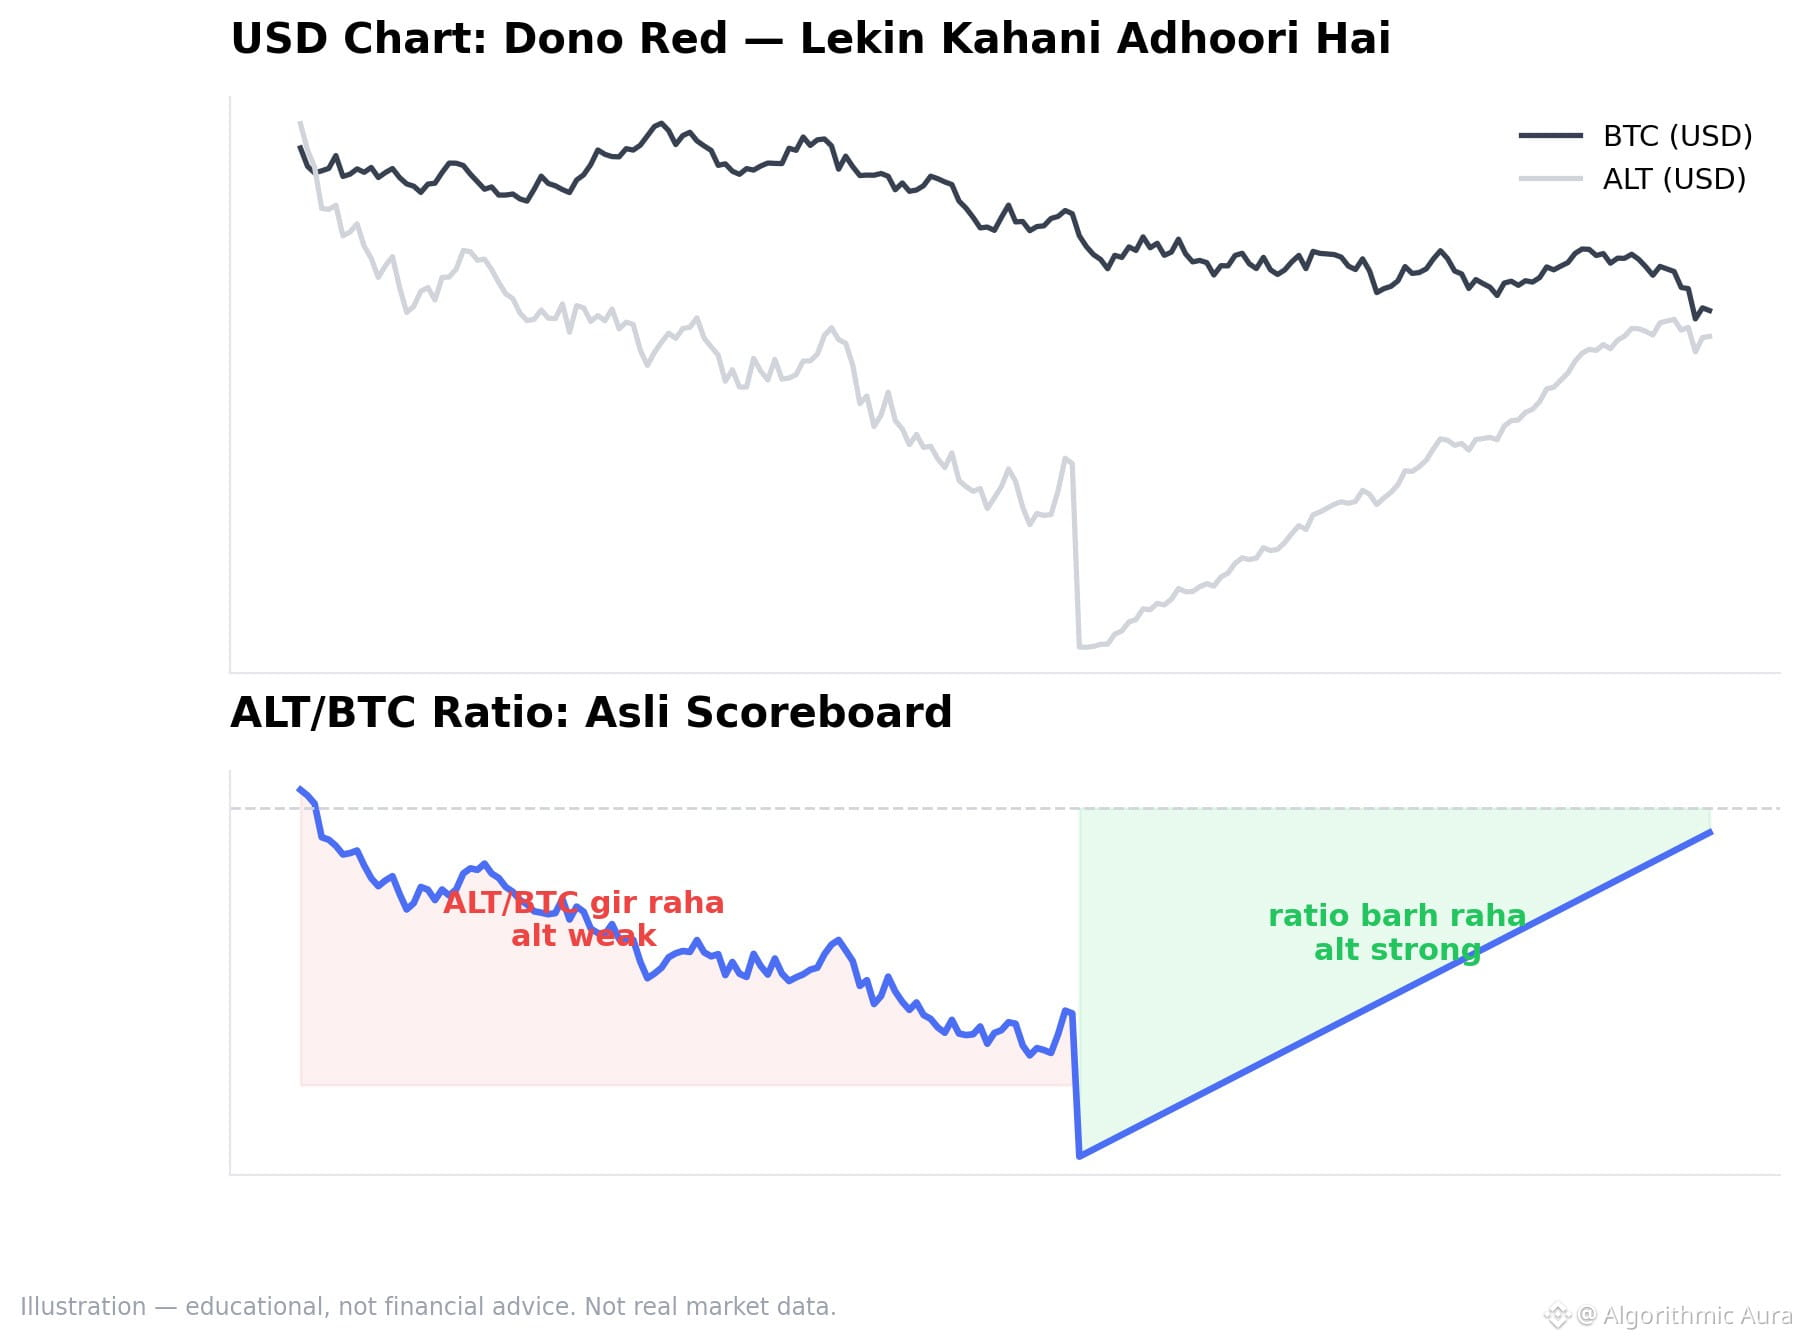
🥊 An altcoin’s real score: relative strength against BTC (RS ratio).
1️⃣ ALT/BTC ratio falling → the alt is weaker than BTC — even if both are green
2️⃣ Ratio rising → the alt is stronger than BTC — even if both are red
3️⃣ Method: divide the alt’s price by BTC’s price, then watch the trend — simple, objective, ego-free
The biggest mistake: being happy to see an alt in USD terms while it keeps falling against BTC. “Green on green” doesn’t always mean profit. 📏
The chart shows two phases of the ratio. 📊
Educational illustration — not a signal for any coin. 🔍
$BTC $SOL
#Altcoins #RelativeStrength #CryptoTrading
🥊 An altcoin’s real score: relative strength against BTC (RS ratio).
1️⃣ ALT/BTC ratio falling → the alt is weaker than BTC — even if both are green
2️⃣ Ratio rising → the alt is stronger than BTC — even if both are red
3️⃣ Method: divide the alt’s price by BTC’s price, then watch the trend — simple, objective, ego-free
The biggest mistake: being happy to see an alt in USD terms while it keeps falling against BTC. “Green on green” doesn’t always mean profit. 📏
The chart shows two phases of the ratio. 📊
Educational illustration — not a signal for any coin. 🔍
$BTC $SOL
#Altcoins #RelativeStrength #CryptoTrading
1️⃣ ALT/BTC ratio falling → the alt is weaker than BTC — even if both are green
2️⃣ Ratio rising → the alt is stronger than BTC — even if both are red
3️⃣ Method: divide the alt’s price by BTC’s price, then watch the trend — simple, objective, ego-free
The biggest mistake: being happy to see an alt in USD terms while it keeps falling against BTC. “Green on green” doesn’t always mean profit. 📏
The chart shows two phases of the ratio. 📊
Educational illustration — not a signal for any coin. 🔍
$BTC $SOL
#Altcoins #RelativeStrength #CryptoTrading
🧾 An accounting lesson from treasury companies — BitMine’s fiscal year ended with a $6.3 billion net loss.
1️⃣ This loss was mostly due to UNREALIZED BTC mark-to-market losses — prices fell, so paper losses increased, but the number of coins stayed the same
2️⃣ Accounting rules value treasury holdings at market prices — P&L volatility is built in
3️⃣ The lesson: a treasury company’s “loss” and a cash-flow loss are two different things — learn to read them separately
The math works in reverse too — unrealized gains can also make a fuss. 🎭
The real balance-sheet questions: how much BTC, and how much debt? The rest is noise. 📉
$BTC
#Bitcoin #Treasury #CryptoNews
🧾 An accounting lesson from treasury companies — BitMine’s fiscal year ended with a $6.3 billion net loss.
1️⃣ This loss was mostly due to UNREALIZED BTC mark-to-market losses — prices fell, so paper losses increased, but the number of coins stayed the same
2️⃣ Accounting rules value treasury holdings at market prices — P&L volatility is built in
3️⃣ The lesson: a treasury company’s “loss” and a cash-flow loss are two different things — learn to read them separately
The math works in reverse too — unrealized gains can also make a fuss. 🎭
The real balance-sheet questions: how much BTC, and how much debt? The rest is noise. 📉
$BTC
#Bitcoin #Treasury #CryptoNews
1️⃣ This loss was mostly due to UNREALIZED BTC mark-to-market losses — prices fell, so paper losses increased, but the number of coins stayed the same
2️⃣ Accounting rules value treasury holdings at market prices — P&L volatility is built in
3️⃣ The lesson: a treasury company’s “loss” and a cash-flow loss are two different things — learn to read them separately
The math works in reverse too — unrealized gains can also make a fuss. 🎭
The real balance-sheet questions: how much BTC, and how much debt? The rest is noise. 📉
$BTC
#Bitcoin #Treasury #CryptoNews
💼 Ripple’s former CTO David Schwartz revealed his XRP holdings: he cut them from 26M tokens to ~3M.
1️⃣ This came from a public disclosure—but the lesson is still fresh: insiders adjust their bags too
2️⃣ He still holds a stake in Ripple stock—the “team question” isn’t always black and white
3️⃣ Takeaway: someone’s large holding or sale = one data point, not a zero-or-hero story
Alignment check: a project being good and its token performing well are two different things—judge them separately. ⚖️
News + education mix—not financial advice. 🔍
$XRP
#XRP #Ripple #CryptoNews
💼 Ripple’s former CTO David Schwartz revealed his XRP holdings: he cut them from 26M tokens to ~3M.
1️⃣ This came from a public disclosure—but the lesson is still fresh: insiders adjust their bags too
2️⃣ He still holds a stake in Ripple stock—the “team question” isn’t always black and white
3️⃣ Takeaway: someone’s large holding or sale = one data point, not a zero-or-hero story
Alignment check: a project being good and its token performing well are two different things—judge them separately. ⚖️
News + education mix—not financial advice. 🔍
$XRP
#XRP #Ripple #CryptoNews
1️⃣ This came from a public disclosure—but the lesson is still fresh: insiders adjust their bags too
2️⃣ He still holds a stake in Ripple stock—the “team question” isn’t always black and white
3️⃣ Takeaway: someone’s large holding or sale = one data point, not a zero-or-hero story
Alignment check: a project being good and its token performing well are two different things—judge them separately. ⚖️
News + education mix—not financial advice. 🔍
$XRP
#XRP #Ripple #CryptoNews
Log in to explore more content
Join global crypto users on Binance Square
⚡️ Get latest and useful information about crypto.
💬 Trusted by the world’s largest crypto exchange.
👍 Discover real insights from verified creators.
Email / Phone number
Trending Topics
A Packed Week of Earnings and Data Tests Markets
66,409 views
420 Discussing
🚨🇺🇸 BIG WEEK AHEAD FOR THE MARKETS!
Markets are pricing in a Fed rate hike in December and $BTC could see some big moves next week.
Here's what's coming:
• Monday: Fed Chair Warsh speaks
• Tuesday: US Retail Sales + $NVDA earnings
• Wednesday: FOMC Minutes
• Thursday: Jobless Claims + Philly Fed Index
• Friday: Consumer Sentiment + Fed speeches
All eyes on $BTC as another important week begins.
#bitcoin
Mookie
·16 Likes
·6.2k views
AnthropicIPOTestsInvestorAppetiteForAI
128,527 views
1,427 Discussing
NvidiaBoardNotConsideringHuang’sReturnasCEO
291 views
18 Discussing