

小恐龙说趋势
417 Posts
 LIVE
LIVE小恐龙说趋势
Report
Block User
X:XiaoKongLong_88 , 6 年加密市场经历 , 牛市里见过疯狂,熊市里见过人性
6 Following
2.0K+ Followers
2.3K+ Liked
Posts
All
Live
·
--
A U.S. company’s stock jumped nearly 8% in a day—all because South Korea decided to move stocks, bonds, and funds on-chain 🦖
[💥 ⏰ 消息群里第一时间说](https://app.binance.com/uni-qr/JpwCPfBj)
On October 6, tokenization platform Securitize (NYSE: SECZ) announced it had signed a memorandum of understanding with South Korean tech company LG CNS. The stock briefly climbed to around $12.60 at the open, up nearly 8% and outperforming most crypto-related stocks.
The catalyst came from regulators. Last week, South Korea’s Financial Services Commission proposed a comprehensive set of rules for tokenized securities, covering the issuance and trading of tokenized stocks, bonds, and funds. The rules are set to take effect in February 2027, marking the first time South Korea has established a complete framework for on-chain securities.
First, a little background on the company: Securitize went public on the NYSE this July through a merger with Cantor Equity Partners II. It’s a longtime player in real-world asset tokenization. Its partnership with LG CNS will cover tokenized funds, stocks, and stablecoins, with the wider Asia-Pacific market in its sights. On the same day, LG CNS also launched its own blockchain infrastructure platform to help banks and financial institutions connect to stablecoins and tokenized securities.
The numbers are what really stand out 📈 According to RWA.xyz, the global real-world asset tokenization market has grown to around $40 billion. Tokenized stocks account for about $3.2 billion, up another 10.6% over the past 30 days and repeatedly setting new records. Securitize CEO Carlos Domingo once made an even bolder claim: even modest adoption of tokenized stocks could push the entire crypto market to a $5 trillion valuation 💥
My take: this isn’t just hype around a concept. For the first time, policy, infrastructure, and custody are all coming together in one country ⚖️ South Korea has been known for its tough stance on crypto for years, but now it wants to bring stocks on-chain in a regulated way. That shift is worth more than the stock’s 8% gain. Still, let’s keep a level head: tokenized stocks are still essentially entries in a brokerage’s ledger. Whether they truly belong to you depends on how transparent custody is and whether settlement is independent.
Two things are worth watching: first, how strict the requirements will be when South Korea’s rules take effect in February 2027; second, whether local giants like LG CNS will award contracts to foreign platforms. If local players capture the infrastructure business, Securitize’s current head start may only be temporary.
Do you think tokenized stocks will become the real driving force of the next market cycle, or are they just another overhyped narrative? Let’s talk in the comments 👀
Tap the profile picture to watch the livestream
Every day, we bring you the latest crypto headlines—not just what’s happening, but also the logic and opportunities behind it 👀🚀
A U.S. company’s stock jumped nearly 8% in a day—all because South Korea decided to move stocks, bonds, and funds on-chain 🦖
💥 ⏰ 消息群里第一时间说
On October 6, tokenization platform Securitize (NYSE: SECZ) announced it had signed a memorandum of understanding with South Korean tech company LG CNS. The stock briefly climbed to around $12.60 at the open, up nearly 8% and outperforming most crypto-related stocks.
The catalyst came from regulators. Last week, South Korea’s Financial Services Commission proposed a comprehensive set of rules for tokenized securities, covering the issuance and trading of tokenized stocks, bonds, and funds. The rules are set to take effect in February 2027, marking the first time South Korea has established a complete framework for on-chain securities.
First, a little background on the company: Securitize went public on the NYSE this July through a merger with Cantor Equity Partners II. It’s a longtime player in real-world asset tokenization. Its partnership with LG CNS will cover tokenized funds, stocks, and stablecoins, with the wider Asia-Pacific market in its sights. On the same day, LG CNS also launched its own blockchain infrastructure platform to help banks and financial institutions connect to stablecoins and tokenized securities.
The numbers are what really stand out 📈 According to RWA.xyz, the global real-world asset tokenization market has grown to around $40 billion. Tokenized stocks account for about $3.2 billion, up another 10.6% over the past 30 days and repeatedly setting new records. Securitize CEO Carlos Domingo once made an even bolder claim: even modest adoption of tokenized stocks could push the entire crypto market to a $5 trillion valuation 💥
My take: this isn’t just hype around a concept. For the first time, policy, infrastructure, and custody are all coming together in one country ⚖️ South Korea has been known for its tough stance on crypto for years, but now it wants to bring stocks on-chain in a regulated way. That shift is worth more than the stock’s 8% gain. Still, let’s keep a level head: tokenized stocks are still essentially entries in a brokerage’s ledger. Whether they truly belong to you depends on how transparent custody is and whether settlement is independent.
Two things are worth watching: first, how strict the requirements will be when South Korea’s rules take effect in February 2027; second, whether local giants like LG CNS will award contracts to foreign platforms. If local players capture the infrastructure business, Securitize’s current head start may only be temporary.
Do you think tokenized stocks will become the real driving force of the next market cycle, or are they just another overhyped narrative? Let’s talk in the comments 👀
Tap the profile picture to watch the livestream
Every day, we bring you the latest crypto headlines—not just what’s happening, but also the logic and opportunities behind it 👀🚀
💥 ⏰ 消息群里第一时间说
On October 6, tokenization platform Securitize (NYSE: SECZ) announced it had signed a memorandum of understanding with South Korean tech company LG CNS. The stock briefly climbed to around $12.60 at the open, up nearly 8% and outperforming most crypto-related stocks.
The catalyst came from regulators. Last week, South Korea’s Financial Services Commission proposed a comprehensive set of rules for tokenized securities, covering the issuance and trading of tokenized stocks, bonds, and funds. The rules are set to take effect in February 2027, marking the first time South Korea has established a complete framework for on-chain securities.
First, a little background on the company: Securitize went public on the NYSE this July through a merger with Cantor Equity Partners II. It’s a longtime player in real-world asset tokenization. Its partnership with LG CNS will cover tokenized funds, stocks, and stablecoins, with the wider Asia-Pacific market in its sights. On the same day, LG CNS also launched its own blockchain infrastructure platform to help banks and financial institutions connect to stablecoins and tokenized securities.
The numbers are what really stand out 📈 According to RWA.xyz, the global real-world asset tokenization market has grown to around $40 billion. Tokenized stocks account for about $3.2 billion, up another 10.6% over the past 30 days and repeatedly setting new records. Securitize CEO Carlos Domingo once made an even bolder claim: even modest adoption of tokenized stocks could push the entire crypto market to a $5 trillion valuation 💥
My take: this isn’t just hype around a concept. For the first time, policy, infrastructure, and custody are all coming together in one country ⚖️ South Korea has been known for its tough stance on crypto for years, but now it wants to bring stocks on-chain in a regulated way. That shift is worth more than the stock’s 8% gain. Still, let’s keep a level head: tokenized stocks are still essentially entries in a brokerage’s ledger. Whether they truly belong to you depends on how transparent custody is and whether settlement is independent.
Two things are worth watching: first, how strict the requirements will be when South Korea’s rules take effect in February 2027; second, whether local giants like LG CNS will award contracts to foreign platforms. If local players capture the infrastructure business, Securitize’s current head start may only be temporary.
Do you think tokenized stocks will become the real driving force of the next market cycle, or are they just another overhyped narrative? Let’s talk in the comments 👀
Tap the profile picture to watch the livestream
Every day, we bring you the latest crypto headlines—not just what’s happening, but also the logic and opportunities behind it 👀🚀

SECZUS+10.18%
1
·
--
#比特币三度受阻8.7万美元
Rejected at $87,000 for the Third Time: Bitcoin Gets Slapped Back 🦖
[🧭 群里聊方向](https://app.binance.com/uni-qr/JpwCPfBj)
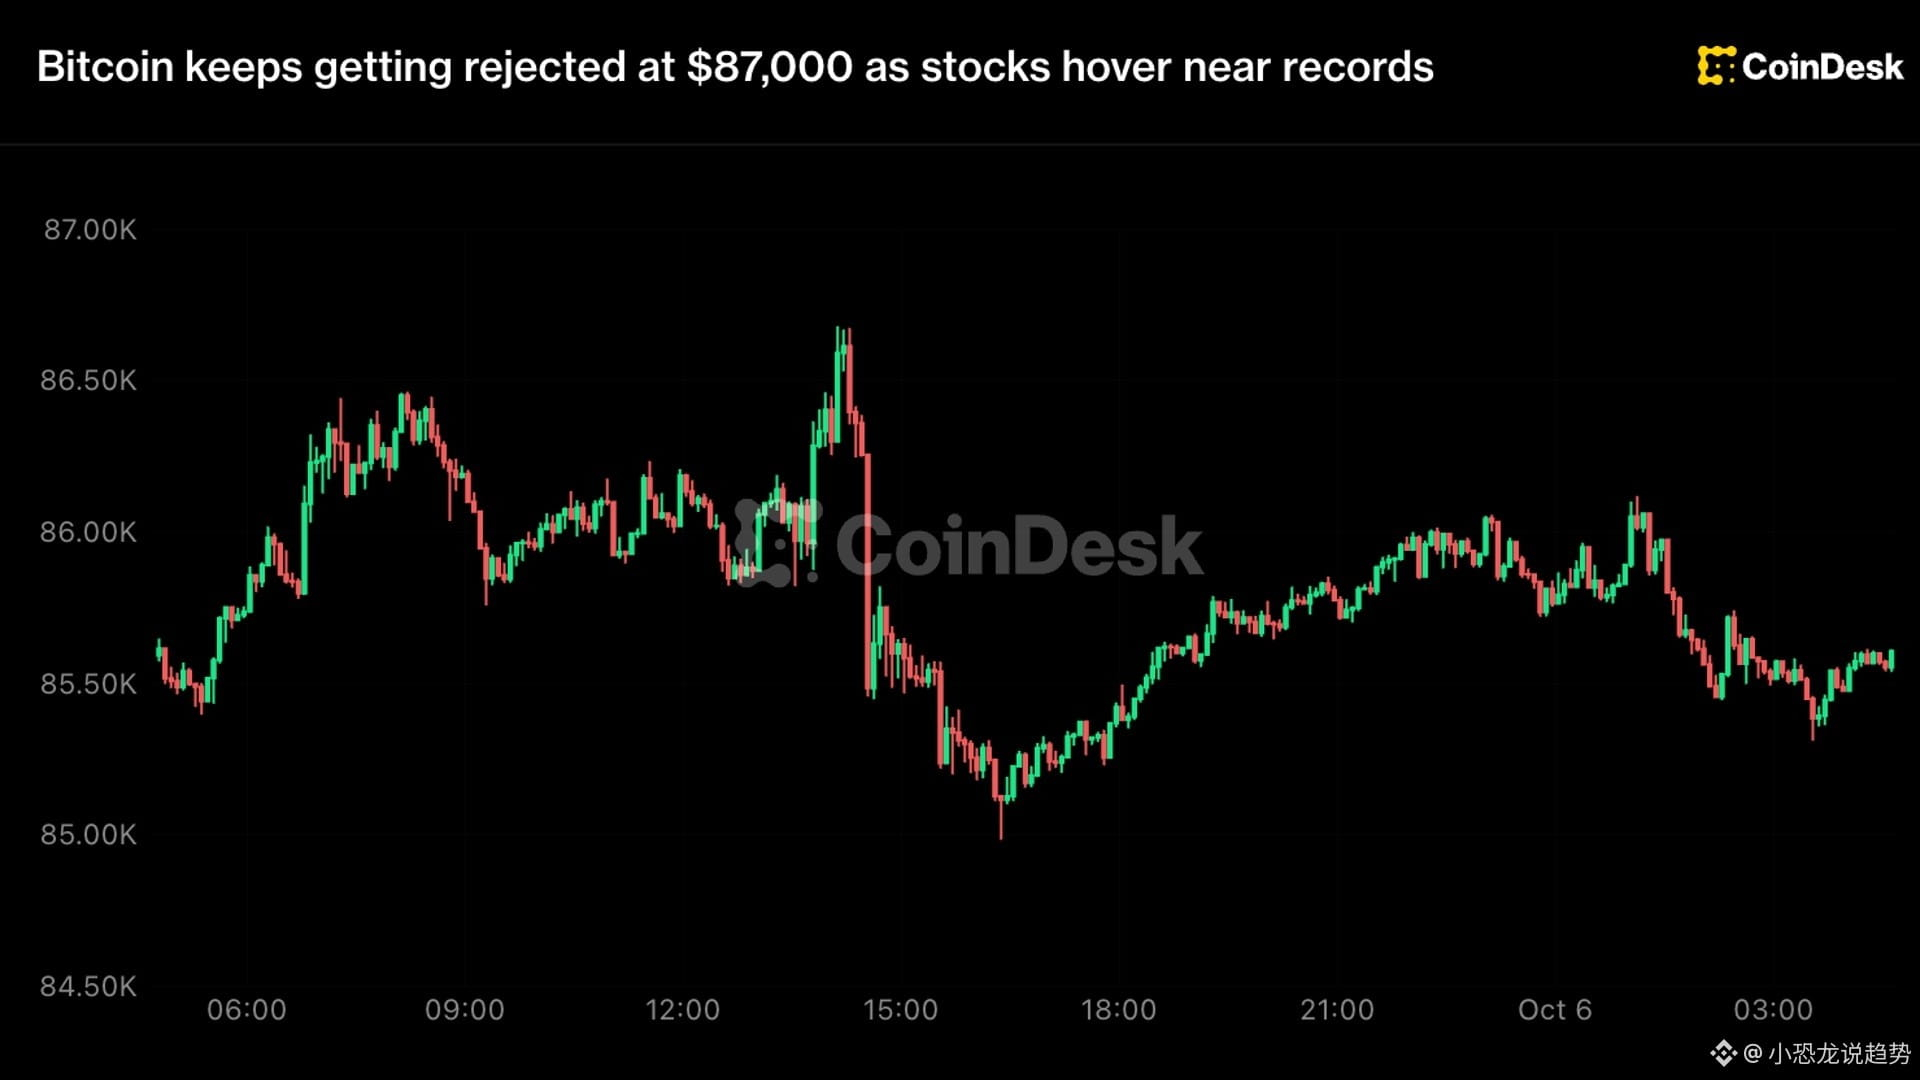
Bitcoin failed for the third time early this morning to break through $87,000. Its price fell 1.2% to around $85,600, and the total crypto market cap shrank to about $2.93 trillion. Since September 23, this same wall has turned it back three times.
First, what exactly is this wall? Every time the price climbs above $87,000, a wave of sell orders appears and pushes it back down. That suggests a crowd of holders is waiting to sell at that level. Analysts explain that Bitcoin has reached the apex of a triangle, with rising support below and resistance at $87,000 overhead—a level that’s been holding firm for more than ten days. Volatility will only increase before a breakout.
Now let’s look at what actually happened overnight. U.S. Bitcoin ETFs saw net outflows of around $90 million in a single day 🔴 Meanwhile, the yield on 10-year U.S. Treasuries rose to 5.32%, its highest level since 2002, while the two-year yield climbed to 4.83%. The Nasdaq 100 closed at a record high, and the S&P 500 was just 0.5% shy of its record. In other words, money hasn’t disappeared—it’s moving into U.S. stocks and bonds, not Bitcoin.
The most interesting part is the rotation within the crypto market. ADA surged 11% in a day, NEAR and GRT each gained around 7%, and HYPE rose 3% against the trend to $94. Meanwhile, Ethereum, XRP, SOL, and Dogecoin all fell 1% to 2%, while BNB dropped 2.5% ⚠️ This isn’t a market-wide collapse. It’s capital moving out of large-cap leaders and into smaller coins in search of greater upside.
My take: Bitcoin needs real spot buying to absorb the selling pressure before it can truly clear $87,000. A rebound driven by leverage and short covering will just get knocked back by the same sell orders. If it can establish itself above that level, the way opens to highs not seen in eight months 📈 To the downside, $84,000 is the short-term support level. If it breaks, $80,000 will come back into view.
Put simply, bulls and bears are locked in a tight range, each trying to outlast the other. Whoever blinks first loses. The real direction won’t be decided by today’s small red candle, but by whether fresh money is willing to buy at these prices.
Do you think this is the final shakeout before a push to new highs, or a sign the rebound has run its course? Share your take in the comments.
I bring you the latest Bitcoin news every day—not just what’s happening, but the logic and opportunities behind it 👀🚀
Tap my profile picture to watch the livestream
#比特币三度受阻8.7万美元
Rejected at $87,000 for the Third Time: Bitcoin Gets Slapped Back 🦖
🧭 群里聊方向
Bitcoin failed for the third time early this morning to break through $87,000. Its price fell 1.2% to around $85,600, and the total crypto market cap shrank to about $2.93 trillion. Since September 23, this same wall has turned it back three times.
First, what exactly is this wall? Every time the price climbs above $87,000, a wave of sell orders appears and pushes it back down. That suggests a crowd of holders is waiting to sell at that level. Analysts explain that Bitcoin has reached the apex of a triangle, with rising support below and resistance at $87,000 overhead—a level that’s been holding firm for more than ten days. Volatility will only increase before a breakout.
Now let’s look at what actually happened overnight. U.S. Bitcoin ETFs saw net outflows of around $90 million in a single day 🔴 Meanwhile, the yield on 10-year U.S. Treasuries rose to 5.32%, its highest level since 2002, while the two-year yield climbed to 4.83%. The Nasdaq 100 closed at a record high, and the S&P 500 was just 0.5% shy of its record. In other words, money hasn’t disappeared—it’s moving into U.S. stocks and bonds, not Bitcoin.
The most interesting part is the rotation within the crypto market. ADA surged 11% in a day, NEAR and GRT each gained around 7%, and HYPE rose 3% against the trend to $94. Meanwhile, Ethereum, XRP, SOL, and Dogecoin all fell 1% to 2%, while BNB dropped 2.5% ⚠️ This isn’t a market-wide collapse. It’s capital moving out of large-cap leaders and into smaller coins in search of greater upside.
My take: Bitcoin needs real spot buying to absorb the selling pressure before it can truly clear $87,000. A rebound driven by leverage and short covering will just get knocked back by the same sell orders. If it can establish itself above that level, the way opens to highs not seen in eight months 📈 To the downside, $84,000 is the short-term support level. If it breaks, $80,000 will come back into view.
Put simply, bulls and bears are locked in a tight range, each trying to outlast the other. Whoever blinks first loses. The real direction won’t be decided by today’s small red candle, but by whether fresh money is willing to buy at these prices.
Do you think this is the final shakeout before a push to new highs, or a sign the rebound has run its course? Share your take in the comments.
I bring you the latest Bitcoin news every day—not just what’s happening, but the logic and opportunities behind it 👀🚀
Tap my profile picture to watch the livestream
Rejected at $87,000 for the Third Time: Bitcoin Gets Slapped Back 🦖
🧭 群里聊方向
Bitcoin failed for the third time early this morning to break through $87,000. Its price fell 1.2% to around $85,600, and the total crypto market cap shrank to about $2.93 trillion. Since September 23, this same wall has turned it back three times.
First, what exactly is this wall? Every time the price climbs above $87,000, a wave of sell orders appears and pushes it back down. That suggests a crowd of holders is waiting to sell at that level. Analysts explain that Bitcoin has reached the apex of a triangle, with rising support below and resistance at $87,000 overhead—a level that’s been holding firm for more than ten days. Volatility will only increase before a breakout.
Now let’s look at what actually happened overnight. U.S. Bitcoin ETFs saw net outflows of around $90 million in a single day 🔴 Meanwhile, the yield on 10-year U.S. Treasuries rose to 5.32%, its highest level since 2002, while the two-year yield climbed to 4.83%. The Nasdaq 100 closed at a record high, and the S&P 500 was just 0.5% shy of its record. In other words, money hasn’t disappeared—it’s moving into U.S. stocks and bonds, not Bitcoin.
The most interesting part is the rotation within the crypto market. ADA surged 11% in a day, NEAR and GRT each gained around 7%, and HYPE rose 3% against the trend to $94. Meanwhile, Ethereum, XRP, SOL, and Dogecoin all fell 1% to 2%, while BNB dropped 2.5% ⚠️ This isn’t a market-wide collapse. It’s capital moving out of large-cap leaders and into smaller coins in search of greater upside.
My take: Bitcoin needs real spot buying to absorb the selling pressure before it can truly clear $87,000. A rebound driven by leverage and short covering will just get knocked back by the same sell orders. If it can establish itself above that level, the way opens to highs not seen in eight months 📈 To the downside, $84,000 is the short-term support level. If it breaks, $80,000 will come back into view.
Put simply, bulls and bears are locked in a tight range, each trying to outlast the other. Whoever blinks first loses. The real direction won’t be decided by today’s small red candle, but by whether fresh money is willing to buy at these prices.
Do you think this is the final shakeout before a push to new highs, or a sign the rebound has run its course? Share your take in the comments.
I bring you the latest Bitcoin news every day—not just what’s happening, but the logic and opportunities behind it 👀🚀
Tap my profile picture to watch the livestream
657
·
--
72 flash loan attacks in 5 years stole $1.211 billion. The truly fatal vulnerability went unnoticed even by auditors and the team itself 🦖
[💡 群里更新数据解读](https://app.binance.com/uni-qr/JpwCPfBj)
A new study published in the Journal of Financial Crime reviewed every flash loan attack from February 2020 to July 2024, scanning more than 20 billion on-chain transactions.
The conclusion: 72 flash loan attacks caused $1.211 billion in losses, accounting for 18.44% of the $6.568 billion stolen across all of DeFi during the same period. More than 80% of the losses hit Ethereum.
First, let’s clarify what a flash loan is: it’s an uncollateralized loan that must be repaid within the same blockchain transaction. Attackers use it to amass the huge sums needed to carry out an attack. The tool itself is neutral; the problem lies in the protocol’s own logic.
The numbers are even more striking: individual attacks ranged from $80,000 to $197 million. Cases involving more than $10 million accounted for over 88% of all losses. In other words, this wasn’t a case of getting picked off bit by bit—just a handful of multimillion-dollar heists drained the funds 💥
The study grouped the tactics into 14 types, under just two broad categories: manipulating price oracles and exploiting flaws in a protocol’s underlying logic. As platforms gradually plugged the former, the latter’s share rose from 28% between February 2020 and January 2022 to 55% between February 2022 and July 2024.
Four tactics accounted for more than 81% of the losses: price oracle attacks, donation function logic flaws, reentrancy attacks, and a single governance attack that stole $181 million.
The most chilling part came from a platform insider who requested anonymity. The vulnerability that was exploited had passed reviews by their own team and several audit firms, and remained hidden on-chain for more than a year before it was discovered. The attacker later publicly mocked them on social media ⚠️
I have three takeaways. First, flash loans aren’t vulnerabilities—they’re leverage. What you really need to watch is how a protocol handles prices and fund flows. Second, the doubling in the share of logic flaws shows that once the old avenues are blocked, attackers simply move on to more obscure code defects. Audits have gone from a passing grade to an entry ticket; passing one doesn’t mean you’re safe. Third, with 88% of losses concentrated in a handful of multimillion-dollar heists, DeFi’s risks are inherently concentrated. A single breach can be catastrophic. In October 2025, a decentralized trading platform had already shut down after a flash loan vulnerability led to $8.4 million in losses. Researchers classify these attacks as not posing an existential threat—but for the specific project that gets breached, that’s simply not true 🔍
What do you think DeFi most needs to improve right now: audits or mechanism design? Let’s discuss in the comments.
Every day, I bring you the latest crypto trends—not just what’s happening, but the logic and opportunities behind the news 👀🚀
Tap the profile picture to watch the livestream
72 flash loan attacks in 5 years stole $1.211 billion. The truly fatal vulnerability went unnoticed even by auditors and the team itself 🦖
💡 群里更新数据解读
A new study published in the Journal of Financial Crime reviewed every flash loan attack from February 2020 to July 2024, scanning more than 20 billion on-chain transactions.
The conclusion: 72 flash loan attacks caused $1.211 billion in losses, accounting for 18.44% of the $6.568 billion stolen across all of DeFi during the same period. More than 80% of the losses hit Ethereum.
First, let’s clarify what a flash loan is: it’s an uncollateralized loan that must be repaid within the same blockchain transaction. Attackers use it to amass the huge sums needed to carry out an attack. The tool itself is neutral; the problem lies in the protocol’s own logic.
The numbers are even more striking: individual attacks ranged from $80,000 to $197 million. Cases involving more than $10 million accounted for over 88% of all losses. In other words, this wasn’t a case of getting picked off bit by bit—just a handful of multimillion-dollar heists drained the funds 💥
The study grouped the tactics into 14 types, under just two broad categories: manipulating price oracles and exploiting flaws in a protocol’s underlying logic. As platforms gradually plugged the former, the latter’s share rose from 28% between February 2020 and January 2022 to 55% between February 2022 and July 2024.
Four tactics accounted for more than 81% of the losses: price oracle attacks, donation function logic flaws, reentrancy attacks, and a single governance attack that stole $181 million.
The most chilling part came from a platform insider who requested anonymity. The vulnerability that was exploited had passed reviews by their own team and several audit firms, and remained hidden on-chain for more than a year before it was discovered. The attacker later publicly mocked them on social media ⚠️
I have three takeaways. First, flash loans aren’t vulnerabilities—they’re leverage. What you really need to watch is how a protocol handles prices and fund flows. Second, the doubling in the share of logic flaws shows that once the old avenues are blocked, attackers simply move on to more obscure code defects. Audits have gone from a passing grade to an entry ticket; passing one doesn’t mean you’re safe. Third, with 88% of losses concentrated in a handful of multimillion-dollar heists, DeFi’s risks are inherently concentrated. A single breach can be catastrophic. In October 2025, a decentralized trading platform had already shut down after a flash loan vulnerability led to $8.4 million in losses. Researchers classify these attacks as not posing an existential threat—but for the specific project that gets breached, that’s simply not true 🔍
What do you think DeFi most needs to improve right now: audits or mechanism design? Let’s discuss in the comments.
Every day, I bring you the latest crypto trends—not just what’s happening, but the logic and opportunities behind the news 👀🚀
Tap the profile picture to watch the livestream
💡 群里更新数据解读
A new study published in the Journal of Financial Crime reviewed every flash loan attack from February 2020 to July 2024, scanning more than 20 billion on-chain transactions.
The conclusion: 72 flash loan attacks caused $1.211 billion in losses, accounting for 18.44% of the $6.568 billion stolen across all of DeFi during the same period. More than 80% of the losses hit Ethereum.
First, let’s clarify what a flash loan is: it’s an uncollateralized loan that must be repaid within the same blockchain transaction. Attackers use it to amass the huge sums needed to carry out an attack. The tool itself is neutral; the problem lies in the protocol’s own logic.
The numbers are even more striking: individual attacks ranged from $80,000 to $197 million. Cases involving more than $10 million accounted for over 88% of all losses. In other words, this wasn’t a case of getting picked off bit by bit—just a handful of multimillion-dollar heists drained the funds 💥
The study grouped the tactics into 14 types, under just two broad categories: manipulating price oracles and exploiting flaws in a protocol’s underlying logic. As platforms gradually plugged the former, the latter’s share rose from 28% between February 2020 and January 2022 to 55% between February 2022 and July 2024.
Four tactics accounted for more than 81% of the losses: price oracle attacks, donation function logic flaws, reentrancy attacks, and a single governance attack that stole $181 million.
The most chilling part came from a platform insider who requested anonymity. The vulnerability that was exploited had passed reviews by their own team and several audit firms, and remained hidden on-chain for more than a year before it was discovered. The attacker later publicly mocked them on social media ⚠️
I have three takeaways. First, flash loans aren’t vulnerabilities—they’re leverage. What you really need to watch is how a protocol handles prices and fund flows. Second, the doubling in the share of logic flaws shows that once the old avenues are blocked, attackers simply move on to more obscure code defects. Audits have gone from a passing grade to an entry ticket; passing one doesn’t mean you’re safe. Third, with 88% of losses concentrated in a handful of multimillion-dollar heists, DeFi’s risks are inherently concentrated. A single breach can be catastrophic. In October 2025, a decentralized trading platform had already shut down after a flash loan vulnerability led to $8.4 million in losses. Researchers classify these attacks as not posing an existential threat—but for the specific project that gets breached, that’s simply not true 🔍
What do you think DeFi most needs to improve right now: audits or mechanism design? Let’s discuss in the comments.
Every day, I bring you the latest crypto trends—not just what’s happening, but the logic and opportunities behind the news 👀🚀
Tap the profile picture to watch the livestream
178
·
--
#美联储10月维持利率概率升至82.3%
96% of the market is betting the Fed won’t cut rates once in 2026—but it’s also betting on another hike 🦖
[🚨 行情变了群里说](https://app.binance.com/uni-qr/JpwCPfBj)
On October 6, Polymarket’s prediction market showed traders pricing in a 95.9% chance of zero rate cuts for the rest of 2026, leaving the probability of a cut below 5%.
In the same market, the Fed’s next move is priced as a hike. The only question is whether it comes in October or December.
The details are worth a closer look. This contract expires on January 1, 2027, with $53.9 million in cumulative trading volume and $4.18 million in liquidity. Over the past 24 hours, the price of zero rate cuts has moved just 0.1 percentage points. That suggests this isn’t a passing sentiment—the market has held this position for a while.
The conviction comes from September’s hike. The Fed raised its target rate by 25 basis points to 3.75%–4.00%, reversing course after cutting it to 3.50%–3.75% last December. The September dot plot put the median federal funds rate at 4.1% by year-end, with most officials expecting at least one more hike this year.
Inflation is what’s pulling in the other direction. The Personal Consumption Expenditures price index rose 3.4% year over year in August, below economists’ survey forecast of 3.7%. After the data came out, Goldman Sachs and other firms pushed back their forecast for the next hike from October to December. Goldman even said the committee is ultimately likely to conclude that no further hike is needed. ⚖️
CME FedWatch’s probability of an October hike fell from nearly 71% a week ago to about 38%. Factors cited in market commentary as supporting further tightening also include unemployment at 4.1%–4.2%, core inflation at around 3.4%, and continued economic expansion.
My take: this 96% figure is easy to misread. It doesn’t mean a rate cut is coming—it means easing is basically off the table. The zero-cuts contract only counts the number of rate cuts. Holding rates steady in October counts as zero cuts, and so does another hike before year-end. So it can be true at the same time as a bet on a hike. ⚠️
What will really shape Bitcoin’s price are the October and December meetings, along with the inflation and employment data in between. With policy staying in restrictive territory, risk appetite and borrowing costs will remain under pressure. Bitcoin is currently hovering around $86,000, but this contract itself doesn’t tell you which way the price will move.
Do you think there really won’t be a single rate cut in 2026, or will there be another hike before year-end? Share your thoughts in the comments.
Tap the profile picture to watch the livestream.
Every day, we bring you the latest crypto stories—not just what’s happening, but the logic and opportunities behind it. 👀🚀
#美联储10月维持利率概率升至82.3%
96% of the market is betting the Fed won’t cut rates once in 2026—but it’s also betting on another hike 🦖
🚨 行情变了群里说
On October 6, Polymarket’s prediction market showed traders pricing in a 95.9% chance of zero rate cuts for the rest of 2026, leaving the probability of a cut below 5%.
In the same market, the Fed’s next move is priced as a hike. The only question is whether it comes in October or December.
The details are worth a closer look. This contract expires on January 1, 2027, with $53.9 million in cumulative trading volume and $4.18 million in liquidity. Over the past 24 hours, the price of zero rate cuts has moved just 0.1 percentage points. That suggests this isn’t a passing sentiment—the market has held this position for a while.
The conviction comes from September’s hike. The Fed raised its target rate by 25 basis points to 3.75%–4.00%, reversing course after cutting it to 3.50%–3.75% last December. The September dot plot put the median federal funds rate at 4.1% by year-end, with most officials expecting at least one more hike this year.
Inflation is what’s pulling in the other direction. The Personal Consumption Expenditures price index rose 3.4% year over year in August, below economists’ survey forecast of 3.7%. After the data came out, Goldman Sachs and other firms pushed back their forecast for the next hike from October to December. Goldman even said the committee is ultimately likely to conclude that no further hike is needed. ⚖️
CME FedWatch’s probability of an October hike fell from nearly 71% a week ago to about 38%. Factors cited in market commentary as supporting further tightening also include unemployment at 4.1%–4.2%, core inflation at around 3.4%, and continued economic expansion.
My take: this 96% figure is easy to misread. It doesn’t mean a rate cut is coming—it means easing is basically off the table. The zero-cuts contract only counts the number of rate cuts. Holding rates steady in October counts as zero cuts, and so does another hike before year-end. So it can be true at the same time as a bet on a hike. ⚠️
What will really shape Bitcoin’s price are the October and December meetings, along with the inflation and employment data in between. With policy staying in restrictive territory, risk appetite and borrowing costs will remain under pressure. Bitcoin is currently hovering around $86,000, but this contract itself doesn’t tell you which way the price will move.
Do you think there really won’t be a single rate cut in 2026, or will there be another hike before year-end? Share your thoughts in the comments.
Tap the profile picture to watch the livestream.
Every day, we bring you the latest crypto stories—not just what’s happening, but the logic and opportunities behind it. 👀🚀
96% of the market is betting the Fed won’t cut rates once in 2026—but it’s also betting on another hike 🦖
🚨 行情变了群里说
On October 6, Polymarket’s prediction market showed traders pricing in a 95.9% chance of zero rate cuts for the rest of 2026, leaving the probability of a cut below 5%.
In the same market, the Fed’s next move is priced as a hike. The only question is whether it comes in October or December.
The details are worth a closer look. This contract expires on January 1, 2027, with $53.9 million in cumulative trading volume and $4.18 million in liquidity. Over the past 24 hours, the price of zero rate cuts has moved just 0.1 percentage points. That suggests this isn’t a passing sentiment—the market has held this position for a while.
The conviction comes from September’s hike. The Fed raised its target rate by 25 basis points to 3.75%–4.00%, reversing course after cutting it to 3.50%–3.75% last December. The September dot plot put the median federal funds rate at 4.1% by year-end, with most officials expecting at least one more hike this year.
Inflation is what’s pulling in the other direction. The Personal Consumption Expenditures price index rose 3.4% year over year in August, below economists’ survey forecast of 3.7%. After the data came out, Goldman Sachs and other firms pushed back their forecast for the next hike from October to December. Goldman even said the committee is ultimately likely to conclude that no further hike is needed. ⚖️
CME FedWatch’s probability of an October hike fell from nearly 71% a week ago to about 38%. Factors cited in market commentary as supporting further tightening also include unemployment at 4.1%–4.2%, core inflation at around 3.4%, and continued economic expansion.
My take: this 96% figure is easy to misread. It doesn’t mean a rate cut is coming—it means easing is basically off the table. The zero-cuts contract only counts the number of rate cuts. Holding rates steady in October counts as zero cuts, and so does another hike before year-end. So it can be true at the same time as a bet on a hike. ⚠️
What will really shape Bitcoin’s price are the October and December meetings, along with the inflation and employment data in between. With policy staying in restrictive territory, risk appetite and borrowing costs will remain under pressure. Bitcoin is currently hovering around $86,000, but this contract itself doesn’t tell you which way the price will move.
Do you think there really won’t be a single rate cut in 2026, or will there be another hike before year-end? Share your thoughts in the comments.
Tap the profile picture to watch the livestream.
Every day, we bring you the latest crypto stories—not just what’s happening, but the logic and opportunities behind it. 👀🚀
142
·
--
A public blockchain is putting up 100 million tokens just to bring a $3 billion stablecoin into its own ecosystem 🦖
[⚡ 有大动静群里说](https://app.binance.com/uni-qr/JpwCPfBj)
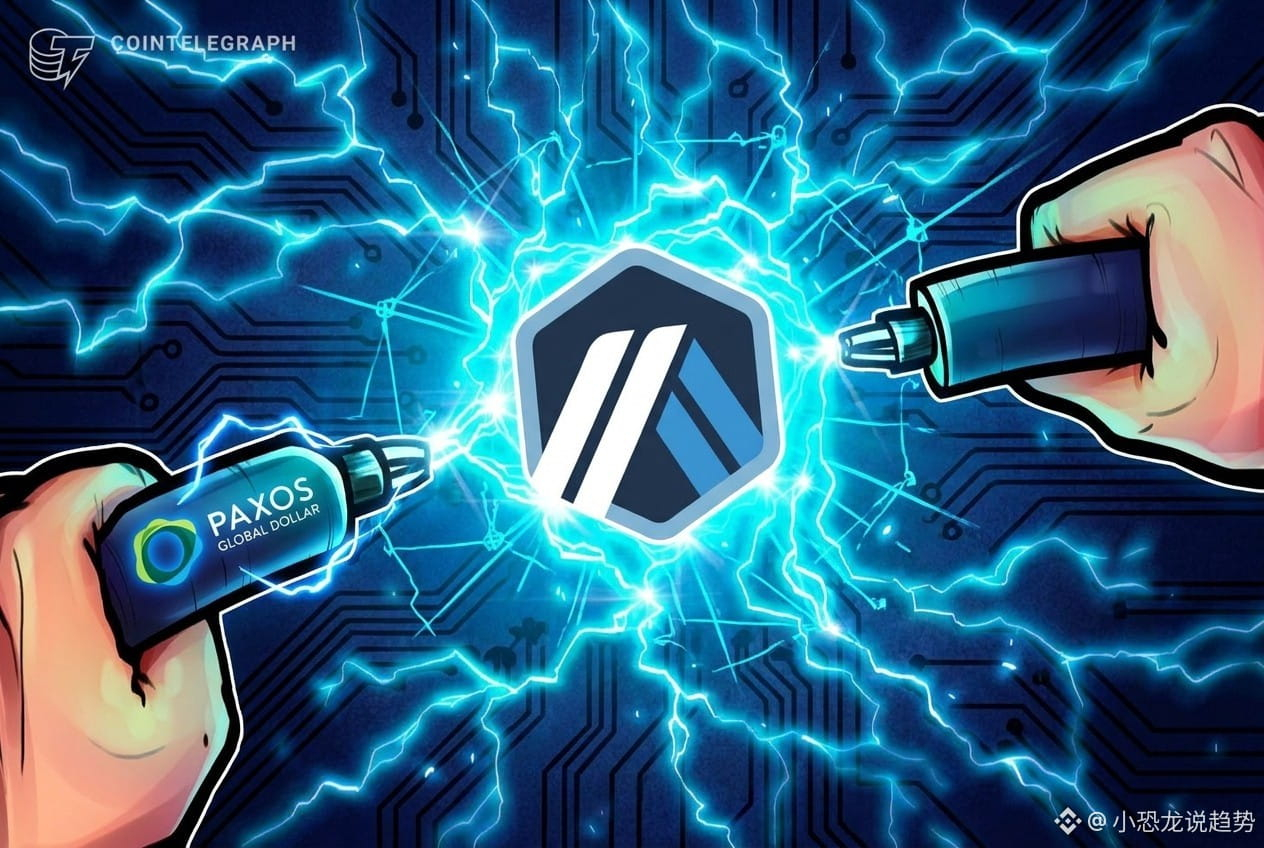
On October 6, USDG, the stablecoin issued by Paxos, officially launched natively on Arbitrum One. Arbitrum also joined the Global Dollar Network, and a proposal submitted to ArbitrumDAO would set aside another 100 million ARB for incentives. Meanwhile, the Layer 2 chain already has around $4 billion in stablecoins on it.
On one hand, the pool is already full. On the other, they’re still trying to pull in a new one. It’s worth taking a closer look at the numbers.
First, some background on USDG. According to DeFiLlama, it’s the world’s seventh-largest stablecoin, with a circulating supply of around $3.09 billion. Most of that supply is concentrated across X Layer, Robinhood Chain, and Solana. Following its launch on Arbitrum One, DeFi protocols including Fluid, Morpho, GMX, and Maple will integrate it; a certain exchange will support deposits and withdrawals, and Stargate will handle cross-chain transfers.
The real big spend is in the proposal: 100 million ARB will go straight into an incentives program, and Arbitrum Treasury assets will also be deployed to provide liquidity for USDG. Projects that integrate the stablecoin can seek support from the Arbitrum Foundation. As a member of the Global Dollar Network, Arbitrum can also earn a share of the revenue USDG generates on the chain.
Why would a chain spend so much to compete for a stablecoin? The answer is asset tokenization ⚖️ Arbitrum is no longer content with just hosting crypto-native applications. It wants to be the foundation for bringing traditional assets on-chain. Robinhood Chain is the clearest example: built using Arbitrum technology, this Layer 2 network only launched its public mainnet in July this year. It’s designed specifically for tokenized real-world and digital assets, with 24/7 trading, lending, and perpetuals all in the mix.
Institutions are already thinking far ahead. Last month, Standard Chartered said that projects like Robinhood Chain could change Arbitrum’s economic model, with 10% of net protocol revenue from on-chain projects flowing back to the network. It even offered a benchmark: tokenized assets could reach $4 trillion by the end of 2028, and under this thesis, ARB could hit $10 by 2030—around 70 times its price at the time.
My take: this isn’t just a chain trying to attract a stablecoin. It’s a battle to win over existing liquidity 💥 Growth in Layer 2 TVL has long since peaked, and TVL bought with subsidies is both the most transparent and the most fragile. 100 million ARB can bring USDG in, but once the incentives taper off, whether the capital stays will depend on whether there’s real demand for settlement and trading on Arbitrum—not on how long the incentives list is.
Two things are worth watching: first, how the 100 million ARB in incentives is spent and over what period; second, whether real capital on Robinhood Chain actually materializes. If there are incentives but no real business, this battle for users will amount to moving money from one hand to the other.
Do you think this strategy of handing out tokens to attract stablecoins will make the pie bigger, or is it just digging a hole for itself? Let’s talk in the comments.
Tap the profile picture to watch the livestream.
Every day, we bring you the latest crypto headlines—not just what’s happening, but the logic and opportunities behind it 👀🚀
A public blockchain is putting up 100 million tokens just to bring a $3 billion stablecoin into its own ecosystem 🦖
⚡ 有大动静群里说
On October 6, USDG, the stablecoin issued by Paxos, officially launched natively on Arbitrum One. Arbitrum also joined the Global Dollar Network, and a proposal submitted to ArbitrumDAO would set aside another 100 million ARB for incentives. Meanwhile, the Layer 2 chain already has around $4 billion in stablecoins on it.
On one hand, the pool is already full. On the other, they’re still trying to pull in a new one. It’s worth taking a closer look at the numbers.
First, some background on USDG. According to DeFiLlama, it’s the world’s seventh-largest stablecoin, with a circulating supply of around $3.09 billion. Most of that supply is concentrated across X Layer, Robinhood Chain, and Solana. Following its launch on Arbitrum One, DeFi protocols including Fluid, Morpho, GMX, and Maple will integrate it; a certain exchange will support deposits and withdrawals, and Stargate will handle cross-chain transfers.
The real big spend is in the proposal: 100 million ARB will go straight into an incentives program, and Arbitrum Treasury assets will also be deployed to provide liquidity for USDG. Projects that integrate the stablecoin can seek support from the Arbitrum Foundation. As a member of the Global Dollar Network, Arbitrum can also earn a share of the revenue USDG generates on the chain.
Why would a chain spend so much to compete for a stablecoin? The answer is asset tokenization ⚖️ Arbitrum is no longer content with just hosting crypto-native applications. It wants to be the foundation for bringing traditional assets on-chain. Robinhood Chain is the clearest example: built using Arbitrum technology, this Layer 2 network only launched its public mainnet in July this year. It’s designed specifically for tokenized real-world and digital assets, with 24/7 trading, lending, and perpetuals all in the mix.
Institutions are already thinking far ahead. Last month, Standard Chartered said that projects like Robinhood Chain could change Arbitrum’s economic model, with 10% of net protocol revenue from on-chain projects flowing back to the network. It even offered a benchmark: tokenized assets could reach $4 trillion by the end of 2028, and under this thesis, ARB could hit $10 by 2030—around 70 times its price at the time.
My take: this isn’t just a chain trying to attract a stablecoin. It’s a battle to win over existing liquidity 💥 Growth in Layer 2 TVL has long since peaked, and TVL bought with subsidies is both the most transparent and the most fragile. 100 million ARB can bring USDG in, but once the incentives taper off, whether the capital stays will depend on whether there’s real demand for settlement and trading on Arbitrum—not on how long the incentives list is.
Two things are worth watching: first, how the 100 million ARB in incentives is spent and over what period; second, whether real capital on Robinhood Chain actually materializes. If there are incentives but no real business, this battle for users will amount to moving money from one hand to the other.
Do you think this strategy of handing out tokens to attract stablecoins will make the pie bigger, or is it just digging a hole for itself? Let’s talk in the comments.
Tap the profile picture to watch the livestream.
Every day, we bring you the latest crypto headlines—not just what’s happening, but the logic and opportunities behind it 👀🚀
⚡ 有大动静群里说
On October 6, USDG, the stablecoin issued by Paxos, officially launched natively on Arbitrum One. Arbitrum also joined the Global Dollar Network, and a proposal submitted to ArbitrumDAO would set aside another 100 million ARB for incentives. Meanwhile, the Layer 2 chain already has around $4 billion in stablecoins on it.
On one hand, the pool is already full. On the other, they’re still trying to pull in a new one. It’s worth taking a closer look at the numbers.
First, some background on USDG. According to DeFiLlama, it’s the world’s seventh-largest stablecoin, with a circulating supply of around $3.09 billion. Most of that supply is concentrated across X Layer, Robinhood Chain, and Solana. Following its launch on Arbitrum One, DeFi protocols including Fluid, Morpho, GMX, and Maple will integrate it; a certain exchange will support deposits and withdrawals, and Stargate will handle cross-chain transfers.
The real big spend is in the proposal: 100 million ARB will go straight into an incentives program, and Arbitrum Treasury assets will also be deployed to provide liquidity for USDG. Projects that integrate the stablecoin can seek support from the Arbitrum Foundation. As a member of the Global Dollar Network, Arbitrum can also earn a share of the revenue USDG generates on the chain.
Why would a chain spend so much to compete for a stablecoin? The answer is asset tokenization ⚖️ Arbitrum is no longer content with just hosting crypto-native applications. It wants to be the foundation for bringing traditional assets on-chain. Robinhood Chain is the clearest example: built using Arbitrum technology, this Layer 2 network only launched its public mainnet in July this year. It’s designed specifically for tokenized real-world and digital assets, with 24/7 trading, lending, and perpetuals all in the mix.
Institutions are already thinking far ahead. Last month, Standard Chartered said that projects like Robinhood Chain could change Arbitrum’s economic model, with 10% of net protocol revenue from on-chain projects flowing back to the network. It even offered a benchmark: tokenized assets could reach $4 trillion by the end of 2028, and under this thesis, ARB could hit $10 by 2030—around 70 times its price at the time.
My take: this isn’t just a chain trying to attract a stablecoin. It’s a battle to win over existing liquidity 💥 Growth in Layer 2 TVL has long since peaked, and TVL bought with subsidies is both the most transparent and the most fragile. 100 million ARB can bring USDG in, but once the incentives taper off, whether the capital stays will depend on whether there’s real demand for settlement and trading on Arbitrum—not on how long the incentives list is.
Two things are worth watching: first, how the 100 million ARB in incentives is spent and over what period; second, whether real capital on Robinhood Chain actually materializes. If there are incentives but no real business, this battle for users will amount to moving money from one hand to the other.
Do you think this strategy of handing out tokens to attract stablecoins will make the pie bigger, or is it just digging a hole for itself? Let’s talk in the comments.
Tap the profile picture to watch the livestream.
Every day, we bring you the latest crypto headlines—not just what’s happening, but the logic and opportunities behind it 👀🚀
142
·
--
#美联储10月维持利率概率升至82.3%
116 The bond market’s fear gauge has quietly climbed to a 1.5-year high, while Bitcoin and U.S. stocks are still sitting near their calmest levels of the year 🦖
[🕐 最新解读群里更新](https://app.binance.com/uni-qr/JpwCPfBj)
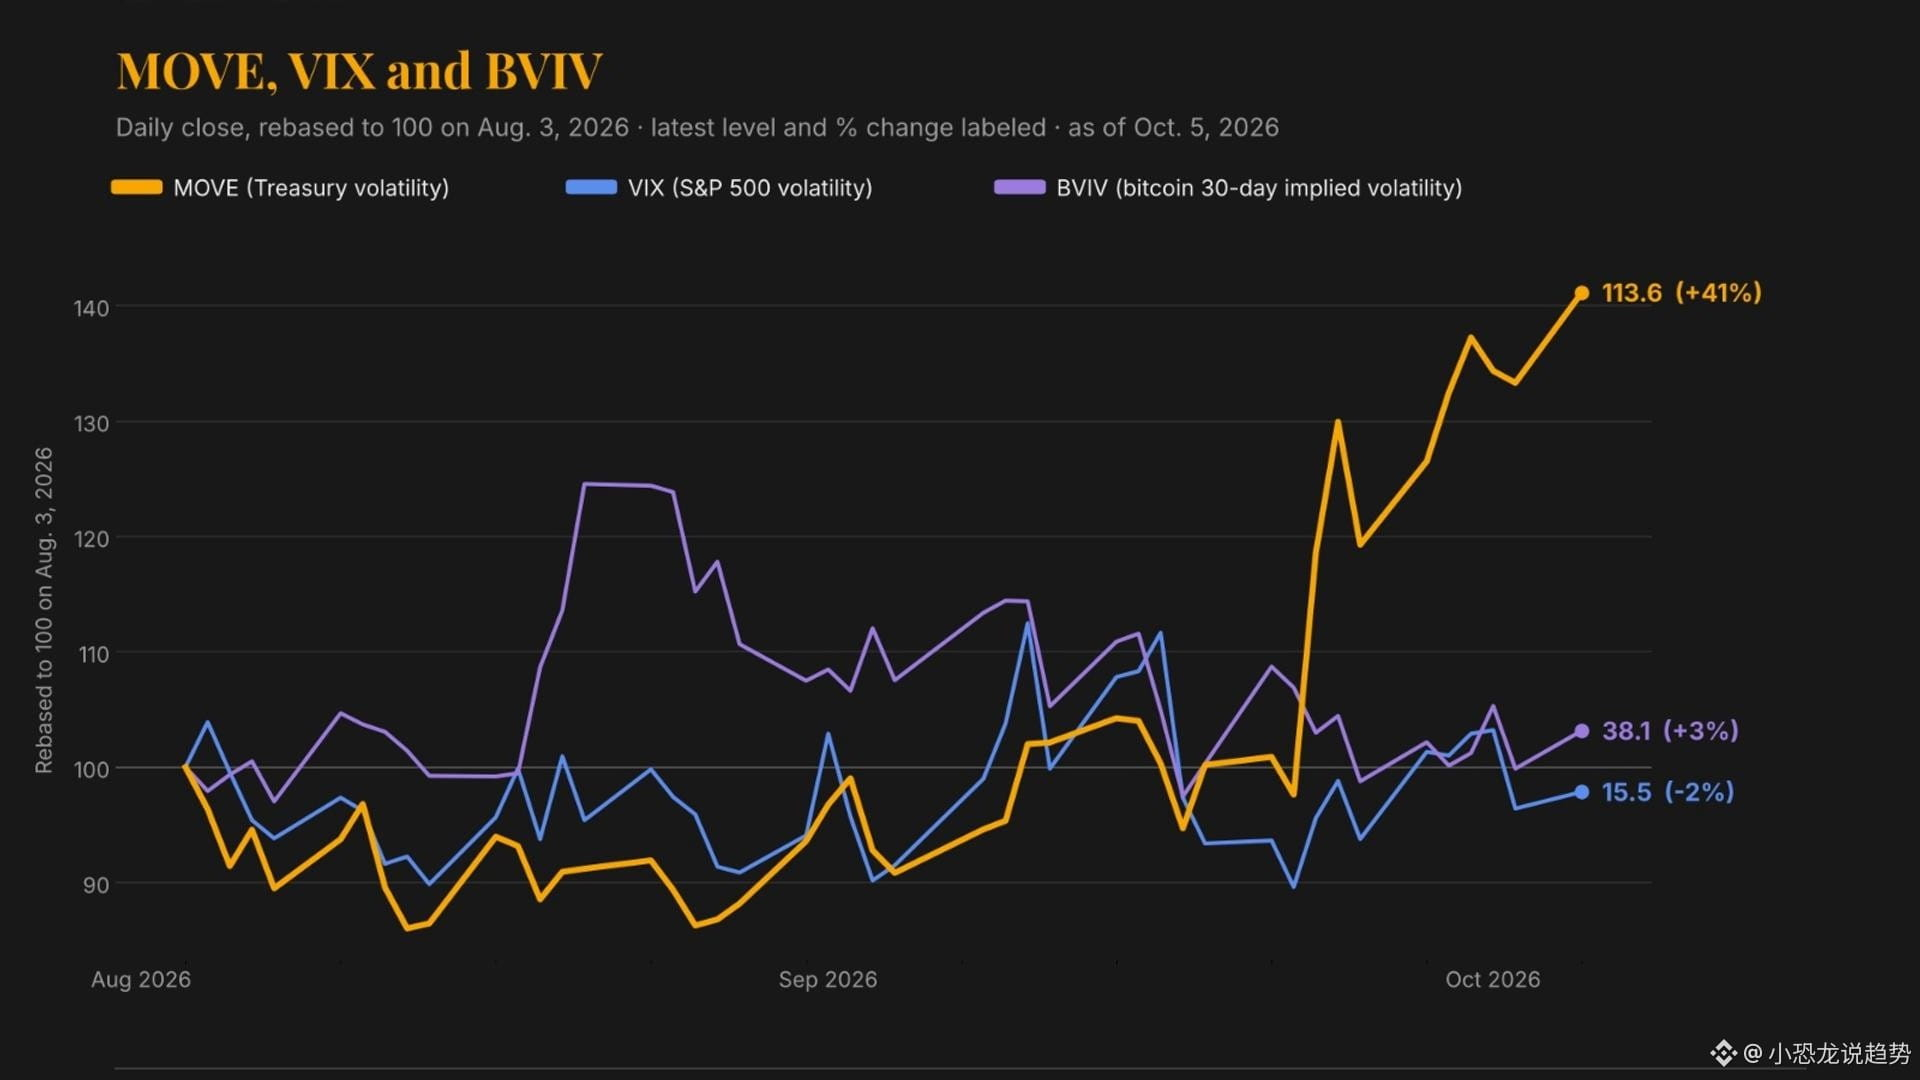
On October 6, CoinDesk spotted an unusual pattern: MOVE, the bond market’s version of the fear gauge, has surged to around 116, just shy of its March peak. That’s its highest level since April 2025. It jumped 46% in June alone, while Bitcoin’s 30-day implied volatility, BVIV, and the S&P 500’s VIX are both hovering near their lowest levels of the year.
MOVE stands for the ICE BofA U.S. Bond Market Option Volatility Estimate. It tracks options on 2-, 5-, 10- and 30-year U.S. Treasuries, with the 10-year options carrying the most weight. Put simply, it measures how much traders think Treasury yields will swing over the next month—not which way they’ll move, just how far.
Why pay more attention to it than to the VIX? Because Treasuries are the hardest collateral in the global financial system. When yields swing sharply, global financing costs rise and risk premiums climb, prompting money to instinctively retreat to safer places ⚠️ Kurt S. Altrichter, author of the wealth management firm RiskSIGNAL Report, put it plainly: when geopolitical conflicts erupted in 2022, 2023 and this year, MOVE was the first to move. Stocks are often the last to get the message.
Corporate bonds have already started to catch up. The Chicago Board Options Exchange (Cboe) says volatility in investment-grade and high-yield corporate bonds was still near historic lows two weeks ago—at the 6th and 11th percentiles, respectively. Now it has surged to the 79th and 84th percentiles.
But readings elsewhere tell a completely different story. Interest rate futures have priced in an 82.3% chance that the Fed will hold rates steady in October. Treasury yields have pulled back from their highest levels since 2002, oil has fallen below $100 a barrel again, and Bitcoin is moving sideways around $86,000, barely budging in 24 hours 📉 Last week, it was knocked back for the third time at $87,000.
My interpretation is simple: the bond market is the plumbing of the whole building, and leaks often show up there first. Bitcoin and U.S. stocks look stable right now, but that’s more likely because volatility is being suppressed—not because the risks have disappeared. If MOVE really breaks above its March high, volatility in crypto and stocks will probably catch up. FxPro has also laid out some key levels: if Bitcoin falls below $84,000, control shifts to the bears. If it then loses the lows around $83,000, $80,000 could come into range quickly.
Bitcoin is still 32% below its all-time high of $126,080 on October 6 last year. Whether that cushion is enough depends on what this week’s minutes from the Fed’s last meeting say.
Do you think this calm is the quiet before the storm, or have markets really stabilized? Share your thoughts in the comments.
Tap the profile picture to watch the livestream.
Every day, we bring you the latest on Bitcoin and the Fed—not just what’s happening, but the logic and opportunities behind the headlines 👀🚀
#美联储10月维持利率概率升至82.3%
116 The bond market’s fear gauge has quietly climbed to a 1.5-year high, while Bitcoin and U.S. stocks are still sitting near their calmest levels of the year 🦖
🕐 最新解读群里更新
On October 6, CoinDesk spotted an unusual pattern: MOVE, the bond market’s version of the fear gauge, has surged to around 116, just shy of its March peak. That’s its highest level since April 2025. It jumped 46% in June alone, while Bitcoin’s 30-day implied volatility, BVIV, and the S&P 500’s VIX are both hovering near their lowest levels of the year.
MOVE stands for the ICE BofA U.S. Bond Market Option Volatility Estimate. It tracks options on 2-, 5-, 10- and 30-year U.S. Treasuries, with the 10-year options carrying the most weight. Put simply, it measures how much traders think Treasury yields will swing over the next month—not which way they’ll move, just how far.
Why pay more attention to it than to the VIX? Because Treasuries are the hardest collateral in the global financial system. When yields swing sharply, global financing costs rise and risk premiums climb, prompting money to instinctively retreat to safer places ⚠️ Kurt S. Altrichter, author of the wealth management firm RiskSIGNAL Report, put it plainly: when geopolitical conflicts erupted in 2022, 2023 and this year, MOVE was the first to move. Stocks are often the last to get the message.
Corporate bonds have already started to catch up. The Chicago Board Options Exchange (Cboe) says volatility in investment-grade and high-yield corporate bonds was still near historic lows two weeks ago—at the 6th and 11th percentiles, respectively. Now it has surged to the 79th and 84th percentiles.
But readings elsewhere tell a completely different story. Interest rate futures have priced in an 82.3% chance that the Fed will hold rates steady in October. Treasury yields have pulled back from their highest levels since 2002, oil has fallen below $100 a barrel again, and Bitcoin is moving sideways around $86,000, barely budging in 24 hours 📉 Last week, it was knocked back for the third time at $87,000.
My interpretation is simple: the bond market is the plumbing of the whole building, and leaks often show up there first. Bitcoin and U.S. stocks look stable right now, but that’s more likely because volatility is being suppressed—not because the risks have disappeared. If MOVE really breaks above its March high, volatility in crypto and stocks will probably catch up. FxPro has also laid out some key levels: if Bitcoin falls below $84,000, control shifts to the bears. If it then loses the lows around $83,000, $80,000 could come into range quickly.
Bitcoin is still 32% below its all-time high of $126,080 on October 6 last year. Whether that cushion is enough depends on what this week’s minutes from the Fed’s last meeting say.
Do you think this calm is the quiet before the storm, or have markets really stabilized? Share your thoughts in the comments.
Tap the profile picture to watch the livestream.
Every day, we bring you the latest on Bitcoin and the Fed—not just what’s happening, but the logic and opportunities behind the headlines 👀🚀
116 The bond market’s fear gauge has quietly climbed to a 1.5-year high, while Bitcoin and U.S. stocks are still sitting near their calmest levels of the year 🦖
🕐 最新解读群里更新
On October 6, CoinDesk spotted an unusual pattern: MOVE, the bond market’s version of the fear gauge, has surged to around 116, just shy of its March peak. That’s its highest level since April 2025. It jumped 46% in June alone, while Bitcoin’s 30-day implied volatility, BVIV, and the S&P 500’s VIX are both hovering near their lowest levels of the year.
MOVE stands for the ICE BofA U.S. Bond Market Option Volatility Estimate. It tracks options on 2-, 5-, 10- and 30-year U.S. Treasuries, with the 10-year options carrying the most weight. Put simply, it measures how much traders think Treasury yields will swing over the next month—not which way they’ll move, just how far.
Why pay more attention to it than to the VIX? Because Treasuries are the hardest collateral in the global financial system. When yields swing sharply, global financing costs rise and risk premiums climb, prompting money to instinctively retreat to safer places ⚠️ Kurt S. Altrichter, author of the wealth management firm RiskSIGNAL Report, put it plainly: when geopolitical conflicts erupted in 2022, 2023 and this year, MOVE was the first to move. Stocks are often the last to get the message.
Corporate bonds have already started to catch up. The Chicago Board Options Exchange (Cboe) says volatility in investment-grade and high-yield corporate bonds was still near historic lows two weeks ago—at the 6th and 11th percentiles, respectively. Now it has surged to the 79th and 84th percentiles.
But readings elsewhere tell a completely different story. Interest rate futures have priced in an 82.3% chance that the Fed will hold rates steady in October. Treasury yields have pulled back from their highest levels since 2002, oil has fallen below $100 a barrel again, and Bitcoin is moving sideways around $86,000, barely budging in 24 hours 📉 Last week, it was knocked back for the third time at $87,000.
My interpretation is simple: the bond market is the plumbing of the whole building, and leaks often show up there first. Bitcoin and U.S. stocks look stable right now, but that’s more likely because volatility is being suppressed—not because the risks have disappeared. If MOVE really breaks above its March high, volatility in crypto and stocks will probably catch up. FxPro has also laid out some key levels: if Bitcoin falls below $84,000, control shifts to the bears. If it then loses the lows around $83,000, $80,000 could come into range quickly.
Bitcoin is still 32% below its all-time high of $126,080 on October 6 last year. Whether that cushion is enough depends on what this week’s minutes from the Fed’s last meeting say.
Do you think this calm is the quiet before the storm, or have markets really stabilized? Share your thoughts in the comments.
Tap the profile picture to watch the livestream.
Every day, we bring you the latest on Bitcoin and the Fed—not just what’s happening, but the logic and opportunities behind the headlines 👀🚀
161
·
--
At 26, he called himself a godfather and swindled Meta out of $37 million. He got an additional 78-month sentence—but didn’t spend a single extra day behind bars 🦖
[📣 盘面异动群里喊](https://app.binance.com/uni-qr/JpwCPfBj)
On October 5, the U.S. Attorney’s Office for the Central District of California announced that Adam Iza had been sentenced to an additional 78 months in prison and ordered to pay $23.4 million in restitution. But last month, he was sentenced to 15 years for a kidnapping and attempted Bitcoin robbery. The sentences will run concurrently, meaning the extra six and a half years will add virtually no time to his actual prison term.
First, here’s the background on him. He’s 26 and calls himself a godfather. He had already been in custody since September 2024 and pleaded guilty in January 2025 to conspiracy to deprive others of their rights, wire fraud, and tax evasion. This sentencing simply settles all the outstanding charges at once.
The first part involves $37 million in Meta advertising fraud. Starting in December 2020, he gained access to Meta Business Manager accounts and the lines of credit attached to them, then sold that access to advertising agencies. Advertisers were billed for ads that had never actually run. When the bills came to light, Meta had to issue refunds and absorb the losses. About $37 million flowed into companies he controlled ⚖️
The second part is even more outrageous. Between August 2021 and April 2022, he hired off-duty Los Angeles County sheriff’s deputies as private security. In his plea agreement, he admitted conspiring with them to access internal law enforcement records and other people’s private data to track down people with whom he had financial disputes. They even obtained court-authorized search warrants and showed up at people’s homes 🚔
Five former deputies have now been convicted for working for him. On September 28, 42-year-old Eric Chase Saavedra was sentenced to 21 months; 45-year-old Michael David Coberg got 63 months; 34-year-old Scott Allen Simpkins got 18 months; and 45-year-old David Anthony Rodriguez got one year. Prosecutors put it bluntly in their sentencing memo: the wealthy can’t buy search warrants, arrests, or badges—and they can’t buy guns to settle personal grudges.
Where did the rest of the money go? He admitted using crypto asset custodians to hide funds and evade tax reporting. That’s also the only direct connection between this case and the crypto world 💰
In my view, the most thought-provoking part of this case is that the on-chain side is precisely the least important. People are always saying crypto is anonymous, but what ultimately brought him down were real people, real accounts, real badges, and Meta’s clear billing records. The on-chain transactions were just the final link. Once the off-chain links at the start of the chain broke, the whole thing was exposed 🔒
For the industry, every time a case like this makes the headlines, it reinforces the stereotype that crypto is a tool for crime. Yet the evidence that secured the convictions wasn’t on-chain at all. That may be one of the most frustrating things for people in the industry.
Do you think running the sentences concurrently is adequate punishment, or does it amount to a discount? Let’s talk in the comments.
Tap the profile picture to watch the livestream.
Every day, I bring you the latest on crypto-related legal cases—not just what happened, but the logic and opportunities behind the headlines 👀🚀
At 26, he called himself a godfather and swindled Meta out of $37 million. He got an additional 78-month sentence—but didn’t spend a single extra day behind bars 🦖
📣 盘面异动群里喊
On October 5, the U.S. Attorney’s Office for the Central District of California announced that Adam Iza had been sentenced to an additional 78 months in prison and ordered to pay $23.4 million in restitution. But last month, he was sentenced to 15 years for a kidnapping and attempted Bitcoin robbery. The sentences will run concurrently, meaning the extra six and a half years will add virtually no time to his actual prison term.
First, here’s the background on him. He’s 26 and calls himself a godfather. He had already been in custody since September 2024 and pleaded guilty in January 2025 to conspiracy to deprive others of their rights, wire fraud, and tax evasion. This sentencing simply settles all the outstanding charges at once.
The first part involves $37 million in Meta advertising fraud. Starting in December 2020, he gained access to Meta Business Manager accounts and the lines of credit attached to them, then sold that access to advertising agencies. Advertisers were billed for ads that had never actually run. When the bills came to light, Meta had to issue refunds and absorb the losses. About $37 million flowed into companies he controlled ⚖️
The second part is even more outrageous. Between August 2021 and April 2022, he hired off-duty Los Angeles County sheriff’s deputies as private security. In his plea agreement, he admitted conspiring with them to access internal law enforcement records and other people’s private data to track down people with whom he had financial disputes. They even obtained court-authorized search warrants and showed up at people’s homes 🚔
Five former deputies have now been convicted for working for him. On September 28, 42-year-old Eric Chase Saavedra was sentenced to 21 months; 45-year-old Michael David Coberg got 63 months; 34-year-old Scott Allen Simpkins got 18 months; and 45-year-old David Anthony Rodriguez got one year. Prosecutors put it bluntly in their sentencing memo: the wealthy can’t buy search warrants, arrests, or badges—and they can’t buy guns to settle personal grudges.
Where did the rest of the money go? He admitted using crypto asset custodians to hide funds and evade tax reporting. That’s also the only direct connection between this case and the crypto world 💰
In my view, the most thought-provoking part of this case is that the on-chain side is precisely the least important. People are always saying crypto is anonymous, but what ultimately brought him down were real people, real accounts, real badges, and Meta’s clear billing records. The on-chain transactions were just the final link. Once the off-chain links at the start of the chain broke, the whole thing was exposed 🔒
For the industry, every time a case like this makes the headlines, it reinforces the stereotype that crypto is a tool for crime. Yet the evidence that secured the convictions wasn’t on-chain at all. That may be one of the most frustrating things for people in the industry.
Do you think running the sentences concurrently is adequate punishment, or does it amount to a discount? Let’s talk in the comments.
Tap the profile picture to watch the livestream.
Every day, I bring you the latest on crypto-related legal cases—not just what happened, but the logic and opportunities behind the headlines 👀🚀
📣 盘面异动群里喊
On October 5, the U.S. Attorney’s Office for the Central District of California announced that Adam Iza had been sentenced to an additional 78 months in prison and ordered to pay $23.4 million in restitution. But last month, he was sentenced to 15 years for a kidnapping and attempted Bitcoin robbery. The sentences will run concurrently, meaning the extra six and a half years will add virtually no time to his actual prison term.
First, here’s the background on him. He’s 26 and calls himself a godfather. He had already been in custody since September 2024 and pleaded guilty in January 2025 to conspiracy to deprive others of their rights, wire fraud, and tax evasion. This sentencing simply settles all the outstanding charges at once.
The first part involves $37 million in Meta advertising fraud. Starting in December 2020, he gained access to Meta Business Manager accounts and the lines of credit attached to them, then sold that access to advertising agencies. Advertisers were billed for ads that had never actually run. When the bills came to light, Meta had to issue refunds and absorb the losses. About $37 million flowed into companies he controlled ⚖️
The second part is even more outrageous. Between August 2021 and April 2022, he hired off-duty Los Angeles County sheriff’s deputies as private security. In his plea agreement, he admitted conspiring with them to access internal law enforcement records and other people’s private data to track down people with whom he had financial disputes. They even obtained court-authorized search warrants and showed up at people’s homes 🚔
Five former deputies have now been convicted for working for him. On September 28, 42-year-old Eric Chase Saavedra was sentenced to 21 months; 45-year-old Michael David Coberg got 63 months; 34-year-old Scott Allen Simpkins got 18 months; and 45-year-old David Anthony Rodriguez got one year. Prosecutors put it bluntly in their sentencing memo: the wealthy can’t buy search warrants, arrests, or badges—and they can’t buy guns to settle personal grudges.
Where did the rest of the money go? He admitted using crypto asset custodians to hide funds and evade tax reporting. That’s also the only direct connection between this case and the crypto world 💰
In my view, the most thought-provoking part of this case is that the on-chain side is precisely the least important. People are always saying crypto is anonymous, but what ultimately brought him down were real people, real accounts, real badges, and Meta’s clear billing records. The on-chain transactions were just the final link. Once the off-chain links at the start of the chain broke, the whole thing was exposed 🔒
For the industry, every time a case like this makes the headlines, it reinforces the stereotype that crypto is a tool for crime. Yet the evidence that secured the convictions wasn’t on-chain at all. That may be one of the most frustrating things for people in the industry.
Do you think running the sentences concurrently is adequate punishment, or does it amount to a discount? Let’s talk in the comments.
Tap the profile picture to watch the livestream.
Every day, I bring you the latest on crypto-related legal cases—not just what happened, but the logic and opportunities behind the headlines 👀🚀

19
·
--
#以太坊q3涨70%流动性下降
Ethereum surged 70% in Q3, but its order-book depth is now just 40% of Bitcoin’s 🦖
[📊 进群看每日策略](https://app.binance.com/uni-qr/JpwCPfBj)
Ethereum rose 70% in Q3, outperforming Bitcoin’s 42% gain. But a CoinGecko report compiled by TechFlow reveals a striking contrast: the asset that rose the most is seeing its order book get thinner.
CoinGecko measured the median daily market depth for Ethereum from July 6 to September 30. It was only 35% to 45% of Bitcoin’s. At the same time last year, the ratio was at least 60%. 📉
The numbers make it even clearer: within 0.15% of the market price, Ethereum’s depth was just $13 million to $14 million. In other words, a trade worth tens of millions of dollars could move the price by 0.15%. It’s getting harder for large orders to enter and exit smoothly without making waves. ⚠️
Ethereum isn’t the only one seeing thinner order books. SOL’s depth within 2% of the market price has fallen from about $28 million on each side of the order book last year to around $20 million now. This 2% depth is precisely what determines how much selling or buying pressure the market can absorb during a sharp move. 🐋
By comparison, XRP’s total depth has remained steady at around $30 million, with about $18 million in buy orders and $14 million in sell orders—a clear imbalance. More interestingly, XRP’s market cap is about 40% higher than SOL’s, yet its 2% depth is still lower. One reason is that SOL’s average daily trading volume is 25% higher than XRP’s.
Put simply, a 70% gain doesn’t mean stronger market support. Price gains reflect sentiment; depth is the foundation. A thin order book has a straightforward consequence: the same amount of capital can cause a bigger swing. It feels great on the way up, but if a large sell order hits, prices can fall faster than most people can trigger their stop-losses.
Adding to the backdrop, spot Ethereum ETFs saw net outflows of about $51 million on Monday, marking five consecutive trading days of outflows. The total outflow over those five days was about $206 million. Meanwhile, the 10-year U.S. Treasury yield is above 5%, and risk-free assets are competing with risk assets for capital.
What I think is worth watching isn’t how much higher ETH can go, but whether its market depth can recover. If prices keep rising without depth returning, volatility in this rally will increase, and pullbacks could bring a string of further drops.
Do you hold ETH or SOL? Do you think this rally is driven by real demand, or is it just a flash of excitement in a thin market?
I bring you the latest crypto market trends every day—not just what’s happening in the news, but also the logic and opportunities behind it. 👀🚀
Tap my profile picture to watch the livestream
#以太坊q3涨70%流动性下降
Ethereum surged 70% in Q3, but its order-book depth is now just 40% of Bitcoin’s 🦖
📊 进群看每日策略
Ethereum rose 70% in Q3, outperforming Bitcoin’s 42% gain. But a CoinGecko report compiled by TechFlow reveals a striking contrast: the asset that rose the most is seeing its order book get thinner.
CoinGecko measured the median daily market depth for Ethereum from July 6 to September 30. It was only 35% to 45% of Bitcoin’s. At the same time last year, the ratio was at least 60%. 📉
The numbers make it even clearer: within 0.15% of the market price, Ethereum’s depth was just $13 million to $14 million. In other words, a trade worth tens of millions of dollars could move the price by 0.15%. It’s getting harder for large orders to enter and exit smoothly without making waves. ⚠️
Ethereum isn’t the only one seeing thinner order books. SOL’s depth within 2% of the market price has fallen from about $28 million on each side of the order book last year to around $20 million now. This 2% depth is precisely what determines how much selling or buying pressure the market can absorb during a sharp move. 🐋
By comparison, XRP’s total depth has remained steady at around $30 million, with about $18 million in buy orders and $14 million in sell orders—a clear imbalance. More interestingly, XRP’s market cap is about 40% higher than SOL’s, yet its 2% depth is still lower. One reason is that SOL’s average daily trading volume is 25% higher than XRP’s.
Put simply, a 70% gain doesn’t mean stronger market support. Price gains reflect sentiment; depth is the foundation. A thin order book has a straightforward consequence: the same amount of capital can cause a bigger swing. It feels great on the way up, but if a large sell order hits, prices can fall faster than most people can trigger their stop-losses.
Adding to the backdrop, spot Ethereum ETFs saw net outflows of about $51 million on Monday, marking five consecutive trading days of outflows. The total outflow over those five days was about $206 million. Meanwhile, the 10-year U.S. Treasury yield is above 5%, and risk-free assets are competing with risk assets for capital.
What I think is worth watching isn’t how much higher ETH can go, but whether its market depth can recover. If prices keep rising without depth returning, volatility in this rally will increase, and pullbacks could bring a string of further drops.
Do you hold ETH or SOL? Do you think this rally is driven by real demand, or is it just a flash of excitement in a thin market?
I bring you the latest crypto market trends every day—not just what’s happening in the news, but also the logic and opportunities behind it. 👀🚀
Tap my profile picture to watch the livestream
Ethereum surged 70% in Q3, but its order-book depth is now just 40% of Bitcoin’s 🦖
📊 进群看每日策略
Ethereum rose 70% in Q3, outperforming Bitcoin’s 42% gain. But a CoinGecko report compiled by TechFlow reveals a striking contrast: the asset that rose the most is seeing its order book get thinner.
CoinGecko measured the median daily market depth for Ethereum from July 6 to September 30. It was only 35% to 45% of Bitcoin’s. At the same time last year, the ratio was at least 60%. 📉
The numbers make it even clearer: within 0.15% of the market price, Ethereum’s depth was just $13 million to $14 million. In other words, a trade worth tens of millions of dollars could move the price by 0.15%. It’s getting harder for large orders to enter and exit smoothly without making waves. ⚠️
Ethereum isn’t the only one seeing thinner order books. SOL’s depth within 2% of the market price has fallen from about $28 million on each side of the order book last year to around $20 million now. This 2% depth is precisely what determines how much selling or buying pressure the market can absorb during a sharp move. 🐋
By comparison, XRP’s total depth has remained steady at around $30 million, with about $18 million in buy orders and $14 million in sell orders—a clear imbalance. More interestingly, XRP’s market cap is about 40% higher than SOL’s, yet its 2% depth is still lower. One reason is that SOL’s average daily trading volume is 25% higher than XRP’s.
Put simply, a 70% gain doesn’t mean stronger market support. Price gains reflect sentiment; depth is the foundation. A thin order book has a straightforward consequence: the same amount of capital can cause a bigger swing. It feels great on the way up, but if a large sell order hits, prices can fall faster than most people can trigger their stop-losses.
Adding to the backdrop, spot Ethereum ETFs saw net outflows of about $51 million on Monday, marking five consecutive trading days of outflows. The total outflow over those five days was about $206 million. Meanwhile, the 10-year U.S. Treasury yield is above 5%, and risk-free assets are competing with risk assets for capital.
What I think is worth watching isn’t how much higher ETH can go, but whether its market depth can recover. If prices keep rising without depth returning, volatility in this rally will increase, and pullbacks could bring a string of further drops.
Do you hold ETH or SOL? Do you think this rally is driven by real demand, or is it just a flash of excitement in a thin market?
I bring you the latest crypto market trends every day—not just what’s happening in the news, but also the logic and opportunities behind it. 👀🚀
Tap my profile picture to watch the livestream

607
·
--
Long-term holders have been selling for 7 straight weeks. Last week, they sold 73,400 Bitcoin in one go, yet the price keeps climbing 🦖
[🔎 进群看完整分析](https://app.binance.com/uni-qr/JpwCPfBj)
The latest data from on-chain analyst Axel Adler shows that the Long-Term Holder Position Change metric turned negative on August 17. By September 28, it had widened to a reduction of 73,400 BTC. Just a week earlier, the figure was only 1,100—meaning it grew more than 60-fold in seven days.
Looking at the bigger picture, this metric stayed positive from February through early August this year. In May, long-term holders even added 1.2 million BTC in a single month. The last time they sold on a large scale was November 2025, when they offloaded around 1.07 million BTC in one go. So this latest round of selling is less than a tenth of that 🐋
We also have data on whether they’re selling at a profit. The Long-Term Holder SOPR rose to 1.24 on September 21, its highest level since January, and was still at 1.18 on September 28. That means the coins moved during this period realized an 18% profit relative to their cost basis. In other words, this isn’t panic selling—it’s orderly profit-taking.
What I care more about isn’t how much they’re selling, but whether buyers can absorb it. The price is still rising, which suggests that fresh demand is soaking up this supply. On-chain analysts have set out a specific warning signal: if selling climbs back to the hundreds-of-thousands-of-coins range while the price stops rising, that would indicate the market’s ability to absorb the supply is starting to fail ⚠️
Put another way, long-term holders selling isn’t, by itself, a signal that the market has peaked. It’s the combination of their selling pressure and weakening demand that matters. We haven’t seen both at the same time yet, so this looks more like a changing of hands than an exit.
Do you think these 7 weeks represent normal turnover, or are smart money investors getting out early? Share your take in the comments.
Tap the profile picture to watch the livestream.
Every day, we bring you the latest Bitcoin on-chain data—not just what’s happening in the news, but also the logic and opportunities behind it 👀🚀
Long-term holders have been selling for 7 straight weeks. Last week, they sold 73,400 Bitcoin in one go, yet the price keeps climbing 🦖
🔎 进群看完整分析
The latest data from on-chain analyst Axel Adler shows that the Long-Term Holder Position Change metric turned negative on August 17. By September 28, it had widened to a reduction of 73,400 BTC. Just a week earlier, the figure was only 1,100—meaning it grew more than 60-fold in seven days.
Looking at the bigger picture, this metric stayed positive from February through early August this year. In May, long-term holders even added 1.2 million BTC in a single month. The last time they sold on a large scale was November 2025, when they offloaded around 1.07 million BTC in one go. So this latest round of selling is less than a tenth of that 🐋
We also have data on whether they’re selling at a profit. The Long-Term Holder SOPR rose to 1.24 on September 21, its highest level since January, and was still at 1.18 on September 28. That means the coins moved during this period realized an 18% profit relative to their cost basis. In other words, this isn’t panic selling—it’s orderly profit-taking.
What I care more about isn’t how much they’re selling, but whether buyers can absorb it. The price is still rising, which suggests that fresh demand is soaking up this supply. On-chain analysts have set out a specific warning signal: if selling climbs back to the hundreds-of-thousands-of-coins range while the price stops rising, that would indicate the market’s ability to absorb the supply is starting to fail ⚠️
Put another way, long-term holders selling isn’t, by itself, a signal that the market has peaked. It’s the combination of their selling pressure and weakening demand that matters. We haven’t seen both at the same time yet, so this looks more like a changing of hands than an exit.
Do you think these 7 weeks represent normal turnover, or are smart money investors getting out early? Share your take in the comments.
Tap the profile picture to watch the livestream.
Every day, we bring you the latest Bitcoin on-chain data—not just what’s happening in the news, but also the logic and opportunities behind it 👀🚀
🔎 进群看完整分析
The latest data from on-chain analyst Axel Adler shows that the Long-Term Holder Position Change metric turned negative on August 17. By September 28, it had widened to a reduction of 73,400 BTC. Just a week earlier, the figure was only 1,100—meaning it grew more than 60-fold in seven days.
Looking at the bigger picture, this metric stayed positive from February through early August this year. In May, long-term holders even added 1.2 million BTC in a single month. The last time they sold on a large scale was November 2025, when they offloaded around 1.07 million BTC in one go. So this latest round of selling is less than a tenth of that 🐋
We also have data on whether they’re selling at a profit. The Long-Term Holder SOPR rose to 1.24 on September 21, its highest level since January, and was still at 1.18 on September 28. That means the coins moved during this period realized an 18% profit relative to their cost basis. In other words, this isn’t panic selling—it’s orderly profit-taking.
What I care more about isn’t how much they’re selling, but whether buyers can absorb it. The price is still rising, which suggests that fresh demand is soaking up this supply. On-chain analysts have set out a specific warning signal: if selling climbs back to the hundreds-of-thousands-of-coins range while the price stops rising, that would indicate the market’s ability to absorb the supply is starting to fail ⚠️
Put another way, long-term holders selling isn’t, by itself, a signal that the market has peaked. It’s the combination of their selling pressure and weakening demand that matters. We haven’t seen both at the same time yet, so this looks more like a changing of hands than an exit.
Do you think these 7 weeks represent normal turnover, or are smart money investors getting out early? Share your take in the comments.
Tap the profile picture to watch the livestream.
Every day, we bring you the latest Bitcoin on-chain data—not just what’s happening in the news, but also the logic and opportunities behind it 👀🚀
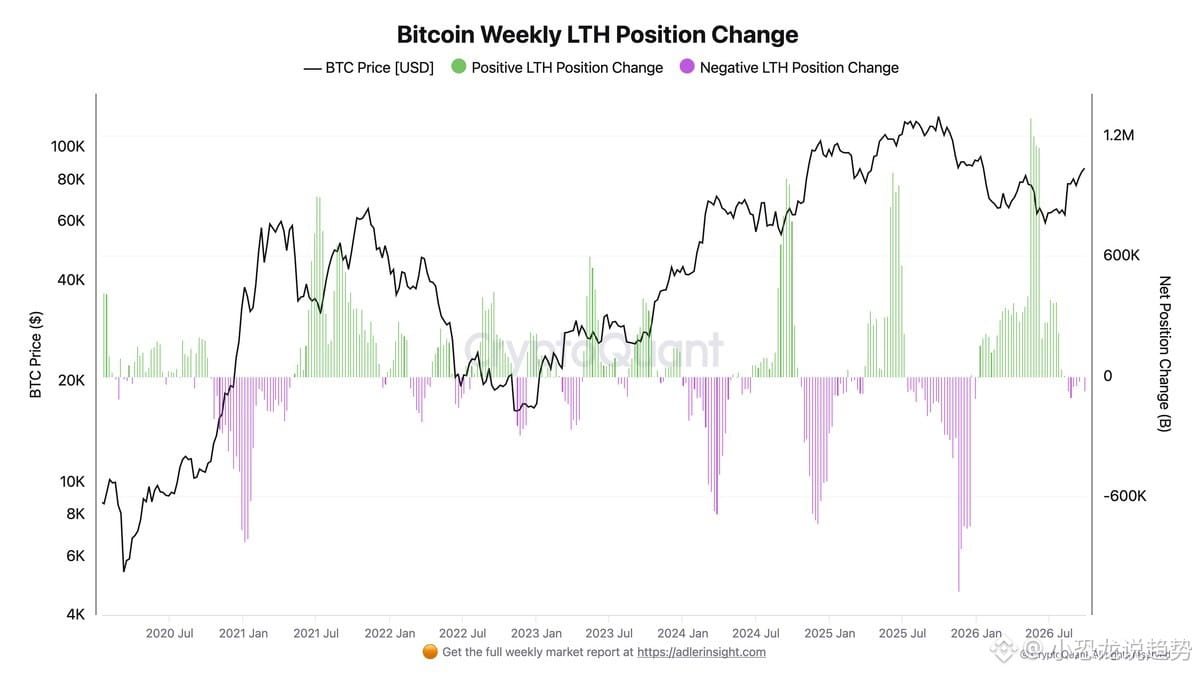
6
·
--
Bitcoin futures leverage fell by $1.4 billion in a week, but spot buyers stepped in to take its place 🦖
[🗣️ 你的看法呢,群里说](https://app.binance.com/uni-qr/JpwCPfBj)
A weekly snapshot from on-chain data firm Glassnode, as of October 4, shows that Bitcoin futures open interest fell from $38 billion to $36.6 billion—a $1.4 billion drop in a week. This is leveraged capital actively cooling off, rather than being forced to close positions after a price crash.
More important is where the money is coming from. Spot cumulative volume delta flipped from negative $102.8 million to positive $33.2 million. In other words, trading during this period shifted from being seller-led to buyer-led. Spot buyers are stepping in to absorb what’s leaving futures 📉
Meanwhile, the longs still in the market are continuing to pay. Funding payments rose from $926,400 to $1.5 million, showing that they’d rather pay a premium than give up their positions. Leveraged funds that had previously turned net short in CME Bitcoin futures seem to have been caught off guard this time around.
Put simply, this is the part many people miss: falling open interest may intuitively seem bearish, but at a point like this, it looks more like a layer of speculative froth being squeezed out of the market. The key is to distinguish between two things: leverage exiting, and spot taking over. The former means less profit from volatility; the latter determines whether the price has a floor.
There’s also something to be cautious about. The share of fast-moving capital—that is, coins that have moved recently—rose from 18.9% to 19.5%. The ratio of short-term holders’ supply to long-term holders’ supply also increased from 13.7% to 14.2%. In plain terms, more and more coins are ending up in the hands of people who won’t hold them for long. Market participation is increasing, but the stability of the coin supply is declining ⚙️
My view: what matters this time isn’t the price, but two figures. First, can spot cumulative volume delta stay positive? That’s the clearest evidence that real money is continuing to flow in. Second, will the share of fast-moving capital keep climbing? If it gets too high, even strong spot buying could be hit by a wave of short-term selling at some point.
Do you think this is a firmer floor after leverage has retreated, or a false sense of stability built on short-term holders’ coins? Let’s discuss in the comments 💬
Tap the profile picture to watch the livestream
Every day, I’ll help you follow the latest Bitcoin developments—not just what’s happening, but also the logic and opportunities behind the headlines 👀🚀
Bitcoin futures leverage fell by $1.4 billion in a week, but spot buyers stepped in to take its place 🦖
🗣️ 你的看法呢,群里说
A weekly snapshot from on-chain data firm Glassnode, as of October 4, shows that Bitcoin futures open interest fell from $38 billion to $36.6 billion—a $1.4 billion drop in a week. This is leveraged capital actively cooling off, rather than being forced to close positions after a price crash.
More important is where the money is coming from. Spot cumulative volume delta flipped from negative $102.8 million to positive $33.2 million. In other words, trading during this period shifted from being seller-led to buyer-led. Spot buyers are stepping in to absorb what’s leaving futures 📉
Meanwhile, the longs still in the market are continuing to pay. Funding payments rose from $926,400 to $1.5 million, showing that they’d rather pay a premium than give up their positions. Leveraged funds that had previously turned net short in CME Bitcoin futures seem to have been caught off guard this time around.
Put simply, this is the part many people miss: falling open interest may intuitively seem bearish, but at a point like this, it looks more like a layer of speculative froth being squeezed out of the market. The key is to distinguish between two things: leverage exiting, and spot taking over. The former means less profit from volatility; the latter determines whether the price has a floor.
There’s also something to be cautious about. The share of fast-moving capital—that is, coins that have moved recently—rose from 18.9% to 19.5%. The ratio of short-term holders’ supply to long-term holders’ supply also increased from 13.7% to 14.2%. In plain terms, more and more coins are ending up in the hands of people who won’t hold them for long. Market participation is increasing, but the stability of the coin supply is declining ⚙️
My view: what matters this time isn’t the price, but two figures. First, can spot cumulative volume delta stay positive? That’s the clearest evidence that real money is continuing to flow in. Second, will the share of fast-moving capital keep climbing? If it gets too high, even strong spot buying could be hit by a wave of short-term selling at some point.
Do you think this is a firmer floor after leverage has retreated, or a false sense of stability built on short-term holders’ coins? Let’s discuss in the comments 💬
Tap the profile picture to watch the livestream
Every day, I’ll help you follow the latest Bitcoin developments—not just what’s happening, but also the logic and opportunities behind the headlines 👀🚀
🗣️ 你的看法呢,群里说
A weekly snapshot from on-chain data firm Glassnode, as of October 4, shows that Bitcoin futures open interest fell from $38 billion to $36.6 billion—a $1.4 billion drop in a week. This is leveraged capital actively cooling off, rather than being forced to close positions after a price crash.
More important is where the money is coming from. Spot cumulative volume delta flipped from negative $102.8 million to positive $33.2 million. In other words, trading during this period shifted from being seller-led to buyer-led. Spot buyers are stepping in to absorb what’s leaving futures 📉
Meanwhile, the longs still in the market are continuing to pay. Funding payments rose from $926,400 to $1.5 million, showing that they’d rather pay a premium than give up their positions. Leveraged funds that had previously turned net short in CME Bitcoin futures seem to have been caught off guard this time around.
Put simply, this is the part many people miss: falling open interest may intuitively seem bearish, but at a point like this, it looks more like a layer of speculative froth being squeezed out of the market. The key is to distinguish between two things: leverage exiting, and spot taking over. The former means less profit from volatility; the latter determines whether the price has a floor.
There’s also something to be cautious about. The share of fast-moving capital—that is, coins that have moved recently—rose from 18.9% to 19.5%. The ratio of short-term holders’ supply to long-term holders’ supply also increased from 13.7% to 14.2%. In plain terms, more and more coins are ending up in the hands of people who won’t hold them for long. Market participation is increasing, but the stability of the coin supply is declining ⚙️
My view: what matters this time isn’t the price, but two figures. First, can spot cumulative volume delta stay positive? That’s the clearest evidence that real money is continuing to flow in. Second, will the share of fast-moving capital keep climbing? If it gets too high, even strong spot buying could be hit by a wave of short-term selling at some point.
Do you think this is a firmer floor after leverage has retreated, or a false sense of stability built on short-term holders’ coins? Let’s discuss in the comments 💬
Tap the profile picture to watch the livestream
Every day, I’ll help you follow the latest Bitcoin developments—not just what’s happening, but also the logic and opportunities behind the headlines 👀🚀
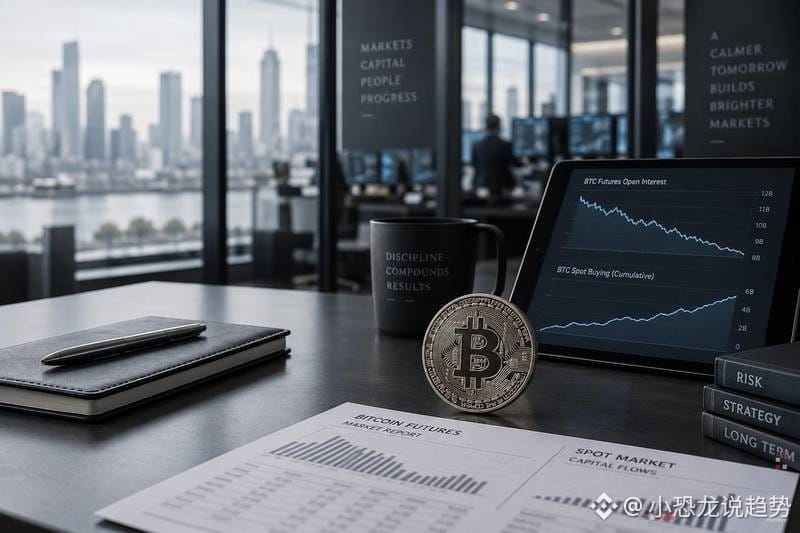
69
·
--
On this day one year ago, Bitcoin hit an all-time high of $126,080. Exactly 365 days later, it’s down to just $85,576 🦖
[🔭 进群看资金去哪](https://app.binance.com/uni-qr/JpwCPfBj)
On this birthday, Bitcoin made its third run at $87,000—and got knocked right back down. It fell 1.2% in 24 hours, closing near $85,600 📉
This is the third time since September 23 that Bitcoin has been rejected at the $87,000 threshold. Every time it pushes higher, a wave of sell orders comes in and sends it back down.
The hard data is right here: the total crypto market cap has slipped to around $2.93 trillion, just shy of the $2.95 trillion resistance level. The 10-year Treasury yield has climbed to 5.32%, its highest level since 2002, while the 2-year yield is up to 4.83%. Bridgewater’s Ray Dalio has publicly warned that demand for U.S. Treasuries could shrink as major overseas buyers pull back. Meanwhile, the Nasdaq 100 has hit a new closing high, and the S&P 500 is just 0.5% away from its all-time high. Clearly, investors would rather keep their money in stocks.
FxPro analyst Alex Kuptsikevich put it this way: Bitcoin has reached the apex of a triangle formed by rising support and horizontal resistance. If it breaks out, volatility could increase significantly ⚠️
My take: this wall isn’t magic—it’s about positioning. Every time Bitcoin touches $87,000, sell orders come pouring in, which suggests a crowd of people at that price waiting to break even or take profits. As the triangle narrows toward its apex, the next move is either a high-volume breakout or a drop to find support. No one can know the direction in advance. What really matters isn’t whether Bitcoin can touch $87K, but whether spot buyers can hold it there and push the close above $87,000. If it does close above that level, it’ll be the highest price in eight months 📈
On the altcoin side, ADA is up 11%, GRT 7%, NEAR nearly 7%, and HYPE 3% to $94, while BNB is down 2.5%. With the majors taking a breather, money is looking for opportunities in smaller coins. But the bigger picture is that Bitcoin is still 32% below last year’s peak of $126K.
Do you think this is the final shakeout before a breakout, or has the rally really run out of steam? Let’s discuss in the comments.
Tap the profile picture to watch the livestream.
Every day, I’ll keep you up to date on the latest Bitcoin stories—not just what’s happening, but the logic and opportunities behind it 👀🚀
On this day one year ago, Bitcoin hit an all-time high of $126,080. Exactly 365 days later, it’s down to just $85,576 🦖
🔭 进群看资金去哪
On this birthday, Bitcoin made its third run at $87,000—and got knocked right back down. It fell 1.2% in 24 hours, closing near $85,600 📉
This is the third time since September 23 that Bitcoin has been rejected at the $87,000 threshold. Every time it pushes higher, a wave of sell orders comes in and sends it back down.
The hard data is right here: the total crypto market cap has slipped to around $2.93 trillion, just shy of the $2.95 trillion resistance level. The 10-year Treasury yield has climbed to 5.32%, its highest level since 2002, while the 2-year yield is up to 4.83%. Bridgewater’s Ray Dalio has publicly warned that demand for U.S. Treasuries could shrink as major overseas buyers pull back. Meanwhile, the Nasdaq 100 has hit a new closing high, and the S&P 500 is just 0.5% away from its all-time high. Clearly, investors would rather keep their money in stocks.
FxPro analyst Alex Kuptsikevich put it this way: Bitcoin has reached the apex of a triangle formed by rising support and horizontal resistance. If it breaks out, volatility could increase significantly ⚠️
My take: this wall isn’t magic—it’s about positioning. Every time Bitcoin touches $87,000, sell orders come pouring in, which suggests a crowd of people at that price waiting to break even or take profits. As the triangle narrows toward its apex, the next move is either a high-volume breakout or a drop to find support. No one can know the direction in advance. What really matters isn’t whether Bitcoin can touch $87K, but whether spot buyers can hold it there and push the close above $87,000. If it does close above that level, it’ll be the highest price in eight months 📈
On the altcoin side, ADA is up 11%, GRT 7%, NEAR nearly 7%, and HYPE 3% to $94, while BNB is down 2.5%. With the majors taking a breather, money is looking for opportunities in smaller coins. But the bigger picture is that Bitcoin is still 32% below last year’s peak of $126K.
Do you think this is the final shakeout before a breakout, or has the rally really run out of steam? Let’s discuss in the comments.
Tap the profile picture to watch the livestream.
Every day, I’ll keep you up to date on the latest Bitcoin stories—not just what’s happening, but the logic and opportunities behind it 👀🚀
🔭 进群看资金去哪
On this birthday, Bitcoin made its third run at $87,000—and got knocked right back down. It fell 1.2% in 24 hours, closing near $85,600 📉
This is the third time since September 23 that Bitcoin has been rejected at the $87,000 threshold. Every time it pushes higher, a wave of sell orders comes in and sends it back down.
The hard data is right here: the total crypto market cap has slipped to around $2.93 trillion, just shy of the $2.95 trillion resistance level. The 10-year Treasury yield has climbed to 5.32%, its highest level since 2002, while the 2-year yield is up to 4.83%. Bridgewater’s Ray Dalio has publicly warned that demand for U.S. Treasuries could shrink as major overseas buyers pull back. Meanwhile, the Nasdaq 100 has hit a new closing high, and the S&P 500 is just 0.5% away from its all-time high. Clearly, investors would rather keep their money in stocks.
FxPro analyst Alex Kuptsikevich put it this way: Bitcoin has reached the apex of a triangle formed by rising support and horizontal resistance. If it breaks out, volatility could increase significantly ⚠️
My take: this wall isn’t magic—it’s about positioning. Every time Bitcoin touches $87,000, sell orders come pouring in, which suggests a crowd of people at that price waiting to break even or take profits. As the triangle narrows toward its apex, the next move is either a high-volume breakout or a drop to find support. No one can know the direction in advance. What really matters isn’t whether Bitcoin can touch $87K, but whether spot buyers can hold it there and push the close above $87,000. If it does close above that level, it’ll be the highest price in eight months 📈
On the altcoin side, ADA is up 11%, GRT 7%, NEAR nearly 7%, and HYPE 3% to $94, while BNB is down 2.5%. With the majors taking a breather, money is looking for opportunities in smaller coins. But the bigger picture is that Bitcoin is still 32% below last year’s peak of $126K.
Do you think this is the final shakeout before a breakout, or has the rally really run out of steam? Let’s discuss in the comments.
Tap the profile picture to watch the livestream.
Every day, I’ll keep you up to date on the latest Bitcoin stories—not just what’s happening, but the logic and opportunities behind it 👀🚀
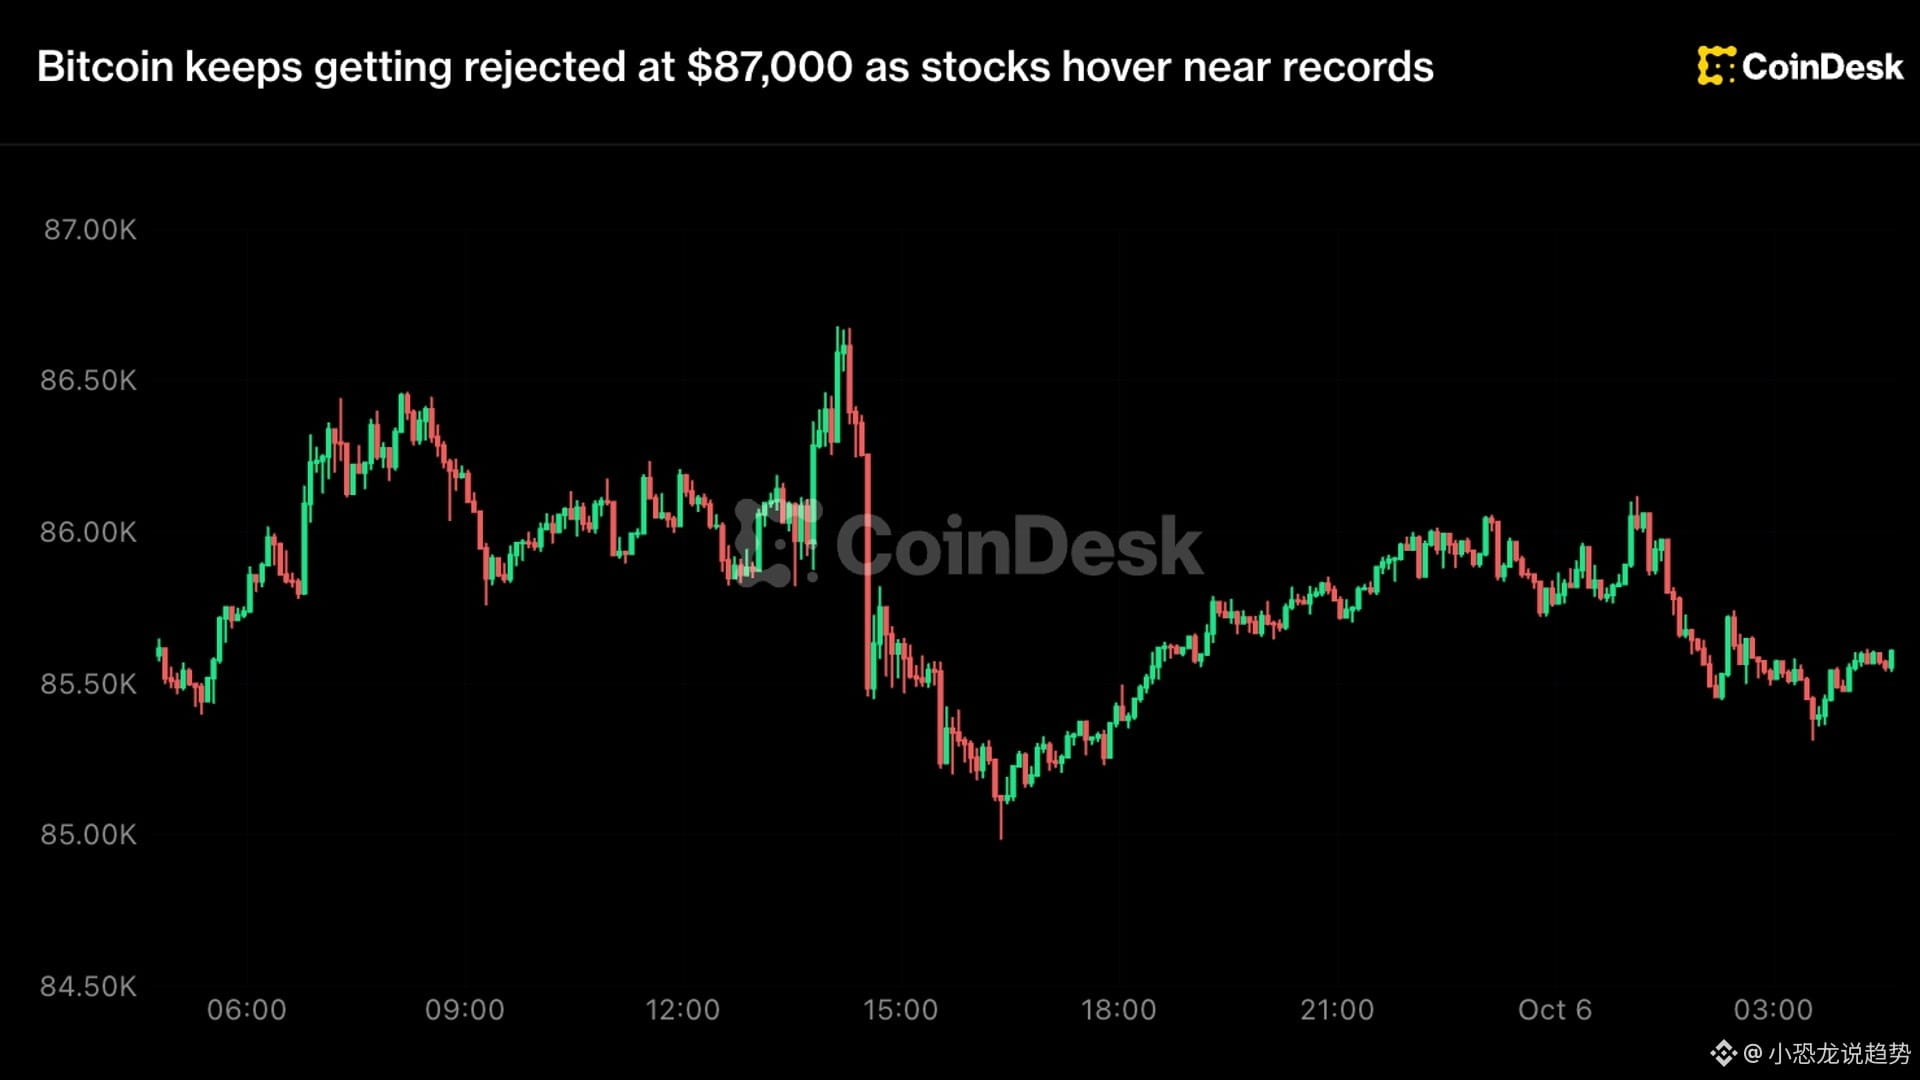
253
·
--
73.6% of Bitcoin is back in profit, but big investors were the last to break even 🦖
[📈 进群看今日思路](https://app.binance.com/uni-qr/JpwCPfBj)
Glassnode’s latest reading shows that 73.6% of all Bitcoin in circulation is now in profit, up from just 69.3% a month ago—a jump of 4.3 percentage points
The structure is even more interesting: large entities have only just climbed back above their cost basis, while smaller wallets have been in profit ever since the June low. Back then, the average cost basis for small investors was around $48,000. In other words, the large holders long seen as a market barometer have taken longer to break even this time than retail investors 🐋
The reason is simple: large investors have higher entry costs, with their holdings more concentrated in the highs of the previous cycle. Meanwhile, spot Bitcoin ETF holders are also all back in profit, since many bought shares when their net asset value was below the current price
Here’s another figure to keep in mind: long-term holders control around 80% of Bitcoin’s wealth. That means this 73.6% figure is heavily weighed down by coins that haven’t moved in over a year. The coins that really determine the short-term direction aren’t these dormant ones, but the marginal coins changing hands every day 📈
Glassnode itself offers two reminders. On one hand, when the share of supply in profit rises above 70%, it usually points to a healthy holder structure, and large entities returning to profit could bring in buying pressure. On the other hand, the higher this figure goes, the greater the urge to take profits, which can cap further gains
This isn’t a buy signal; it’s a thermometer. It won’t tell you where the price is headed, only how many people are sitting on profits right now. If the price falls back to their cost basis, selling pressure will first come from the most marginal holders
My take: Bitcoin is currently trading in a range of around $85,000 to $86,000. The key things to watch with this 73.6% figure are whether ETF holders’ unrealized profits turn into redemptions, and whether a break below the cost basis of recent buyers triggers a cascade of profit-taking. Data is static; people are dynamic
Do you think this 73.6% reflects healthy turnover, or is it the last leap before a market reversal? Share your thoughts in the comments—and are your holdings still above water?
Every day, I bring you the latest on Bitcoin on-chain data—not just what’s happening in the news, but the logic and opportunities behind it 👀🚀
73.6% of Bitcoin is back in profit, but big investors were the last to break even 🦖
📈 进群看今日思路
Glassnode’s latest reading shows that 73.6% of all Bitcoin in circulation is now in profit, up from just 69.3% a month ago—a jump of 4.3 percentage points
The structure is even more interesting: large entities have only just climbed back above their cost basis, while smaller wallets have been in profit ever since the June low. Back then, the average cost basis for small investors was around $48,000. In other words, the large holders long seen as a market barometer have taken longer to break even this time than retail investors 🐋
The reason is simple: large investors have higher entry costs, with their holdings more concentrated in the highs of the previous cycle. Meanwhile, spot Bitcoin ETF holders are also all back in profit, since many bought shares when their net asset value was below the current price
Here’s another figure to keep in mind: long-term holders control around 80% of Bitcoin’s wealth. That means this 73.6% figure is heavily weighed down by coins that haven’t moved in over a year. The coins that really determine the short-term direction aren’t these dormant ones, but the marginal coins changing hands every day 📈
Glassnode itself offers two reminders. On one hand, when the share of supply in profit rises above 70%, it usually points to a healthy holder structure, and large entities returning to profit could bring in buying pressure. On the other hand, the higher this figure goes, the greater the urge to take profits, which can cap further gains
This isn’t a buy signal; it’s a thermometer. It won’t tell you where the price is headed, only how many people are sitting on profits right now. If the price falls back to their cost basis, selling pressure will first come from the most marginal holders
My take: Bitcoin is currently trading in a range of around $85,000 to $86,000. The key things to watch with this 73.6% figure are whether ETF holders’ unrealized profits turn into redemptions, and whether a break below the cost basis of recent buyers triggers a cascade of profit-taking. Data is static; people are dynamic
Do you think this 73.6% reflects healthy turnover, or is it the last leap before a market reversal? Share your thoughts in the comments—and are your holdings still above water?
Every day, I bring you the latest on Bitcoin on-chain data—not just what’s happening in the news, but the logic and opportunities behind it 👀🚀
📈 进群看今日思路
Glassnode’s latest reading shows that 73.6% of all Bitcoin in circulation is now in profit, up from just 69.3% a month ago—a jump of 4.3 percentage points
The structure is even more interesting: large entities have only just climbed back above their cost basis, while smaller wallets have been in profit ever since the June low. Back then, the average cost basis for small investors was around $48,000. In other words, the large holders long seen as a market barometer have taken longer to break even this time than retail investors 🐋
The reason is simple: large investors have higher entry costs, with their holdings more concentrated in the highs of the previous cycle. Meanwhile, spot Bitcoin ETF holders are also all back in profit, since many bought shares when their net asset value was below the current price
Here’s another figure to keep in mind: long-term holders control around 80% of Bitcoin’s wealth. That means this 73.6% figure is heavily weighed down by coins that haven’t moved in over a year. The coins that really determine the short-term direction aren’t these dormant ones, but the marginal coins changing hands every day 📈
Glassnode itself offers two reminders. On one hand, when the share of supply in profit rises above 70%, it usually points to a healthy holder structure, and large entities returning to profit could bring in buying pressure. On the other hand, the higher this figure goes, the greater the urge to take profits, which can cap further gains
This isn’t a buy signal; it’s a thermometer. It won’t tell you where the price is headed, only how many people are sitting on profits right now. If the price falls back to their cost basis, selling pressure will first come from the most marginal holders
My take: Bitcoin is currently trading in a range of around $85,000 to $86,000. The key things to watch with this 73.6% figure are whether ETF holders’ unrealized profits turn into redemptions, and whether a break below the cost basis of recent buyers triggers a cascade of profit-taking. Data is static; people are dynamic
Do you think this 73.6% reflects healthy turnover, or is it the last leap before a market reversal? Share your thoughts in the comments—and are your holdings still above water?
Every day, I bring you the latest on Bitcoin on-chain data—not just what’s happening in the news, but the logic and opportunities behind it 👀🚀

2
188
·
--
ZRO is up 10.55% in a day, yet tokens have been moving to exchanges for 8 straight days 🦖
[⚡ 有大动静群里说](https://app.binance.com/uni-qr/JpwCPfBj)
On October 6, ZRO, the token of cross-chain protocol LayerZero, climbed to $2.12, up 10.55% in 24 hours. But the same on-chain data shows net flows heading to exchanges for eight consecutive trading days. The largest single-day net deposit was on October 2, when deposits exceeded withdrawals by 4.64 million tokens—the biggest daily net inflow in the past nine days ⚠️
Even more striking is the trading volume. Reported 24-hour volume across the market was $170 million, but an on-chain wash-trading detection engine flagged 83% of it as artificially inflated. That leaves just $57.33 million in genuine trading volume—less than a third of the total. Behind it were 705 wallets engaged in zero-net-volume loops, trading back and forth 🐋
In other words, this rally isn’t happening because the supply of tokens available is shrinking. Tokens are flowing to exchanges as the price is pushed up—while holders distribute 📈
Today’s early-session data makes the situation even clearer: 102,316 tokens were deposited and 19,327 withdrawn, for a net inflow of 82,988. The direction hasn’t changed. September 29 was the only day in this period with net outflows, at 140,166 tokens, but that was quickly overwhelmed by the wave of deposits in October.
One group of wallets is worth watching separately. Five wallets flagged as accumulating collectively hold 0.63% of the supply, but their funds all lead to exchange hot and cold wallets. The largest holds 5.43 million tokens, or 0.57% of the supply. It has been active for five days, with six incoming transfers and no outgoing transfers. Its destination is an exchange hot wallet holding 21.12 million tokens, or 2.22% of the supply. This pattern looks more like distribution in stages than strategic accumulation.
Based on the data, there’s no clear official catalyst for this rally: no announcement, no upgrade. The project’s contracts appear clean, too. A security firm’s assessment found no minting function, honeypot behavior, or pause switch—removing one category of risk.
My take: when the price is rising while tokens are flowing onto exchanges, the biggest risk is mistaking fake volume for genuine buying. The two things that really matter are, first, when exchange net inflows turn into sustained net outflows—that would indicate buyers are stepping in—and second, whether genuine trading volume can rise significantly without total volume falling. If neither signal appears, this move looks more like a rebound than a reversal.
Let’s discuss in the comments: do you trust the price more, or the on-chain data?
Follow me for daily crypto trends—not just what’s in the news, but the logic and opportunities behind it 👀🚀
ZRO is up 10.55% in a day, yet tokens have been moving to exchanges for 8 straight days 🦖
⚡ 有大动静群里说
On October 6, ZRO, the token of cross-chain protocol LayerZero, climbed to $2.12, up 10.55% in 24 hours. But the same on-chain data shows net flows heading to exchanges for eight consecutive trading days. The largest single-day net deposit was on October 2, when deposits exceeded withdrawals by 4.64 million tokens—the biggest daily net inflow in the past nine days ⚠️
Even more striking is the trading volume. Reported 24-hour volume across the market was $170 million, but an on-chain wash-trading detection engine flagged 83% of it as artificially inflated. That leaves just $57.33 million in genuine trading volume—less than a third of the total. Behind it were 705 wallets engaged in zero-net-volume loops, trading back and forth 🐋
In other words, this rally isn’t happening because the supply of tokens available is shrinking. Tokens are flowing to exchanges as the price is pushed up—while holders distribute 📈
Today’s early-session data makes the situation even clearer: 102,316 tokens were deposited and 19,327 withdrawn, for a net inflow of 82,988. The direction hasn’t changed. September 29 was the only day in this period with net outflows, at 140,166 tokens, but that was quickly overwhelmed by the wave of deposits in October.
One group of wallets is worth watching separately. Five wallets flagged as accumulating collectively hold 0.63% of the supply, but their funds all lead to exchange hot and cold wallets. The largest holds 5.43 million tokens, or 0.57% of the supply. It has been active for five days, with six incoming transfers and no outgoing transfers. Its destination is an exchange hot wallet holding 21.12 million tokens, or 2.22% of the supply. This pattern looks more like distribution in stages than strategic accumulation.
Based on the data, there’s no clear official catalyst for this rally: no announcement, no upgrade. The project’s contracts appear clean, too. A security firm’s assessment found no minting function, honeypot behavior, or pause switch—removing one category of risk.
My take: when the price is rising while tokens are flowing onto exchanges, the biggest risk is mistaking fake volume for genuine buying. The two things that really matter are, first, when exchange net inflows turn into sustained net outflows—that would indicate buyers are stepping in—and second, whether genuine trading volume can rise significantly without total volume falling. If neither signal appears, this move looks more like a rebound than a reversal.
Let’s discuss in the comments: do you trust the price more, or the on-chain data?
Follow me for daily crypto trends—not just what’s in the news, but the logic and opportunities behind it 👀🚀
⚡ 有大动静群里说
On October 6, ZRO, the token of cross-chain protocol LayerZero, climbed to $2.12, up 10.55% in 24 hours. But the same on-chain data shows net flows heading to exchanges for eight consecutive trading days. The largest single-day net deposit was on October 2, when deposits exceeded withdrawals by 4.64 million tokens—the biggest daily net inflow in the past nine days ⚠️
Even more striking is the trading volume. Reported 24-hour volume across the market was $170 million, but an on-chain wash-trading detection engine flagged 83% of it as artificially inflated. That leaves just $57.33 million in genuine trading volume—less than a third of the total. Behind it were 705 wallets engaged in zero-net-volume loops, trading back and forth 🐋
In other words, this rally isn’t happening because the supply of tokens available is shrinking. Tokens are flowing to exchanges as the price is pushed up—while holders distribute 📈
Today’s early-session data makes the situation even clearer: 102,316 tokens were deposited and 19,327 withdrawn, for a net inflow of 82,988. The direction hasn’t changed. September 29 was the only day in this period with net outflows, at 140,166 tokens, but that was quickly overwhelmed by the wave of deposits in October.
One group of wallets is worth watching separately. Five wallets flagged as accumulating collectively hold 0.63% of the supply, but their funds all lead to exchange hot and cold wallets. The largest holds 5.43 million tokens, or 0.57% of the supply. It has been active for five days, with six incoming transfers and no outgoing transfers. Its destination is an exchange hot wallet holding 21.12 million tokens, or 2.22% of the supply. This pattern looks more like distribution in stages than strategic accumulation.
Based on the data, there’s no clear official catalyst for this rally: no announcement, no upgrade. The project’s contracts appear clean, too. A security firm’s assessment found no minting function, honeypot behavior, or pause switch—removing one category of risk.
My take: when the price is rising while tokens are flowing onto exchanges, the biggest risk is mistaking fake volume for genuine buying. The two things that really matter are, first, when exchange net inflows turn into sustained net outflows—that would indicate buyers are stepping in—and second, whether genuine trading volume can rise significantly without total volume falling. If neither signal appears, this move looks more like a rebound than a reversal.
Let’s discuss in the comments: do you trust the price more, or the on-chain data?
Follow me for daily crypto trends—not just what’s in the news, but the logic and opportunities behind it 👀🚀
1
208
·
--
A money-laundering network handling over $1 billion: A fake customer spent just $350,000 to expose the underground bank serving North Korean hackers 🦖
[🕐 最新解读群里更新](https://app.binance.com/uni-qr/JpwCPfBj)
On October 5, on-chain investigator ZachXBT revealed that he had posed as a paying customer to infiltrate a Chinese criminal network laundering money for North Korea’s Lazarus Group. The network had handled more than $1 billion in funds, and he made his move just days after $1.5 billion was stolen from Bybit.
To gain the network’s trust, he started by putting up $349,700 in stablecoins. He deliberately took a 5% loss on each transaction as a protection fee. His contact went by the alias Jimmy Green, and the operation spanned Hong Kong and mainland China.
The intelligence he obtained undercover helped him identify a cluster of addresses holding more than $12 million and directly linked to the stolen Bybit funds. Tether subsequently froze $442,000 in USDT from the cluster 🔍
Why is this worth a closer look? Because North Korea’s stolen crypto doesn’t simply vanish. It is laundered layer by layer through a well-established underground pipeline. Chainalysis estimates that North Korea-linked hackers had stolen at least $6.75 billion cumulatively by 2025—and behind every major heist stands the same group of intermediaries.
This is not an isolated case. In 2020, U.S. prosecutors charged two Chinese nationals with laundering more than $100 million for North Korean hackers. In 2023, OFAC sanctioned two traders—one in Hong Kong and one in mainland China. Then, in September this year, after $387.5 million was stolen from Bitget, and in April, after $292 million was stolen from Kelp DAO, ZachXBT traced the leads back to the same group of intermediaries ⚖️
Put simply, the real takeaway for ordinary crypto holders is that whether stablecoin issuers are willing to cooperate with freezes is becoming the dividing line between whether stolen funds can be recovered or not. Law enforcement is increasingly relying on on-chain investigators in the private sector to provide firsthand leads. This time, even the cost of going undercover was made public: $350,000 to uncover a pipeline handling $1 billion ⚠️
Do you think this kind of undercover investigation by independent investigators will become standard practice for recovering stolen funds? Share your thoughts in the comments.
Every day, we bring you the latest in crypto—not just what’s happening, but also the logic and opportunities behind the headlines 👀🚀
A money-laundering network handling over $1 billion: A fake customer spent just $350,000 to expose the underground bank serving North Korean hackers 🦖
🕐 最新解读群里更新
On October 5, on-chain investigator ZachXBT revealed that he had posed as a paying customer to infiltrate a Chinese criminal network laundering money for North Korea’s Lazarus Group. The network had handled more than $1 billion in funds, and he made his move just days after $1.5 billion was stolen from Bybit.
To gain the network’s trust, he started by putting up $349,700 in stablecoins. He deliberately took a 5% loss on each transaction as a protection fee. His contact went by the alias Jimmy Green, and the operation spanned Hong Kong and mainland China.
The intelligence he obtained undercover helped him identify a cluster of addresses holding more than $12 million and directly linked to the stolen Bybit funds. Tether subsequently froze $442,000 in USDT from the cluster 🔍
Why is this worth a closer look? Because North Korea’s stolen crypto doesn’t simply vanish. It is laundered layer by layer through a well-established underground pipeline. Chainalysis estimates that North Korea-linked hackers had stolen at least $6.75 billion cumulatively by 2025—and behind every major heist stands the same group of intermediaries.
This is not an isolated case. In 2020, U.S. prosecutors charged two Chinese nationals with laundering more than $100 million for North Korean hackers. In 2023, OFAC sanctioned two traders—one in Hong Kong and one in mainland China. Then, in September this year, after $387.5 million was stolen from Bitget, and in April, after $292 million was stolen from Kelp DAO, ZachXBT traced the leads back to the same group of intermediaries ⚖️
Put simply, the real takeaway for ordinary crypto holders is that whether stablecoin issuers are willing to cooperate with freezes is becoming the dividing line between whether stolen funds can be recovered or not. Law enforcement is increasingly relying on on-chain investigators in the private sector to provide firsthand leads. This time, even the cost of going undercover was made public: $350,000 to uncover a pipeline handling $1 billion ⚠️
Do you think this kind of undercover investigation by independent investigators will become standard practice for recovering stolen funds? Share your thoughts in the comments.
Every day, we bring you the latest in crypto—not just what’s happening, but also the logic and opportunities behind the headlines 👀🚀
🕐 最新解读群里更新
On October 5, on-chain investigator ZachXBT revealed that he had posed as a paying customer to infiltrate a Chinese criminal network laundering money for North Korea’s Lazarus Group. The network had handled more than $1 billion in funds, and he made his move just days after $1.5 billion was stolen from Bybit.
To gain the network’s trust, he started by putting up $349,700 in stablecoins. He deliberately took a 5% loss on each transaction as a protection fee. His contact went by the alias Jimmy Green, and the operation spanned Hong Kong and mainland China.
The intelligence he obtained undercover helped him identify a cluster of addresses holding more than $12 million and directly linked to the stolen Bybit funds. Tether subsequently froze $442,000 in USDT from the cluster 🔍
Why is this worth a closer look? Because North Korea’s stolen crypto doesn’t simply vanish. It is laundered layer by layer through a well-established underground pipeline. Chainalysis estimates that North Korea-linked hackers had stolen at least $6.75 billion cumulatively by 2025—and behind every major heist stands the same group of intermediaries.
This is not an isolated case. In 2020, U.S. prosecutors charged two Chinese nationals with laundering more than $100 million for North Korean hackers. In 2023, OFAC sanctioned two traders—one in Hong Kong and one in mainland China. Then, in September this year, after $387.5 million was stolen from Bitget, and in April, after $292 million was stolen from Kelp DAO, ZachXBT traced the leads back to the same group of intermediaries ⚖️
Put simply, the real takeaway for ordinary crypto holders is that whether stablecoin issuers are willing to cooperate with freezes is becoming the dividing line between whether stolen funds can be recovered or not. Law enforcement is increasingly relying on on-chain investigators in the private sector to provide firsthand leads. This time, even the cost of going undercover was made public: $350,000 to uncover a pipeline handling $1 billion ⚠️
Do you think this kind of undercover investigation by independent investigators will become standard practice for recovering stolen funds? Share your thoughts in the comments.
Every day, we bring you the latest in crypto—not just what’s happening, but also the logic and opportunities behind the headlines 👀🚀

1
110
·
--
Verified
A withdrawal from the treasury? First, wait 10 days. That’s the rule change up for a vote at Compound, the veteran DeFi lending protocol—and one wallet on the voter list has been accumulating votes with borrowed money 🦖
[🙋 想聊的进群](https://app.binance.com/uni-qr/JpwCPfBj)
Proposal 612 was submitted on October 2. Voting opened Sunday and ends Wednesday, October 7. It boils down to two changes: first, extend the waiting period for treasury withdrawals from 2 days to 10; second, give the governance timelock the power both to execute and to cancel. In other words, governance could halt a treasury transaction that’s already been approved but hasn’t yet gone through.
As of the afternoon of October 5, the on-chain governance interface showed roughly 1.75 million COMP in favor, 921,000 opposed, and no abstentions. The quorum is 400,000 COMP. What really changed the character of this vote was one supporting ballot: governance researcher Blockful traced a wallet that cast 1.75 million votes to Humpy. That single wallet had more votes than all the opposition combined at the time 🗳️
How were all those votes amassed? With a wrapper called dCOMP, built by API3. Users can wrap COMP into dCOMP, use it as collateral to borrow USDC from the lending protocol Morpho, and still retain the voting power of the wrapped COMP. Etherscan showed that around 1.75 million COMP sat in the wrapper on October 5, with the very address that cast those 1.75 million votes listed as its delegate.
On the surface, this is just extending the “braking distance” from 2 days to 10. Put another way: the old 2-day waiting period was shorter than the entire governance process, which takes about a week. Whether funds could be stopped depended entirely on whether a multisig group was willing to intervene manually. The change would put the veto power in the contract, while adding a 10-day cooldown for the custodian account and making withdrawals expire 17 days after they’re initiated. In an April report, auditor Certora had already pointed out that governance couldn’t independently cancel an individual withdrawal. It rated this a low-risk issue at the time, relying on a “faster safety valve” as a backstop ⏳
My take: winning the vote isn’t the whole story. The real variable is where governance power comes from. When voting power can be separated from collateral, lent out, and concentrated into a single ballot, the decentralization of on-chain governance depends not just on how many people hold tokens, but also on who is using leverage. The Compound Foundation has publicly stated that extending the waiting period would slow its progress on V4, and called this proposal a “malicious governance attack.” That’s the Foundation’s characterization, not a conclusion about the proposal itself.
Do you see this as governance taking out insurance, or as governance power becoming an asset that can be borrowed and lent? Let’s discuss in the comments 🔍
Tap the profile picture to watch the livestream
Every day, we bring you the latest crypto headlines—not just what’s happening, but the logic and opportunities behind it 👀🚀
A withdrawal from the treasury? First, wait 10 days. That’s the rule change up for a vote at Compound, the veteran DeFi lending protocol—and one wallet on the voter list has been accumulating votes with borrowed money 🦖
🙋 想聊的进群
Proposal 612 was submitted on October 2. Voting opened Sunday and ends Wednesday, October 7. It boils down to two changes: first, extend the waiting period for treasury withdrawals from 2 days to 10; second, give the governance timelock the power both to execute and to cancel. In other words, governance could halt a treasury transaction that’s already been approved but hasn’t yet gone through.
As of the afternoon of October 5, the on-chain governance interface showed roughly 1.75 million COMP in favor, 921,000 opposed, and no abstentions. The quorum is 400,000 COMP. What really changed the character of this vote was one supporting ballot: governance researcher Blockful traced a wallet that cast 1.75 million votes to Humpy. That single wallet had more votes than all the opposition combined at the time 🗳️
How were all those votes amassed? With a wrapper called dCOMP, built by API3. Users can wrap COMP into dCOMP, use it as collateral to borrow USDC from the lending protocol Morpho, and still retain the voting power of the wrapped COMP. Etherscan showed that around 1.75 million COMP sat in the wrapper on October 5, with the very address that cast those 1.75 million votes listed as its delegate.
On the surface, this is just extending the “braking distance” from 2 days to 10. Put another way: the old 2-day waiting period was shorter than the entire governance process, which takes about a week. Whether funds could be stopped depended entirely on whether a multisig group was willing to intervene manually. The change would put the veto power in the contract, while adding a 10-day cooldown for the custodian account and making withdrawals expire 17 days after they’re initiated. In an April report, auditor Certora had already pointed out that governance couldn’t independently cancel an individual withdrawal. It rated this a low-risk issue at the time, relying on a “faster safety valve” as a backstop ⏳
My take: winning the vote isn’t the whole story. The real variable is where governance power comes from. When voting power can be separated from collateral, lent out, and concentrated into a single ballot, the decentralization of on-chain governance depends not just on how many people hold tokens, but also on who is using leverage. The Compound Foundation has publicly stated that extending the waiting period would slow its progress on V4, and called this proposal a “malicious governance attack.” That’s the Foundation’s characterization, not a conclusion about the proposal itself.
Do you see this as governance taking out insurance, or as governance power becoming an asset that can be borrowed and lent? Let’s discuss in the comments 🔍
Tap the profile picture to watch the livestream
Every day, we bring you the latest crypto headlines—not just what’s happening, but the logic and opportunities behind it 👀🚀
🙋 想聊的进群
Proposal 612 was submitted on October 2. Voting opened Sunday and ends Wednesday, October 7. It boils down to two changes: first, extend the waiting period for treasury withdrawals from 2 days to 10; second, give the governance timelock the power both to execute and to cancel. In other words, governance could halt a treasury transaction that’s already been approved but hasn’t yet gone through.
As of the afternoon of October 5, the on-chain governance interface showed roughly 1.75 million COMP in favor, 921,000 opposed, and no abstentions. The quorum is 400,000 COMP. What really changed the character of this vote was one supporting ballot: governance researcher Blockful traced a wallet that cast 1.75 million votes to Humpy. That single wallet had more votes than all the opposition combined at the time 🗳️
How were all those votes amassed? With a wrapper called dCOMP, built by API3. Users can wrap COMP into dCOMP, use it as collateral to borrow USDC from the lending protocol Morpho, and still retain the voting power of the wrapped COMP. Etherscan showed that around 1.75 million COMP sat in the wrapper on October 5, with the very address that cast those 1.75 million votes listed as its delegate.
On the surface, this is just extending the “braking distance” from 2 days to 10. Put another way: the old 2-day waiting period was shorter than the entire governance process, which takes about a week. Whether funds could be stopped depended entirely on whether a multisig group was willing to intervene manually. The change would put the veto power in the contract, while adding a 10-day cooldown for the custodian account and making withdrawals expire 17 days after they’re initiated. In an April report, auditor Certora had already pointed out that governance couldn’t independently cancel an individual withdrawal. It rated this a low-risk issue at the time, relying on a “faster safety valve” as a backstop ⏳
My take: winning the vote isn’t the whole story. The real variable is where governance power comes from. When voting power can be separated from collateral, lent out, and concentrated into a single ballot, the decentralization of on-chain governance depends not just on how many people hold tokens, but also on who is using leverage. The Compound Foundation has publicly stated that extending the waiting period would slow its progress on V4, and called this proposal a “malicious governance attack.” That’s the Foundation’s characterization, not a conclusion about the proposal itself.
Do you see this as governance taking out insurance, or as governance power becoming an asset that can be borrowed and lent? Let’s discuss in the comments 🔍
Tap the profile picture to watch the livestream
Every day, we bring you the latest crypto headlines—not just what’s happening, but the logic and opportunities behind it 👀🚀

2
200
·
--
Verified
#ada涨10%突破0.27美元
Bitcoin stays put while ADA rockets 12% in a day to a five-month high 🦖
[📢 ⏰ 消息群里第一时间说](https://app.binance.com/uni-qr/JpwCPfBj)
On October 5, Cardano’s native token ADA touched an intraday high of $0.27, gaining around 12% on the day. It was ADA’s strongest day since May this year and its highest price in five months. Meanwhile, Bitcoin barely moved around $85,700, and Ethereum hovered around $2,712—the rally wasn’t following the broader market; it was doing its own thing.
The momentum came from two things. On the fundamentals side: RealFi launched its mainnet on October 1, bringing real-world assets (RWAs) onto the Cardano mainnet. At the same time, the USDr stablecoin was integrated into three DeFi apps: Lace, Liqwid, and SundaeSwap. On the narrative side: after ADA started climbing, its founder posted a 15-minute ADA/USDT chart showing the price rise from around 0.244 to 0.264, along with the hashtag #LeiosIsComing. It became the community’s rallying cry that day 📈.
So what exactly is Leios? Its full name is Linear Leios, its specification number is CIP-164, and it’s part of the Dijkstra hard fork. The idea isn’t to replace the existing main chain—Ouroboros Praos will continue to handle security and ordering, with an additional layer of “endorsement blocks” to bundle more transactions. Stake pools will verify these blocks using BLS signatures before they’re added to the ledger. Since June 2026, the system has been running on the Musashi Dojo testnet, with data processing speeds reaching around 6 times higher. Developers estimate that under ideal conditions, throughput could increase by 10 to 65 times.
The technical indicators are also lining up: the 50-day moving average has crossed above the 200-day moving average, forming a golden cross, while the daily momentum indicator has climbed to 68.69, nearing overbought territory. The next major hurdle above is $0.28.
But there’s a contrast worth watching. Actual trading volume for ADA on decentralized exchanges (DEXs) hasn’t kept pace with the price surge—the hype is running ahead of real usage. And Leios won’t actually go live until the end of 2026, alongside Dijkstra. After launch, stake pool operators will also need to manually register their cryptographic keys, and throughput will be increased gradually by tuning parameters—it won’t reach full power at the flip of a switch ⚠️.
In other words: this looks more like a “narrative-first” rally—a hashtag and a roadmap were enough to send a coin that had been decoupled from the broader market up 12%. What will really determine whether it can hold above $0.27 or even test $0.28 isn’t the next post, but whether DEX trading and staking interest on-chain can catch up.
Let’s talk in the comments: do you think this rally is pricing in upgrade expectations early, or is it another case of “news pumps the price, but on-chain activity doesn’t follow”?
Every day, we bring you the latest crypto market trends—not just what’s happening, but the logic and opportunities behind it 👀🚀
Tap the profile picture to watch the livestream
#ada涨10%突破0.27美元
Bitcoin stays put while ADA rockets 12% in a day to a five-month high 🦖
📢 ⏰ 消息群里第一时间说
On October 5, Cardano’s native token ADA touched an intraday high of $0.27, gaining around 12% on the day. It was ADA’s strongest day since May this year and its highest price in five months. Meanwhile, Bitcoin barely moved around $85,700, and Ethereum hovered around $2,712—the rally wasn’t following the broader market; it was doing its own thing.
The momentum came from two things. On the fundamentals side: RealFi launched its mainnet on October 1, bringing real-world assets (RWAs) onto the Cardano mainnet. At the same time, the USDr stablecoin was integrated into three DeFi apps: Lace, Liqwid, and SundaeSwap. On the narrative side: after ADA started climbing, its founder posted a 15-minute ADA/USDT chart showing the price rise from around 0.244 to 0.264, along with the hashtag #LeiosIsComing. It became the community’s rallying cry that day 📈.
So what exactly is Leios? Its full name is Linear Leios, its specification number is CIP-164, and it’s part of the Dijkstra hard fork. The idea isn’t to replace the existing main chain—Ouroboros Praos will continue to handle security and ordering, with an additional layer of “endorsement blocks” to bundle more transactions. Stake pools will verify these blocks using BLS signatures before they’re added to the ledger. Since June 2026, the system has been running on the Musashi Dojo testnet, with data processing speeds reaching around 6 times higher. Developers estimate that under ideal conditions, throughput could increase by 10 to 65 times.
The technical indicators are also lining up: the 50-day moving average has crossed above the 200-day moving average, forming a golden cross, while the daily momentum indicator has climbed to 68.69, nearing overbought territory. The next major hurdle above is $0.28.
But there’s a contrast worth watching. Actual trading volume for ADA on decentralized exchanges (DEXs) hasn’t kept pace with the price surge—the hype is running ahead of real usage. And Leios won’t actually go live until the end of 2026, alongside Dijkstra. After launch, stake pool operators will also need to manually register their cryptographic keys, and throughput will be increased gradually by tuning parameters—it won’t reach full power at the flip of a switch ⚠️.
In other words: this looks more like a “narrative-first” rally—a hashtag and a roadmap were enough to send a coin that had been decoupled from the broader market up 12%. What will really determine whether it can hold above $0.27 or even test $0.28 isn’t the next post, but whether DEX trading and staking interest on-chain can catch up.
Let’s talk in the comments: do you think this rally is pricing in upgrade expectations early, or is it another case of “news pumps the price, but on-chain activity doesn’t follow”?
Every day, we bring you the latest crypto market trends—not just what’s happening, but the logic and opportunities behind it 👀🚀
Tap the profile picture to watch the livestream
Bitcoin stays put while ADA rockets 12% in a day to a five-month high 🦖
📢 ⏰ 消息群里第一时间说
On October 5, Cardano’s native token ADA touched an intraday high of $0.27, gaining around 12% on the day. It was ADA’s strongest day since May this year and its highest price in five months. Meanwhile, Bitcoin barely moved around $85,700, and Ethereum hovered around $2,712—the rally wasn’t following the broader market; it was doing its own thing.
The momentum came from two things. On the fundamentals side: RealFi launched its mainnet on October 1, bringing real-world assets (RWAs) onto the Cardano mainnet. At the same time, the USDr stablecoin was integrated into three DeFi apps: Lace, Liqwid, and SundaeSwap. On the narrative side: after ADA started climbing, its founder posted a 15-minute ADA/USDT chart showing the price rise from around 0.244 to 0.264, along with the hashtag #LeiosIsComing. It became the community’s rallying cry that day 📈.
So what exactly is Leios? Its full name is Linear Leios, its specification number is CIP-164, and it’s part of the Dijkstra hard fork. The idea isn’t to replace the existing main chain—Ouroboros Praos will continue to handle security and ordering, with an additional layer of “endorsement blocks” to bundle more transactions. Stake pools will verify these blocks using BLS signatures before they’re added to the ledger. Since June 2026, the system has been running on the Musashi Dojo testnet, with data processing speeds reaching around 6 times higher. Developers estimate that under ideal conditions, throughput could increase by 10 to 65 times.
The technical indicators are also lining up: the 50-day moving average has crossed above the 200-day moving average, forming a golden cross, while the daily momentum indicator has climbed to 68.69, nearing overbought territory. The next major hurdle above is $0.28.
But there’s a contrast worth watching. Actual trading volume for ADA on decentralized exchanges (DEXs) hasn’t kept pace with the price surge—the hype is running ahead of real usage. And Leios won’t actually go live until the end of 2026, alongside Dijkstra. After launch, stake pool operators will also need to manually register their cryptographic keys, and throughput will be increased gradually by tuning parameters—it won’t reach full power at the flip of a switch ⚠️.
In other words: this looks more like a “narrative-first” rally—a hashtag and a roadmap were enough to send a coin that had been decoupled from the broader market up 12%. What will really determine whether it can hold above $0.27 or even test $0.28 isn’t the next post, but whether DEX trading and staking interest on-chain can catch up.
Let’s talk in the comments: do you think this rally is pricing in upgrade expectations early, or is it another case of “news pumps the price, but on-chain activity doesn’t follow”?
Every day, we bring you the latest crypto market trends—not just what’s happening, but the logic and opportunities behind it 👀🚀
Tap the profile picture to watch the livestream

2
2.3k
·
--
#美联储10月维持利率概率升至82.3%
Bitcoin rose 43% in three months, but hit a 5% wall 🦖
[⚡ 有大动静群里说](https://app.binance.com/uni-qr/JpwCPfBj)
This was Bitcoin’s best third quarter since 2017, but research firm Delphi Digital poured cold water on the rally in its latest weekly report: the real obstacle isn’t the crypto market itself—it’s U.S. Treasury yields, which have climbed above 5%, their highest level in decades.
Here’s what they said, translated: “When a government bond can offer a risk-free return of more than 5%, every risk asset has to work twice as hard to justify the investment.” 💥
Here are the numbers: Bitcoin briefly surged to $87,000 last week, gaining more than 35% since mid-August and 43% over the third quarter as a whole. Meanwhile, the U.S. Treasury repeatedly increased the scale of its long-term bond buybacks, taking them all the way up to $6 billion just to support liquidity in the bond market. The money hasn’t disappeared—it’s just found a more comfortable place to go.
The real turning point came last Friday. The U.S. added just 29,000 jobs in September, far below the market’s expectation of 80,000, according to the Bureau of Labor Statistics. That sent the market’s odds of a rate hike in October tumbling from above 75% a week earlier to around 24% (CME FedWatch). New York Fed President Williams also said: “Given what we’ve already done in September, there’s no need to rush.”
My take: In the short term, this gives Bitcoin some breathing room. Cooling rate expectations give risk assets a chance to catch their breath. But in the medium term, its real rival isn’t the Fed—it’s that 5% Treasury yield. As long as “5% risk-free” remains on offer, every Bitcoin rally has to prove it’s “worth more than Treasuries.” The “debasement trade”—the idea that government debt and money printing will dilute the dollar—makes sense in theory, but it takes time, not a sudden breakout.
Two things are worth watching: whether the Fed really holds rates steady at its October meeting, and whether long-term Treasury yields can fall back below 5%. A change in either could shift Bitcoin’s direction. 📉
Let’s talk in the comments: If risk-free returns really are 5%, how much of your portfolio would you still allocate to Bitcoin?
Tap the profile picture to watch the livestream.
Every day, we bring you the latest in crypto—not just what’s happening, but the logic and opportunities behind it 👀🚀
#美联储10月维持利率概率升至82.3%
Bitcoin rose 43% in three months, but hit a 5% wall 🦖
⚡ 有大动静群里说
This was Bitcoin’s best third quarter since 2017, but research firm Delphi Digital poured cold water on the rally in its latest weekly report: the real obstacle isn’t the crypto market itself—it’s U.S. Treasury yields, which have climbed above 5%, their highest level in decades.
Here’s what they said, translated: “When a government bond can offer a risk-free return of more than 5%, every risk asset has to work twice as hard to justify the investment.” 💥
Here are the numbers: Bitcoin briefly surged to $87,000 last week, gaining more than 35% since mid-August and 43% over the third quarter as a whole. Meanwhile, the U.S. Treasury repeatedly increased the scale of its long-term bond buybacks, taking them all the way up to $6 billion just to support liquidity in the bond market. The money hasn’t disappeared—it’s just found a more comfortable place to go.
The real turning point came last Friday. The U.S. added just 29,000 jobs in September, far below the market’s expectation of 80,000, according to the Bureau of Labor Statistics. That sent the market’s odds of a rate hike in October tumbling from above 75% a week earlier to around 24% (CME FedWatch). New York Fed President Williams also said: “Given what we’ve already done in September, there’s no need to rush.”
My take: In the short term, this gives Bitcoin some breathing room. Cooling rate expectations give risk assets a chance to catch their breath. But in the medium term, its real rival isn’t the Fed—it’s that 5% Treasury yield. As long as “5% risk-free” remains on offer, every Bitcoin rally has to prove it’s “worth more than Treasuries.” The “debasement trade”—the idea that government debt and money printing will dilute the dollar—makes sense in theory, but it takes time, not a sudden breakout.
Two things are worth watching: whether the Fed really holds rates steady at its October meeting, and whether long-term Treasury yields can fall back below 5%. A change in either could shift Bitcoin’s direction. 📉
Let’s talk in the comments: If risk-free returns really are 5%, how much of your portfolio would you still allocate to Bitcoin?
Tap the profile picture to watch the livestream.
Every day, we bring you the latest in crypto—not just what’s happening, but the logic and opportunities behind it 👀🚀
Bitcoin rose 43% in three months, but hit a 5% wall 🦖
⚡ 有大动静群里说
This was Bitcoin’s best third quarter since 2017, but research firm Delphi Digital poured cold water on the rally in its latest weekly report: the real obstacle isn’t the crypto market itself—it’s U.S. Treasury yields, which have climbed above 5%, their highest level in decades.
Here’s what they said, translated: “When a government bond can offer a risk-free return of more than 5%, every risk asset has to work twice as hard to justify the investment.” 💥
Here are the numbers: Bitcoin briefly surged to $87,000 last week, gaining more than 35% since mid-August and 43% over the third quarter as a whole. Meanwhile, the U.S. Treasury repeatedly increased the scale of its long-term bond buybacks, taking them all the way up to $6 billion just to support liquidity in the bond market. The money hasn’t disappeared—it’s just found a more comfortable place to go.
The real turning point came last Friday. The U.S. added just 29,000 jobs in September, far below the market’s expectation of 80,000, according to the Bureau of Labor Statistics. That sent the market’s odds of a rate hike in October tumbling from above 75% a week earlier to around 24% (CME FedWatch). New York Fed President Williams also said: “Given what we’ve already done in September, there’s no need to rush.”
My take: In the short term, this gives Bitcoin some breathing room. Cooling rate expectations give risk assets a chance to catch their breath. But in the medium term, its real rival isn’t the Fed—it’s that 5% Treasury yield. As long as “5% risk-free” remains on offer, every Bitcoin rally has to prove it’s “worth more than Treasuries.” The “debasement trade”—the idea that government debt and money printing will dilute the dollar—makes sense in theory, but it takes time, not a sudden breakout.
Two things are worth watching: whether the Fed really holds rates steady at its October meeting, and whether long-term Treasury yields can fall back below 5%. A change in either could shift Bitcoin’s direction. 📉
Let’s talk in the comments: If risk-free returns really are 5%, how much of your portfolio would you still allocate to Bitcoin?
Tap the profile picture to watch the livestream.
Every day, we bring you the latest in crypto—not just what’s happening, but the logic and opportunities behind it 👀🚀

1
516
·
--
#solana代币化股票9月交易量破44亿美元
Tokenized stocks: a month of trading volume reaches $4.4 billion. The NYSE parent company now wants to personally move 60+ U.S. stocks onto the blockchain 🦖
[💬 群里一起聊行情](https://app.binance.com/uni-qr/JpwCPfBj)
First, let’s talk about the new move. A leading crypto exchange has formed a 50-50 joint venture with the New York Stock Exchange’s parent company, Intercontinental Exchange (ICE). This month, the JV has already filed an application with the U.S. SEC, planning to operate a “Tokenized Securities Trading Venue” (TSV). The first batch will cover stocks from more than 60 companies listed in the U.S. The basis is the SEC’s “Innovation Exemption” issued in September—allowing certain on-chain venues to conduct limited trading of tokenized U.S. stocks. Trades would go through automated market makers and liquidity-pool matching, without needing to route through traditional matching venues.
Why is this timing worth watching? Because this track has already started heating up. Tokenized stocks on Solana saw trading volume exceed $4.4 billion in September, setting a monthly record. The main drivers are the on-chain trading venues Raydium and Orca. But here’s the cold shower: $4.4 billion is the cumulative trading amount between both buyers and sellers—it is not market cap, and it’s not new capital flowing in. In fact, the value of tokenized stocks truly circulating on Solana in September was only about $684 million.
Put the two together, and the context becomes clear: first, the SEC exemption cracks open the gate; then major institutions with licenses rush to get in. A player of this level from the NYSE parent company matters more than short-term trading volume—it signals that “stocks on-chain” is moving from a crypto-native niche into legitimate business that traditional exchanges also want to compete for.
For ordinary users, the most direct change could be this: in the future, you really may be able to trade U.S. stocks 24/7 using stablecoins, without waiting for traditional brokerages to open. But on the flip side, the pricing, clearing, and which country’s securities laws govern tokenized stocks—these gaps still haven’t been filled. ⚖️
There’s another more realistic problem: the current “pool” is only on the order of a few hundred million dollars. If a large institution truly moves in funds at the tens-of-millions or even millions scale, insufficient depth would immediately amplify the issue. You might think you’re buying “U.S. stocks,” but you may actually just be buying a thinly liquid instrument—or a voucher with regulatory questions still hanging over it. 📉
If one day Apple or Nvidia can truly buy U.S. stocks on-chain 24/7 with stablecoins, would you move part of your U.S. stock positions onto the chain? Let’s discuss in the comments.
Click the avatar to watch the livestream
Every day, I’ll take you through crypto hot topics—not just what happens in the news, but also the logic and opportunities behind it 👀🚀
#solana代币化股票9月交易量破44亿美元
Tokenized stocks: a month of trading volume reaches $4.4 billion. The NYSE parent company now wants to personally move 60+ U.S. stocks onto the blockchain 🦖
💬 群里一起聊行情
First, let’s talk about the new move. A leading crypto exchange has formed a 50-50 joint venture with the New York Stock Exchange’s parent company, Intercontinental Exchange (ICE). This month, the JV has already filed an application with the U.S. SEC, planning to operate a “Tokenized Securities Trading Venue” (TSV). The first batch will cover stocks from more than 60 companies listed in the U.S. The basis is the SEC’s “Innovation Exemption” issued in September—allowing certain on-chain venues to conduct limited trading of tokenized U.S. stocks. Trades would go through automated market makers and liquidity-pool matching, without needing to route through traditional matching venues.
Why is this timing worth watching? Because this track has already started heating up. Tokenized stocks on Solana saw trading volume exceed $4.4 billion in September, setting a monthly record. The main drivers are the on-chain trading venues Raydium and Orca. But here’s the cold shower: $4.4 billion is the cumulative trading amount between both buyers and sellers—it is not market cap, and it’s not new capital flowing in. In fact, the value of tokenized stocks truly circulating on Solana in September was only about $684 million.
Put the two together, and the context becomes clear: first, the SEC exemption cracks open the gate; then major institutions with licenses rush to get in. A player of this level from the NYSE parent company matters more than short-term trading volume—it signals that “stocks on-chain” is moving from a crypto-native niche into legitimate business that traditional exchanges also want to compete for.
For ordinary users, the most direct change could be this: in the future, you really may be able to trade U.S. stocks 24/7 using stablecoins, without waiting for traditional brokerages to open. But on the flip side, the pricing, clearing, and which country’s securities laws govern tokenized stocks—these gaps still haven’t been filled. ⚖️
There’s another more realistic problem: the current “pool” is only on the order of a few hundred million dollars. If a large institution truly moves in funds at the tens-of-millions or even millions scale, insufficient depth would immediately amplify the issue. You might think you’re buying “U.S. stocks,” but you may actually just be buying a thinly liquid instrument—or a voucher with regulatory questions still hanging over it. 📉
If one day Apple or Nvidia can truly buy U.S. stocks on-chain 24/7 with stablecoins, would you move part of your U.S. stock positions onto the chain? Let’s discuss in the comments.
Click the avatar to watch the livestream
Every day, I’ll take you through crypto hot topics—not just what happens in the news, but also the logic and opportunities behind it 👀🚀
Tokenized stocks: a month of trading volume reaches $4.4 billion. The NYSE parent company now wants to personally move 60+ U.S. stocks onto the blockchain 🦖
💬 群里一起聊行情
First, let’s talk about the new move. A leading crypto exchange has formed a 50-50 joint venture with the New York Stock Exchange’s parent company, Intercontinental Exchange (ICE). This month, the JV has already filed an application with the U.S. SEC, planning to operate a “Tokenized Securities Trading Venue” (TSV). The first batch will cover stocks from more than 60 companies listed in the U.S. The basis is the SEC’s “Innovation Exemption” issued in September—allowing certain on-chain venues to conduct limited trading of tokenized U.S. stocks. Trades would go through automated market makers and liquidity-pool matching, without needing to route through traditional matching venues.
Why is this timing worth watching? Because this track has already started heating up. Tokenized stocks on Solana saw trading volume exceed $4.4 billion in September, setting a monthly record. The main drivers are the on-chain trading venues Raydium and Orca. But here’s the cold shower: $4.4 billion is the cumulative trading amount between both buyers and sellers—it is not market cap, and it’s not new capital flowing in. In fact, the value of tokenized stocks truly circulating on Solana in September was only about $684 million.
Put the two together, and the context becomes clear: first, the SEC exemption cracks open the gate; then major institutions with licenses rush to get in. A player of this level from the NYSE parent company matters more than short-term trading volume—it signals that “stocks on-chain” is moving from a crypto-native niche into legitimate business that traditional exchanges also want to compete for.
For ordinary users, the most direct change could be this: in the future, you really may be able to trade U.S. stocks 24/7 using stablecoins, without waiting for traditional brokerages to open. But on the flip side, the pricing, clearing, and which country’s securities laws govern tokenized stocks—these gaps still haven’t been filled. ⚖️
There’s another more realistic problem: the current “pool” is only on the order of a few hundred million dollars. If a large institution truly moves in funds at the tens-of-millions or even millions scale, insufficient depth would immediately amplify the issue. You might think you’re buying “U.S. stocks,” but you may actually just be buying a thinly liquid instrument—or a voucher with regulatory questions still hanging over it. 📉
If one day Apple or Nvidia can truly buy U.S. stocks on-chain 24/7 with stablecoins, would you move part of your U.S. stock positions onto the chain? Let’s discuss in the comments.
Click the avatar to watch the livestream
Every day, I’ll take you through crypto hot topics—not just what happens in the news, but also the logic and opportunities behind it 👀🚀

736
·
--
Verified
#以太坊验证者退出队列增392%
850,000 ETH wait in line to “get off” : Verifiers exiting the queue—up 392% since early October, directly setting a 2026 high.🦖
[⚡ 有大动静群里说](https://app.binance.com/uni-qr/JpwCPfBj)
According to beaconcha.in’s data on validator exits, there are currently 850,736 ETH stuck in the queue waiting to withdraw. Estimated at about $2,700 per ETH, that’s worth roughly $2.3 billion. The wait time has been extended to about 14 days and 18 hours, with only 256 validators allowed through per epoch.
The trigger wasn’t a market crash—it was a wallet’s risk-control action. On September 30, MetaMask disclosed a security incident affecting its staking infrastructure. It then proactively and preventively exited around 17,000 validators, totaling about 523,000 ETH (around $1.4 billion). ⚠️ The official position is that users’ wallets weren’t directly threatened, but this batch of “preventive evacuations” was enough by itself to push the queue to the top.
Breaking down the numbers 📊: Total staked ETH across the network is about 43.6 million, with 878,089 active validators. This queue volume is about 2% of that. The proportion isn’t huge, but the direction is telling—it proves something: the large-scale migration of validators is driven not just by price, but by operational and security decisions.
My take: the exit queue is a “buffer valve,” not a sell-pressure switch. For ETH to go out, it has to wait for more than two weeks. The pace at which it truly hits spot is being deliberately slowed. So don’t read “850,000 ETH queued” as “850,000 ETH about to dump immediately.” What’s more worth watching is the metric “queue time” itself—once it keeps stretching, it indicates that exit demand exceeds the network’s processing capacity. That pressure then propagates into discounting on liquid staking derivatives, staking yields, and the redemption timing of related protocols.
What’s really being repriced this time is, in effect, “who is holding your staking.” A wallet’s risk-control decision can instantly change the flow of funds across the chain. The knock-on effects caused by this concentration are more worth worrying about than any price chart.
Do you think this wave of exits is just for risk avoidance, or a convenient profit-taking move? Let’s discuss in the comments.
Click the avatar to watch the live stream
Every day, I’ll keep you updated on Ethereum and the on-chain data hot spots—not only what happens in the news, but also how to understand the underlying logic and opportunities behind it 👀🚀
#以太坊验证者退出队列增392%
850,000 ETH wait in line to “get off” : Verifiers exiting the queue—up 392% since early October, directly setting a 2026 high.🦖
⚡ 有大动静群里说
According to beaconcha.in’s data on validator exits, there are currently 850,736 ETH stuck in the queue waiting to withdraw. Estimated at about $2,700 per ETH, that’s worth roughly $2.3 billion. The wait time has been extended to about 14 days and 18 hours, with only 256 validators allowed through per epoch.
The trigger wasn’t a market crash—it was a wallet’s risk-control action. On September 30, MetaMask disclosed a security incident affecting its staking infrastructure. It then proactively and preventively exited around 17,000 validators, totaling about 523,000 ETH (around $1.4 billion). ⚠️ The official position is that users’ wallets weren’t directly threatened, but this batch of “preventive evacuations” was enough by itself to push the queue to the top.
Breaking down the numbers 📊: Total staked ETH across the network is about 43.6 million, with 878,089 active validators. This queue volume is about 2% of that. The proportion isn’t huge, but the direction is telling—it proves something: the large-scale migration of validators is driven not just by price, but by operational and security decisions.
My take: the exit queue is a “buffer valve,” not a sell-pressure switch. For ETH to go out, it has to wait for more than two weeks. The pace at which it truly hits spot is being deliberately slowed. So don’t read “850,000 ETH queued” as “850,000 ETH about to dump immediately.” What’s more worth watching is the metric “queue time” itself—once it keeps stretching, it indicates that exit demand exceeds the network’s processing capacity. That pressure then propagates into discounting on liquid staking derivatives, staking yields, and the redemption timing of related protocols.
What’s really being repriced this time is, in effect, “who is holding your staking.” A wallet’s risk-control decision can instantly change the flow of funds across the chain. The knock-on effects caused by this concentration are more worth worrying about than any price chart.
Do you think this wave of exits is just for risk avoidance, or a convenient profit-taking move? Let’s discuss in the comments.
Click the avatar to watch the live stream
Every day, I’ll keep you updated on Ethereum and the on-chain data hot spots—not only what happens in the news, but also how to understand the underlying logic and opportunities behind it 👀🚀
850,000 ETH wait in line to “get off” : Verifiers exiting the queue—up 392% since early October, directly setting a 2026 high.🦖
⚡ 有大动静群里说
According to beaconcha.in’s data on validator exits, there are currently 850,736 ETH stuck in the queue waiting to withdraw. Estimated at about $2,700 per ETH, that’s worth roughly $2.3 billion. The wait time has been extended to about 14 days and 18 hours, with only 256 validators allowed through per epoch.
The trigger wasn’t a market crash—it was a wallet’s risk-control action. On September 30, MetaMask disclosed a security incident affecting its staking infrastructure. It then proactively and preventively exited around 17,000 validators, totaling about 523,000 ETH (around $1.4 billion). ⚠️ The official position is that users’ wallets weren’t directly threatened, but this batch of “preventive evacuations” was enough by itself to push the queue to the top.
Breaking down the numbers 📊: Total staked ETH across the network is about 43.6 million, with 878,089 active validators. This queue volume is about 2% of that. The proportion isn’t huge, but the direction is telling—it proves something: the large-scale migration of validators is driven not just by price, but by operational and security decisions.
My take: the exit queue is a “buffer valve,” not a sell-pressure switch. For ETH to go out, it has to wait for more than two weeks. The pace at which it truly hits spot is being deliberately slowed. So don’t read “850,000 ETH queued” as “850,000 ETH about to dump immediately.” What’s more worth watching is the metric “queue time” itself—once it keeps stretching, it indicates that exit demand exceeds the network’s processing capacity. That pressure then propagates into discounting on liquid staking derivatives, staking yields, and the redemption timing of related protocols.
What’s really being repriced this time is, in effect, “who is holding your staking.” A wallet’s risk-control decision can instantly change the flow of funds across the chain. The knock-on effects caused by this concentration are more worth worrying about than any price chart.
Do you think this wave of exits is just for risk avoidance, or a convenient profit-taking move? Let’s discuss in the comments.
Click the avatar to watch the live stream
Every day, I’ll keep you updated on Ethereum and the on-chain data hot spots—not only what happens in the news, but also how to understand the underlying logic and opportunities behind it 👀🚀
2
549
Log in to explore more content
Join global crypto users on Binance Square
⚡️ Get latest and useful information about crypto.
💬 Trusted by the world’s largest crypto exchange.
👍 Discover real insights from verified creators.
Email / Phone number