
Junii Ahmad
737 Beiträge
Junii Ahmad
Melden
Nutzer blockieren
📊 Crypto Trader | Technical Analysis & Risk Management | Disciplined Execution over Emotion 🎯
Regelmäßiger Trader
2 Jahre
214 Following
71 Follower
224 Like gegeben
Beiträge
Alle
Zitierungen
Videos
Live
PINNED
·
--
Bullisch
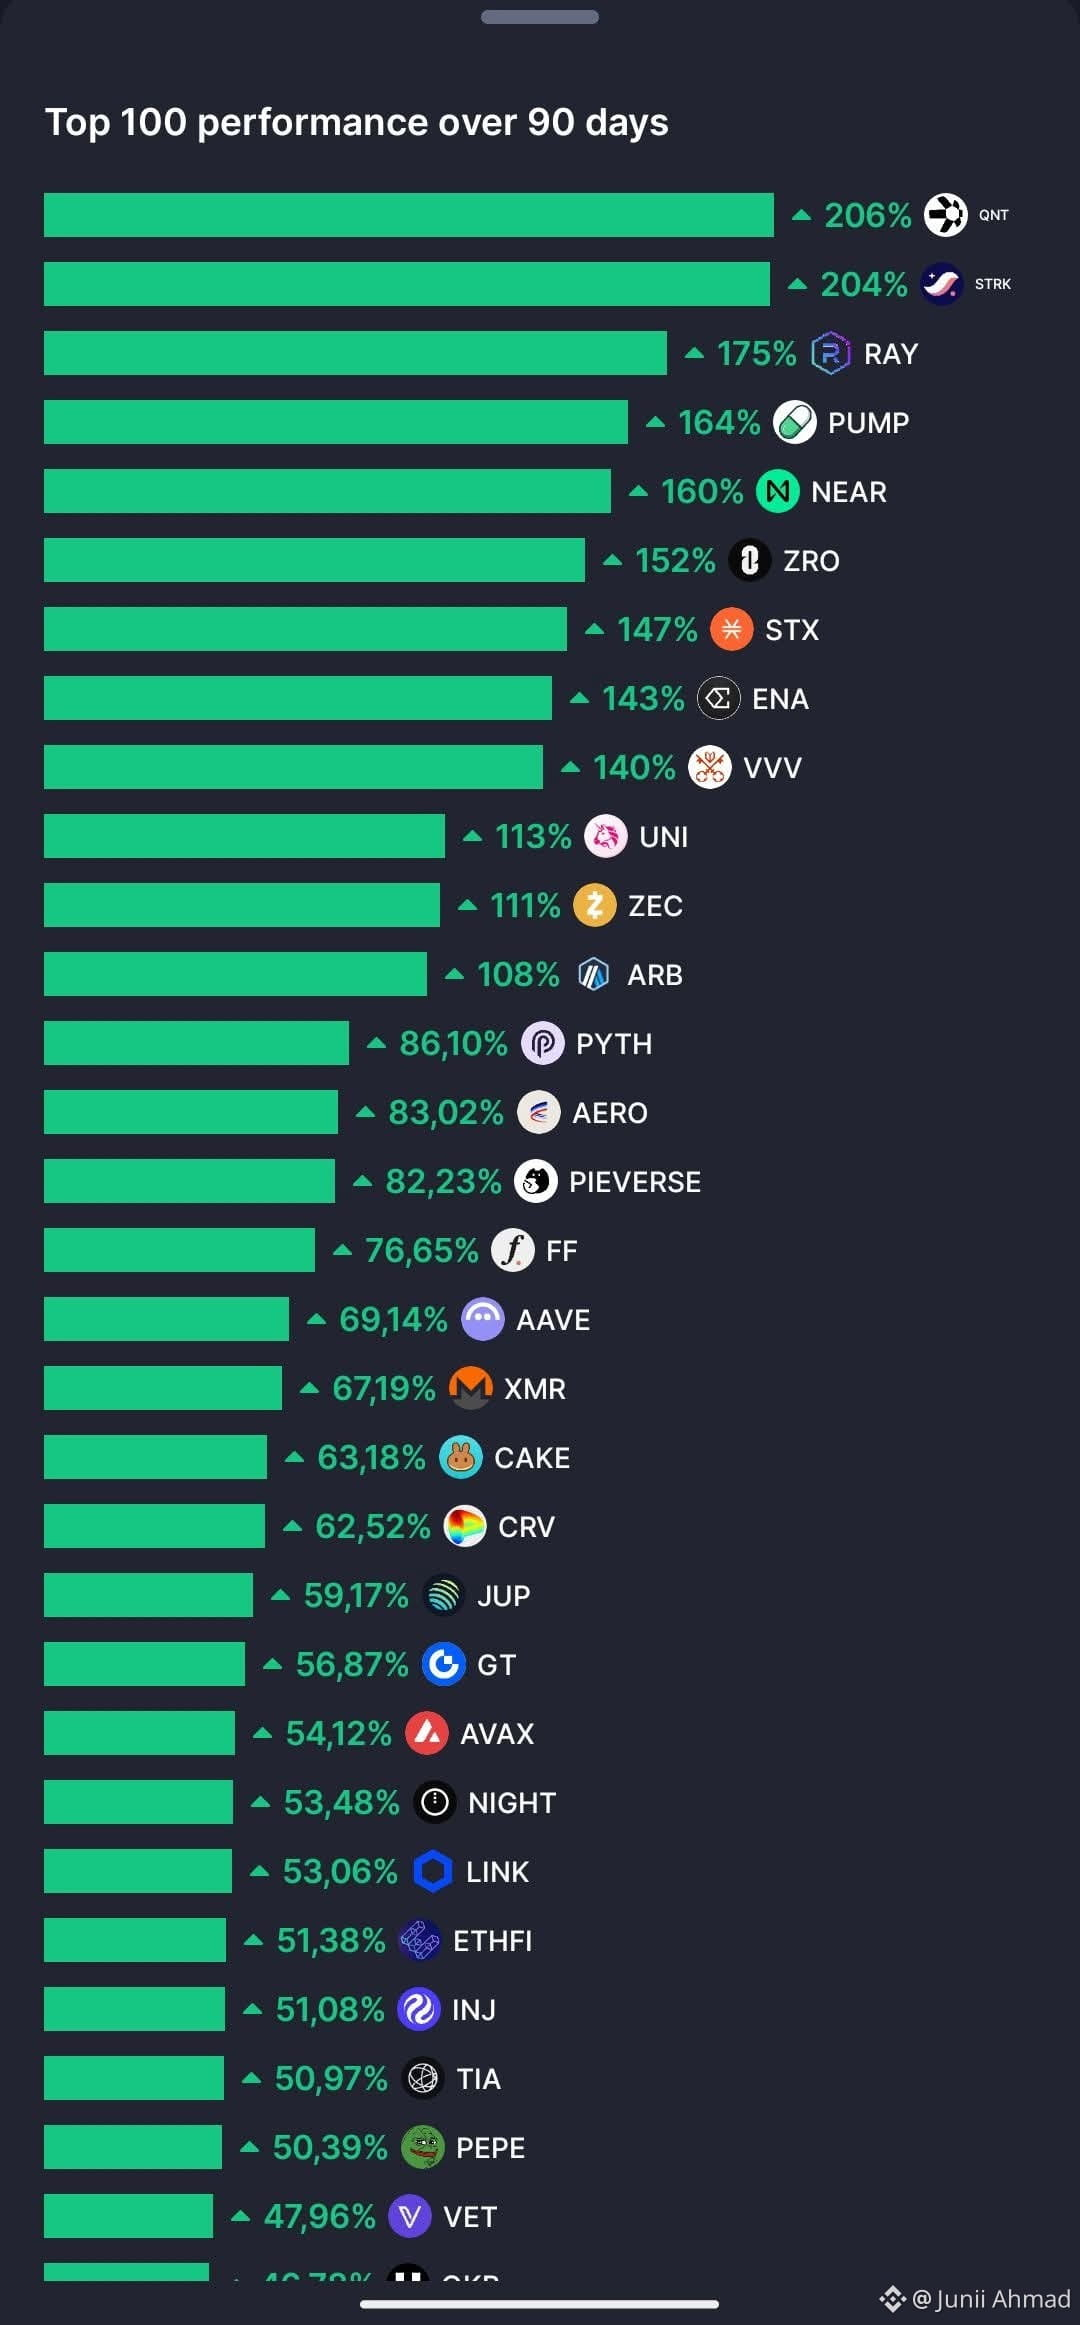
"Mit Blick auf die Wertentwicklung der Top 100 Coins in den vergangenen 90 Tagen haben wir einige der besten ausgewählt, die wir Ihnen vorstellen möchten."
$QNT $STRK $RAY
#CelestiaRises16%To2026High #NasdaqDowWeeklyGapWidestSinceJuly2002 #Nasdaq100Falls5.5%InWorstWeekIn18Months #StrategySharesFall9%OnFriday #USPPIRises6.3%YearOverYear
"Mit Blick auf die Wertentwicklung der Top 100 Coins in den vergangenen 90 Tagen haben wir einige der besten ausgewählt, die wir Ihnen vorstellen möchten."
$QNT $STRK $RAY
#CelestiaRises16%To2026High #NasdaqDowWeeklyGapWidestSinceJuly2002 #Nasdaq100Falls5.5%InWorstWeekIn18Months #StrategySharesFall9%OnFriday #USPPIRises6.3%YearOverYear
$QNT $STRK $RAY
#CelestiaRises16%To2026High #NasdaqDowWeeklyGapWidestSinceJuly2002 #Nasdaq100Falls5.5%InWorstWeekIn18Months #StrategySharesFall9%OnFriday #USPPIRises6.3%YearOverYear
2
3
4.3k
·
--
Artikel
Übersetzung ansehen
Hope - The Trader's Double-Edged SwordHope is the most dangerous emotion in trading because it feels like a virtue while acting like a vice.
You bought a stock at $50 after careful analysis indicated it was fundamentally undervalued and technically oversold. The company had solid earnings and good management, and you felt confident about your research. The stock climbed to $60, validating your thesis and making you feel smart. Then earnings came out slightly below expectations, and the stock dropped to $45. Your predetermined stop loss was at $47, but you didn't take it because you hoped it would recover. After all, the fundamentals hadn't really changed, and surely the market was overreacting.
Then it went to $40. Then $35. Then $30. Each day, you find new reasons to hope: maybe the next earnings will be better, maybe an analyst will upgrade the stock, or maybe the whole sector is due for a bounce. What started as a well-researched trade based on sound analysis has become a desperate wish that the market will somehow validate your original decision, or at least get back to even, so you can exit without a loss.
If this scenario sounds painfully familiar, you're not alone. Hope might be the most complex and dangerous emotion that traders face, precisely because it masquerades as something positive while slowly destroying your account.
The Paradox of Hope in Trading.
Hope presents a unique challenge for traders because in almost every other area of life, hope is considered positive and essential. Hope motivates us to pursue difficult goals, sustains us through challenging times, and helps us maintain optimism in the face of setbacks. In these contexts, hope costs nothing and provides significant psychological benefits even when things don't work out as planned.
Trading turns this equation upside down. In the markets, hope has a direct financial cost that increases every moment you hold onto a losing position. When you hope that a declining stock will recover, you're not maintaining a positive attitude; you're actively losing money with each tick lower. When you hope your analysis will eventually be proven right, you risk turning a small, manageable loss into a large one that hurts financially, mentally, and emotionally.
The paradox deepens when you consider that some level of hope is absolutely necessary for trading success. Without hope, you wouldn't have the confidence to enter trades based on your analysis or persist through the inevitable learning curve every trader faces. The challenge lies in learning to harness hope's motivational power while preventing it from clouding your judgment about individual trades.
This dual nature makes hope particularly insidious. When greed takes over, you usually know you're being greedy. When fear paralyzes you, you're aware that you're afraid. But when hope keeps you in a losing trade, you often feel like you're being patient, disciplined, or faithful to your analysis. The voice of hope sounds reasonable and measured, making arguments that seem logical even as they lead you toward a big financial loss. Strong conviction in a losing trade is not a positive emotion.
Understanding Hope's Two Faces
To manage hope effectively, you must first understand the fundamental difference between its constructive and destructive forms. These two faces of hope can look remarkably similar on the surface, but they lead to completely different outcomes in your trading.
Constructive hope is grounded in evidence and realistic expectations. It's the hope that your carefully researched stock will eventually reflect its fair value, but it comes with predetermined time limits and exit strategies. It's the hope that your proven trading system will continue to work over time, even though individual trades may fail. This type of hope acknowledges uncertainty and prepares for multiple outcomes. It says, "I hope this trade works out, but if it doesn't, I know exactly when and how I'll exit."
Constructive hope also maintains perspective on the bigger picture. It focuses on long-term results rather than individual trade outcomes, sustaining you through difficult periods without preventing you from taking necessary losses.
Destructive hope, on the other hand, is characterized by wishful thinking that ignores evidence and avoids planning for adverse outcomes. Hope keeps you in losing trades long after your original analysis has been proven wrong. This type of hope has no time limits, no exit strategies, and no acknowledgment that things might not work out as desired.
Destructive hope often becomes more intense as losses mount. Instead of accepting that a trade isn't working, this type of hope doubles down on optimism, finding increasingly desperate reasons why the position should recover. It goes from "I hope this works" to "It has to work" to "I can't afford this not to work."
The difference between constructive and destructive hope often comes down to timing and planning. Constructive hope does its work before and between trades, motivating you to research opportunities and maintain confidence. Destructive hope takes over during trades, particularly losing ones, and prevents you from executing your predetermined exit strategies.
The Psychology Behind Trading Hope
To understand why hope can be so destructive in trading, you need to understand what's happening in your brain when you're holding onto losing positions. Hope activates the same neural pathways involved in addiction, creating chemical rewards that make it difficult to abandon losing positions. When you hope for a trade to recover, your brain releases dopamine in anticipation of that recovery, even though the recovery may never come.
Cognitive dissonance plays a major role in how hope develops and persists. When reality conflicts with your beliefs or expectations, your brain experiences psychological discomfort and works to resolve the conflict. If you believe you're a good trader but your current position is losing money, hope offers a convenient solution: it suggests the position will eventually become profitable.
Hope also functions as a coping mechanism that helps you avoid the immediate emotional pain of realizing losses. Taking a loss requires you to confront the reality that you were wrong and that you lost money. Hope allows you to postpone this confrontation indefinitely by maintaining the fiction that the loss isn't real as long as you haven't closed the position.
The sunk cost fallacy amplifies hope by making you focus on what you've already invested rather than what you're likely to gain or lose going forward. The more money you've lost on a position, the harder it becomes to close it because hope whispers that walking away now would mean all those losses were for nothing.
The Hope-Denial Spectrum
One of the most important skills you can develop is recognizing where you fall on the spectrum from healthy optimism to dangerous denial. Hope doesn't suddenly become destructive. It gradually transforms from reasonable expectation into desperate wishful thinking.
The spectrum begins with reasonable optimism, which is healthy and necessary for trading. When you enter a well-researched trade, it's reasonable to be optimistic about the outcome. This optimism is grounded in evidence, acknowledges the possibility of being wrong, and includes specific plans for adverse scenarios.
As a trade moves against you, reasonable optimism can shift into stubborn hope. You start ignoring new information that contradicts your thesis while giving extra weight to any positive developments. The shift is subtle but important: you're no longer updating your analysis based on new information but filtering information to support your existing hope.
Stubborn hope can escalate into desperate hope as losses mount. At this stage, you're no longer hoping based on analysis; you're hoping because you need the trade to work out. Your reasons become increasingly emotional and less logical: "I can't afford to lose this much money" or "This position has to recover because I've already lost so much."
The final stage is complete denial, where you refuse to acknowledge that the position is a loser. You stop monitoring the position closely, avoid looking at your account balance, or convince yourself that the loss doesn't count because you haven't closed the position yet.
Each stage represents a deeper departure from rational trading. The key is learning to recognize where you are on this spectrum in real time, particularly during the transition from reasonable optimism to stubborn hope, where you still have the most control.
When Hope Becomes Averaging Down
One of the most dangerous manifestations of hope is when it leads to averaging down, buying more of a position as the price declines. Hope makes averaging down feel logical by reframing declining prices as opportunities rather than warnings. If your analysis was right at $50, surely it's even more right at $45.
The mathematics of averaging down can be seductive. If you bought 100 shares at $50 and another 100 at $45, your average cost is now $47.50. Hope focuses on the smaller recovery needed to break even, while ignoring the possibility that the stock might continue to decline.
Averaging down also offers psychological benefits that hopeful people want. It gives you something active to do instead of passively watching your position lose money. This sense of taking control can be emotionally satisfying, even when the action is making the situation worse.
The danger becomes clear when averaging down fails. The increasingly attractive average price seems to justify each additional purchase, but each addition increases your total exposure. What started as a manageable 5% position can easily become 10%, 15%, or even 20% of your account.
Hope makes averaging down particularly dangerous because it changes your relationship with the position. Instead of viewing declining prices as evidence that your original analysis might have been wrong, hope reframes them as opportunities to improve your average cost. This prevents objective evaluation of whether your original reasons for buying are still valid. Dollar-cost averaging is for investors in indexes over decades, not traders on a daily chart looking for profits on an individual trade. Averaging down in a losing trade due to hope is one of the most destructive behaviors that keep traders unprofitable and their capital trapped on the wrong side of the trend.
Setting Hope Boundaries
Just as you set financial boundaries through position sizing and stop losses, you need psychological boundaries that prevent hope from overriding rational decision-making. These hope boundaries serve as circuit breakers that trigger when hope begins transforming from a helpful emotion into a destructive force.
Time-based boundaries are among the most effective limits. Before entering any trade, establish a maximum holding periodif it's not working as expected. When your time stop limit is reached, close the position regardless of your emotions about its potential.
Stop-loss boundaries provide another crucial constraint. Predetermine the maximum amount you're willing to lose on any single trade, and close the position when that loss is reached. This boundary should be set before entering the trade, when you're thinking clearly and objectively.
Evidence-based boundaries help prevent hope from overriding objective analysis. Before entering a trade, identify specific technical or fundamental changes that would invalidate your original thesis. When these predetermined conditions are met, close the position regardless of your hope for recovery.
confidence that consistent execution of a sound approach will lead to profitability over time.
The most successful traders maintain tremendous hope and optimism about their long-term prospects while being absolutely ruthless in managing individual positions. They hope their systems will continue working and that they'll continue improving as traders. But they never let hope prevent them from taking necessary stops, managing risk appropriately, or admitting when individual trades aren't working.
As you continue developing your trading skills, pay attention to the quality and direction of your hope. Notice when it's motivating productive behavior like research and planning, and when it's encouraging passive behavior like holding losing positions or avoiding difficult decisions. The more aware you become of hope's influence, the better you can channel it toward activities that actually improve your trading results.
Key Strategies for Managing Hope
*Set predetermined time limits for all trades: Close positions when time limits are reached, regardless of hope for recovery
*Establish maximum loss limits before entering trades: Exit when loss limits are hit, no matter how much you hope for a turnaround
*Create specific invalidation criteria for each trade: Predetermine what evidence would prove your analysis wrong
*Schedule regular position reviews with a fresh-eyed evaluation: Ask whether you would initiate each position if starting today
*Write detailed pre-trade plans, including exit strategies like profit targets and trailing stops: Refer back to original analysis when hope clouds judgment
*Keep a trading journal to identify patterns: Track instances when hope overrode rational decision-making
*Use automated stops and alerts to remove emotions: Let technology execute predetermined exit strategies
*Focus hope on process improvement rather than trade outcomes: Hope for better skills, not individual position recovery
*Convert hopes into specific scenario planning: Prepare concrete responses for different market conditions
#WhatWillDriveCryptoandStocks’NextRebound? #Anthropic’s6xIPODemandSignalsPotentialRecordRaise #JaneStreetNearlyOctuplesFidelityBitcoinETFHoldings #USPPIMissMayEaseBTCPressure #BitcoinCoreDisclosesTorTrafficVulnerability
Hope - The Trader's Double-Edged Sword
Hope is the most dangerous emotion in trading because it feels like a virtue while acting like a vice.
You bought a stock at $50 after careful analysis indicated it was fundamentally undervalued and technically oversold. The company had solid earnings and good management, and you felt confident about your research. The stock climbed to $60, validating your thesis and making you feel smart. Then earnings came out slightly below expectations, and the stock dropped to $45. Your predetermined stop loss was at $47, but you didn't take it because you hoped it would recover. After all, the fundamentals hadn't really changed, and surely the market was overreacting.
Then it went to $40. Then $35. Then $30. Each day, you find new reasons to hope: maybe the next earnings will be better, maybe an analyst will upgrade the stock, or maybe the whole sector is due for a bounce. What started as a well-researched trade based on sound analysis has become a desperate wish that the market will somehow validate your original decision, or at least get back to even, so you can exit without a loss.
If this scenario sounds painfully familiar, you're not alone. Hope might be the most complex and dangerous emotion that traders face, precisely because it masquerades as something positive while slowly destroying your account.
The Paradox of Hope in Trading.
Hope presents a unique challenge for traders because in almost every other area of life, hope is considered positive and essential. Hope motivates us to pursue difficult goals, sustains us through challenging times, and helps us maintain optimism in the face of setbacks. In these contexts, hope costs nothing and provides significant psychological benefits even when things don't work out as planned.
Trading turns this equation upside down. In the markets, hope has a direct financial cost that increases every moment you hold onto a losing position. When you hope that a declining stock will recover, you're not maintaining a positive attitude; you're actively losing money with each tick lower. When you hope your analysis will eventually be proven right, you risk turning a small, manageable loss into a large one that hurts financially, mentally, and emotionally.
The paradox deepens when you consider that some level of hope is absolutely necessary for trading success. Without hope, you wouldn't have the confidence to enter trades based on your analysis or persist through the inevitable learning curve every trader faces. The challenge lies in learning to harness hope's motivational power while preventing it from clouding your judgment about individual trades.
This dual nature makes hope particularly insidious. When greed takes over, you usually know you're being greedy. When fear paralyzes you, you're aware that you're afraid. But when hope keeps you in a losing trade, you often feel like you're being patient, disciplined, or faithful to your analysis. The voice of hope sounds reasonable and measured, making arguments that seem logical even as they lead you toward a big financial loss. Strong conviction in a losing trade is not a positive emotion.
Understanding Hope's Two Faces
To manage hope effectively, you must first understand the fundamental difference between its constructive and destructive forms. These two faces of hope can look remarkably similar on the surface, but they lead to completely different outcomes in your trading.
Constructive hope is grounded in evidence and realistic expectations. It's the hope that your carefully researched stock will eventually reflect its fair value, but it comes with predetermined time limits and exit strategies. It's the hope that your proven trading system will continue to work over time, even though individual trades may fail. This type of hope acknowledges uncertainty and prepares for multiple outcomes. It says, "I hope this trade works out, but if it doesn't, I know exactly when and how I'll exit."
Constructive hope also maintains perspective on the bigger picture. It focuses on long-term results rather than individual trade outcomes, sustaining you through difficult periods without preventing you from taking necessary losses.
Destructive hope, on the other hand, is characterized by wishful thinking that ignores evidence and avoids planning for adverse outcomes. Hope keeps you in losing trades long after your original analysis has been proven wrong. This type of hope has no time limits, no exit strategies, and no acknowledgment that things might not work out as desired.
Destructive hope often becomes more intense as losses mount. Instead of accepting that a trade isn't working, this type of hope doubles down on optimism, finding increasingly desperate reasons why the position should recover. It goes from "I hope this works" to "It has to work" to "I can't afford this not to work."
The difference between constructive and destructive hope often comes down to timing and planning. Constructive hope does its work before and between trades, motivating you to research opportunities and maintain confidence. Destructive hope takes over during trades, particularly losing ones, and prevents you from executing your predetermined exit strategies.
The Psychology Behind Trading Hope
To understand why hope can be so destructive in trading, you need to understand what's happening in your brain when you're holding onto losing positions. Hope activates the same neural pathways involved in addiction, creating chemical rewards that make it difficult to abandon losing positions. When you hope for a trade to recover, your brain releases dopamine in anticipation of that recovery, even though the recovery may never come.
Cognitive dissonance plays a major role in how hope develops and persists. When reality conflicts with your beliefs or expectations, your brain experiences psychological discomfort and works to resolve the conflict. If you believe you're a good trader but your current position is losing money, hope offers a convenient solution: it suggests the position will eventually become profitable.
Hope also functions as a coping mechanism that helps you avoid the immediate emotional pain of realizing losses. Taking a loss requires you to confront the reality that you were wrong and that you lost money. Hope allows you to postpone this confrontation indefinitely by maintaining the fiction that the loss isn't real as long as you haven't closed the position.
The sunk cost fallacy amplifies hope by making you focus on what you've already invested rather than what you're likely to gain or lose going forward. The more money you've lost on a position, the harder it becomes to close it because hope whispers that walking away now would mean all those losses were for nothing.
The Hope-Denial Spectrum
One of the most important skills you can develop is recognizing where you fall on the spectrum from healthy optimism to dangerous denial. Hope doesn't suddenly become destructive. It gradually transforms from reasonable expectation into desperate wishful thinking.
The spectrum begins with reasonable optimism, which is healthy and necessary for trading. When you enter a well-researched trade, it's reasonable to be optimistic about the outcome. This optimism is grounded in evidence, acknowledges the possibility of being wrong, and includes specific plans for adverse scenarios.
As a trade moves against you, reasonable optimism can shift into stubborn hope. You start ignoring new information that contradicts your thesis while giving extra weight to any positive developments. The shift is subtle but important: you're no longer updating your analysis based on new information but filtering information to support your existing hope.
Stubborn hope can escalate into desperate hope as losses mount. At this stage, you're no longer hoping based on analysis; you're hoping because you need the trade to work out. Your reasons become increasingly emotional and less logical: "I can't afford to lose this much money" or "This position has to recover because I've already lost so much."
The final stage is complete denial, where you refuse to acknowledge that the position is a loser. You stop monitoring the position closely, avoid looking at your account balance, or convince yourself that the loss doesn't count because you haven't closed the position yet.
Each stage represents a deeper departure from rational trading. The key is learning to recognize where you are on this spectrum in real time, particularly during the transition from reasonable optimism to stubborn hope, where you still have the most control.
When Hope Becomes Averaging Down
One of the most dangerous manifestations of hope is when it leads to averaging down, buying more of a position as the price declines. Hope makes averaging down feel logical by reframing declining prices as opportunities rather than warnings. If your analysis was right at $50, surely it's even more right at $45.
The mathematics of averaging down can be seductive. If you bought 100 shares at $50 and another 100 at $45, your average cost is now $47.50. Hope focuses on the smaller recovery needed to break even, while ignoring the possibility that the stock might continue to decline.
Averaging down also offers psychological benefits that hopeful people want. It gives you something active to do instead of passively watching your position lose money. This sense of taking control can be emotionally satisfying, even when the action is making the situation worse.
The danger becomes clear when averaging down fails. The increasingly attractive average price seems to justify each additional purchase, but each addition increases your total exposure. What started as a manageable 5% position can easily become 10%, 15%, or even 20% of your account.
Hope makes averaging down particularly dangerous because it changes your relationship with the position. Instead of viewing declining prices as evidence that your original analysis might have been wrong, hope reframes them as opportunities to improve your average cost. This prevents objective evaluation of whether your original reasons for buying are still valid. Dollar-cost averaging is for investors in indexes over decades, not traders on a daily chart looking for profits on an individual trade. Averaging down in a losing trade due to hope is one of the most destructive behaviors that keep traders unprofitable and their capital trapped on the wrong side of the trend.
Setting Hope Boundaries
Just as you set financial boundaries through position sizing and stop losses, you need psychological boundaries that prevent hope from overriding rational decision-making. These hope boundaries serve as circuit breakers that trigger when hope begins transforming from a helpful emotion into a destructive force.
Time-based boundaries are among the most effective limits. Before entering any trade, establish a maximum holding periodif it's not working as expected. When your time stop limit is reached, close the position regardless of your emotions about its potential.
Stop-loss boundaries provide another crucial constraint. Predetermine the maximum amount you're willing to lose on any single trade, and close the position when that loss is reached. This boundary should be set before entering the trade, when you're thinking clearly and objectively.
Evidence-based boundaries help prevent hope from overriding objective analysis. Before entering a trade, identify specific technical or fundamental changes that would invalidate your original thesis. When these predetermined conditions are met, close the position regardless of your hope for recovery.
confidence that consistent execution of a sound approach will lead to profitability over time.
The most successful traders maintain tremendous hope and optimism about their long-term prospects while being absolutely ruthless in managing individual positions. They hope their systems will continue working and that they'll continue improving as traders. But they never let hope prevent them from taking necessary stops, managing risk appropriately, or admitting when individual trades aren't working.
As you continue developing your trading skills, pay attention to the quality and direction of your hope. Notice when it's motivating productive behavior like research and planning, and when it's encouraging passive behavior like holding losing positions or avoiding difficult decisions. The more aware you become of hope's influence, the better you can channel it toward activities that actually improve your trading results.
Key Strategies for Managing Hope
*Set predetermined time limits for all trades: Close positions when time limits are reached, regardless of hope for recovery
*Establish maximum loss limits before entering trades: Exit when loss limits are hit, no matter how much you hope for a turnaround
*Create specific invalidation criteria for each trade: Predetermine what evidence would prove your analysis wrong
*Schedule regular position reviews with a fresh-eyed evaluation: Ask whether you would initiate each position if starting today
*Write detailed pre-trade plans, including exit strategies like profit targets and trailing stops: Refer back to original analysis when hope clouds judgment
*Keep a trading journal to identify patterns: Track instances when hope overrode rational decision-making
*Use automated stops and alerts to remove emotions: Let technology execute predetermined exit strategies
*Focus hope on process improvement rather than trade outcomes: Hope for better skills, not individual position recovery
*Convert hopes into specific scenario planning: Prepare concrete responses for different market conditions
#WhatWillDriveCryptoandStocks’NextRebound? #Anthropic’s6xIPODemandSignalsPotentialRecordRaise #JaneStreetNearlyOctuplesFidelityBitcoinETFHoldings #USPPIMissMayEaseBTCPressure #BitcoinCoreDisclosesTorTrafficVulnerability
You bought a stock at $50 after careful analysis indicated it was fundamentally undervalued and technically oversold. The company had solid earnings and good management, and you felt confident about your research. The stock climbed to $60, validating your thesis and making you feel smart. Then earnings came out slightly below expectations, and the stock dropped to $45. Your predetermined stop loss was at $47, but you didn't take it because you hoped it would recover. After all, the fundamentals hadn't really changed, and surely the market was overreacting.
Then it went to $40. Then $35. Then $30. Each day, you find new reasons to hope: maybe the next earnings will be better, maybe an analyst will upgrade the stock, or maybe the whole sector is due for a bounce. What started as a well-researched trade based on sound analysis has become a desperate wish that the market will somehow validate your original decision, or at least get back to even, so you can exit without a loss.
If this scenario sounds painfully familiar, you're not alone. Hope might be the most complex and dangerous emotion that traders face, precisely because it masquerades as something positive while slowly destroying your account.
The Paradox of Hope in Trading.
Hope presents a unique challenge for traders because in almost every other area of life, hope is considered positive and essential. Hope motivates us to pursue difficult goals, sustains us through challenging times, and helps us maintain optimism in the face of setbacks. In these contexts, hope costs nothing and provides significant psychological benefits even when things don't work out as planned.
Trading turns this equation upside down. In the markets, hope has a direct financial cost that increases every moment you hold onto a losing position. When you hope that a declining stock will recover, you're not maintaining a positive attitude; you're actively losing money with each tick lower. When you hope your analysis will eventually be proven right, you risk turning a small, manageable loss into a large one that hurts financially, mentally, and emotionally.
The paradox deepens when you consider that some level of hope is absolutely necessary for trading success. Without hope, you wouldn't have the confidence to enter trades based on your analysis or persist through the inevitable learning curve every trader faces. The challenge lies in learning to harness hope's motivational power while preventing it from clouding your judgment about individual trades.
This dual nature makes hope particularly insidious. When greed takes over, you usually know you're being greedy. When fear paralyzes you, you're aware that you're afraid. But when hope keeps you in a losing trade, you often feel like you're being patient, disciplined, or faithful to your analysis. The voice of hope sounds reasonable and measured, making arguments that seem logical even as they lead you toward a big financial loss. Strong conviction in a losing trade is not a positive emotion.
Understanding Hope's Two Faces
To manage hope effectively, you must first understand the fundamental difference between its constructive and destructive forms. These two faces of hope can look remarkably similar on the surface, but they lead to completely different outcomes in your trading.
Constructive hope is grounded in evidence and realistic expectations. It's the hope that your carefully researched stock will eventually reflect its fair value, but it comes with predetermined time limits and exit strategies. It's the hope that your proven trading system will continue to work over time, even though individual trades may fail. This type of hope acknowledges uncertainty and prepares for multiple outcomes. It says, "I hope this trade works out, but if it doesn't, I know exactly when and how I'll exit."
Constructive hope also maintains perspective on the bigger picture. It focuses on long-term results rather than individual trade outcomes, sustaining you through difficult periods without preventing you from taking necessary losses.
Destructive hope, on the other hand, is characterized by wishful thinking that ignores evidence and avoids planning for adverse outcomes. Hope keeps you in losing trades long after your original analysis has been proven wrong. This type of hope has no time limits, no exit strategies, and no acknowledgment that things might not work out as desired.
Destructive hope often becomes more intense as losses mount. Instead of accepting that a trade isn't working, this type of hope doubles down on optimism, finding increasingly desperate reasons why the position should recover. It goes from "I hope this works" to "It has to work" to "I can't afford this not to work."
The difference between constructive and destructive hope often comes down to timing and planning. Constructive hope does its work before and between trades, motivating you to research opportunities and maintain confidence. Destructive hope takes over during trades, particularly losing ones, and prevents you from executing your predetermined exit strategies.
The Psychology Behind Trading Hope
To understand why hope can be so destructive in trading, you need to understand what's happening in your brain when you're holding onto losing positions. Hope activates the same neural pathways involved in addiction, creating chemical rewards that make it difficult to abandon losing positions. When you hope for a trade to recover, your brain releases dopamine in anticipation of that recovery, even though the recovery may never come.
Cognitive dissonance plays a major role in how hope develops and persists. When reality conflicts with your beliefs or expectations, your brain experiences psychological discomfort and works to resolve the conflict. If you believe you're a good trader but your current position is losing money, hope offers a convenient solution: it suggests the position will eventually become profitable.
Hope also functions as a coping mechanism that helps you avoid the immediate emotional pain of realizing losses. Taking a loss requires you to confront the reality that you were wrong and that you lost money. Hope allows you to postpone this confrontation indefinitely by maintaining the fiction that the loss isn't real as long as you haven't closed the position.
The sunk cost fallacy amplifies hope by making you focus on what you've already invested rather than what you're likely to gain or lose going forward. The more money you've lost on a position, the harder it becomes to close it because hope whispers that walking away now would mean all those losses were for nothing.
The Hope-Denial Spectrum
One of the most important skills you can develop is recognizing where you fall on the spectrum from healthy optimism to dangerous denial. Hope doesn't suddenly become destructive. It gradually transforms from reasonable expectation into desperate wishful thinking.
The spectrum begins with reasonable optimism, which is healthy and necessary for trading. When you enter a well-researched trade, it's reasonable to be optimistic about the outcome. This optimism is grounded in evidence, acknowledges the possibility of being wrong, and includes specific plans for adverse scenarios.
As a trade moves against you, reasonable optimism can shift into stubborn hope. You start ignoring new information that contradicts your thesis while giving extra weight to any positive developments. The shift is subtle but important: you're no longer updating your analysis based on new information but filtering information to support your existing hope.
Stubborn hope can escalate into desperate hope as losses mount. At this stage, you're no longer hoping based on analysis; you're hoping because you need the trade to work out. Your reasons become increasingly emotional and less logical: "I can't afford to lose this much money" or "This position has to recover because I've already lost so much."
The final stage is complete denial, where you refuse to acknowledge that the position is a loser. You stop monitoring the position closely, avoid looking at your account balance, or convince yourself that the loss doesn't count because you haven't closed the position yet.
Each stage represents a deeper departure from rational trading. The key is learning to recognize where you are on this spectrum in real time, particularly during the transition from reasonable optimism to stubborn hope, where you still have the most control.
When Hope Becomes Averaging Down
One of the most dangerous manifestations of hope is when it leads to averaging down, buying more of a position as the price declines. Hope makes averaging down feel logical by reframing declining prices as opportunities rather than warnings. If your analysis was right at $50, surely it's even more right at $45.
The mathematics of averaging down can be seductive. If you bought 100 shares at $50 and another 100 at $45, your average cost is now $47.50. Hope focuses on the smaller recovery needed to break even, while ignoring the possibility that the stock might continue to decline.
Averaging down also offers psychological benefits that hopeful people want. It gives you something active to do instead of passively watching your position lose money. This sense of taking control can be emotionally satisfying, even when the action is making the situation worse.
The danger becomes clear when averaging down fails. The increasingly attractive average price seems to justify each additional purchase, but each addition increases your total exposure. What started as a manageable 5% position can easily become 10%, 15%, or even 20% of your account.
Hope makes averaging down particularly dangerous because it changes your relationship with the position. Instead of viewing declining prices as evidence that your original analysis might have been wrong, hope reframes them as opportunities to improve your average cost. This prevents objective evaluation of whether your original reasons for buying are still valid. Dollar-cost averaging is for investors in indexes over decades, not traders on a daily chart looking for profits on an individual trade. Averaging down in a losing trade due to hope is one of the most destructive behaviors that keep traders unprofitable and their capital trapped on the wrong side of the trend.
Setting Hope Boundaries
Just as you set financial boundaries through position sizing and stop losses, you need psychological boundaries that prevent hope from overriding rational decision-making. These hope boundaries serve as circuit breakers that trigger when hope begins transforming from a helpful emotion into a destructive force.
Time-based boundaries are among the most effective limits. Before entering any trade, establish a maximum holding periodif it's not working as expected. When your time stop limit is reached, close the position regardless of your emotions about its potential.
Stop-loss boundaries provide another crucial constraint. Predetermine the maximum amount you're willing to lose on any single trade, and close the position when that loss is reached. This boundary should be set before entering the trade, when you're thinking clearly and objectively.
Evidence-based boundaries help prevent hope from overriding objective analysis. Before entering a trade, identify specific technical or fundamental changes that would invalidate your original thesis. When these predetermined conditions are met, close the position regardless of your hope for recovery.
confidence that consistent execution of a sound approach will lead to profitability over time.
The most successful traders maintain tremendous hope and optimism about their long-term prospects while being absolutely ruthless in managing individual positions. They hope their systems will continue working and that they'll continue improving as traders. But they never let hope prevent them from taking necessary stops, managing risk appropriately, or admitting when individual trades aren't working.
As you continue developing your trading skills, pay attention to the quality and direction of your hope. Notice when it's motivating productive behavior like research and planning, and when it's encouraging passive behavior like holding losing positions or avoiding difficult decisions. The more aware you become of hope's influence, the better you can channel it toward activities that actually improve your trading results.
Key Strategies for Managing Hope
*Set predetermined time limits for all trades: Close positions when time limits are reached, regardless of hope for recovery
*Establish maximum loss limits before entering trades: Exit when loss limits are hit, no matter how much you hope for a turnaround
*Create specific invalidation criteria for each trade: Predetermine what evidence would prove your analysis wrong
*Schedule regular position reviews with a fresh-eyed evaluation: Ask whether you would initiate each position if starting today
*Write detailed pre-trade plans, including exit strategies like profit targets and trailing stops: Refer back to original analysis when hope clouds judgment
*Keep a trading journal to identify patterns: Track instances when hope overrode rational decision-making
*Use automated stops and alerts to remove emotions: Let technology execute predetermined exit strategies
*Focus hope on process improvement rather than trade outcomes: Hope for better skills, not individual position recovery
*Convert hopes into specific scenario planning: Prepare concrete responses for different market conditions
#WhatWillDriveCryptoandStocks’NextRebound? #Anthropic’s6xIPODemandSignalsPotentialRecordRaise #JaneStreetNearlyOctuplesFidelityBitcoinETFHoldings #USPPIMissMayEaseBTCPressure #BitcoinCoreDisclosesTorTrafficVulnerability
3
·
--

Artikel
Übersetzung ansehen
Thinking in Probabilities, Not Predictions or OpinionsTrading the Distribution, Not Obsessing Over Short-Term Outcomes
You will never know what the market is going to do. Nobody does. The analyst on television doesn't know, and the fund manager speaking confidently doesn't either. Neither do you, however good your chart looks when you take your entry. If you can understand this one idea, you're already ahead of most of the people you're trading against. Most of the people on the other side of your trades will spend all their time chasing the one thing that can't be done, which is predicting the future.
This is Chapter 1 from my book: How to Trade Like a Mathematician: Quantitative Trade Management Strategies, Risk Management, and Mathematical Models to Master the Stock Market.
A person who wants to trade like a mathematician takes a different approach entirely. They assign probabilities to a range of futures, then structure their decisions so that the math works out in their favor over many repetitions. That's the complete shift this chapter asks of you. Instead of asking, "What will this stock do next?" Ask a better question: "What does the distribution of outcomes look like for this trade, and does the math still favor me if I take this exact trade a hundred times?"
The Casino Owner's Mindset
Consider how a casino runs its floor. When a gambler sits down at the roulette table, the casino does not know whether that particular spin will win-or-lose money for the house. The gambler might hit their number and walk out with thirty-five times their bet. The casino shrugs. On an American roulette wheel, there are 38 pockets: the numbers 1 through 36, plus 0 and 00. A straight-up bet on a single number pays 35 to 1. The player therefore has a 1-in-38 probability of winning and a 37-in-38 probability of losing. For every $1 wagered, the casino’s expected profit is:
Expected casino profit = (37/38 × $1) − (1/38 × $35)
This equals approximately $0.0526, or 5.26 cents per dollar wagered. In percentage terms, the American roulette wheel gives the casino a 5.26% house edge. The casino won’t earn exactly 5.26% over every short period, but as the number of wagers increases, its average profit typically converges toward that mathematical expectation.
Notice what the casino never bothers to do. It never forecasts a spin. It owns a small edge and lets the law of large numbers grind that edge into money, night after night, table after table. On any evening, the house can lose. Over ten thousand spins, the outcome is close to certain. That is the model to follow: trade the way the house operates, and evaluate every position the way the casino evaluates a wheel, through expected value and never through opinion.
Expected Value: The Only Question That Matters
Expected value, or EV, is the mathematical heart of probabilistic trading. The formula:
EV = (Probability of Winning × Average Win) minus (Probability of Losing × Average Loss)
A positive number means the trade is worth taking repeatedly. A negative number means the trade is a slow donation to someone else's account, and it stays a donation no matter how strongly you feel about the setup or how many people on social media agree with you. That is why EV is the only question that matters.
Time for real numbers. Suppose you tracked a specific setup in your trading journal, such as a pullback to the 20-day moving average in a stock trending upward. Over 100 occurrences, 45 trades were winners and 55 were losers. Your winning trades averaged a gain of 2.5R, where R represents the amount risked per trade, while your losing trades averaged a loss of 1R because you consistently honored your stop-loss. Your estimated expectancy per trade would be:
EV = (0.45 × 2.5R) − (0.55 × 1R)
EV = 1.125R − 0.55R = +0.575R
This means the setup historically earned an average of 0.575R per trade. If you risked $100 per trade, that would equal an estimated average profit of $57.50 per trade. This does not mean every trade will earn 0.575R. It means that, across a sufficiently large sample of similar trades, the average result would be expected to approach that amount if the setup’s win rate and payoff ratio remain stable.
Across a sufficiently large number of comparable trades, this setup has historically produced an average gain of 0.575R per trade, even though it loses more often than it wins. Read that again. It challenges one of the most damaging beliefs in trading: that a profitable trader must be right most of the time.
A 45 percent win rate combined with an average winner of 2.5R and an average loser of 1R creates strong positive expectancy before commissions, slippage, and other trading costs. Meanwhile, a strategy with a 70 percent win rate can still lose money if its average loss is three times its average win.
EV = (0.70 × 1R) − (0.30 × 3R)
EV = 0.70R − 0.90R = −0.20R per trade
That trader may feel successful on most trading days while steadily losing capital over a large sample of trades. Whether the trader eventually goes broke depends on position sizing, available capital, the sequence of returns, and how long the negative-expectancy strategy is traded.
This is also why unsupported opinions are dangerous. An opinion says, “Apple is going up.” A probability-based trading statement says, “Based on 100 historical occurrences of this setup, approximately 45 percent reached the 2.5R target before hitting the 1R stop. If those results remain representative and execution costs do not eliminate the edge, the setup has an estimated expectancy of +0.575R per trade.”
That statement does not guarantee the outcome of the next trade. It provides a testable hypothesis with numbers that can be used for position sizing, risk management, and ongoing performance review. The shift from certainty and prediction to probability and expectancy is the whole point.
Individual Trades Mean Nothing; Samples Mean Everything
Now for the place where most traders quietly sabotage themselves. They judge their system trade by trade. They take a perfectly good positive expectancy trade, it loses, and they conclude the setup is broken. Or they take a terrible negative expectancy trade, it wins, and they conclude they've discovered a new edge. Both conclusions are mathematically illiterate, and I say that with love, because I want you to feel a small sting every time you catch yourself doing it.
A single outcome tells you very little about the quality of the decision that produced it. Flip a fair coin ten times, and there is about a 17 percent chance of getting seven or more heads. Seven heads in ten flips would not be sound evidence that the coin was biased because ten observations are too few to separate skill, edge, or bias from ordinary randomness.
Traders often make the same mistake when evaluating a system. They abandon a strategy after a short losing streak, even when that streak is consistent with the system’s expected win rate. A strategy with a 45 percent win rate loses 55 percent of its trades. The probability that any sequence of five trades will contain five consecutive losses is:
0.55⁵ ≈ 5.03 percent
That does not mean a five-trade losing streak will occur exactly once every twenty trades. Streaks can overlap, cluster, or remain absent for long periods. However, across hundreds of trades, one or more five-loss streaks should not be surprising. A single losing streak provides limited evidence that the strategy’s underlying edge has disappeared. Random sequences naturally produce clusters of wins and losses.
The practical defense is to establish evaluation rules before trading the system. Do not judge a setup from a handful of outcomes. Thirty trades may provide an initial sign, but 50 to 100 trades offer a more useful sample, and some strategies require far more because of their win rate, payoff distribution, trade frequency, and sensitivity to changing market conditions.
Record every valid occurrence in a trading journal, including the entry, stop, target, trailing stop, market conditions, execution costs, and the result in R multiples. Then compare the observed win rate, average win, average loss, expectancy, and drawdown with the strategy’s historical assumptions.
Even a large sample does not prove that an edge will continue forever. It gives you a stronger statistical basis for deciding whether recent results are consistent with normal variation or whether the strategy may have materially changed. The goal is not to replace judgment entirely, but to ensure judgment is grounded in evidence rather than emotion, isolated outcomes, or short-term noise.
Watch how this plays out under pressure. Say you trade a breakout strategy and you're 12 trades in with a record of 4 wins and 8 losses. Your emotional brain screams that the strategy is failing. Your mathematical brain runs a check instead. It asks how unusual 4 wins in 12 trades would be if the true win rate really were the expected 45 percent. The binomial distribution answers: getting 4 or fewer wins in 12 trials at a 45 percent win rate happens roughly a quarter of the time. Ordinary. It's the equivalent of rolling a die twice without seeing a six, and you'd never call that die broken. So you keep executing your strategy because 12 trades is far too small a sample to override a tested edge.
Position Sizing Is Where Probability Becomes Survival
Thinking in probabilities forces a hard conclusion about position sizing, too. Since any single trade can lose, no single trade can ever be allowed to matter very much. A setup that wins 45 percent of the time will hand you losing streaks of 5, 6, or even 8 trades with mathematical certainty over a long career. So your position sizing has to guarantee you survive the worst losing streak probability will realistically deal you eventually, and risk management has to guarantee your account survival in advance.
Run the numbers on risking 10 percent of your current account equity per trade. After eight consecutive full-risk losses, the account would retain:
0.90⁸ ≈ 43.05 percent
That is a drawdown of approximately 56.95 percent. Recovering from that loss would require a gain of about 132 percent just to return to the starting balance.
Now apply the same eight-trade losing streak while risking 1 percent of current equity per trade:
0.99⁸ ≈ 92.27 percent
The account would experience a drawdown of approximately 7.73 percent. Recovering from that loss would require a gain of about 8.38 percent.
For a strategy with a 45 percent win rate, eight consecutive losses are unlikely in any eight-trade sequence, but they become increasingly plausible as the number of trades grows. A probability-based trader therefore sizes positions for losing streaks that can reasonably occur, not for the winning trade expected next.
Many disciplined traders risk only a small fraction of their equity on each position, often around 0.5 percent to 2 percent, although the amount depends on the strategy’s historical drawdowns, volatility, correlation between positions, stop-loss reliability, and the trader’s risk tolerance. The principle is straightforward: position size should allow the account to survive normal losing streaks without suffering a drawdown so deep that recovery becomes mathematically difficult or psychologically unbearable.
Turning Market Views into Probability Estimates
The market won't hand you probabilities the way a roulette wheel does, so you have to build your own estimates, and three sources do most of the work. Your own journal comes first: log every setup, let your realized win rate and average R multiples become your probability inputs, then update them as the sample grows.
Backtesting comes second. Before risking capital on a rule-based setup, test it across a sufficiently large sample covering different market regimes, volatility environments, and trend conditions. The goal is not just to prove that the strategy will work in the future, but to estimate its historical win rate, payoff ratio, expectancy, drawdowns, and sensitivity to changing market conditions.
The options market provides another useful source of information. Option prices can be used to derive model-based, risk-neutral probability estimates from implied volatility, strike prices, expiration dates, and the shape of the volatility skew. These estimates are not forecasts of the stock’s true future probabilities, but they show how the options market is pricing uncertainty at that moment.
Suppose a stock trades at $100, and one-month options imply an expected range of approximately $92 to $108. That range is often interpreted as roughly one standard deviation, which corresponds to about 68 percent under a simplified normal-distribution assumption. It does not guarantee that the stock has exactly a 68 percent chance of remaining inside that range, but it provides a useful benchmark for judging whether your price target is consistent with the movement currently priced into the options market.
If your trade requires the stock to reach $120 within one month, you can examine option prices to estimate how unlikely the market considers that outcome. If a model assigns it approximately a 5 percent probability, a binary wager on that event would require a net payoff of about 19 to 1 merely to break even before fees:
Break-even payoff = (1 − 0.05) ÷ 0.05 = 19 to 1
A conventional stock trade is more complicated because its expectancy also depends on the stop-loss level, the path of price movement, partial exits, slippage, and whether the target must merely be touched or held through expiration. Still, the comparison is valuable. If your target lies far outside the option-implied distribution and the potential reward does not compensate for the low estimated probability, the trade may not offer favorable expectancy.
Backtesting, observed market data, and option-implied distributions do not eliminate uncertainty. They convert vague predictions into measurable assumptions that can be tested, sized, and reviewed before capital is placed at risk.
One honest caution belongs here. Your probability estimates will always be imperfect. Markets shift, edges decay, and past frequencies are estimates, never guarantees. Perfect inputs are out of reach, and that's fine, because approximately correct probabilities paired with conservative sizing will work for you over time if you stay consistent with on strategy. When you're somewhat wrong about the size of your edge under that arrangement, the error dents your results instead of wrecking your account. A person thinking like a mathematician builds humility directly into their position size.
The Daily Practice
The routine itself is short. Before every trade, write three numbers: your estimated win probability, your reward measured in R, and your risk of 1R. Compute the expected value. If the number cannot come out clearly positive, you skip the trade, no matter what your impulses are shouting. After every trade, record the outcome without judgment, because one outcome is a single data point landing somewhere inside a distribution you already accepted when you clicked the buy button. Once a month, review your samples by setup, recalculate your actual win rates and payoffs, and adjust your estimates. Run yourself like a floor manager walking the casino at closing time, checking that each table is being managed properly to hold its edge.
Something useful happens to your psychology once this becomes a habit. Losses stop registering as failures. A loss taken on a positive expected value trade, at proper size, with the stop honored, counts as a correctly executed trade in every way that matters mathematically. Log it, note the R multiple, and move to the next entry in the queue.
Executing These Principles in Your Trading Plan
Write an expected value requirement into your plan: no trade is taken unless EV = (Win% × Avg Win) minus (Loss% × Avg Loss) comes out positive based on backtested or journaled trading data.Before each entry, record your three inputs in writing (estimated win probability, reward in R multiples, and risk of 1R), then calculate the EV.Set a fixed risk per trade of 0.5 to 2 percent of account equity so that mathematically inevitable losing streaks of 5 to 8 trades produce recoverable drawdowns.Define a minimum sample size rule: no setup gets judged, changed, or abandoned on fewer than 30 recorded trades, preferably 50 to 100.Journal every trade with entry, stop, target, and R multiple results, tagged by setup, so your probability estimates come from data rather than feelings.When a losing streak occurs, run the binomial math to check whether the streak is statistically normal for your win rate before changing anything.Use implied volatility to check trade probabilities: if the market prices your target as a low-probability event, demand a payoff large enough to justify it, or skip the trade.Schedule a monthly review to recalculate each setup's actual win rate, average win, and average loss, then update your EV inputs accordingly.Ban prediction language from your process: replace "this will go up" with a written probability and payoff statement for every trade.
You can purchase this book on Amazon worldwide: How to Trade Like a Mathematician: Quantitative Trade Management Strategies, Risk Management, and Mathematical Models to Master the Stock Market.
<<<<<<<<<<<<<<................>>>>>>>>>>>>>>>
#JobsReportRaisesHikeOdds #CPITestsDecemberRateOutlook #BitcoinRebounds$75KAsChipsLead #US Data Center Rules May Constrain AI Expansion #WillAnthropicListOnTime
Thinking in Probabilities, Not Predictions or Opinions
Trading the Distribution, Not Obsessing Over Short-Term Outcomes
You will never know what the market is going to do. Nobody does. The analyst on television doesn't know, and the fund manager speaking confidently doesn't either. Neither do you, however good your chart looks when you take your entry. If you can understand this one idea, you're already ahead of most of the people you're trading against. Most of the people on the other side of your trades will spend all their time chasing the one thing that can't be done, which is predicting the future.
This is Chapter 1 from my book: How to Trade Like a Mathematician: Quantitative Trade Management Strategies, Risk Management, and Mathematical Models to Master the Stock Market.
A person who wants to trade like a mathematician takes a different approach entirely. They assign probabilities to a range of futures, then structure their decisions so that the math works out in their favor over many repetitions. That's the complete shift this chapter asks of you. Instead of asking, "What will this stock do next?" Ask a better question: "What does the distribution of outcomes look like for this trade, and does the math still favor me if I take this exact trade a hundred times?"
The Casino Owner's Mindset
Consider how a casino runs its floor. When a gambler sits down at the roulette table, the casino does not know whether that particular spin will win-or-lose money for the house. The gambler might hit their number and walk out with thirty-five times their bet. The casino shrugs. On an American roulette wheel, there are 38 pockets: the numbers 1 through 36, plus 0 and 00. A straight-up bet on a single number pays 35 to 1. The player therefore has a 1-in-38 probability of winning and a 37-in-38 probability of losing. For every $1 wagered, the casino’s expected profit is:
Expected casino profit = (37/38 × $1) − (1/38 × $35)
This equals approximately $0.0526, or 5.26 cents per dollar wagered. In percentage terms, the American roulette wheel gives the casino a 5.26% house edge. The casino won’t earn exactly 5.26% over every short period, but as the number of wagers increases, its average profit typically converges toward that mathematical expectation.
Notice what the casino never bothers to do. It never forecasts a spin. It owns a small edge and lets the law of large numbers grind that edge into money, night after night, table after table. On any evening, the house can lose. Over ten thousand spins, the outcome is close to certain. That is the model to follow: trade the way the house operates, and evaluate every position the way the casino evaluates a wheel, through expected value and never through opinion.
Expected Value: The Only Question That Matters
Expected value, or EV, is the mathematical heart of probabilistic trading. The formula:
EV = (Probability of Winning × Average Win) minus (Probability of Losing × Average Loss)
A positive number means the trade is worth taking repeatedly. A negative number means the trade is a slow donation to someone else's account, and it stays a donation no matter how strongly you feel about the setup or how many people on social media agree with you. That is why EV is the only question that matters.
Time for real numbers. Suppose you tracked a specific setup in your trading journal, such as a pullback to the 20-day moving average in a stock trending upward. Over 100 occurrences, 45 trades were winners and 55 were losers. Your winning trades averaged a gain of 2.5R, where R represents the amount risked per trade, while your losing trades averaged a loss of 1R because you consistently honored your stop-loss. Your estimated expectancy per trade would be:
EV = (0.45 × 2.5R) − (0.55 × 1R)
EV = 1.125R − 0.55R = +0.575R
This means the setup historically earned an average of 0.575R per trade. If you risked $100 per trade, that would equal an estimated average profit of $57.50 per trade. This does not mean every trade will earn 0.575R. It means that, across a sufficiently large sample of similar trades, the average result would be expected to approach that amount if the setup’s win rate and payoff ratio remain stable.
Across a sufficiently large number of comparable trades, this setup has historically produced an average gain of 0.575R per trade, even though it loses more often than it wins. Read that again. It challenges one of the most damaging beliefs in trading: that a profitable trader must be right most of the time.
A 45 percent win rate combined with an average winner of 2.5R and an average loser of 1R creates strong positive expectancy before commissions, slippage, and other trading costs. Meanwhile, a strategy with a 70 percent win rate can still lose money if its average loss is three times its average win.
EV = (0.70 × 1R) − (0.30 × 3R)
EV = 0.70R − 0.90R = −0.20R per trade
That trader may feel successful on most trading days while steadily losing capital over a large sample of trades. Whether the trader eventually goes broke depends on position sizing, available capital, the sequence of returns, and how long the negative-expectancy strategy is traded.
This is also why unsupported opinions are dangerous. An opinion says, “Apple is going up.” A probability-based trading statement says, “Based on 100 historical occurrences of this setup, approximately 45 percent reached the 2.5R target before hitting the 1R stop. If those results remain representative and execution costs do not eliminate the edge, the setup has an estimated expectancy of +0.575R per trade.”
That statement does not guarantee the outcome of the next trade. It provides a testable hypothesis with numbers that can be used for position sizing, risk management, and ongoing performance review. The shift from certainty and prediction to probability and expectancy is the whole point.
Individual Trades Mean Nothing; Samples Mean Everything
Now for the place where most traders quietly sabotage themselves. They judge their system trade by trade. They take a perfectly good positive expectancy trade, it loses, and they conclude the setup is broken. Or they take a terrible negative expectancy trade, it wins, and they conclude they've discovered a new edge. Both conclusions are mathematically illiterate, and I say that with love, because I want you to feel a small sting every time you catch yourself doing it.
A single outcome tells you very little about the quality of the decision that produced it. Flip a fair coin ten times, and there is about a 17 percent chance of getting seven or more heads. Seven heads in ten flips would not be sound evidence that the coin was biased because ten observations are too few to separate skill, edge, or bias from ordinary randomness.
Traders often make the same mistake when evaluating a system. They abandon a strategy after a short losing streak, even when that streak is consistent with the system’s expected win rate. A strategy with a 45 percent win rate loses 55 percent of its trades. The probability that any sequence of five trades will contain five consecutive losses is:
0.55⁵ ≈ 5.03 percent
That does not mean a five-trade losing streak will occur exactly once every twenty trades. Streaks can overlap, cluster, or remain absent for long periods. However, across hundreds of trades, one or more five-loss streaks should not be surprising. A single losing streak provides limited evidence that the strategy’s underlying edge has disappeared. Random sequences naturally produce clusters of wins and losses.
The practical defense is to establish evaluation rules before trading the system. Do not judge a setup from a handful of outcomes. Thirty trades may provide an initial sign, but 50 to 100 trades offer a more useful sample, and some strategies require far more because of their win rate, payoff distribution, trade frequency, and sensitivity to changing market conditions.
Record every valid occurrence in a trading journal, including the entry, stop, target, trailing stop, market conditions, execution costs, and the result in R multiples. Then compare the observed win rate, average win, average loss, expectancy, and drawdown with the strategy’s historical assumptions.
Even a large sample does not prove that an edge will continue forever. It gives you a stronger statistical basis for deciding whether recent results are consistent with normal variation or whether the strategy may have materially changed. The goal is not to replace judgment entirely, but to ensure judgment is grounded in evidence rather than emotion, isolated outcomes, or short-term noise.
Watch how this plays out under pressure. Say you trade a breakout strategy and you're 12 trades in with a record of 4 wins and 8 losses. Your emotional brain screams that the strategy is failing. Your mathematical brain runs a check instead. It asks how unusual 4 wins in 12 trades would be if the true win rate really were the expected 45 percent. The binomial distribution answers: getting 4 or fewer wins in 12 trials at a 45 percent win rate happens roughly a quarter of the time. Ordinary. It's the equivalent of rolling a die twice without seeing a six, and you'd never call that die broken. So you keep executing your strategy because 12 trades is far too small a sample to override a tested edge.
Position Sizing Is Where Probability Becomes Survival
Thinking in probabilities forces a hard conclusion about position sizing, too. Since any single trade can lose, no single trade can ever be allowed to matter very much. A setup that wins 45 percent of the time will hand you losing streaks of 5, 6, or even 8 trades with mathematical certainty over a long career. So your position sizing has to guarantee you survive the worst losing streak probability will realistically deal you eventually, and risk management has to guarantee your account survival in advance.
Run the numbers on risking 10 percent of your current account equity per trade. After eight consecutive full-risk losses, the account would retain:
0.90⁸ ≈ 43.05 percent
That is a drawdown of approximately 56.95 percent. Recovering from that loss would require a gain of about 132 percent just to return to the starting balance.
Now apply the same eight-trade losing streak while risking 1 percent of current equity per trade:
0.99⁸ ≈ 92.27 percent
The account would experience a drawdown of approximately 7.73 percent. Recovering from that loss would require a gain of about 8.38 percent.
For a strategy with a 45 percent win rate, eight consecutive losses are unlikely in any eight-trade sequence, but they become increasingly plausible as the number of trades grows. A probability-based trader therefore sizes positions for losing streaks that can reasonably occur, not for the winning trade expected next.
Many disciplined traders risk only a small fraction of their equity on each position, often around 0.5 percent to 2 percent, although the amount depends on the strategy’s historical drawdowns, volatility, correlation between positions, stop-loss reliability, and the trader’s risk tolerance. The principle is straightforward: position size should allow the account to survive normal losing streaks without suffering a drawdown so deep that recovery becomes mathematically difficult or psychologically unbearable.
Turning Market Views into Probability Estimates
The market won't hand you probabilities the way a roulette wheel does, so you have to build your own estimates, and three sources do most of the work. Your own journal comes first: log every setup, let your realized win rate and average R multiples become your probability inputs, then update them as the sample grows.
Backtesting comes second. Before risking capital on a rule-based setup, test it across a sufficiently large sample covering different market regimes, volatility environments, and trend conditions. The goal is not just to prove that the strategy will work in the future, but to estimate its historical win rate, payoff ratio, expectancy, drawdowns, and sensitivity to changing market conditions.
The options market provides another useful source of information. Option prices can be used to derive model-based, risk-neutral probability estimates from implied volatility, strike prices, expiration dates, and the shape of the volatility skew. These estimates are not forecasts of the stock’s true future probabilities, but they show how the options market is pricing uncertainty at that moment.
Suppose a stock trades at $100, and one-month options imply an expected range of approximately $92 to $108. That range is often interpreted as roughly one standard deviation, which corresponds to about 68 percent under a simplified normal-distribution assumption. It does not guarantee that the stock has exactly a 68 percent chance of remaining inside that range, but it provides a useful benchmark for judging whether your price target is consistent with the movement currently priced into the options market.
If your trade requires the stock to reach $120 within one month, you can examine option prices to estimate how unlikely the market considers that outcome. If a model assigns it approximately a 5 percent probability, a binary wager on that event would require a net payoff of about 19 to 1 merely to break even before fees:
Break-even payoff = (1 − 0.05) ÷ 0.05 = 19 to 1
A conventional stock trade is more complicated because its expectancy also depends on the stop-loss level, the path of price movement, partial exits, slippage, and whether the target must merely be touched or held through expiration. Still, the comparison is valuable. If your target lies far outside the option-implied distribution and the potential reward does not compensate for the low estimated probability, the trade may not offer favorable expectancy.
Backtesting, observed market data, and option-implied distributions do not eliminate uncertainty. They convert vague predictions into measurable assumptions that can be tested, sized, and reviewed before capital is placed at risk.
One honest caution belongs here. Your probability estimates will always be imperfect. Markets shift, edges decay, and past frequencies are estimates, never guarantees. Perfect inputs are out of reach, and that's fine, because approximately correct probabilities paired with conservative sizing will work for you over time if you stay consistent with on strategy. When you're somewhat wrong about the size of your edge under that arrangement, the error dents your results instead of wrecking your account. A person thinking like a mathematician builds humility directly into their position size.
The Daily Practice
The routine itself is short. Before every trade, write three numbers: your estimated win probability, your reward measured in R, and your risk of 1R. Compute the expected value. If the number cannot come out clearly positive, you skip the trade, no matter what your impulses are shouting. After every trade, record the outcome without judgment, because one outcome is a single data point landing somewhere inside a distribution you already accepted when you clicked the buy button. Once a month, review your samples by setup, recalculate your actual win rates and payoffs, and adjust your estimates. Run yourself like a floor manager walking the casino at closing time, checking that each table is being managed properly to hold its edge.
Something useful happens to your psychology once this becomes a habit. Losses stop registering as failures. A loss taken on a positive expected value trade, at proper size, with the stop honored, counts as a correctly executed trade in every way that matters mathematically. Log it, note the R multiple, and move to the next entry in the queue.
Executing These Principles in Your Trading Plan
Write an expected value requirement into your plan: no trade is taken unless EV = (Win% × Avg Win) minus (Loss% × Avg Loss) comes out positive based on backtested or journaled trading data.Before each entry, record your three inputs in writing (estimated win probability, reward in R multiples, and risk of 1R), then calculate the EV.Set a fixed risk per trade of 0.5 to 2 percent of account equity so that mathematically inevitable losing streaks of 5 to 8 trades produce recoverable drawdowns.Define a minimum sample size rule: no setup gets judged, changed, or abandoned on fewer than 30 recorded trades, preferably 50 to 100.Journal every trade with entry, stop, target, and R multiple results, tagged by setup, so your probability estimates come from data rather than feelings.When a losing streak occurs, run the binomial math to check whether the streak is statistically normal for your win rate before changing anything.Use implied volatility to check trade probabilities: if the market prices your target as a low-probability event, demand a payoff large enough to justify it, or skip the trade.Schedule a monthly review to recalculate each setup's actual win rate, average win, and average loss, then update your EV inputs accordingly.Ban prediction language from your process: replace "this will go up" with a written probability and payoff statement for every trade.
You can purchase this book on Amazon worldwide: How to Trade Like a Mathematician: Quantitative Trade Management Strategies, Risk Management, and Mathematical Models to Master the Stock Market.
<<<<<<<<<<<<<<................>>>>>>>>>>>>>>>
#JobsReportRaisesHikeOdds #CPITestsDecemberRateOutlook #BitcoinRebounds$75KAsChipsLead #US Data Center Rules May Constrain AI Expansion #WillAnthropicListOnTime
You will never know what the market is going to do. Nobody does. The analyst on television doesn't know, and the fund manager speaking confidently doesn't either. Neither do you, however good your chart looks when you take your entry. If you can understand this one idea, you're already ahead of most of the people you're trading against. Most of the people on the other side of your trades will spend all their time chasing the one thing that can't be done, which is predicting the future.
This is Chapter 1 from my book: How to Trade Like a Mathematician: Quantitative Trade Management Strategies, Risk Management, and Mathematical Models to Master the Stock Market.
A person who wants to trade like a mathematician takes a different approach entirely. They assign probabilities to a range of futures, then structure their decisions so that the math works out in their favor over many repetitions. That's the complete shift this chapter asks of you. Instead of asking, "What will this stock do next?" Ask a better question: "What does the distribution of outcomes look like for this trade, and does the math still favor me if I take this exact trade a hundred times?"
The Casino Owner's Mindset
Consider how a casino runs its floor. When a gambler sits down at the roulette table, the casino does not know whether that particular spin will win-or-lose money for the house. The gambler might hit their number and walk out with thirty-five times their bet. The casino shrugs. On an American roulette wheel, there are 38 pockets: the numbers 1 through 36, plus 0 and 00. A straight-up bet on a single number pays 35 to 1. The player therefore has a 1-in-38 probability of winning and a 37-in-38 probability of losing. For every $1 wagered, the casino’s expected profit is:
Expected casino profit = (37/38 × $1) − (1/38 × $35)
This equals approximately $0.0526, or 5.26 cents per dollar wagered. In percentage terms, the American roulette wheel gives the casino a 5.26% house edge. The casino won’t earn exactly 5.26% over every short period, but as the number of wagers increases, its average profit typically converges toward that mathematical expectation.
Notice what the casino never bothers to do. It never forecasts a spin. It owns a small edge and lets the law of large numbers grind that edge into money, night after night, table after table. On any evening, the house can lose. Over ten thousand spins, the outcome is close to certain. That is the model to follow: trade the way the house operates, and evaluate every position the way the casino evaluates a wheel, through expected value and never through opinion.
Expected Value: The Only Question That Matters
Expected value, or EV, is the mathematical heart of probabilistic trading. The formula:
EV = (Probability of Winning × Average Win) minus (Probability of Losing × Average Loss)
A positive number means the trade is worth taking repeatedly. A negative number means the trade is a slow donation to someone else's account, and it stays a donation no matter how strongly you feel about the setup or how many people on social media agree with you. That is why EV is the only question that matters.
Time for real numbers. Suppose you tracked a specific setup in your trading journal, such as a pullback to the 20-day moving average in a stock trending upward. Over 100 occurrences, 45 trades were winners and 55 were losers. Your winning trades averaged a gain of 2.5R, where R represents the amount risked per trade, while your losing trades averaged a loss of 1R because you consistently honored your stop-loss. Your estimated expectancy per trade would be:
EV = (0.45 × 2.5R) − (0.55 × 1R)
EV = 1.125R − 0.55R = +0.575R
This means the setup historically earned an average of 0.575R per trade. If you risked $100 per trade, that would equal an estimated average profit of $57.50 per trade. This does not mean every trade will earn 0.575R. It means that, across a sufficiently large sample of similar trades, the average result would be expected to approach that amount if the setup’s win rate and payoff ratio remain stable.
Across a sufficiently large number of comparable trades, this setup has historically produced an average gain of 0.575R per trade, even though it loses more often than it wins. Read that again. It challenges one of the most damaging beliefs in trading: that a profitable trader must be right most of the time.
A 45 percent win rate combined with an average winner of 2.5R and an average loser of 1R creates strong positive expectancy before commissions, slippage, and other trading costs. Meanwhile, a strategy with a 70 percent win rate can still lose money if its average loss is three times its average win.
EV = (0.70 × 1R) − (0.30 × 3R)
EV = 0.70R − 0.90R = −0.20R per trade
That trader may feel successful on most trading days while steadily losing capital over a large sample of trades. Whether the trader eventually goes broke depends on position sizing, available capital, the sequence of returns, and how long the negative-expectancy strategy is traded.
This is also why unsupported opinions are dangerous. An opinion says, “Apple is going up.” A probability-based trading statement says, “Based on 100 historical occurrences of this setup, approximately 45 percent reached the 2.5R target before hitting the 1R stop. If those results remain representative and execution costs do not eliminate the edge, the setup has an estimated expectancy of +0.575R per trade.”
That statement does not guarantee the outcome of the next trade. It provides a testable hypothesis with numbers that can be used for position sizing, risk management, and ongoing performance review. The shift from certainty and prediction to probability and expectancy is the whole point.
Individual Trades Mean Nothing; Samples Mean Everything
Now for the place where most traders quietly sabotage themselves. They judge their system trade by trade. They take a perfectly good positive expectancy trade, it loses, and they conclude the setup is broken. Or they take a terrible negative expectancy trade, it wins, and they conclude they've discovered a new edge. Both conclusions are mathematically illiterate, and I say that with love, because I want you to feel a small sting every time you catch yourself doing it.
A single outcome tells you very little about the quality of the decision that produced it. Flip a fair coin ten times, and there is about a 17 percent chance of getting seven or more heads. Seven heads in ten flips would not be sound evidence that the coin was biased because ten observations are too few to separate skill, edge, or bias from ordinary randomness.
Traders often make the same mistake when evaluating a system. They abandon a strategy after a short losing streak, even when that streak is consistent with the system’s expected win rate. A strategy with a 45 percent win rate loses 55 percent of its trades. The probability that any sequence of five trades will contain five consecutive losses is:
0.55⁵ ≈ 5.03 percent
That does not mean a five-trade losing streak will occur exactly once every twenty trades. Streaks can overlap, cluster, or remain absent for long periods. However, across hundreds of trades, one or more five-loss streaks should not be surprising. A single losing streak provides limited evidence that the strategy’s underlying edge has disappeared. Random sequences naturally produce clusters of wins and losses.
The practical defense is to establish evaluation rules before trading the system. Do not judge a setup from a handful of outcomes. Thirty trades may provide an initial sign, but 50 to 100 trades offer a more useful sample, and some strategies require far more because of their win rate, payoff distribution, trade frequency, and sensitivity to changing market conditions.
Record every valid occurrence in a trading journal, including the entry, stop, target, trailing stop, market conditions, execution costs, and the result in R multiples. Then compare the observed win rate, average win, average loss, expectancy, and drawdown with the strategy’s historical assumptions.
Even a large sample does not prove that an edge will continue forever. It gives you a stronger statistical basis for deciding whether recent results are consistent with normal variation or whether the strategy may have materially changed. The goal is not to replace judgment entirely, but to ensure judgment is grounded in evidence rather than emotion, isolated outcomes, or short-term noise.
Watch how this plays out under pressure. Say you trade a breakout strategy and you're 12 trades in with a record of 4 wins and 8 losses. Your emotional brain screams that the strategy is failing. Your mathematical brain runs a check instead. It asks how unusual 4 wins in 12 trades would be if the true win rate really were the expected 45 percent. The binomial distribution answers: getting 4 or fewer wins in 12 trials at a 45 percent win rate happens roughly a quarter of the time. Ordinary. It's the equivalent of rolling a die twice without seeing a six, and you'd never call that die broken. So you keep executing your strategy because 12 trades is far too small a sample to override a tested edge.
Position Sizing Is Where Probability Becomes Survival
Thinking in probabilities forces a hard conclusion about position sizing, too. Since any single trade can lose, no single trade can ever be allowed to matter very much. A setup that wins 45 percent of the time will hand you losing streaks of 5, 6, or even 8 trades with mathematical certainty over a long career. So your position sizing has to guarantee you survive the worst losing streak probability will realistically deal you eventually, and risk management has to guarantee your account survival in advance.
Run the numbers on risking 10 percent of your current account equity per trade. After eight consecutive full-risk losses, the account would retain:
0.90⁸ ≈ 43.05 percent
That is a drawdown of approximately 56.95 percent. Recovering from that loss would require a gain of about 132 percent just to return to the starting balance.
Now apply the same eight-trade losing streak while risking 1 percent of current equity per trade:
0.99⁸ ≈ 92.27 percent
The account would experience a drawdown of approximately 7.73 percent. Recovering from that loss would require a gain of about 8.38 percent.
For a strategy with a 45 percent win rate, eight consecutive losses are unlikely in any eight-trade sequence, but they become increasingly plausible as the number of trades grows. A probability-based trader therefore sizes positions for losing streaks that can reasonably occur, not for the winning trade expected next.
Many disciplined traders risk only a small fraction of their equity on each position, often around 0.5 percent to 2 percent, although the amount depends on the strategy’s historical drawdowns, volatility, correlation between positions, stop-loss reliability, and the trader’s risk tolerance. The principle is straightforward: position size should allow the account to survive normal losing streaks without suffering a drawdown so deep that recovery becomes mathematically difficult or psychologically unbearable.
Turning Market Views into Probability Estimates
The market won't hand you probabilities the way a roulette wheel does, so you have to build your own estimates, and three sources do most of the work. Your own journal comes first: log every setup, let your realized win rate and average R multiples become your probability inputs, then update them as the sample grows.
Backtesting comes second. Before risking capital on a rule-based setup, test it across a sufficiently large sample covering different market regimes, volatility environments, and trend conditions. The goal is not just to prove that the strategy will work in the future, but to estimate its historical win rate, payoff ratio, expectancy, drawdowns, and sensitivity to changing market conditions.
The options market provides another useful source of information. Option prices can be used to derive model-based, risk-neutral probability estimates from implied volatility, strike prices, expiration dates, and the shape of the volatility skew. These estimates are not forecasts of the stock’s true future probabilities, but they show how the options market is pricing uncertainty at that moment.
Suppose a stock trades at $100, and one-month options imply an expected range of approximately $92 to $108. That range is often interpreted as roughly one standard deviation, which corresponds to about 68 percent under a simplified normal-distribution assumption. It does not guarantee that the stock has exactly a 68 percent chance of remaining inside that range, but it provides a useful benchmark for judging whether your price target is consistent with the movement currently priced into the options market.
If your trade requires the stock to reach $120 within one month, you can examine option prices to estimate how unlikely the market considers that outcome. If a model assigns it approximately a 5 percent probability, a binary wager on that event would require a net payoff of about 19 to 1 merely to break even before fees:
Break-even payoff = (1 − 0.05) ÷ 0.05 = 19 to 1
A conventional stock trade is more complicated because its expectancy also depends on the stop-loss level, the path of price movement, partial exits, slippage, and whether the target must merely be touched or held through expiration. Still, the comparison is valuable. If your target lies far outside the option-implied distribution and the potential reward does not compensate for the low estimated probability, the trade may not offer favorable expectancy.
Backtesting, observed market data, and option-implied distributions do not eliminate uncertainty. They convert vague predictions into measurable assumptions that can be tested, sized, and reviewed before capital is placed at risk.
One honest caution belongs here. Your probability estimates will always be imperfect. Markets shift, edges decay, and past frequencies are estimates, never guarantees. Perfect inputs are out of reach, and that's fine, because approximately correct probabilities paired with conservative sizing will work for you over time if you stay consistent with on strategy. When you're somewhat wrong about the size of your edge under that arrangement, the error dents your results instead of wrecking your account. A person thinking like a mathematician builds humility directly into their position size.
The Daily Practice
The routine itself is short. Before every trade, write three numbers: your estimated win probability, your reward measured in R, and your risk of 1R. Compute the expected value. If the number cannot come out clearly positive, you skip the trade, no matter what your impulses are shouting. After every trade, record the outcome without judgment, because one outcome is a single data point landing somewhere inside a distribution you already accepted when you clicked the buy button. Once a month, review your samples by setup, recalculate your actual win rates and payoffs, and adjust your estimates. Run yourself like a floor manager walking the casino at closing time, checking that each table is being managed properly to hold its edge.
Something useful happens to your psychology once this becomes a habit. Losses stop registering as failures. A loss taken on a positive expected value trade, at proper size, with the stop honored, counts as a correctly executed trade in every way that matters mathematically. Log it, note the R multiple, and move to the next entry in the queue.
Executing These Principles in Your Trading Plan
Write an expected value requirement into your plan: no trade is taken unless EV = (Win% × Avg Win) minus (Loss% × Avg Loss) comes out positive based on backtested or journaled trading data.Before each entry, record your three inputs in writing (estimated win probability, reward in R multiples, and risk of 1R), then calculate the EV.Set a fixed risk per trade of 0.5 to 2 percent of account equity so that mathematically inevitable losing streaks of 5 to 8 trades produce recoverable drawdowns.Define a minimum sample size rule: no setup gets judged, changed, or abandoned on fewer than 30 recorded trades, preferably 50 to 100.Journal every trade with entry, stop, target, and R multiple results, tagged by setup, so your probability estimates come from data rather than feelings.When a losing streak occurs, run the binomial math to check whether the streak is statistically normal for your win rate before changing anything.Use implied volatility to check trade probabilities: if the market prices your target as a low-probability event, demand a payoff large enough to justify it, or skip the trade.Schedule a monthly review to recalculate each setup's actual win rate, average win, and average loss, then update your EV inputs accordingly.Ban prediction language from your process: replace "this will go up" with a written probability and payoff statement for every trade.
You can purchase this book on Amazon worldwide: How to Trade Like a Mathematician: Quantitative Trade Management Strategies, Risk Management, and Mathematical Models to Master the Stock Market.
<<<<<<<<<<<<<<................>>>>>>>>>>>>>>>
#JobsReportRaisesHikeOdds #CPITestsDecemberRateOutlook #BitcoinRebounds$75KAsChipsLead #US Data Center Rules May Constrain AI Expansion #WillAnthropicListOnTime
128
·
--
Bullisch
Teilweise korrekt
Übersetzung ansehen
🚨UPDATE: Intel leads the S&P 500’s worst-performing stocks in Q4, plunging 56.5%, with tech companies accounting for 35 of the 50 biggest losers through Nov. 5, per Fiscalai.
..........................?...............?.......................
#JobsReportRaisesHikeOdds #BitcoinRebounds$75KAsChipsLead #US Data Center Rules May Constrain AI Expansion #WillAnthropicListOnTime #CPITestsDecemberRateOutlook
🚨UPDATE: Intel leads the S&P 500’s worst-performing stocks in Q4, plunging 56.5%, with tech companies accounting for 35 of the 50 biggest losers through Nov. 5, per Fiscalai.
..........................?...............?.......................
#JobsReportRaisesHikeOdds #BitcoinRebounds$75KAsChipsLead #US Data Center Rules May Constrain AI Expansion #WillAnthropicListOnTime #CPITestsDecemberRateOutlook
..........................?...............?.......................
#JobsReportRaisesHikeOdds #BitcoinRebounds$75KAsChipsLead #US Data Center Rules May Constrain AI Expansion #WillAnthropicListOnTime #CPITestsDecemberRateOutlook
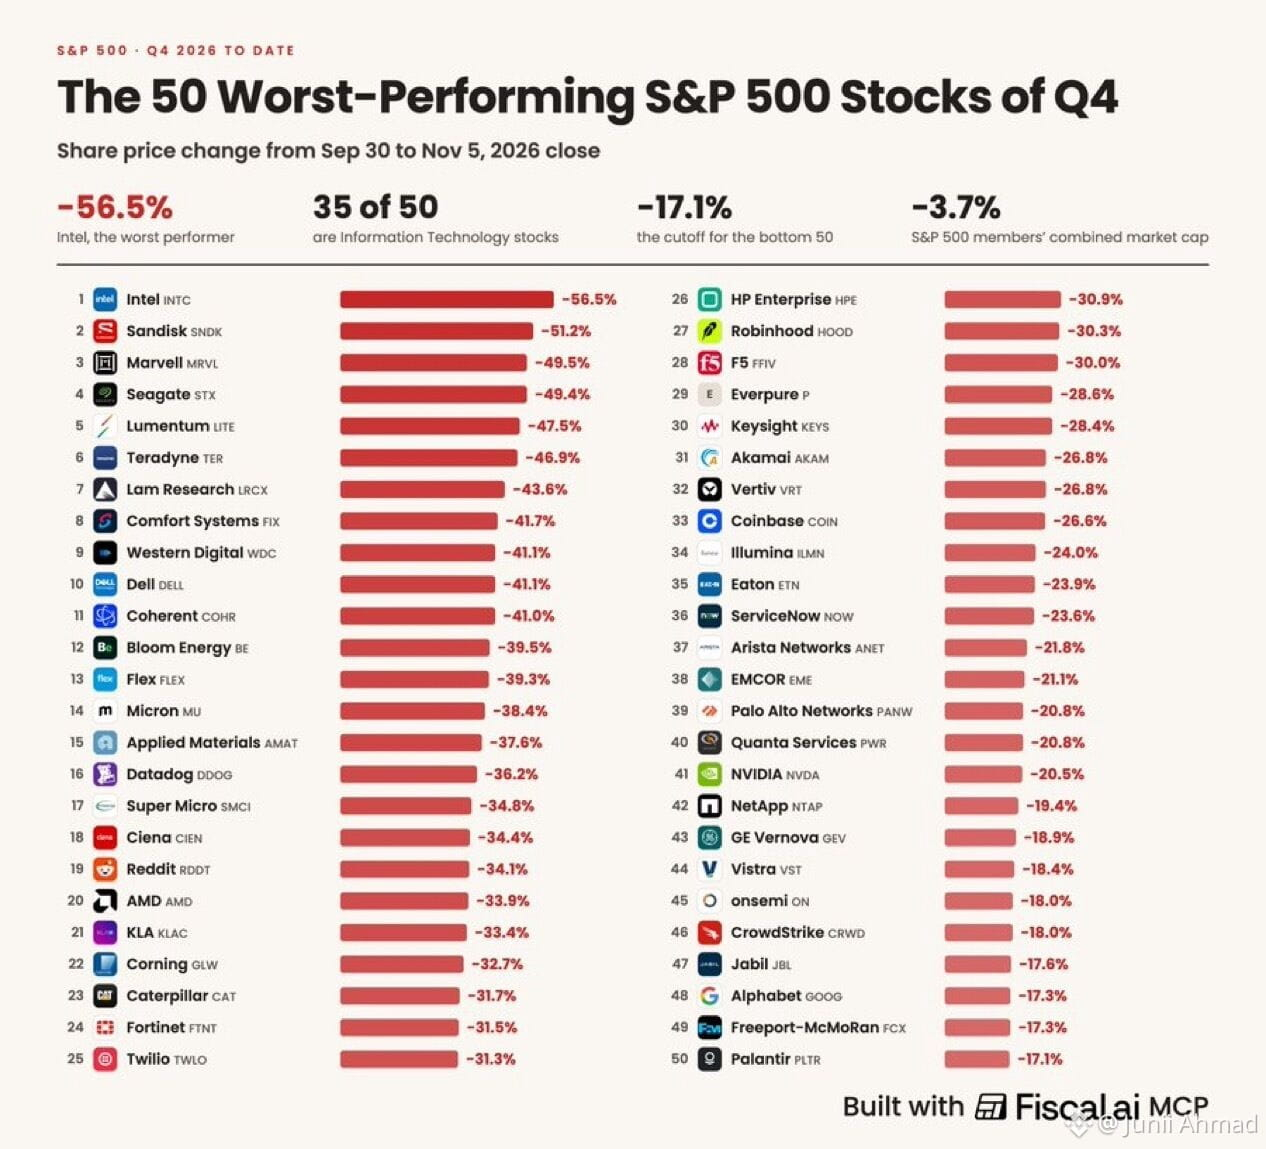
393
·
--
Verifiziert
⚠️
EILMELDUNG:
*ASIATISCH-PAZIFISCHE MÄRKTE SCHLIESSEN UNEINHEITLICH; KOREAS KOSPI STÜRZT UM 5,3 % AB
#BinanceReopensWithdrawalsForMoreAssets #BTCRebounds80K #Binance98PercentReplenished #ADPUSPrivateEmployersAdd86000JobsInOctober #USMidterms-WhatAreMarketsExpecting?
⚠️
EILMELDUNG:
*ASIATISCH-PAZIFISCHE MÄRKTE SCHLIESSEN UNEINHEITLICH; KOREAS KOSPI STÜRZT UM 5,3 % AB
#BinanceReopensWithdrawalsForMoreAssets #BTCRebounds80K #Binance98PercentReplenished #ADPUSPrivateEmployersAdd86000JobsInOctober #USMidterms-WhatAreMarketsExpecting?
EILMELDUNG:
*ASIATISCH-PAZIFISCHE MÄRKTE SCHLIESSEN UNEINHEITLICH; KOREAS KOSPI STÜRZT UM 5,3 % AB
#BinanceReopensWithdrawalsForMoreAssets #BTCRebounds80K #Binance98PercentReplenished #ADPUSPrivateEmployersAdd86000JobsInOctober #USMidterms-WhatAreMarketsExpecting?
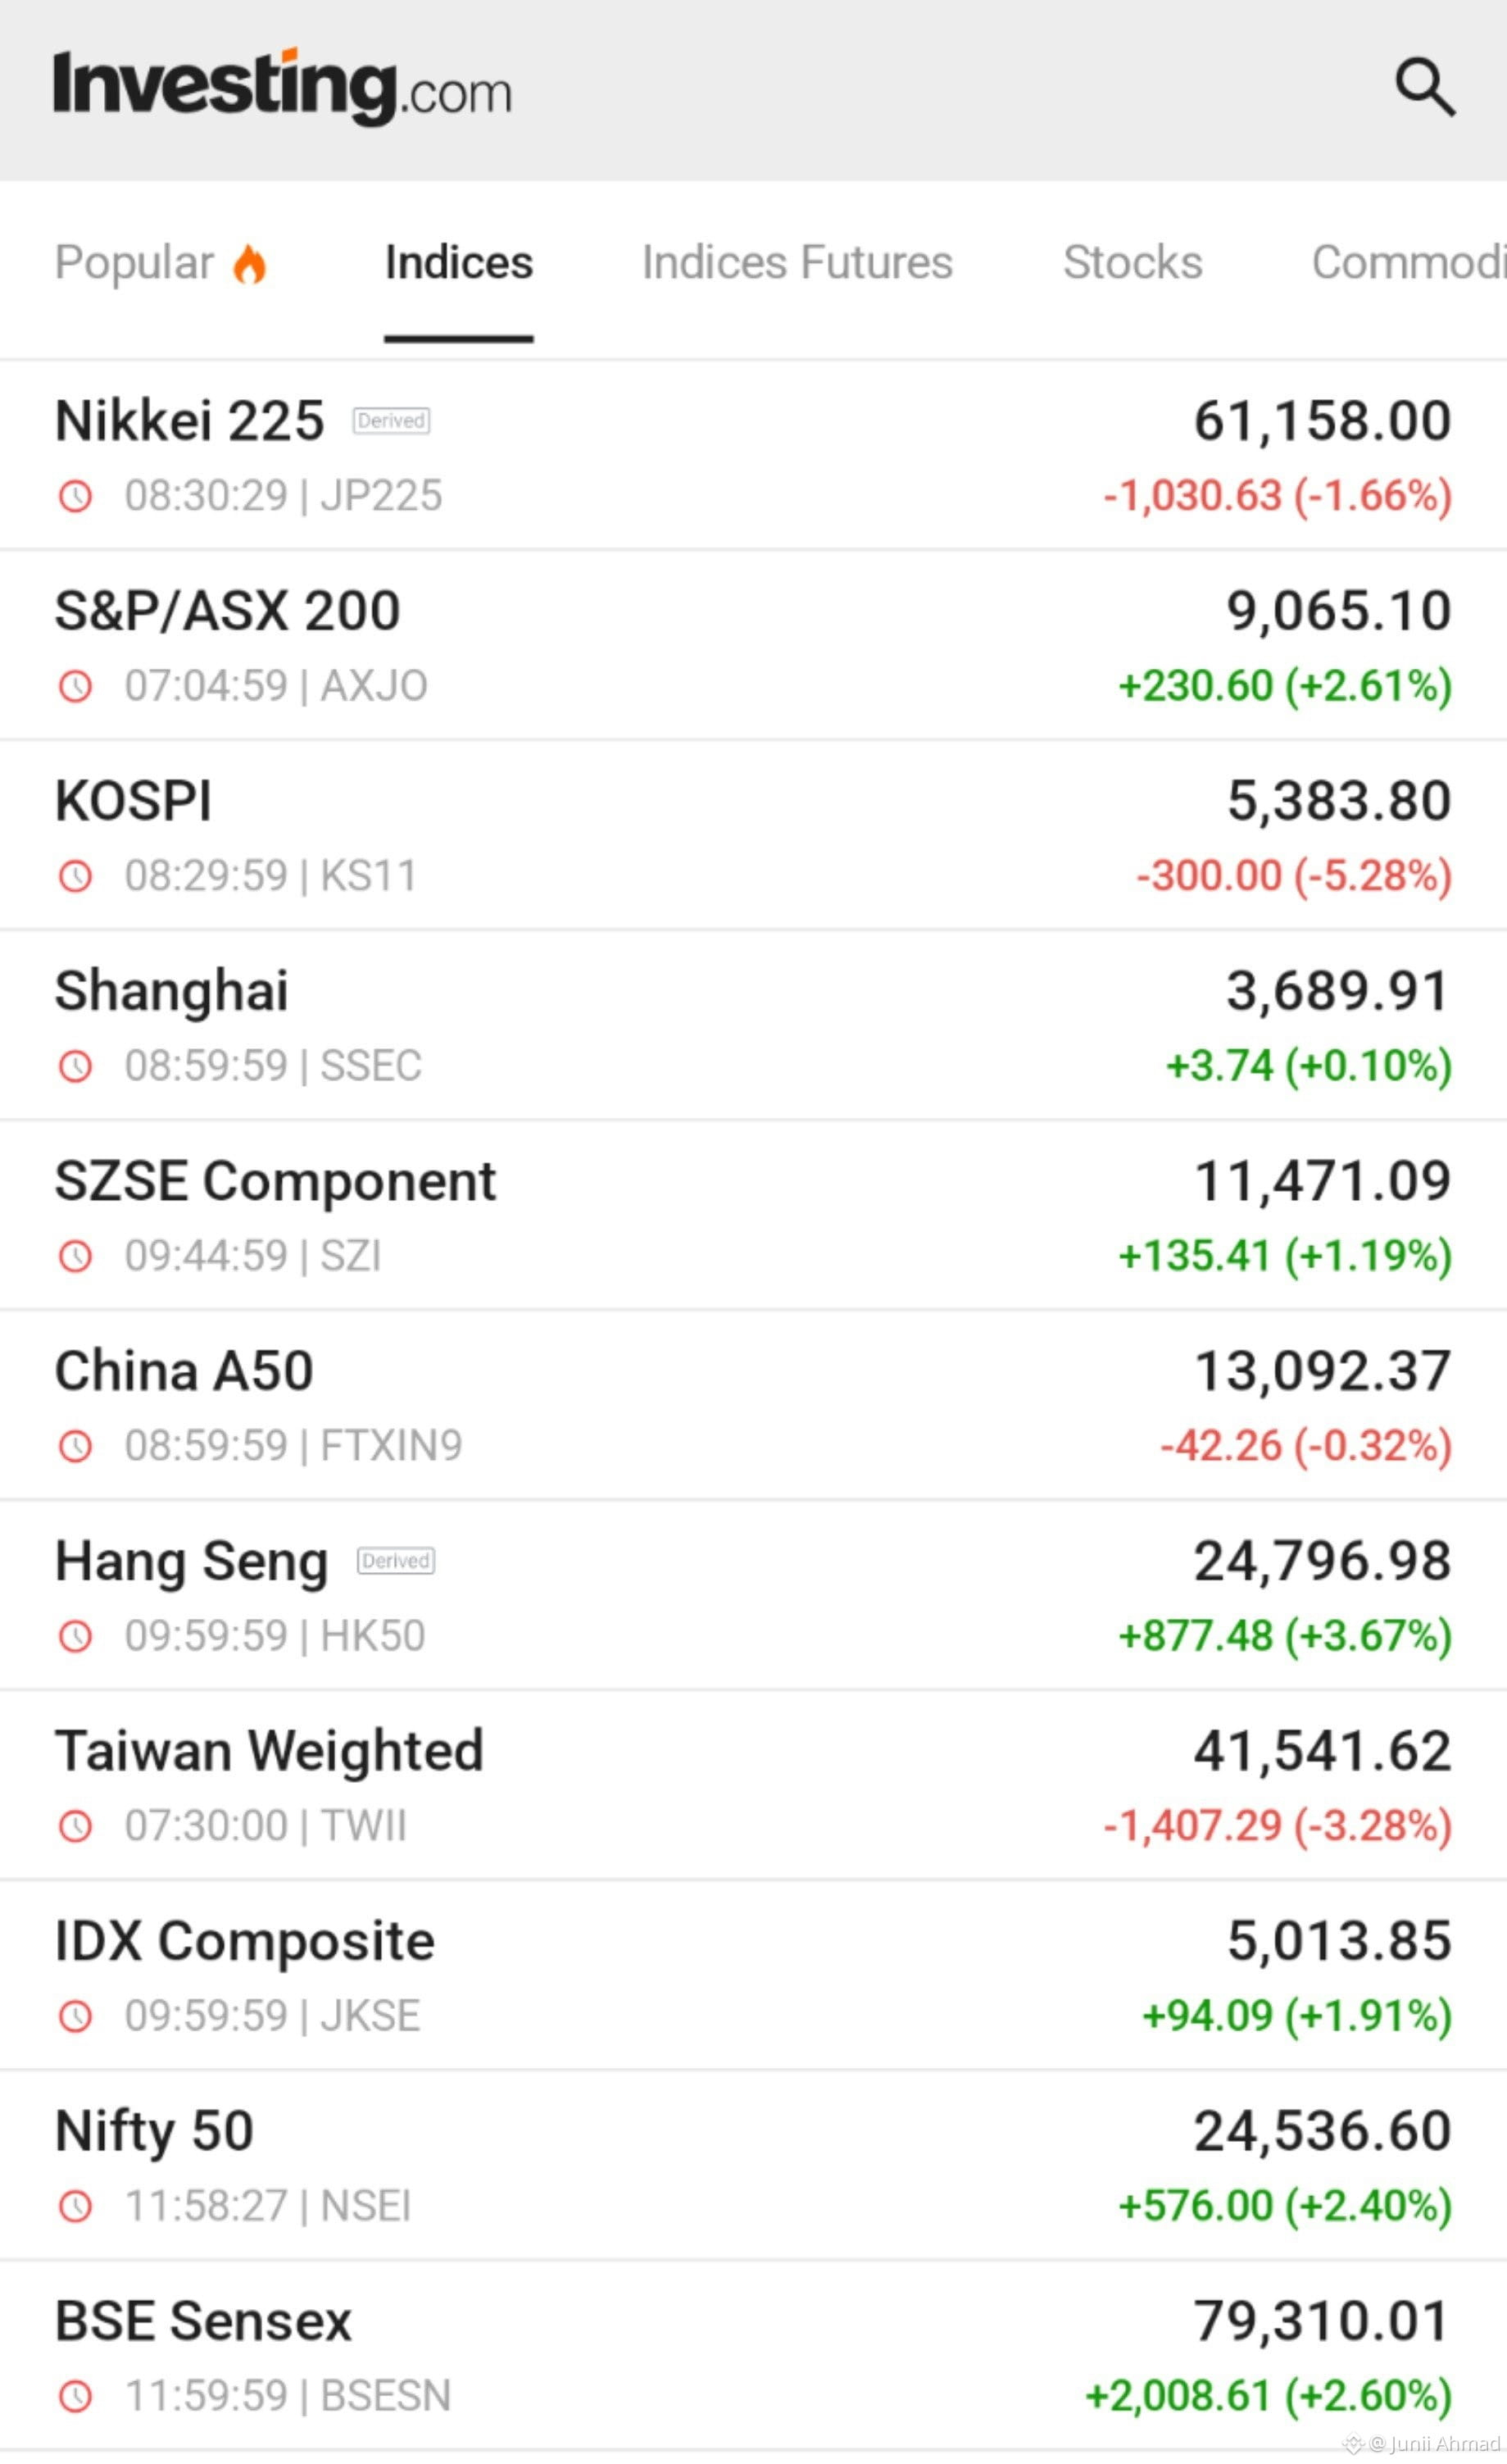
42
·
--
APPLE ist jetzt 5,08 Billionen Dollar wert.
Mehr als die gesamte Jahreswirtschaft von:
Japan: 4,34 Billionen Dollar
Vereinigtes Königreich: 4,27 Billionen Dollar
Frankreich: 3,55 Billionen Dollar
Italien: 2,70 Billionen Dollar
Nur drei Länder sind größer: die USA, China und Deutschland.
Ein Telefonunternehmen.
#BinanceReopensWithdrawalsForMoreAssets #BTCRebounds80K #Binance98PercentReplenished #ADPUSPrivateEmployersAdd86000JobsInOctober #USMidterms-WhatAreMarketsExpecting?
APPLE ist jetzt 5,08 Billionen Dollar wert.
Mehr als die gesamte Jahreswirtschaft von:
Japan: 4,34 Billionen Dollar
Vereinigtes Königreich: 4,27 Billionen Dollar
Frankreich: 3,55 Billionen Dollar
Italien: 2,70 Billionen Dollar
Nur drei Länder sind größer: die USA, China und Deutschland.
Ein Telefonunternehmen.
#BinanceReopensWithdrawalsForMoreAssets #BTCRebounds80K #Binance98PercentReplenished #ADPUSPrivateEmployersAdd86000JobsInOctober #USMidterms-WhatAreMarketsExpecting?
Mehr als die gesamte Jahreswirtschaft von:
Japan: 4,34 Billionen Dollar
Vereinigtes Königreich: 4,27 Billionen Dollar
Frankreich: 3,55 Billionen Dollar
Italien: 2,70 Billionen Dollar
Nur drei Länder sind größer: die USA, China und Deutschland.
Ein Telefonunternehmen.
#BinanceReopensWithdrawalsForMoreAssets #BTCRebounds80K #Binance98PercentReplenished #ADPUSPrivateEmployersAdd86000JobsInOctober #USMidterms-WhatAreMarketsExpecting?
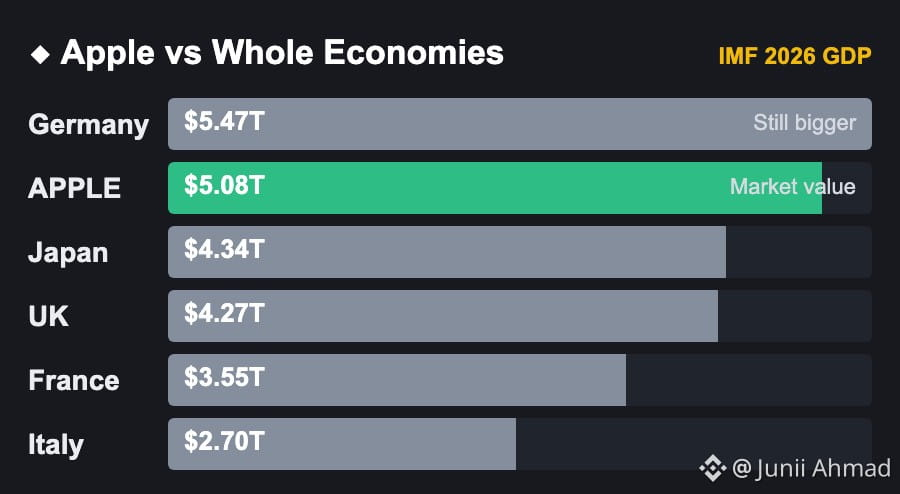
203
·
--
Verifiziert
🚨
Mach dich bereit für einen ereignisreichen Donnerstag:
• Unternehmenszahlen: Lumentum
$LITE , Cloudflare $NET.US , Iren $IREN , Applied Optoelectronics $AAOI
• Wirtschaft: Erstanträge auf Arbeitslosenhilfe
• Fed-Redner: Barkin, Hammack
#BinanceReopensWithdrawalsForMoreAssets #BTCRebounds80K #Binance98PercentReplenished #ADPUSPrivateEmployersAdd86000JobsInOctober #USMidterms-WhatAreMarketsExpecting?
🚨
Mach dich bereit für einen ereignisreichen Donnerstag:
• Unternehmenszahlen: Lumentum
$LITE , Cloudflare $NET.US , Iren $IREN , Applied Optoelectronics $AAOI
• Wirtschaft: Erstanträge auf Arbeitslosenhilfe
• Fed-Redner: Barkin, Hammack
#BinanceReopensWithdrawalsForMoreAssets #BTCRebounds80K #Binance98PercentReplenished #ADPUSPrivateEmployersAdd86000JobsInOctober #USMidterms-WhatAreMarketsExpecting?
Mach dich bereit für einen ereignisreichen Donnerstag:
• Unternehmenszahlen: Lumentum
$LITE , Cloudflare $NET.US , Iren $IREN , Applied Optoelectronics $AAOI
• Wirtschaft: Erstanträge auf Arbeitslosenhilfe
• Fed-Redner: Barkin, Hammack
#BinanceReopensWithdrawalsForMoreAssets #BTCRebounds80K #Binance98PercentReplenished #ADPUSPrivateEmployersAdd86000JobsInOctober #USMidterms-WhatAreMarketsExpecting?
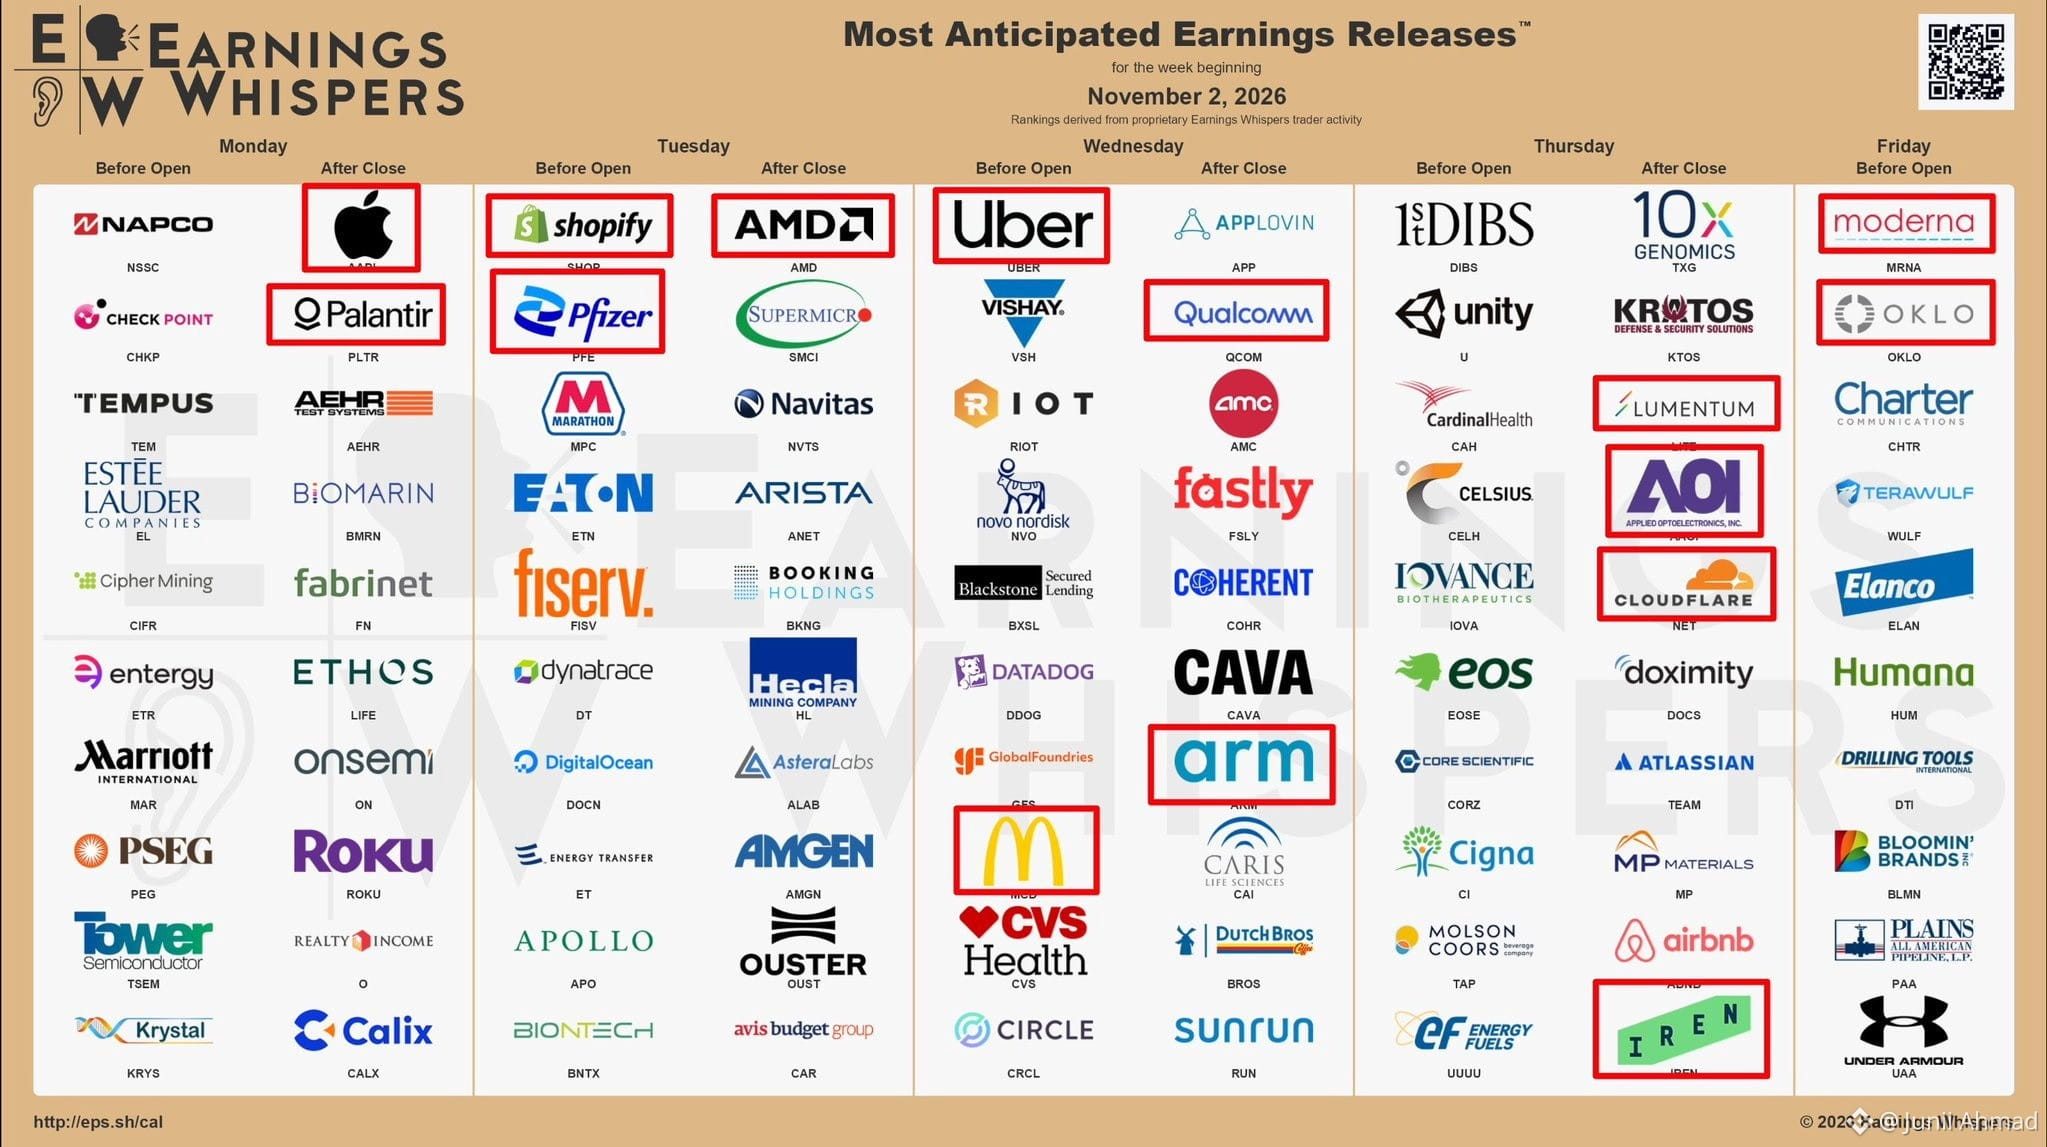
997
·
--
Artikel
Warum Trading Mathematik istDu wirst gleich etwas entdecken, was der Markt dir seit deinem ersten Trade beizubringen versucht: Dem Markt ist deine Meinung egal. Es ist ihm egal, was du für das nächste Quartal vorhersagst. Und es ist ihm ganz sicher egal, welche Geschichte du dir darüber ausgedacht hast, warum eine bestimmte Aktie in die Höhe schießen oder abstürzen wird. Der Markt funktioniert mit Zahlen, und wenn du ihm dauerhaft Gewinne abringen willst, musst du seine Sprache sprechen. Diese Sprache ist Mathematik.
Dies ist die Einleitung zu meinem Buch „Trading ist Mathematik“.
Warum Trading Mathematik ist
Du wirst gleich etwas entdecken, was der Markt dir seit deinem ersten Trade beizubringen versucht: Dem Markt ist deine Meinung egal. Es ist ihm egal, was du für das nächste Quartal vorhersagst. Und es ist ihm ganz sicher egal, welche Geschichte du dir darüber ausgedacht hast, warum eine bestimmte Aktie in die Höhe schießen oder abstürzen wird. Der Markt funktioniert mit Zahlen, und wenn du ihm dauerhaft Gewinne abringen willst, musst du seine Sprache sprechen. Diese Sprache ist Mathematik.
Dies ist die Einleitung zu meinem Buch „Trading ist Mathematik“.
Dies ist die Einleitung zu meinem Buch „Trading ist Mathematik“.
67
·
--

Artikel
Wie dein Gehirn darauf programmiert ist, beim Trading Fehler zu machenErfahre, wie kognitive Verzerrungen deine Entscheidungen unbemerkt beeinflussen und wie du ihre Auswirkungen verringern kannst
Kognitive Psychologie: Das menschliche Gehirn hat sich zum Überleben entwickelt, nicht dafür, Entscheidungen auf Grundlage von Wahrscheinlichkeiten zu treffen.
Hier ist Kapitel 12 aus meinem Buch: Wie du wie ein Wissenschaftler tradest: Nutze die Prinzipien der Wissenschaft, um ein profitables Handelssystem aufzubauen, zu testen und kontinuierlich zu verbessern.
Das menschliche Gehirn hat sich entwickelt, um Unsicherheit zu überleben, nicht um mit Wahrscheinlichkeiten umzugehen. Hunderttausende Jahre lang bedeutete am Leben zu bleiben, mit begrenzten Informationen schnelle Entscheidungen zu treffen. Das Gehirn lernte, Gefahren schnell zu erkennen, sich lebhaft an schmerzhafte Erfahrungen zu erinnern und sich in der Nähe der Sicherheit bietenden Gruppe aufzuhalten. Diese Instinkte hielten die Menschen in der Savanne am Leben. An den Finanzmärkten werden dagegen fast genau entgegengesetzte Verhaltensweisen belohnt.
Wie dein Gehirn darauf programmiert ist, beim Trading Fehler zu machen
Erfahre, wie kognitive Verzerrungen deine Entscheidungen unbemerkt beeinflussen und wie du ihre Auswirkungen verringern kannst
Kognitive Psychologie: Das menschliche Gehirn hat sich zum Überleben entwickelt, nicht dafür, Entscheidungen auf Grundlage von Wahrscheinlichkeiten zu treffen.
Hier ist Kapitel 12 aus meinem Buch: Wie du wie ein Wissenschaftler tradest: Nutze die Prinzipien der Wissenschaft, um ein profitables Handelssystem aufzubauen, zu testen und kontinuierlich zu verbessern.
Das menschliche Gehirn hat sich entwickelt, um Unsicherheit zu überleben, nicht um mit Wahrscheinlichkeiten umzugehen. Hunderttausende Jahre lang bedeutete am Leben zu bleiben, mit begrenzten Informationen schnelle Entscheidungen zu treffen. Das Gehirn lernte, Gefahren schnell zu erkennen, sich lebhaft an schmerzhafte Erfahrungen zu erinnern und sich in der Nähe der Sicherheit bietenden Gruppe aufzuhalten. Diese Instinkte hielten die Menschen in der Savanne am Leben. An den Finanzmärkten werden dagegen fast genau entgegengesetzte Verhaltensweisen belohnt.
Kognitive Psychologie: Das menschliche Gehirn hat sich zum Überleben entwickelt, nicht dafür, Entscheidungen auf Grundlage von Wahrscheinlichkeiten zu treffen.
Hier ist Kapitel 12 aus meinem Buch: Wie du wie ein Wissenschaftler tradest: Nutze die Prinzipien der Wissenschaft, um ein profitables Handelssystem aufzubauen, zu testen und kontinuierlich zu verbessern.
Das menschliche Gehirn hat sich entwickelt, um Unsicherheit zu überleben, nicht um mit Wahrscheinlichkeiten umzugehen. Hunderttausende Jahre lang bedeutete am Leben zu bleiben, mit begrenzten Informationen schnelle Entscheidungen zu treffen. Das Gehirn lernte, Gefahren schnell zu erkennen, sich lebhaft an schmerzhafte Erfahrungen zu erinnern und sich in der Nähe der Sicherheit bietenden Gruppe aufzuhalten. Diese Instinkte hielten die Menschen in der Savanne am Leben. An den Finanzmärkten werden dagegen fast genau entgegengesetzte Verhaltensweisen belohnt.
78
·
--
Rückgangsparameter für Chartmuster:
-5% = Normaler Rücksetzer im Chart
-10% = Normale Chartkorrektur
-15% = Starke Chartkorrektur
-20% = Bereich eines technischen Bärenmarkts
-30% = Kurseinbruch
-40% = Börsencrash
-50% = Krise der Fundamentaldaten
#USMidtermElections #BinanceRestores28FiatWithdrawals #USOctoberNFP-AreRateCutsStillPossible #BinanceWithdrawalScamWarning #AppleEarningsAhead-CanStockHitNewHigh
Rückgangsparameter für Chartmuster:
-5% = Normaler Rücksetzer im Chart
-10% = Normale Chartkorrektur
-15% = Starke Chartkorrektur
-20% = Bereich eines technischen Bärenmarkts
-30% = Kurseinbruch
-40% = Börsencrash
-50% = Krise der Fundamentaldaten
#USMidtermElections #BinanceRestores28FiatWithdrawals #USOctoberNFP-AreRateCutsStillPossible #BinanceWithdrawalScamWarning #AppleEarningsAhead-CanStockHitNewHigh
-5% = Normaler Rücksetzer im Chart
-10% = Normale Chartkorrektur
-15% = Starke Chartkorrektur
-20% = Bereich eines technischen Bärenmarkts
-30% = Kurseinbruch
-40% = Börsencrash
-50% = Krise der Fundamentaldaten
#USMidtermElections #BinanceRestores28FiatWithdrawals #USOctoberNFP-AreRateCutsStillPossible #BinanceWithdrawalScamWarning #AppleEarningsAhead-CanStockHitNewHigh
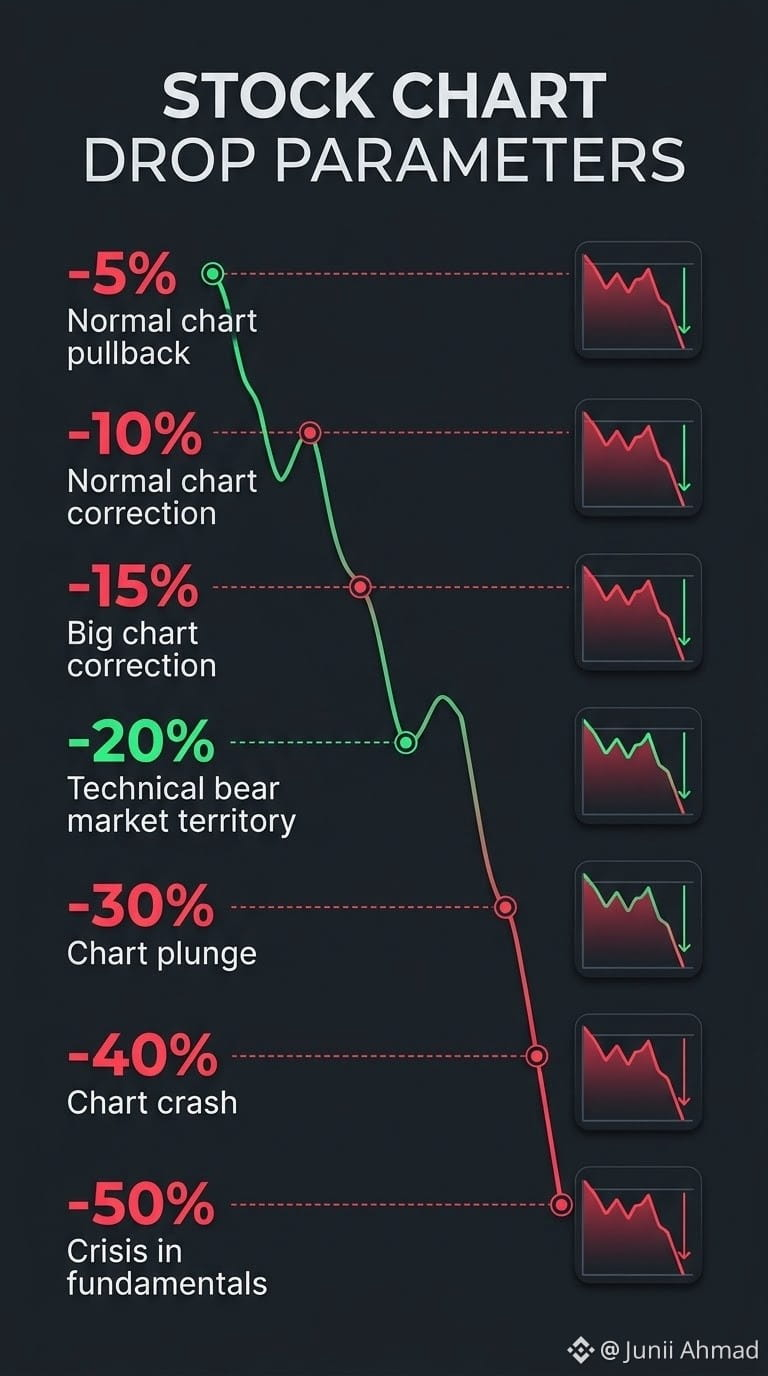
2
67
·
--
Bullisch
Verifiziert
[JUNII AHMAD](https://www.binance.com/register?ref=1025949147)
über
@Junaid_Ahmad1
$AAPLB PL $PLTRB LTR $AAPLB MD $SHOP $MRNA $SMCI $TXG $UBER $LITE $COHR $DIBS $APP $AEHR $QCOM $AMC $CAVA $RIOT $BKNG $TEAM $NVO $ABNB $ETN $BXSL $MPC $FN $GFS $DDOG $MP $U $IREN $FISV $BROS $RUN $ALAB $ARM $CHKP $KTOS $NVTS $ANET $FSLY $AAOI $BMRN $VSH $NET $OKLO $DOCS $TEM $PFE $CIFR $EL
#BinanceRestores28FiatWithdrawals #BinanceProcesses$4.65BWithdrawals #BitcoinClosesAbove50WeekMAFor7thStraightWeek #BitcoinSpotETFsPost$203MWeeklyOutflow #ETHFalls16.1%InOctober
JUNII AHMAD
über
@Junii Ahmad
$AAPLB PL $PLTRB LTR $AAPLB MD $SHOP $MRNA $SMCI $TXG $UBER $LITE $COHR $DIBS $APP $AEHR $QCOM $AMC $CAVA $RIOT $BKNG $TEAM $NVO $ABNB $ETN $BXSL $MPC $FN $GFS $DDOG $MP $U $IREN $FISV $BROS $RUN $ALAB $ARM $CHKP $KTOS $NVTS $ANET $FSLY $AAOI $BMRN $VSH $NET $OKLO $DOCS $TEM $PFE $CIFR $EL
#BinanceRestores28FiatWithdrawals #BinanceProcesses$4.65BWithdrawals #BitcoinClosesAbove50WeekMAFor7thStraightWeek #BitcoinSpotETFsPost$203MWeeklyOutflow #ETHFalls16.1%InOctober
über
@Junii Ahmad
$AAPLB PL $PLTRB LTR $AAPLB MD $SHOP $MRNA $SMCI $TXG $UBER $LITE $COHR $DIBS $APP $AEHR $QCOM $AMC $CAVA $RIOT $BKNG $TEAM $NVO $ABNB $ETN $BXSL $MPC $FN $GFS $DDOG $MP $U $IREN $FISV $BROS $RUN $ALAB $ARM $CHKP $KTOS $NVTS $ANET $FSLY $AAOI $BMRN $VSH $NET $OKLO $DOCS $TEM $PFE $CIFR $EL
#BinanceRestores28FiatWithdrawals #BinanceProcesses$4.65BWithdrawals #BitcoinClosesAbove50WeekMAFor7thStraightWeek #BitcoinSpotETFsPost$203MWeeklyOutflow #ETHFalls16.1%InOctober
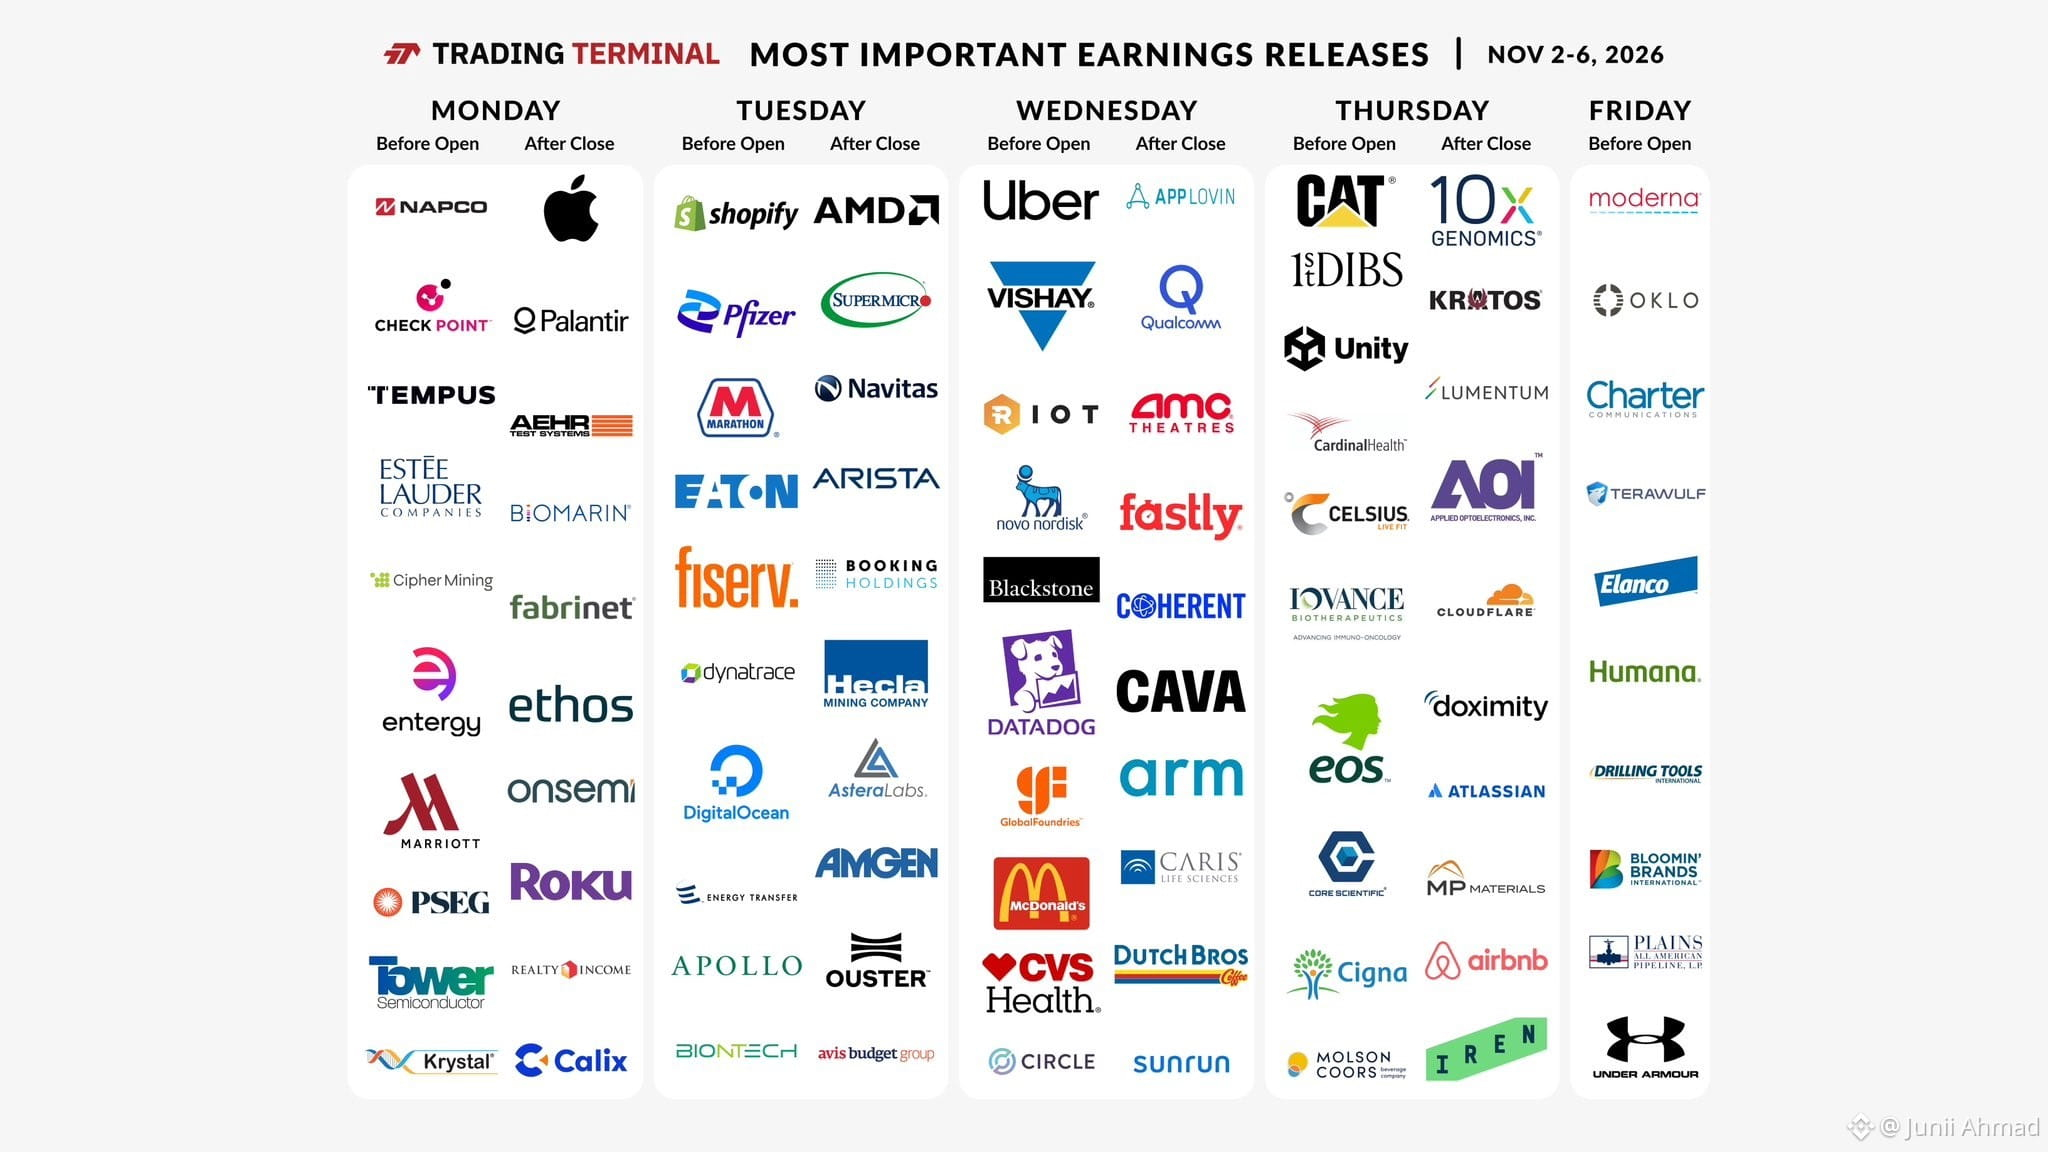
1
1.1k
·
--

Artikel
Die Mathematik großartiger UnternehmenDies ist Kapitel 6 aus meinem Buch: Wie man wie ein Mathematiker Wachstumsaktien auswählt: Mit Logik, Wahrscheinlichkeit und Daten die nächsten großen Börsengewinner finden
BQS = (ROIC/15) + (Bruttomarge/40) + (LTV/CAC/3) + (Wachstum des Betriebsergebnisses/Umsatzwachstum) + (FCF/Nettogewinn)
BQS = Qualitätskennzahl eines Unternehmens
ROIC = Rendite auf das investierte Kapital geteilt durch 15 (Ihr Mindestschwellenwert für den ROIC)
Bruttomarge geteilt durch 40 (Ihr Mindestschwellenwert für die Bruttomarge)
LTV/CAC geteilt durch 3 (Ihr Mindestschwellenwert für LTV/CAC)
Wachstum des Betriebsergebnisses geteilt durch Umsatzwachstum (der operative Leverage-Faktor)
Die Mathematik großartiger Unternehmen
Dies ist Kapitel 6 aus meinem Buch: Wie man wie ein Mathematiker Wachstumsaktien auswählt: Mit Logik, Wahrscheinlichkeit und Daten die nächsten großen Börsengewinner finden
BQS = (ROIC/15) + (Bruttomarge/40) + (LTV/CAC/3) + (Wachstum des Betriebsergebnisses/Umsatzwachstum) + (FCF/Nettogewinn)
BQS = Qualitätskennzahl eines Unternehmens
ROIC = Rendite auf das investierte Kapital geteilt durch 15 (Ihr Mindestschwellenwert für den ROIC)
Bruttomarge geteilt durch 40 (Ihr Mindestschwellenwert für die Bruttomarge)
LTV/CAC geteilt durch 3 (Ihr Mindestschwellenwert für LTV/CAC)
Wachstum des Betriebsergebnisses geteilt durch Umsatzwachstum (der operative Leverage-Faktor)
BQS = (ROIC/15) + (Bruttomarge/40) + (LTV/CAC/3) + (Wachstum des Betriebsergebnisses/Umsatzwachstum) + (FCF/Nettogewinn)
BQS = Qualitätskennzahl eines Unternehmens
ROIC = Rendite auf das investierte Kapital geteilt durch 15 (Ihr Mindestschwellenwert für den ROIC)
Bruttomarge geteilt durch 40 (Ihr Mindestschwellenwert für die Bruttomarge)
LTV/CAC geteilt durch 3 (Ihr Mindestschwellenwert für LTV/CAC)
Wachstum des Betriebsergebnisses geteilt durch Umsatzwachstum (der operative Leverage-Faktor)
1
1
84
·
--
$HYPE /USDT hat gerade das heutige Eröffnungsniveau unterschritten und im 15-Minuten-Chart zwei kräftige rote Kerzen gebildet. Angesichts der gesamten Kursentwicklung der letzten Tage erwarte ich von hier aus einen deutlichen Rückgang. Ein gutes Setup für eine Short-Position, falls jemand einsteigen möchte.
#hype #BinanceToResumePhaseOneOfWithdrawals #IntelHasItsWorstDaySince1974 #BinanceUpdatesProofofReservesAddresses #B14gReportsUnauthorizedTransferOfAbout97MCORE
$HYPE /USDT hat gerade das heutige Eröffnungsniveau unterschritten und im 15-Minuten-Chart zwei kräftige rote Kerzen gebildet. Angesichts der gesamten Kursentwicklung der letzten Tage erwarte ich von hier aus einen deutlichen Rückgang. Ein gutes Setup für eine Short-Position, falls jemand einsteigen möchte.
#hype #BinanceToResumePhaseOneOfWithdrawals #IntelHasItsWorstDaySince1974 #BinanceUpdatesProofofReservesAddresses #B14gReportsUnauthorizedTransferOfAbout97MCORE
#hype #BinanceToResumePhaseOneOfWithdrawals #IntelHasItsWorstDaySince1974 #BinanceUpdatesProofofReservesAddresses #B14gReportsUnauthorizedTransferOfAbout97MCORE
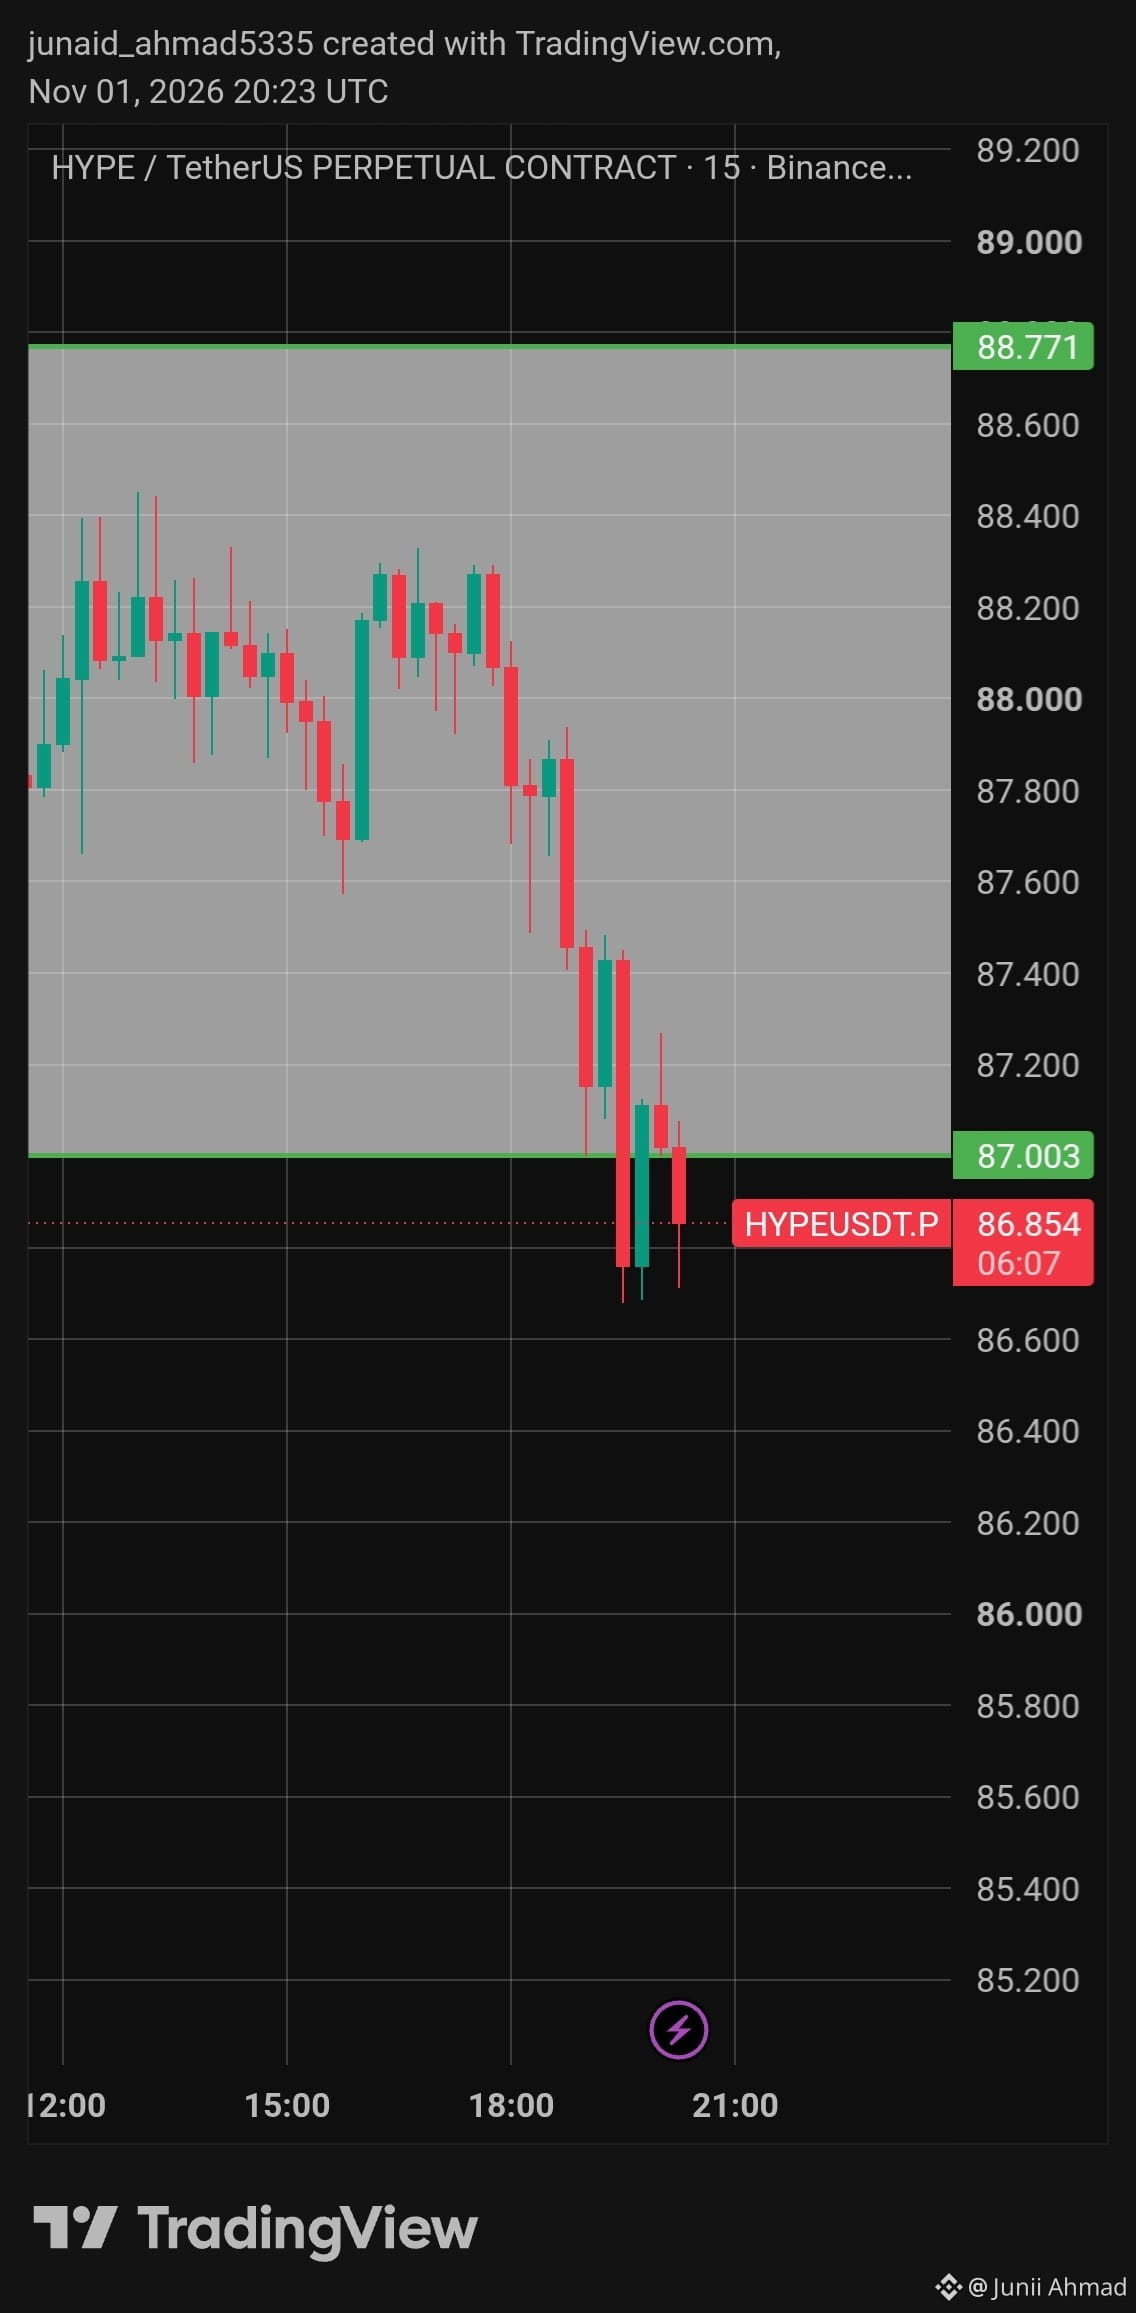
1
2
420
·
--

Artikel
10 Bücher, die Menschen aus der Oberschicht lesen, während Menschen aus der Mittel- und Arbeiterklasse sie fast nie aufschlagenDer Titel ist bewusst provokant. Lesegewohnheiten lassen sich nicht eindeutig nach Einkommen einteilen, und jeder kann sich in einer Bibliothek, einer Buchhandlung oder auf dem Handy ein anspruchsvolles Buch vornehmen.
Dennoch tauchen bestimmte Titel immer wieder in Gesprächen unter Anlegern, Gründern, Führungskräften und Menschen auf, die Geld verwalten. Sie befassen sich mit Anreizen, Kapital, Urteilsvermögen, Geschichte und Macht. Sie verlangen den Lesenden mehr ab als eine schnelle Lektion über Sparen oder Motivationssuche. Deshalb lohnt es sich, sie aufzuschlagen, zu lesen, erneut zu lesen und mit Menschen zu besprechen, die nach größerem Erfolg streben.
10 Bücher, die Menschen aus der Oberschicht lesen, während Menschen aus der Mittel- und Arbeiterklasse sie fast nie aufschlagen
Der Titel ist bewusst provokant. Lesegewohnheiten lassen sich nicht eindeutig nach Einkommen einteilen, und jeder kann sich in einer Bibliothek, einer Buchhandlung oder auf dem Handy ein anspruchsvolles Buch vornehmen.
Dennoch tauchen bestimmte Titel immer wieder in Gesprächen unter Anlegern, Gründern, Führungskräften und Menschen auf, die Geld verwalten. Sie befassen sich mit Anreizen, Kapital, Urteilsvermögen, Geschichte und Macht. Sie verlangen den Lesenden mehr ab als eine schnelle Lektion über Sparen oder Motivationssuche. Deshalb lohnt es sich, sie aufzuschlagen, zu lesen, erneut zu lesen und mit Menschen zu besprechen, die nach größerem Erfolg streben.
Dennoch tauchen bestimmte Titel immer wieder in Gesprächen unter Anlegern, Gründern, Führungskräften und Menschen auf, die Geld verwalten. Sie befassen sich mit Anreizen, Kapital, Urteilsvermögen, Geschichte und Macht. Sie verlangen den Lesenden mehr ab als eine schnelle Lektion über Sparen oder Motivationssuche. Deshalb lohnt es sich, sie aufzuschlagen, zu lesen, erneut zu lesen und mit Menschen zu besprechen, die nach größerem Erfolg streben.
2
364
·
--
Artikel
Die 10 besten Zitate von Paul Tudor Jones über Price-Action-Trading@Junaid_Ahmad1
Paul Tudor Jones ist einer der größten Trader und Vermögensverwalter seiner Generation. Jahrzehntelang hatte er in seinem Hauptfonds kein einziges Verlustjahr. Während des Börsencrashs am Schwarzen Montag 1987 konnte er sein verwaltetes Kapital mehr als verdoppeln, während andere massive Verluste und Kontoplatzer erlitten. Auf der Forbes-Liste belegt er Platz 477 der reichsten Menschen der Welt. Sein Nettovermögen beträgt rund 8,1 Milliarden US-Dollar und wächst weiter. Trader aller Erfahrungsstufen sollten sich anhören, was er über das Trading zu sagen hat.
„Es gibt keine Ausbildung, weder im Klassenzimmer noch auf andere Weise, die einen darauf vorbereiten kann, das letzte Drittel einer Bewegung zu traden – ganz gleich, ob es sich um das Ende eines Bullen- oder eines Bärenmarkts handelt.“ – Paul Tudor Jones
Die 10 besten Zitate von Paul Tudor Jones über Price-Action-Trading
@Junii Ahmad
Paul Tudor Jones ist einer der größten Trader und Vermögensverwalter seiner Generation. Jahrzehntelang hatte er in seinem Hauptfonds kein einziges Verlustjahr. Während des Börsencrashs am Schwarzen Montag 1987 konnte er sein verwaltetes Kapital mehr als verdoppeln, während andere massive Verluste und Kontoplatzer erlitten. Auf der Forbes-Liste belegt er Platz 477 der reichsten Menschen der Welt. Sein Nettovermögen beträgt rund 8,1 Milliarden US-Dollar und wächst weiter. Trader aller Erfahrungsstufen sollten sich anhören, was er über das Trading zu sagen hat.
„Es gibt keine Ausbildung, weder im Klassenzimmer noch auf andere Weise, die einen darauf vorbereiten kann, das letzte Drittel einer Bewegung zu traden – ganz gleich, ob es sich um das Ende eines Bullen- oder eines Bärenmarkts handelt.“ – Paul Tudor Jones
Paul Tudor Jones ist einer der größten Trader und Vermögensverwalter seiner Generation. Jahrzehntelang hatte er in seinem Hauptfonds kein einziges Verlustjahr. Während des Börsencrashs am Schwarzen Montag 1987 konnte er sein verwaltetes Kapital mehr als verdoppeln, während andere massive Verluste und Kontoplatzer erlitten. Auf der Forbes-Liste belegt er Platz 477 der reichsten Menschen der Welt. Sein Nettovermögen beträgt rund 8,1 Milliarden US-Dollar und wächst weiter. Trader aller Erfahrungsstufen sollten sich anhören, was er über das Trading zu sagen hat.
„Es gibt keine Ausbildung, weder im Klassenzimmer noch auf andere Weise, die einen darauf vorbereiten kann, das letzte Drittel einer Bewegung zu traden – ganz gleich, ob es sich um das Ende eines Bullen- oder eines Bärenmarkts handelt.“ – Paul Tudor Jones
1
193
·
--

Artikel
Die 10 besten Zitate von Michael Burry zum Price-Action-TradingMichael J. Burry war zunächst Arzt und leitete dann von 2000 bis 2008 den Hedgefonds Scion Capital, bevor er ihn schloss, um sich auf seine eigenen persönlichen Investitionen und Geschäfte zu konzentrieren. Michael Burry wurde durch seine Darstellung im Film „The Big Short“ mit Christian Bale berühmt, der auf dem Buch von Michael Lewis basiert. Mr. Burry gehörte zu den Ersten, die die Subprime-Hypothekenkrise von 2008–2009 erkannten und damit große Gewinne erzielten.
Hier sind zehn der besten Zitate über Trading und Geldanlage, die besonders hilfreich sein könnten, um seine Anlage- und Handelsstrategie zu verstehen. Burry war sowohl Value-Investor bei Aktien als auch Händler von Credit Default Swaps. Es ist immer interessant, von Menschen zu hören, die an den Märkten ein Vermögen gemacht haben, während die Mehrheit viel Geld verlor. Es braucht Genialität, gegen die Mehrheit zu wetten – und zwar zum richtigen Zeitpunkt.
Die 10 besten Zitate von Michael Burry zum Price-Action-Trading
Michael J. Burry war zunächst Arzt und leitete dann von 2000 bis 2008 den Hedgefonds Scion Capital, bevor er ihn schloss, um sich auf seine eigenen persönlichen Investitionen und Geschäfte zu konzentrieren. Michael Burry wurde durch seine Darstellung im Film „The Big Short“ mit Christian Bale berühmt, der auf dem Buch von Michael Lewis basiert. Mr. Burry gehörte zu den Ersten, die die Subprime-Hypothekenkrise von 2008–2009 erkannten und damit große Gewinne erzielten.
Hier sind zehn der besten Zitate über Trading und Geldanlage, die besonders hilfreich sein könnten, um seine Anlage- und Handelsstrategie zu verstehen. Burry war sowohl Value-Investor bei Aktien als auch Händler von Credit Default Swaps. Es ist immer interessant, von Menschen zu hören, die an den Märkten ein Vermögen gemacht haben, während die Mehrheit viel Geld verlor. Es braucht Genialität, gegen die Mehrheit zu wetten – und zwar zum richtigen Zeitpunkt.
Hier sind zehn der besten Zitate über Trading und Geldanlage, die besonders hilfreich sein könnten, um seine Anlage- und Handelsstrategie zu verstehen. Burry war sowohl Value-Investor bei Aktien als auch Händler von Credit Default Swaps. Es ist immer interessant, von Menschen zu hören, die an den Märkten ein Vermögen gemacht haben, während die Mehrheit viel Geld verlor. Es braucht Genialität, gegen die Mehrheit zu wetten – und zwar zum richtigen Zeitpunkt.
2
2
796
·
--

Artikel
10 Bücher, die reiche Menschen lesen und die Menschen mit Geldsorgen fast nie aufschlagenTom Corleys Studie, in der er die Gewohnheiten von 233 Millionären untersuchte, offenbarte einen deutlichen Unterschied zwischen ihnen und den meisten anderen Menschen: 88 % der Wohlhabenden lesen gern, um sich weiterzuentwickeln. Menschen mit geringerem Einkommen (also Personen mit einem Jahreseinkommen von höchstens 35.000 $ und einem liquiden Nettovermögen von höchstens 5.000 $) lesen hauptsächlich zur Unterhaltung. Dieser Gegensatz ist nicht bloß akademischer Natur – er wirkt sich direkt auf den Vermögensaufbau aus.
Die folgenden Bücher sind nicht nur bei den Reichen beliebt – Milliardäre wie Warren Buffett, Bill Gates und Jeff Bezos bezeichnen sie als entscheidende Hilfsmittel, die ihnen beim Aufbau ihres Vermögens geholfen haben.
10 Bücher, die reiche Menschen lesen und die Menschen mit Geldsorgen fast nie aufschlagen
Tom Corleys Studie, in der er die Gewohnheiten von 233 Millionären untersuchte, offenbarte einen deutlichen Unterschied zwischen ihnen und den meisten anderen Menschen: 88 % der Wohlhabenden lesen gern, um sich weiterzuentwickeln. Menschen mit geringerem Einkommen (also Personen mit einem Jahreseinkommen von höchstens 35.000 $ und einem liquiden Nettovermögen von höchstens 5.000 $) lesen hauptsächlich zur Unterhaltung. Dieser Gegensatz ist nicht bloß akademischer Natur – er wirkt sich direkt auf den Vermögensaufbau aus.
Die folgenden Bücher sind nicht nur bei den Reichen beliebt – Milliardäre wie Warren Buffett, Bill Gates und Jeff Bezos bezeichnen sie als entscheidende Hilfsmittel, die ihnen beim Aufbau ihres Vermögens geholfen haben.
Die folgenden Bücher sind nicht nur bei den Reichen beliebt – Milliardäre wie Warren Buffett, Bill Gates und Jeff Bezos bezeichnen sie als entscheidende Hilfsmittel, die ihnen beim Aufbau ihres Vermögens geholfen haben.
2
9
2.4k
·
--
EILMELDUNG🚀 Der US-Aktienmarkt hat sich heute in einen Meme-Coin-Markt verwandelt.
• Intel
$INTC
: -31%
• Reddit
$RDDT
: -30%
• Roblox
$RBLX.US
: -20%
• Illumina
$ILMN
: -19%
• SanDisk
$SNDK
: -15%
• Arm
$ARM
: -12.7%
• Dell
$DELL: -12.5%
#UniswapA16zSeekDeFiExemptionFromIllinoisCryptoTax #USMidtermElections #BinanceWillListPredictPREDICT #$1.5BInLeveragedCryptoBetsLiquidated #KOSPIFalls3.53%BackBelow6000
EILMELDUNG🚀 Der US-Aktienmarkt hat sich heute in einen Meme-Coin-Markt verwandelt.
• Intel
$INTC
: -31%
• Reddit
$RDDT
: -30%
• Roblox
$RBLX.US
: -20%
• Illumina
$ILMN
: -19%
• SanDisk
$SNDK
: -15%
• Arm
$ARM
: -12.7%
• Dell
$DELL: -12.5%
#UniswapA16zSeekDeFiExemptionFromIllinoisCryptoTax #USMidtermElections #BinanceWillListPredictPREDICT #$1.5BInLeveragedCryptoBetsLiquidated #KOSPIFalls3.53%BackBelow6000
• Intel
$INTC
: -31%
$RDDT
: -30%
• Roblox
$RBLX.US
: -20%
• Illumina
$ILMN
: -19%
• SanDisk
$SNDK
: -15%
• Arm
$ARM
: -12.7%
• Dell
$DELL: -12.5%
#UniswapA16zSeekDeFiExemptionFromIllinoisCryptoTax #USMidtermElections #BinanceWillListPredictPREDICT #$1.5BInLeveragedCryptoBetsLiquidated #KOSPIFalls3.53%BackBelow6000
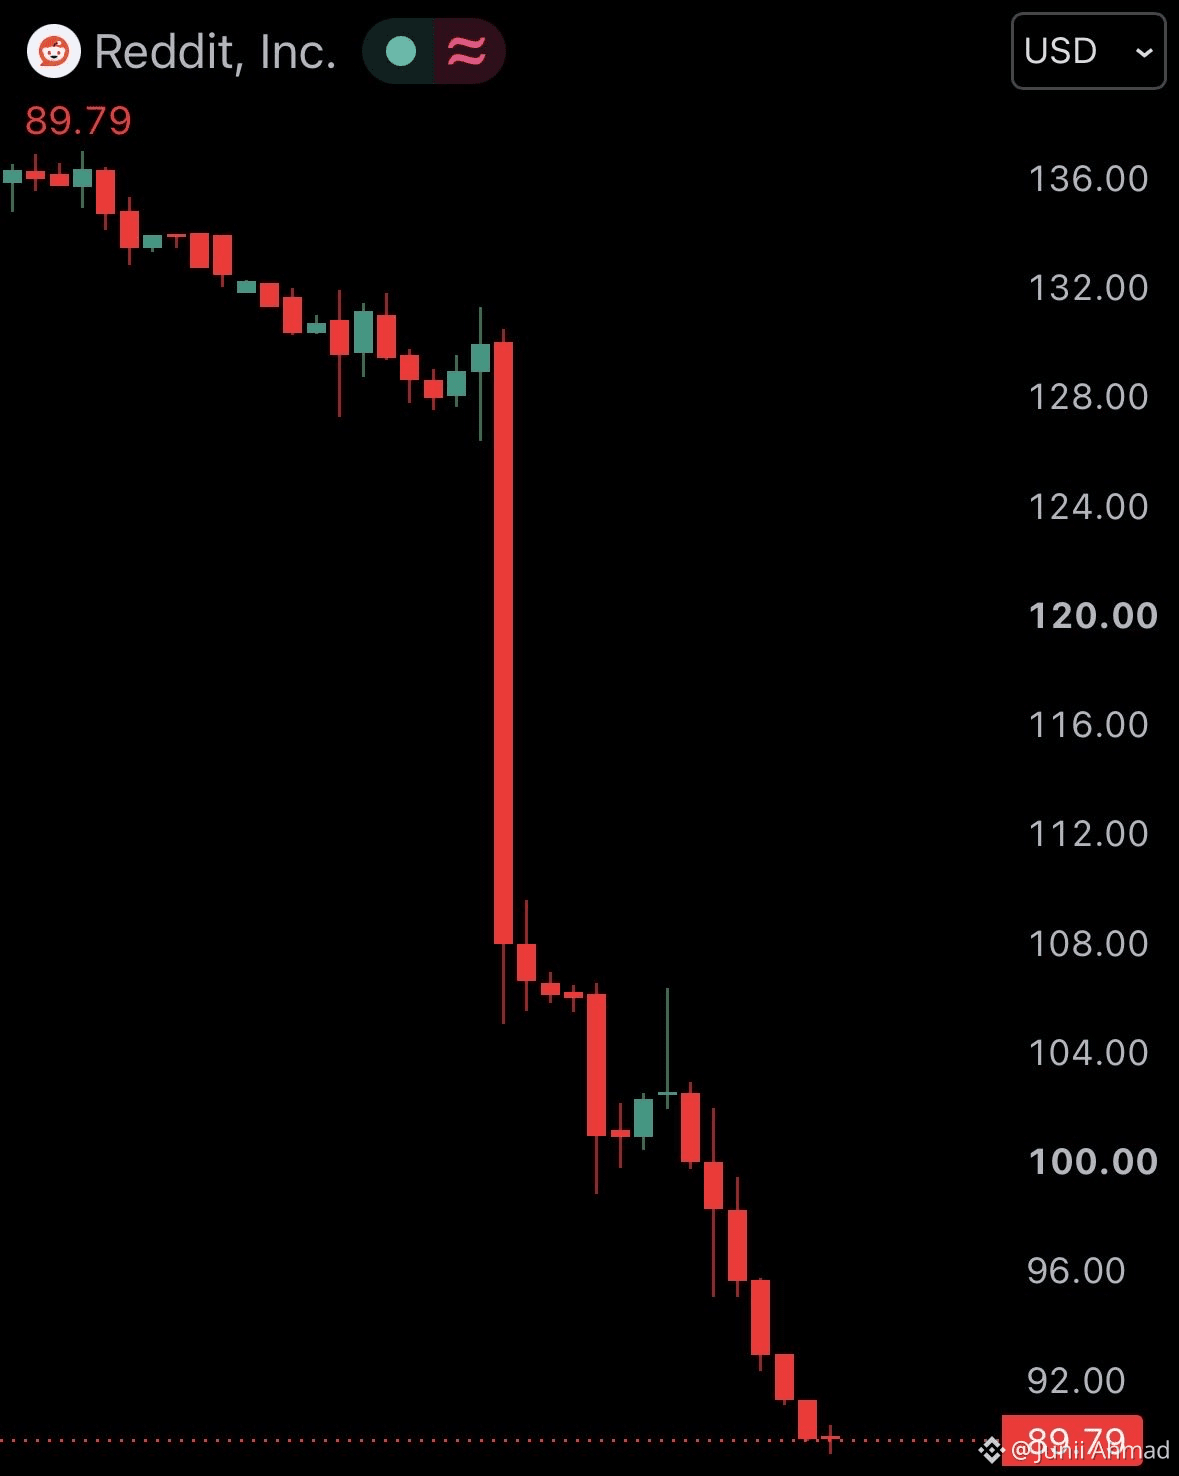
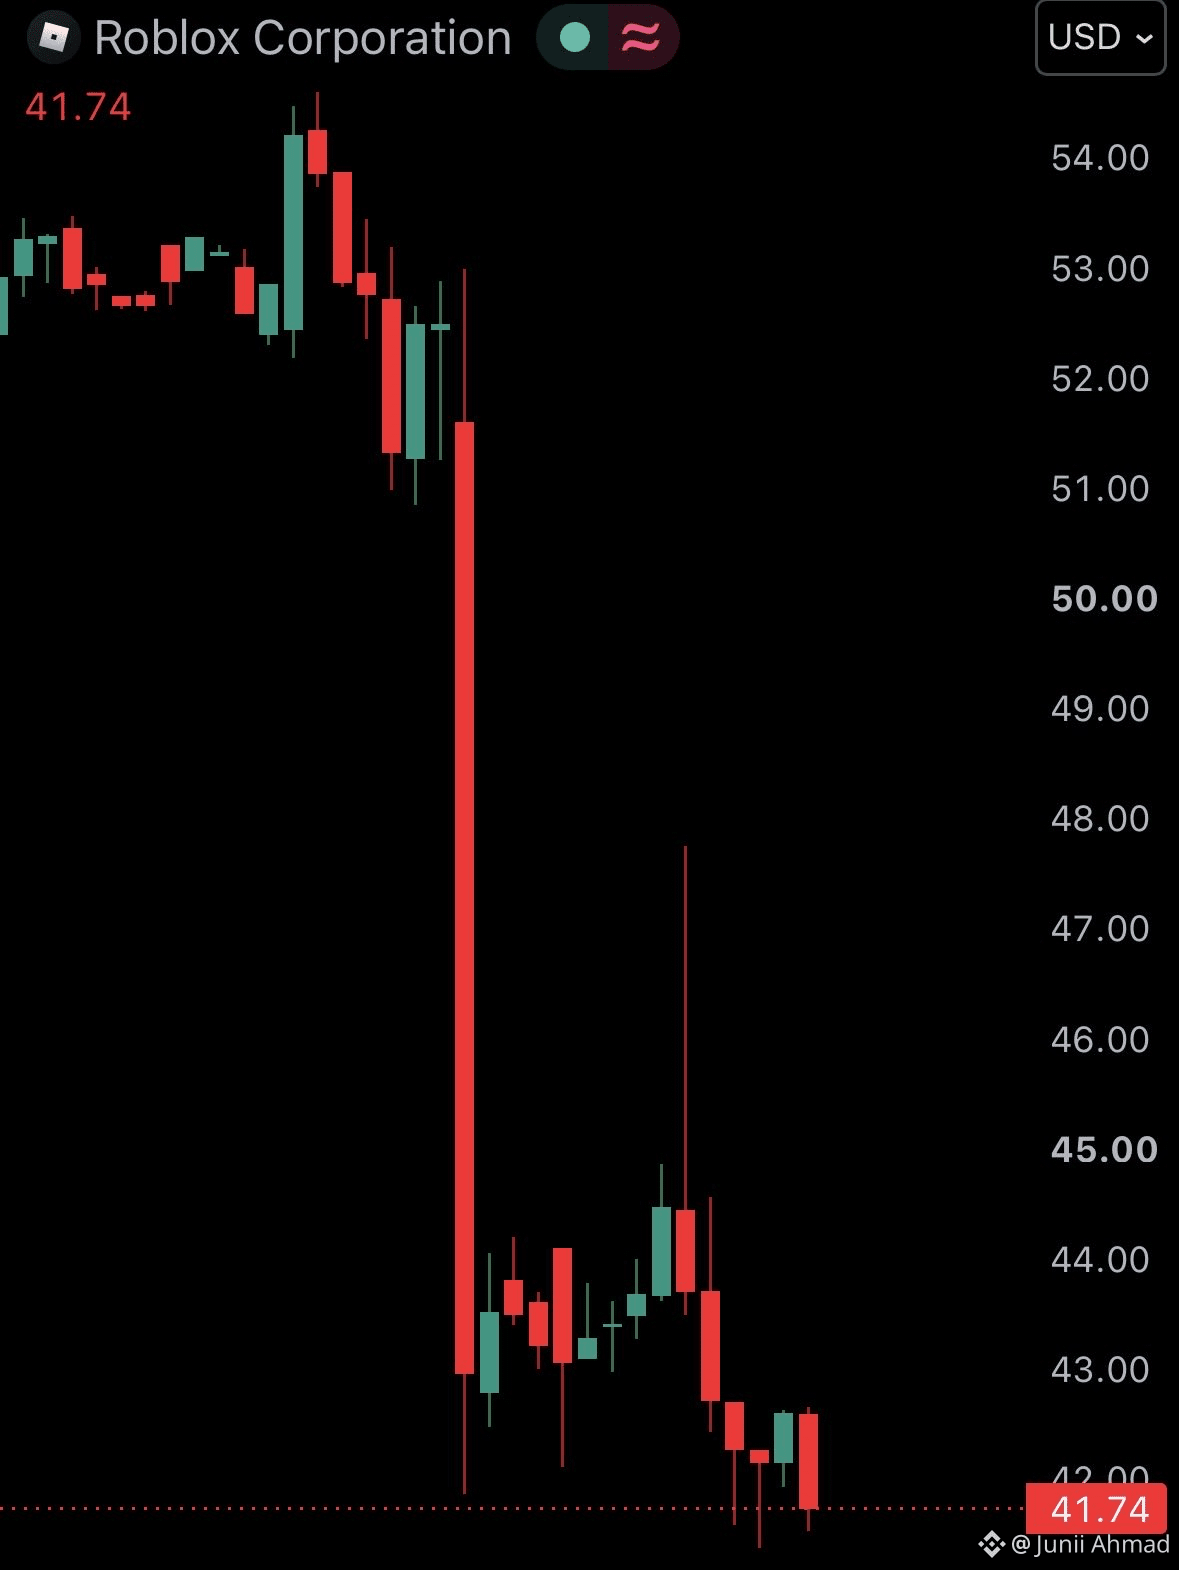
1
48
·
--
$HYPE
Vielen Dank an alle für die kontinuierliche Unterstützung. Ich habe wirklich viel von euch gelernt. Hier ist eine kurze Analyse des Charts von der heutigen Konstellation. Lasst mich wissen, falls ich etwas übersehen habe.
#KOSPIFalls3.53%BackBelow6000 #USMidtermElections #BinanceWillListPredictPREDICT #HKDollarStablecoinHKDAPToLaunchOnSolana
#
$HYPE
Vielen Dank an alle für die kontinuierliche Unterstützung. Ich habe wirklich viel von euch gelernt. Hier ist eine kurze Analyse des Charts von der heutigen Konstellation. Lasst mich wissen, falls ich etwas übersehen habe.
#KOSPIFalls3.53%BackBelow6000 #USMidtermElections #BinanceWillListPredictPREDICT #HKDollarStablecoinHKDAPToLaunchOnSolana
#
Vielen Dank an alle für die kontinuierliche Unterstützung. Ich habe wirklich viel von euch gelernt. Hier ist eine kurze Analyse des Charts von der heutigen Konstellation. Lasst mich wissen, falls ich etwas übersehen habe.
#KOSPIFalls3.53%BackBelow6000 #USMidtermElections #BinanceWillListPredictPREDICT #HKDollarStablecoinHKDAPToLaunchOnSolana
#
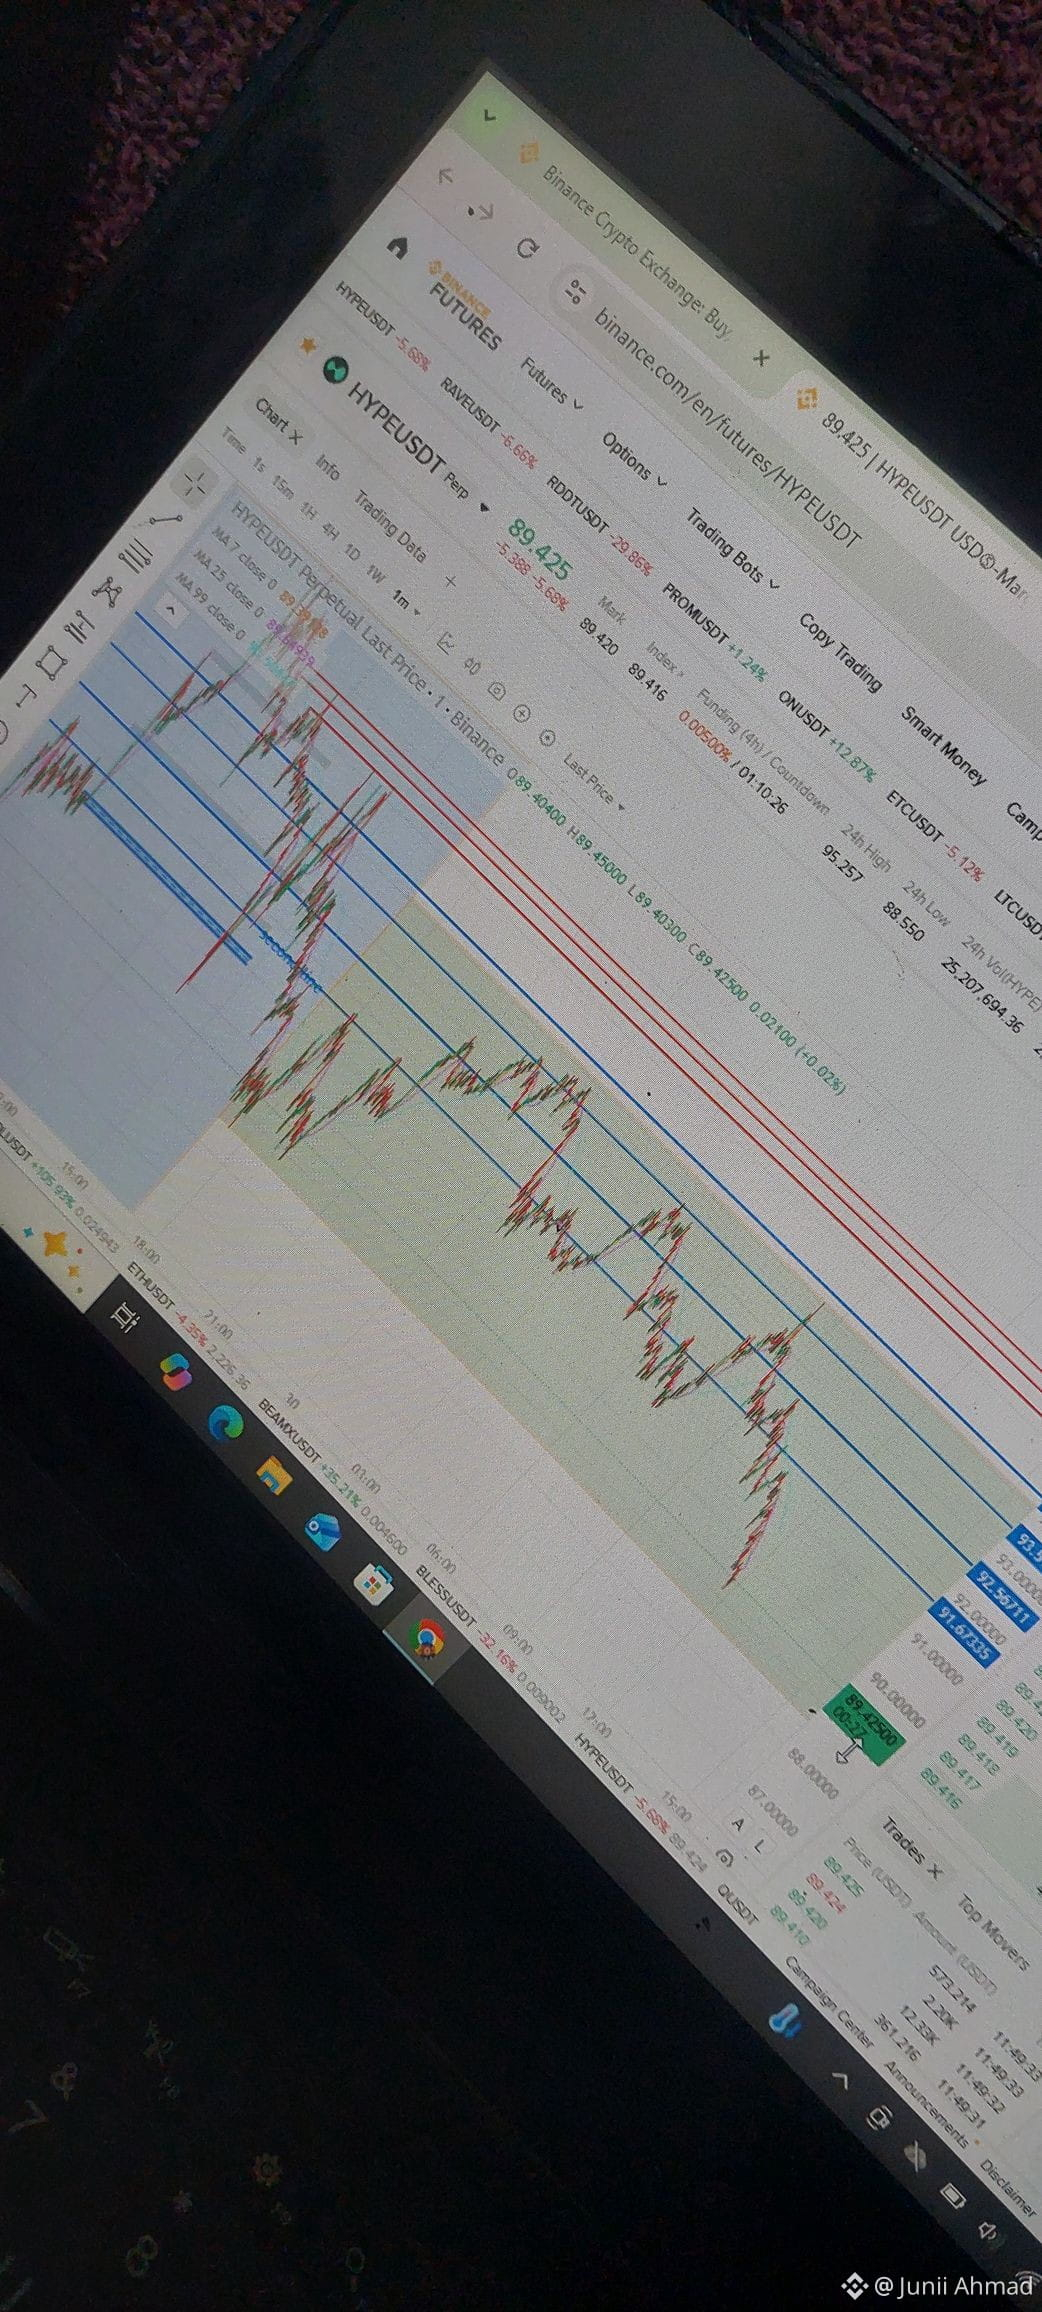
1
1
144
·
--
Das ist, was ich seit meinem Einstieg in Krypto vor 10 Jahren angesammelt habe..
Diese Liste wurde auf CRYPTO Twitter geteilt
Meine Favoriten für den nächsten Bullenzyklus:
1. $GRASS — Dezentralisiertes Datennetzwerk
2. $VVV — Private KI-Inferenz
3. $HYPE — On-Chain-Handel & L1-Blockchain
4. $ZANO — Private Layer-1-Blockchain
5. $ZAMA — Vertrauliche Smart Contracts
6. $NEAR — L1 der nächsten Generation
7. $QNT — Blockchain-Interoperabilität
8. $ONDO — Tokenisierte reale Vermögenswerte
9. $PENDLE — Yield-Trading-Protokoll
10. $AERO — Liquiditätszentrum von Base
11. $LIT — Dezentralisierte Perpetuals-Börse
12. $ZEC — Führend im Bereich Datenschutz
13. $PUMP — Memecoin-Launchpad
14. $GEOD — Dezentralisierte Präzisionspositionierung – besitze ich nicht
15. $TAO — Dezentralisiertes KI-Netzwerk
16. $PENGU — Pudgy-Penguins-Ökosystem
17. $QUBIC — KI & nützlicher Proof of Work
18. $BP — Backpack-Exchange-Ökosystem
19. $CHEX — Infrastruktur für die Tokenisierung realer Vermögenswerte – besitze ich nicht
20. $LINK — Dezentralisiertes Oracle-Netzwerk
21. $RENDER — Dezentralisiertes GPU-Rendering
22. $PYTH — Dezentralisiertes Oracle für Marktdaten
#USMidtermElections #BinanceWillListPredictPREDICT #AmazonSharesFallAbout7%InPremarketTrading #KOSPIFalls3.53%BackBelow6000 #UniswapA16zSeekDeFiExemptionFromIllinoisCryptoTax
Das ist, was ich seit meinem Einstieg in Krypto vor 10 Jahren angesammelt habe..
Diese Liste wurde auf CRYPTO Twitter geteilt
Meine Favoriten für den nächsten Bullenzyklus:
1. $GRASS — Dezentralisiertes Datennetzwerk
2. $VVV — Private KI-Inferenz
3. $HYPE — On-Chain-Handel & L1-Blockchain
4. $ZANO — Private Layer-1-Blockchain
5. $ZAMA — Vertrauliche Smart Contracts
6. $NEAR — L1 der nächsten Generation
7. $QNT — Blockchain-Interoperabilität
8. $ONDO — Tokenisierte reale Vermögenswerte
9. $PENDLE — Yield-Trading-Protokoll
10. $AERO — Liquiditätszentrum von Base
11. $LIT — Dezentralisierte Perpetuals-Börse
12. $ZEC — Führend im Bereich Datenschutz
13. $PUMP — Memecoin-Launchpad
14. $GEOD — Dezentralisierte Präzisionspositionierung – besitze ich nicht
15. $TAO — Dezentralisiertes KI-Netzwerk
16. $PENGU — Pudgy-Penguins-Ökosystem
17. $QUBIC — KI & nützlicher Proof of Work
18. $BP — Backpack-Exchange-Ökosystem
19. $CHEX — Infrastruktur für die Tokenisierung realer Vermögenswerte – besitze ich nicht
20. $LINK — Dezentralisiertes Oracle-Netzwerk
21. $RENDER — Dezentralisiertes GPU-Rendering
22. $PYTH — Dezentralisiertes Oracle für Marktdaten
#USMidtermElections #BinanceWillListPredictPREDICT #AmazonSharesFallAbout7%InPremarketTrading #KOSPIFalls3.53%BackBelow6000 #UniswapA16zSeekDeFiExemptionFromIllinoisCryptoTax
Diese Liste wurde auf CRYPTO Twitter geteilt
Meine Favoriten für den nächsten Bullenzyklus:
1. $GRASS — Dezentralisiertes Datennetzwerk
2. $VVV — Private KI-Inferenz
3. $HYPE — On-Chain-Handel & L1-Blockchain
4. $ZANO — Private Layer-1-Blockchain
5. $ZAMA — Vertrauliche Smart Contracts
6. $NEAR — L1 der nächsten Generation
7. $QNT — Blockchain-Interoperabilität
8. $ONDO — Tokenisierte reale Vermögenswerte
9. $PENDLE — Yield-Trading-Protokoll
10. $AERO — Liquiditätszentrum von Base
11. $LIT — Dezentralisierte Perpetuals-Börse
12. $ZEC — Führend im Bereich Datenschutz
13. $PUMP — Memecoin-Launchpad
14. $GEOD — Dezentralisierte Präzisionspositionierung – besitze ich nicht
15. $TAO — Dezentralisiertes KI-Netzwerk
16. $PENGU — Pudgy-Penguins-Ökosystem
17. $QUBIC — KI & nützlicher Proof of Work
18. $BP — Backpack-Exchange-Ökosystem
19. $CHEX — Infrastruktur für die Tokenisierung realer Vermögenswerte – besitze ich nicht
20. $LINK — Dezentralisiertes Oracle-Netzwerk
21. $RENDER — Dezentralisiertes GPU-Rendering
22. $PYTH — Dezentralisiertes Oracle für Marktdaten
#USMidtermElections #BinanceWillListPredictPREDICT #AmazonSharesFallAbout7%InPremarketTrading #KOSPIFalls3.53%BackBelow6000 #UniswapA16zSeekDeFiExemptionFromIllinoisCryptoTax
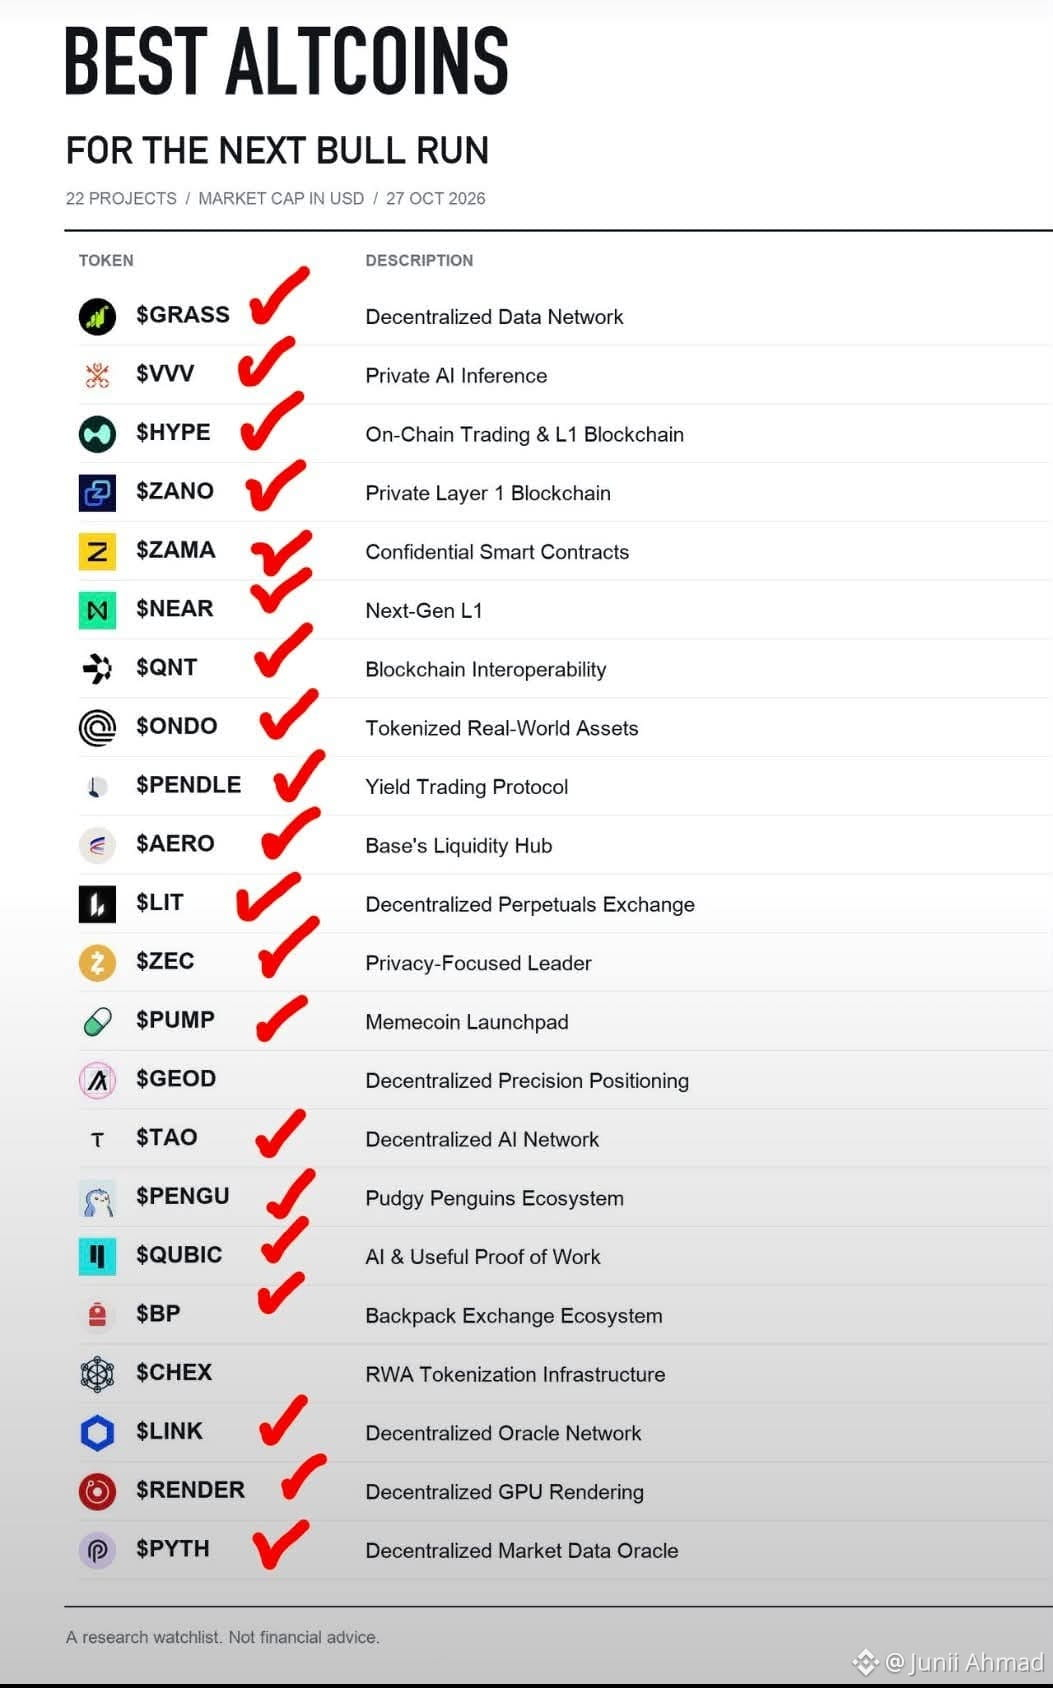
3
1k
Anmelden und weiter Inhalte entdecken
Krypto-Nutzer weltweit auf Binance Square kennenlernen
⚡️ Bleib in Sachen Krypto stets am Puls.
💬 Die weltgrößte Kryptobörse vertraut darauf.
👍 Erhalte verlässliche Einblicke von verifizierten Creators.
E-Mail-Adresse/Telefonnummer
Trendthemen
WhoWillSucceedJensenHuangatNvidia?
34,469 Aufrufe
491 Kommentare
Nvidia: Keine Gespräche über CEO-Nachfolge – Petition „Stand With Jensen“ erreicht mehr als 77.900 Unterschriften
Binance News
·14 Likes
·16.6k Aufrufe
WhatWillDriveCryptoandStocks’NextRebound?
344,061 Aufrufe
2,459 Kommentare
USPPIMissMayEaseBTCPressure
156,527 Aufrufe
1,719 Kommentare