

#nasdaqdowweeklygapwidestsincejuly2002
nasdaqdowweeklygapwidestsincejuly2002
Hot
Latest

·
--
Bearish
#nasdaqdowweeklygapwidestsincejuly2002
📉 NASDAQ vs. DOW: Biggest Weekly Gap Since 2002
The US stock market is showing a major shift in investor sentiment. The Nasdaq Composite dropped 4.48%, while the Dow Jones gained 0.68%, creating a 5.16 percentage-point gap — the widest since July 2002.
🔍 What’s Behind the Move?
Weakness in technology stocks and concerns over returns from massive AI investments are putting pressure on tech-heavy indexes. Meanwhile, the Dow’s gains suggest investors are showing greater resilience toward other sectors.
₿ What Could This Mean for Crypto?
Bitcoin and altcoins could face additional pressure if tech-sector weakness spreads across financial markets. However, this divergence alone does not confirm an upcoming crypto crash.
🎯 Trader Takeaway: Watch Bitcoin support levels, trading volume, and broader market sentiment. If tech stocks stabilize, crypto may find relief. If selling intensifies, volatility could increase.
Stay alert, manage risk, and wait for confirmation before entering a trade.
#NASDAQ #bitcoin #CryptoMarket
$ZEREBRO $BAT $CT
{future}(ZEREBROUSDT)
{future}(BATUSDT)
{future}(CTUSDT)
#nasdaqdowweeklygapwidestsincejuly2002
📉 NASDAQ vs. DOW: Biggest Weekly Gap Since 2002
The US stock market is showing a major shift in investor sentiment. The Nasdaq Composite dropped 4.48%, while the Dow Jones gained 0.68%, creating a 5.16 percentage-point gap — the widest since July 2002.
🔍 What’s Behind the Move?
Weakness in technology stocks and concerns over returns from massive AI investments are putting pressure on tech-heavy indexes. Meanwhile, the Dow’s gains suggest investors are showing greater resilience toward other sectors.
₿ What Could This Mean for Crypto?
Bitcoin and altcoins could face additional pressure if tech-sector weakness spreads across financial markets. However, this divergence alone does not confirm an upcoming crypto crash.
🎯 Trader Takeaway: Watch Bitcoin support levels, trading volume, and broader market sentiment. If tech stocks stabilize, crypto may find relief. If selling intensifies, volatility could increase.
Stay alert, manage risk, and wait for confirmation before entering a trade.
#NASDAQ #bitcoin #CryptoMarket
$ZEREBRO $BAT $CT
📉 NASDAQ vs. DOW: Biggest Weekly Gap Since 2002
The US stock market is showing a major shift in investor sentiment. The Nasdaq Composite dropped 4.48%, while the Dow Jones gained 0.68%, creating a 5.16 percentage-point gap — the widest since July 2002.
🔍 What’s Behind the Move?
Weakness in technology stocks and concerns over returns from massive AI investments are putting pressure on tech-heavy indexes. Meanwhile, the Dow’s gains suggest investors are showing greater resilience toward other sectors.
₿ What Could This Mean for Crypto?
Bitcoin and altcoins could face additional pressure if tech-sector weakness spreads across financial markets. However, this divergence alone does not confirm an upcoming crypto crash.
🎯 Trader Takeaway: Watch Bitcoin support levels, trading volume, and broader market sentiment. If tech stocks stabilize, crypto may find relief. If selling intensifies, volatility could increase.
Stay alert, manage risk, and wait for confirmation before entering a trade.
#NASDAQ #bitcoin #CryptoMarket
$ZEREBRO $BAT $CT
780

🔴 The AI boom is getting a financing bill.
Wall Street ended the week with a striking split:
📉 Nasdaq Composite: −4.5% 📈 Dow Jones: +0.7%
More than five percentage points apart in the same week.
Behind that divide, investors are questioning the debt financing supporting the AI infrastructure boom. Technology and chip stocks came under pressure, with CoreWeave among the hardest hit.
The investment question is getting tougher:
How much will these companies earn, how soon, and what will it cost to finance the buildout?
AI can transform the economy while some AI investments deliver disappointing returns. Both can happen.
Our reading: this divergence is consistent with investors becoming more selective about valuations, debt and earnings. One week alone cannot establish a lasting change in market leadership.
For crypto investors, that deserves attention. A stronger Dow offers limited reassurance to a portfolio concentrated in assets sensitive to risk appetite and financing conditions.
Next week, watch whether technology stabilizes—and whether strength spreads across more sectors.
Would you keep paying a premium for AI growth, or demand clearer evidence of returns?
The Market File | Global Markets
#NasdaqDowWeeklyGapWidestSinceJuly2002
🔴 The AI boom is getting a financing bill.
Wall Street ended the week with a striking split:
📉 Nasdaq Composite: −4.5% 📈 Dow Jones: +0.7%
More than five percentage points apart in the same week.
Behind that divide, investors are questioning the debt financing supporting the AI infrastructure boom. Technology and chip stocks came under pressure, with CoreWeave among the hardest hit.
The investment question is getting tougher:
How much will these companies earn, how soon, and what will it cost to finance the buildout?
AI can transform the economy while some AI investments deliver disappointing returns. Both can happen.
Our reading: this divergence is consistent with investors becoming more selective about valuations, debt and earnings. One week alone cannot establish a lasting change in market leadership.
For crypto investors, that deserves attention. A stronger Dow offers limited reassurance to a portfolio concentrated in assets sensitive to risk appetite and financing conditions.
Next week, watch whether technology stabilizes—and whether strength spreads across more sectors.
Would you keep paying a premium for AI growth, or demand clearer evidence of returns?
The Market File | Global Markets
#NasdaqDowWeeklyGapWidestSinceJuly2002
Wall Street ended the week with a striking split:
📉 Nasdaq Composite: −4.5% 📈 Dow Jones: +0.7%
More than five percentage points apart in the same week.
Behind that divide, investors are questioning the debt financing supporting the AI infrastructure boom. Technology and chip stocks came under pressure, with CoreWeave among the hardest hit.
The investment question is getting tougher:
How much will these companies earn, how soon, and what will it cost to finance the buildout?
AI can transform the economy while some AI investments deliver disappointing returns. Both can happen.
Our reading: this divergence is consistent with investors becoming more selective about valuations, debt and earnings. One week alone cannot establish a lasting change in market leadership.
For crypto investors, that deserves attention. A stronger Dow offers limited reassurance to a portfolio concentrated in assets sensitive to risk appetite and financing conditions.
Next week, watch whether technology stabilizes—and whether strength spreads across more sectors.
Would you keep paying a premium for AI growth, or demand clearer evidence of returns?
The Market File | Global Markets
#NasdaqDowWeeklyGapWidestSinceJuly2002
2.5k

·
--
Bearish
#nasdaqdowweeklygapwidestsincejuly2002
🚨 Wall Street’s Widest Weekly Gap Since July 2002 — What Could It Mean for Crypto?
The Nasdaq and Dow Jones are reportedly experiencing their widest weekly gap since July 2002, highlighting an unusual divergence in market behavior.
📊 Why it matters: When major indices diverge sharply, it can signal shifting investor sentiment, changing sector leadership, or rising uncertainty. For crypto traders, this matters because Bitcoin and altcoins often react to broader risk appetite, liquidity expectations, and movements in traditional markets.
🔎 What traders should watch:
Bitcoin (BTC): Look for confirmation through price action, trading volume, and key support and resistance levels.
Altcoins: Monitor relative strength, as weaker risk sentiment can increase volatility across speculative assets.
Market direction: A sustained recovery in equities could support risk assets, while continued weakness may pressure crypto.
Bottom line: This historic market divergence is a signal to stay alert, not an automatic prediction of a crypto crash or rally. Watch how equities close and wait for confirmation before making trading decisions.
#Bitcoin #Nasdaq #DowJones #MarketAnalysis
$STRK $PARTI $CYS
{future}(CYSUSDT)
{future}(PARTIUSDT)
{future}(STRKUSDT)
#nasdaqdowweeklygapwidestsincejuly2002
🚨 Wall Street’s Widest Weekly Gap Since July 2002 — What Could It Mean for Crypto?
The Nasdaq and Dow Jones are reportedly experiencing their widest weekly gap since July 2002, highlighting an unusual divergence in market behavior.
📊 Why it matters: When major indices diverge sharply, it can signal shifting investor sentiment, changing sector leadership, or rising uncertainty. For crypto traders, this matters because Bitcoin and altcoins often react to broader risk appetite, liquidity expectations, and movements in traditional markets.
🔎 What traders should watch:
Bitcoin (BTC): Look for confirmation through price action, trading volume, and key support and resistance levels.
Altcoins: Monitor relative strength, as weaker risk sentiment can increase volatility across speculative assets.
Market direction: A sustained recovery in equities could support risk assets, while continued weakness may pressure crypto.
Bottom line: This historic market divergence is a signal to stay alert, not an automatic prediction of a crypto crash or rally. Watch how equities close and wait for confirmation before making trading decisions.
#Bitcoin #Nasdaq #DowJones #MarketAnalysis
$STRK $PARTI $CYS
🚨 Wall Street’s Widest Weekly Gap Since July 2002 — What Could It Mean for Crypto?
The Nasdaq and Dow Jones are reportedly experiencing their widest weekly gap since July 2002, highlighting an unusual divergence in market behavior.
📊 Why it matters: When major indices diverge sharply, it can signal shifting investor sentiment, changing sector leadership, or rising uncertainty. For crypto traders, this matters because Bitcoin and altcoins often react to broader risk appetite, liquidity expectations, and movements in traditional markets.
🔎 What traders should watch:
Bitcoin (BTC): Look for confirmation through price action, trading volume, and key support and resistance levels.
Altcoins: Monitor relative strength, as weaker risk sentiment can increase volatility across speculative assets.
Market direction: A sustained recovery in equities could support risk assets, while continued weakness may pressure crypto.
Bottom line: This historic market divergence is a signal to stay alert, not an automatic prediction of a crypto crash or rally. Watch how equities close and wait for confirmation before making trading decisions.
#Bitcoin #Nasdaq #DowJones #MarketAnalysis
$STRK $PARTI $CYS
124

·
--
Bullish
#NasdaqDowWeeklyGapWidestSinceJuly2002 📊 Macro Shift: Nasdaq-Dow Gap Hits 24-Year High as Fed Rate Hike Odds Cool
Traditional markets are flashing a historic divergence. What does a 2002-level stock market split and cooling Fed rate expectations mean for digital assets? 🧐
Historic Divergence The Nasdaq Composite fell ~4.48% last week while the Dow Jones rose ~0.68%, marking the widest weekly performance gap between the two indices since July 2002 [2].Sector Rotation Capital is rotating away from high-growth AI and semiconductor stocks due to mounting concerns over massive infrastructure costs and debt financing, moving instead toward defensive value-oriented sectors [6.] Fed Policy Outlook Market pricing indicates October Federal Reserve rate hike odds have dropped to around 15–17%, signaling a potential near-term pause, though longer-term monetary uncertainty remains [6]
📉 Market Impact on Crypto
Risk Sentiment This represents a sector rotation rather than a total exit from risk. However, heightened volatility in tech (with the VIX spiking above 22) can temporarily spill over into crypto as traders reassess risk-on assets [6].
💧 Liquidity Dynamics A potential pause in Fed rate hikes is historically supportive for macro liquidity. If traditional market volatility stabilizes, digital assets may benefit from renewed liquidity expectations, though they remain sensitive to broader equity swings in the short term.
🔍 Narrative Scrutiny Increased scrutiny on AI capital expenditures in traditional finance may also prompt investors to critically evaluate the real-world utility and revenue models of AI-themed crypto projects.
💬 Let’s Discuss Do you view this traditional market divergence as a healthy sector rotation or a warning sign for broader risk assets like crypto? Share your perspective below! 👇
#MacroEconomics #Bitcoin #CryptoMarket #FederalReserve #MarketAnalysis
This is for educational purposes only. Not Financial Advice (NFA). Always Do Your Own Research (DYOR).
{future}(ERAUSDT)
{future}(AVAUSDT)
{future}(SANDUSDT)
#NasdaqDowWeeklyGapWidestSinceJuly2002 📊 Macro Shift: Nasdaq-Dow Gap Hits 24-Year High as Fed Rate Hike Odds Cool
Traditional markets are flashing a historic divergence. What does a 2002-level stock market split and cooling Fed rate expectations mean for digital assets? 🧐
Historic Divergence The Nasdaq Composite fell ~4.48% last week while the Dow Jones rose ~0.68%, marking the widest weekly performance gap between the two indices since July 2002 [2].Sector Rotation Capital is rotating away from high-growth AI and semiconductor stocks due to mounting concerns over massive infrastructure costs and debt financing, moving instead toward defensive value-oriented sectors [6.] Fed Policy Outlook Market pricing indicates October Federal Reserve rate hike odds have dropped to around 15–17%, signaling a potential near-term pause, though longer-term monetary uncertainty remains [6]
📉 Market Impact on Crypto
Risk Sentiment This represents a sector rotation rather than a total exit from risk. However, heightened volatility in tech (with the VIX spiking above 22) can temporarily spill over into crypto as traders reassess risk-on assets [6].
💧 Liquidity Dynamics A potential pause in Fed rate hikes is historically supportive for macro liquidity. If traditional market volatility stabilizes, digital assets may benefit from renewed liquidity expectations, though they remain sensitive to broader equity swings in the short term.
🔍 Narrative Scrutiny Increased scrutiny on AI capital expenditures in traditional finance may also prompt investors to critically evaluate the real-world utility and revenue models of AI-themed crypto projects.
💬 Let’s Discuss Do you view this traditional market divergence as a healthy sector rotation or a warning sign for broader risk assets like crypto? Share your perspective below! 👇
#MacroEconomics #Bitcoin #CryptoMarket #FederalReserve #MarketAnalysis
This is for educational purposes only. Not Financial Advice (NFA). Always Do Your Own Research (DYOR).
Traditional markets are flashing a historic divergence. What does a 2002-level stock market split and cooling Fed rate expectations mean for digital assets? 🧐
Historic Divergence The Nasdaq Composite fell ~4.48% last week while the Dow Jones rose ~0.68%, marking the widest weekly performance gap between the two indices since July 2002 [2].Sector Rotation Capital is rotating away from high-growth AI and semiconductor stocks due to mounting concerns over massive infrastructure costs and debt financing, moving instead toward defensive value-oriented sectors [6.] Fed Policy Outlook Market pricing indicates October Federal Reserve rate hike odds have dropped to around 15–17%, signaling a potential near-term pause, though longer-term monetary uncertainty remains [6]
📉 Market Impact on Crypto
Risk Sentiment This represents a sector rotation rather than a total exit from risk. However, heightened volatility in tech (with the VIX spiking above 22) can temporarily spill over into crypto as traders reassess risk-on assets [6].
💧 Liquidity Dynamics A potential pause in Fed rate hikes is historically supportive for macro liquidity. If traditional market volatility stabilizes, digital assets may benefit from renewed liquidity expectations, though they remain sensitive to broader equity swings in the short term.
🔍 Narrative Scrutiny Increased scrutiny on AI capital expenditures in traditional finance may also prompt investors to critically evaluate the real-world utility and revenue models of AI-themed crypto projects.
💬 Let’s Discuss Do you view this traditional market divergence as a healthy sector rotation or a warning sign for broader risk assets like crypto? Share your perspective below! 👇
#MacroEconomics #Bitcoin #CryptoMarket #FederalReserve #MarketAnalysis
This is for educational purposes only. Not Financial Advice (NFA). Always Do Your Own Research (DYOR).
138

·
--
Bearish
#nasdaqdowweeklygapwidestsincejuly2002
🚨 THE MACRO EQUATION: A 24-YEAR HISTORIC GAP 🚨
A massive capital rotation is shocking Wall Street! Let’s break down the divergence using pure math 🧮👇
(Dow Jones) - (Nasdaq Plunge) = 5.16% Performance Gap 📉
Here is the exact formula:
The Market Output:
(Dow: +0.68%) vs. (Nasdaq: -4.48%) = The widest weekly split since July 2002!
The Rotation Variable:
(Fleeing Tech/AI) ➔ (Safe-Haven Blue Chips) = Sector Rotation 🏢
The Breakdown:
The market just flashed a massive warning. For the first time in 24 years, capital is aggressively dumping tech stocks and rushing into traditional sectors like banking and energy.
Because crypto historically behaves like a high-beta tech asset, this massive rotation is hitting the market hard:
$BTC
{future}(BTCUSDT)
: Absorbing sell pressure as institutional capital flees high-growth markets.
$ETH
{future}(ETHUSDT)
: Facing headwinds as the tech rotation reduces appetite for decentralized networks.
$SOL
{future}(SOLUSDT)
: Highly vulnerable to the Nasdaq bleed as a high-beta tech equivalent.
Will crypto survive the tech sell-off? Let's debate! 👇💬
#Nasdaq #DowJones #CryptoNews
#nasdaqdowweeklygapwidestsincejuly2002
🚨 THE MACRO EQUATION: A 24-YEAR HISTORIC GAP 🚨
A massive capital rotation is shocking Wall Street! Let’s break down the divergence using pure math 🧮👇
(Dow Jones) - (Nasdaq Plunge) = 5.16% Performance Gap 📉
Here is the exact formula:
The Market Output:
(Dow: +0.68%) vs. (Nasdaq: -4.48%) = The widest weekly split since July 2002!
The Rotation Variable:
(Fleeing Tech/AI) ➔ (Safe-Haven Blue Chips) = Sector Rotation 🏢
The Breakdown:
The market just flashed a massive warning. For the first time in 24 years, capital is aggressively dumping tech stocks and rushing into traditional sectors like banking and energy.
Because crypto historically behaves like a high-beta tech asset, this massive rotation is hitting the market hard:
$BTC
: Absorbing sell pressure as institutional capital flees high-growth markets.
$ETH
: Facing headwinds as the tech rotation reduces appetite for decentralized networks.
$SOL
: Highly vulnerable to the Nasdaq bleed as a high-beta tech equivalent.
Will crypto survive the tech sell-off? Let's debate! 👇💬
#Nasdaq #DowJones #CryptoNews
🚨 THE MACRO EQUATION: A 24-YEAR HISTORIC GAP 🚨
A massive capital rotation is shocking Wall Street! Let’s break down the divergence using pure math 🧮👇
(Dow Jones) - (Nasdaq Plunge) = 5.16% Performance Gap 📉
Here is the exact formula:
The Market Output:
(Dow: +0.68%) vs. (Nasdaq: -4.48%) = The widest weekly split since July 2002!
The Rotation Variable:
(Fleeing Tech/AI) ➔ (Safe-Haven Blue Chips) = Sector Rotation 🏢
The Breakdown:
The market just flashed a massive warning. For the first time in 24 years, capital is aggressively dumping tech stocks and rushing into traditional sectors like banking and energy.
Because crypto historically behaves like a high-beta tech asset, this massive rotation is hitting the market hard:
$BTC
: Absorbing sell pressure as institutional capital flees high-growth markets.
$ETH
: Facing headwinds as the tech rotation reduces appetite for decentralized networks.
$SOL
: Highly vulnerable to the Nasdaq bleed as a high-beta tech equivalent.
Will crypto survive the tech sell-off? Let's debate! 👇💬
#Nasdaq #DowJones #CryptoNews
47

·
--
Bullish
#NasdaqDowWeeklyGapWidestSinceJuly2002
The U.S. stock market just sent a major signal. For the week ending October 16, the Nasdaq dropped 4.48%, while the Dow Jones gained 0.68% — their widest weekly performance gap since July 2002. Tech and AI-related stocks faced heavy selling pressure.
🎯 CRYPTO TRADERS: WATCH THIS
🔴 Risk-off signal: If tech weakness spreads and BTC loses support with strong selling volume, downside pressure could increase.
🟢 Recovery signal: If BTC holds support, spot buying strengthens, and price reclaims resistance, recovery may follow.
👀 Keep on your radar: BTC, ETH, Nasdaq direction, Treasury yields and market liquidity.
🔥 PRO MOVE: Don’t assume falling tech stocks automatically mean falling crypto. Wait for BTC to confirm the direction before entering.
One market divergence. Two possible setups. Let price confirm the next move.
$SAND $ERA $ALT
{future}(ALTUSDT)
{future}(ERAUSDT)
{future}(SANDUSDT)
#NasdaqDowWeeklyGapWidestSinceJuly2002
The U.S. stock market just sent a major signal. For the week ending October 16, the Nasdaq dropped 4.48%, while the Dow Jones gained 0.68% — their widest weekly performance gap since July 2002. Tech and AI-related stocks faced heavy selling pressure.
🎯 CRYPTO TRADERS: WATCH THIS
🔴 Risk-off signal: If tech weakness spreads and BTC loses support with strong selling volume, downside pressure could increase.
🟢 Recovery signal: If BTC holds support, spot buying strengthens, and price reclaims resistance, recovery may follow.
👀 Keep on your radar: BTC, ETH, Nasdaq direction, Treasury yields and market liquidity.
🔥 PRO MOVE: Don’t assume falling tech stocks automatically mean falling crypto. Wait for BTC to confirm the direction before entering.
One market divergence. Two possible setups. Let price confirm the next move.
$SAND $ERA $ALT
The U.S. stock market just sent a major signal. For the week ending October 16, the Nasdaq dropped 4.48%, while the Dow Jones gained 0.68% — their widest weekly performance gap since July 2002. Tech and AI-related stocks faced heavy selling pressure.
🎯 CRYPTO TRADERS: WATCH THIS
🔴 Risk-off signal: If tech weakness spreads and BTC loses support with strong selling volume, downside pressure could increase.
🟢 Recovery signal: If BTC holds support, spot buying strengthens, and price reclaims resistance, recovery may follow.
👀 Keep on your radar: BTC, ETH, Nasdaq direction, Treasury yields and market liquidity.
🔥 PRO MOVE: Don’t assume falling tech stocks automatically mean falling crypto. Wait for BTC to confirm the direction before entering.
One market divergence. Two possible setups. Let price confirm the next move.
$SAND $ERA $ALT
190

·
--
📊 Nasdaq vs Dow: The Widest Weekly Gap Since July 2002 #NasdaqDowWeeklyGapWidestSinceJuly2002
Wall Street just flashed a signal we haven't seen in over two decades. The weekly performance gap between the Nasdaq and the Dow is the widest since July 2002.
What it tells us:
🔀 Money is moving unevenly. Tech and blue-chip stocks are going in different directions.
🔄 Sector rotation is in play, and investors are repositioning.
⚡ Big gaps like this usually mean volatility is rising.
Why crypto traders should care: Crypto often reacts to risk sentiment in traditional markets, especially tech. If equities get shaky, expect it to spill over into BTC and altcoins.
⚠️ Rare signals don't guarantee what happens next. Manage your risk.
Are you watching tech or the Dow for direction? 👇
Not financial advice. DYOR.
#NasdaqDowWeeklyGapWidestSinceJuly2002 #Nasdaq #Dow #Bitcoin #BinanceSquare $BNB $BTC
{spot}(BTCUSDT)
{spot}(BNBUSDT)
📊 Nasdaq vs Dow: The Widest Weekly Gap Since July 2002 #NasdaqDowWeeklyGapWidestSinceJuly2002
Wall Street just flashed a signal we haven't seen in over two decades. The weekly performance gap between the Nasdaq and the Dow is the widest since July 2002.
What it tells us:
🔀 Money is moving unevenly. Tech and blue-chip stocks are going in different directions.
🔄 Sector rotation is in play, and investors are repositioning.
⚡ Big gaps like this usually mean volatility is rising.
Why crypto traders should care: Crypto often reacts to risk sentiment in traditional markets, especially tech. If equities get shaky, expect it to spill over into BTC and altcoins.
⚠️ Rare signals don't guarantee what happens next. Manage your risk.
Are you watching tech or the Dow for direction? 👇
Not financial advice. DYOR.
#NasdaqDowWeeklyGapWidestSinceJuly2002 #Nasdaq #Dow #Bitcoin #BinanceSquare $BNB $BTC
Wall Street just flashed a signal we haven't seen in over two decades. The weekly performance gap between the Nasdaq and the Dow is the widest since July 2002.
What it tells us:
🔀 Money is moving unevenly. Tech and blue-chip stocks are going in different directions.
🔄 Sector rotation is in play, and investors are repositioning.
⚡ Big gaps like this usually mean volatility is rising.
Why crypto traders should care: Crypto often reacts to risk sentiment in traditional markets, especially tech. If equities get shaky, expect it to spill over into BTC and altcoins.
⚠️ Rare signals don't guarantee what happens next. Manage your risk.
Are you watching tech or the Dow for direction? 👇
Not financial advice. DYOR.
#NasdaqDowWeeklyGapWidestSinceJuly2002 #Nasdaq #Dow #Bitcoin #BinanceSquare $BNB $BTC
95

·
--
Bullish
Verified
#NasdaqDowWeeklyGapWidestSinceJuly2002
🚨 Wall Street just had its most lopsided week since 2002.
The $QQQ fell 4.48% while the $DOW.US
rose 0.68%. That’s the widest weekly gap between the two since July 2002.
📉 Chip stocks took the worst of it. The Philadelphia Semiconductor Index lost 11.4% on the week as worries about AI returns and higher oil prices hit tech.
🔄 Money is leaving tech and moving into older, more defensive stocks. Crypto often reacts when risk appetite shifts.
👀 What to watch: whether the tech selloff spills into crypto, or whether $BTC holds its $80K support.
Are you watching tech for the next move in crypto? 👇
Not financial advice.
{future}(QQQUSDT)
{stock_us}(DOW.US)
#NasdaqDowWeeklyGapWidestSinceJuly2002
🚨 Wall Street just had its most lopsided week since 2002.
The $QQQ fell 4.48% while the $DOW.US
rose 0.68%. That’s the widest weekly gap between the two since July 2002.
📉 Chip stocks took the worst of it. The Philadelphia Semiconductor Index lost 11.4% on the week as worries about AI returns and higher oil prices hit tech.
🔄 Money is leaving tech and moving into older, more defensive stocks. Crypto often reacts when risk appetite shifts.
👀 What to watch: whether the tech selloff spills into crypto, or whether $BTC holds its $80K support.
Are you watching tech for the next move in crypto? 👇
Not financial advice.
🚨 Wall Street just had its most lopsided week since 2002.
The $QQQ fell 4.48% while the $DOW.US
rose 0.68%. That’s the widest weekly gap between the two since July 2002.
📉 Chip stocks took the worst of it. The Philadelphia Semiconductor Index lost 11.4% on the week as worries about AI returns and higher oil prices hit tech.
🔄 Money is leaving tech and moving into older, more defensive stocks. Crypto often reacts when risk appetite shifts.
👀 What to watch: whether the tech selloff spills into crypto, or whether $BTC holds its $80K support.
Are you watching tech for the next move in crypto? 👇
Not financial advice.
1
677
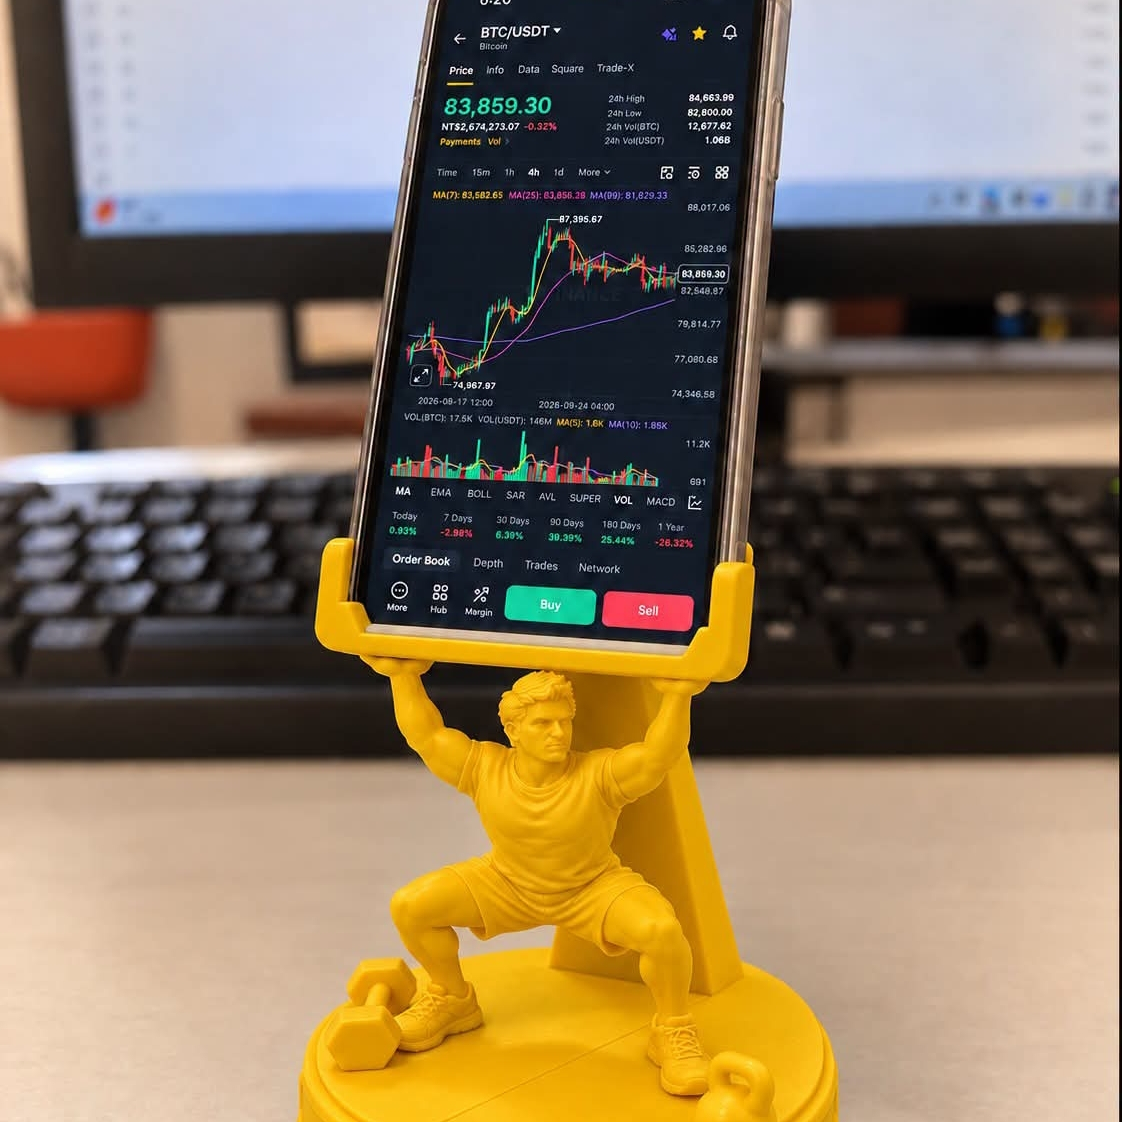
#NasdaqDowWeeklyGapWidestSinceJuly2002
🚨🚨 BREAKING: Nasdaq-Dow Weekly Gap Widest Since July 2002!
Nasdaq 100: -4.48% this week 📉
Dow Jones: +0.68% this week 📈
Total Spread: 5.16% — Biggest divergence in 23 YEARS!
This is a classic rotation — money fleeing high-beta tech (NVDA, TSLA, AMD getting crushed) and moving into defensive value stocks.
Last time this gap was this wide? July 2002 — dot-com bust era.
Is history repeating?
#Nasdaq100Falls5.5%InWorstWeekIn18Months $QQQ $DIA
#NasdaqDowWeeklyGapWidestSinceJuly2002
🚨🚨 BREAKING: Nasdaq-Dow Weekly Gap Widest Since July 2002!
Nasdaq 100: -4.48% this week 📉
Dow Jones: +0.68% this week 📈
Total Spread: 5.16% — Biggest divergence in 23 YEARS!
This is a classic rotation — money fleeing high-beta tech (NVDA, TSLA, AMD getting crushed) and moving into defensive value stocks.
Last time this gap was this wide? July 2002 — dot-com bust era.
Is history repeating?
#Nasdaq100Falls5.5%InWorstWeekIn18Months $QQQ $DIA
🚨🚨 BREAKING: Nasdaq-Dow Weekly Gap Widest Since July 2002!
Nasdaq 100: -4.48% this week 📉
Dow Jones: +0.68% this week 📈
Total Spread: 5.16% — Biggest divergence in 23 YEARS!
This is a classic rotation — money fleeing high-beta tech (NVDA, TSLA, AMD getting crushed) and moving into defensive value stocks.
Last time this gap was this wide? July 2002 — dot-com bust era.
Is history repeating?
#Nasdaq100Falls5.5%InWorstWeekIn18Months $QQQ $DIA
1
3
80

·
--
Bullish
#nasdaqdowweeklygapwidestsincejuly2002
🚨 WALL STREET RED FLAG: TECH IS BLEEDING, BLUE CHIPS ARE HOLDING. 🚨
We just witnessed something that hasn't happened in 24 YEARS:
$NEAR
{future}(NEARUSDT)
📉 Nasdaq Composite: -4.48%
🔻 Nasdaq-100: -5.50%
🟢 Dow Jones: +0.68%
That’s a >5% weekly performance gap—the widest divergence between tech and legacy stocks since July 2002.
🔥 THE TAKEAWAY:
1️⃣ Great Tech Rotation: Capital is fleeing high-valuation Tech/AI growth stocks and rushing into safe-haven Blue-Chips.
2️⃣ Crypto Risk-Off Alert: When tech dumps, liquidity usually tightens across all risk assets (including $BTC and $ETH).
3️⃣ Decoupling Watch: Can Crypto hold its ground, or will the TradFi selloff spill over into digital assets next?
$INJ
{future}(INJUSDT)
👇 VOTE BELOW:
🔴 A) Healthy tech correction before new ATHs
🔵 B) Start of a broader macro risk-off dump
$FIL
{future}(FILUSDT)
#NASDAQ #Nasdaq100Falls5.5%InWorstWeekIn18Months #StrategySharesFall9%OnFriday #USPPIRises6.3%YearOverYear
#nasdaqdowweeklygapwidestsincejuly2002
🚨 WALL STREET RED FLAG: TECH IS BLEEDING, BLUE CHIPS ARE HOLDING. 🚨
We just witnessed something that hasn't happened in 24 YEARS:
$NEAR
📉 Nasdaq Composite: -4.48%
🔻 Nasdaq-100: -5.50%
🟢 Dow Jones: +0.68%
That’s a >5% weekly performance gap—the widest divergence between tech and legacy stocks since July 2002.
🔥 THE TAKEAWAY:
1️⃣ Great Tech Rotation: Capital is fleeing high-valuation Tech/AI growth stocks and rushing into safe-haven Blue-Chips.
2️⃣ Crypto Risk-Off Alert: When tech dumps, liquidity usually tightens across all risk assets (including $BTC and $ETH).
3️⃣ Decoupling Watch: Can Crypto hold its ground, or will the TradFi selloff spill over into digital assets next?
$INJ
👇 VOTE BELOW:
🔴 A) Healthy tech correction before new ATHs
🔵 B) Start of a broader macro risk-off dump
$FIL
#NASDAQ #Nasdaq100Falls5.5%InWorstWeekIn18Months #StrategySharesFall9%OnFriday #USPPIRises6.3%YearOverYear
🚨 WALL STREET RED FLAG: TECH IS BLEEDING, BLUE CHIPS ARE HOLDING. 🚨
We just witnessed something that hasn't happened in 24 YEARS:
$NEAR
📉 Nasdaq Composite: -4.48%
🔻 Nasdaq-100: -5.50%
🟢 Dow Jones: +0.68%
That’s a >5% weekly performance gap—the widest divergence between tech and legacy stocks since July 2002.
🔥 THE TAKEAWAY:
1️⃣ Great Tech Rotation: Capital is fleeing high-valuation Tech/AI growth stocks and rushing into safe-haven Blue-Chips.
2️⃣ Crypto Risk-Off Alert: When tech dumps, liquidity usually tightens across all risk assets (including $BTC and $ETH).
3️⃣ Decoupling Watch: Can Crypto hold its ground, or will the TradFi selloff spill over into digital assets next?
$INJ
👇 VOTE BELOW:
🔴 A) Healthy tech correction before new ATHs
🔵 B) Start of a broader macro risk-off dump
$FIL
#NASDAQ #Nasdaq100Falls5.5%InWorstWeekIn18Months #StrategySharesFall9%OnFriday #USPPIRises6.3%YearOverYear
2
841

·
--
#NasdaqDowWeeklyGapWidestSinceJuly2002
📉 This week the Dow posted a modest gain of ~0.7%, while the Nasdaq declined approximately 4.5% — the widest weekly performance gap between the two indices since July 2002.
The move reflects a clear rotation from mega-cap tech and AI-related stocks into broader market and value sectors.
Such rare divergences often signal a shift in market leadership or rising caution. After an extended AI-driven rally, tech’s relative strength is being tested. For crypto markets, this may translate into near-term risk-off pressure, though meaningful rotations can later present selective opportunities. Monitoring Nasdaq stability will be key. NFA.
#Stocks #Nasdaq #Dow #MarketRotation #Crypto #BinanceSquare
#NasdaqDowWeeklyGapWidestSinceJuly2002
📉 This week the Dow posted a modest gain of ~0.7%, while the Nasdaq declined approximately 4.5% — the widest weekly performance gap between the two indices since July 2002.
The move reflects a clear rotation from mega-cap tech and AI-related stocks into broader market and value sectors.
Such rare divergences often signal a shift in market leadership or rising caution. After an extended AI-driven rally, tech’s relative strength is being tested. For crypto markets, this may translate into near-term risk-off pressure, though meaningful rotations can later present selective opportunities. Monitoring Nasdaq stability will be key. NFA.
#Stocks #Nasdaq #Dow #MarketRotation #Crypto #BinanceSquare
📉 This week the Dow posted a modest gain of ~0.7%, while the Nasdaq declined approximately 4.5% — the widest weekly performance gap between the two indices since July 2002.
The move reflects a clear rotation from mega-cap tech and AI-related stocks into broader market and value sectors.
Such rare divergences often signal a shift in market leadership or rising caution. After an extended AI-driven rally, tech’s relative strength is being tested. For crypto markets, this may translate into near-term risk-off pressure, though meaningful rotations can later present selective opportunities. Monitoring Nasdaq stability will be key. NFA.
#Stocks #Nasdaq #Dow #MarketRotation #Crypto #BinanceSquare
1
56

·
--
#NasdaqDowWeeklyGapWidestSinceJuly2002
History repeats itself — where are traders headed?
A stunning divergence just unfolded! The weekly performance gap between Nasdaq and Dow widened to a record — the widest since July 2002 (Dot-com era). While traditional sectors and banks held up the Dow, the Nasdaq took a 5.5% beating amid AI infrastructure debt worries and Brent crude surging past $110.
Traditional money is fleeing for safe havens — but crypto is different. Bitcoin remains resilient, holding firmly around $80K. A powerful testament to its status as an independent asset.
What should traders do?
Opportunity lies where panic strikes. Get your funds ready to snap up quality assets at bargain prices.
Not financial advice.
Click below to trade and support me:
$BTC · 81,659.82 · -0.71%
$DIA · 0.1623 · -3.16%
$QQQB · 711.87 · -2.25%
#MarketDivergence #TechCrash #CryptoVsStocks #BinanceTrading
#NasdaqDowWeeklyGapWidestSinceJuly2002
History repeats itself — where are traders headed?
A stunning divergence just unfolded! The weekly performance gap between Nasdaq and Dow widened to a record — the widest since July 2002 (Dot-com era). While traditional sectors and banks held up the Dow, the Nasdaq took a 5.5% beating amid AI infrastructure debt worries and Brent crude surging past $110.
Traditional money is fleeing for safe havens — but crypto is different. Bitcoin remains resilient, holding firmly around $80K. A powerful testament to its status as an independent asset.
What should traders do?
Opportunity lies where panic strikes. Get your funds ready to snap up quality assets at bargain prices.
Not financial advice.
Click below to trade and support me:
$BTC · 81,659.82 · -0.71%
$DIA · 0.1623 · -3.16%
$QQQB · 711.87 · -2.25%
#MarketDivergence #TechCrash #CryptoVsStocks #BinanceTrading
History repeats itself — where are traders headed?
A stunning divergence just unfolded! The weekly performance gap between Nasdaq and Dow widened to a record — the widest since July 2002 (Dot-com era). While traditional sectors and banks held up the Dow, the Nasdaq took a 5.5% beating amid AI infrastructure debt worries and Brent crude surging past $110.
Traditional money is fleeing for safe havens — but crypto is different. Bitcoin remains resilient, holding firmly around $80K. A powerful testament to its status as an independent asset.
What should traders do?
Opportunity lies where panic strikes. Get your funds ready to snap up quality assets at bargain prices.
Not financial advice.
Click below to trade and support me:
$BTC · 81,659.82 · -0.71%
$DIA · 0.1623 · -3.16%
$QQQB · 711.87 · -2.25%
#MarketDivergence #TechCrash #CryptoVsStocks #BinanceTrading
1
55

·
--
#NasdaqDowWeeklyGapWidestSinceJuly2002
🔀 Dow Up, Nasdaq Down: The Biggest Split in 24 Years
📅 Week ended Oct 16: the Dow rose 0.7% to 52,002 while the Nasdaq fell 4.5% to 26,140.
📊 That roughly 5-point gap is the widest weekly Dow vs Nasdaq split since July 2002.
📉 S&P 500 lost about 2% to 7,659; the VanEck chip ETF dropped 10%, its worst week since April 2025.
⚠️ CoreWeave led the rout, down about 25% on the week as its debt reached $51B.
🔍 Money rotated out of debt-funded AI names and into blue chips; VIX topped 22 for the first time since June.
What it means for crypto: $BTC held near $81.7K through the selloff, but rotation away from high-beta assets is usually a headwind, not a tailwind. The Fed decision on Oct 27–28 is the next big test.
Is this a healthy rotation or the start of a broader risk-off? 👇
$BTC $ETH
#NasdaqDowWeeklyGapWidestSinceJuly2002 #CryptoNews #Macro #Stocks
#NasdaqDowWeeklyGapWidestSinceJuly2002
🔀 Dow Up, Nasdaq Down: The Biggest Split in 24 Years
📅 Week ended Oct 16: the Dow rose 0.7% to 52,002 while the Nasdaq fell 4.5% to 26,140.
📊 That roughly 5-point gap is the widest weekly Dow vs Nasdaq split since July 2002.
📉 S&P 500 lost about 2% to 7,659; the VanEck chip ETF dropped 10%, its worst week since April 2025.
⚠️ CoreWeave led the rout, down about 25% on the week as its debt reached $51B.
🔍 Money rotated out of debt-funded AI names and into blue chips; VIX topped 22 for the first time since June.
What it means for crypto: $BTC held near $81.7K through the selloff, but rotation away from high-beta assets is usually a headwind, not a tailwind. The Fed decision on Oct 27–28 is the next big test.
Is this a healthy rotation or the start of a broader risk-off? 👇
$BTC $ETH
#NasdaqDowWeeklyGapWidestSinceJuly2002 #CryptoNews #Macro #Stocks
🔀 Dow Up, Nasdaq Down: The Biggest Split in 24 Years
📅 Week ended Oct 16: the Dow rose 0.7% to 52,002 while the Nasdaq fell 4.5% to 26,140.
📊 That roughly 5-point gap is the widest weekly Dow vs Nasdaq split since July 2002.
📉 S&P 500 lost about 2% to 7,659; the VanEck chip ETF dropped 10%, its worst week since April 2025.
⚠️ CoreWeave led the rout, down about 25% on the week as its debt reached $51B.
🔍 Money rotated out of debt-funded AI names and into blue chips; VIX topped 22 for the first time since June.
What it means for crypto: $BTC held near $81.7K through the selloff, but rotation away from high-beta assets is usually a headwind, not a tailwind. The Fed decision on Oct 27–28 is the next big test.
Is this a healthy rotation or the start of a broader risk-off? 👇
$BTC $ETH
#NasdaqDowWeeklyGapWidestSinceJuly2002 #CryptoNews #Macro #Stocks
38

·
--
Bullish
#NasdaqDowWeeklyGapWidestSinceJuly2002
🚨 WALL STREET’S BIGGEST NASDAQ–DOW GAP SINCE 2002?
📉 A historic market divergence is grabbing attention!
The US stock market just delivered a striking split:
🔴 Nasdaq Composite: Down approximately 4.5% for the week
🟢 Dow Jones: Up approximately 0.7% for the week
📊 S&P 500: Lost around 1.9%
Source: October 16, 2026, weekly market data. [1]
🔥 What’s driving the gap?
• AI-related stocks face growing concerns about debt and profitability. • Semiconductor stocks are under heavy selling pressure. • Hotter inflation data is raising concerns about interest rates. • Investors are rotating toward more defensive sectors.
💡 Why it matters: The divergence suggests that investors are becoming more selective rather than selling every part of the market equally. The next earnings reports and Federal Reserve signals co Amiuld influence whether this gap widens or narrows.
⚠️ Market outlook: Cautious for technology stocks in the near term, but one difficult week does not confirm a long-term bearish trend.
👇 Your view: Will tech stocks recover, or is more downside ahead?
#Nasdaq #DowJones #StockMarket #AIStocks #WallStreet #MarketNews #Inflation #Investing
$TIA $PUMP $JPMB
{spot}(PUMPUSDT)
{spot}(TIAUSDT)
{spot}(JPMBUSDT)
#NasdaqDowWeeklyGapWidestSinceJuly2002
🚨 WALL STREET’S BIGGEST NASDAQ–DOW GAP SINCE 2002?
📉 A historic market divergence is grabbing attention!
The US stock market just delivered a striking split:
🔴 Nasdaq Composite: Down approximately 4.5% for the week
🟢 Dow Jones: Up approximately 0.7% for the week
📊 S&P 500: Lost around 1.9%
Source: October 16, 2026, weekly market data. [1]
🔥 What’s driving the gap?
• AI-related stocks face growing concerns about debt and profitability. • Semiconductor stocks are under heavy selling pressure. • Hotter inflation data is raising concerns about interest rates. • Investors are rotating toward more defensive sectors.
💡 Why it matters: The divergence suggests that investors are becoming more selective rather than selling every part of the market equally. The next earnings reports and Federal Reserve signals co Amiuld influence whether this gap widens or narrows.
⚠️ Market outlook: Cautious for technology stocks in the near term, but one difficult week does not confirm a long-term bearish trend.
👇 Your view: Will tech stocks recover, or is more downside ahead?
#Nasdaq #DowJones #StockMarket #AIStocks #WallStreet #MarketNews #Inflation #Investing
$TIA $PUMP $JPMB
🚨 WALL STREET’S BIGGEST NASDAQ–DOW GAP SINCE 2002?
📉 A historic market divergence is grabbing attention!
The US stock market just delivered a striking split:
🔴 Nasdaq Composite: Down approximately 4.5% for the week
🟢 Dow Jones: Up approximately 0.7% for the week
📊 S&P 500: Lost around 1.9%
Source: October 16, 2026, weekly market data. [1]
🔥 What’s driving the gap?
• AI-related stocks face growing concerns about debt and profitability. • Semiconductor stocks are under heavy selling pressure. • Hotter inflation data is raising concerns about interest rates. • Investors are rotating toward more defensive sectors.
💡 Why it matters: The divergence suggests that investors are becoming more selective rather than selling every part of the market equally. The next earnings reports and Federal Reserve signals co Amiuld influence whether this gap widens or narrows.
⚠️ Market outlook: Cautious for technology stocks in the near term, but one difficult week does not confirm a long-term bearish trend.
👇 Your view: Will tech stocks recover, or is more downside ahead?
#Nasdaq #DowJones #StockMarket #AIStocks #WallStreet #MarketNews #Inflation #Investing
$TIA $PUMP $JPMB
1
234

·
--
$BTC
{spot}(BTCUSDT)
Crypto market alert! 📊
The Nasdaq–Dow weekly gap is reportedly the widest since July 2002. Could this signal a shift in market sentiment and impact Bitcoin and the broader crypto market? ₿
Stay alert. Watch the trends. Trade responsibly! ⚡
#NasdaqDowWeeklyGapWidestSinceJuly2002 #Bitcoin #BTC #Crypto #BinanceSquare
$BTC
Crypto market alert! 📊
The Nasdaq–Dow weekly gap is reportedly the widest since July 2002. Could this signal a shift in market sentiment and impact Bitcoin and the broader crypto market? ₿
Stay alert. Watch the trends. Trade responsibly! ⚡
#NasdaqDowWeeklyGapWidestSinceJuly2002 #Bitcoin #BTC #Crypto #BinanceSquare
Crypto market alert! 📊
The Nasdaq–Dow weekly gap is reportedly the widest since July 2002. Could this signal a shift in market sentiment and impact Bitcoin and the broader crypto market? ₿
Stay alert. Watch the trends. Trade responsibly! ⚡
#NasdaqDowWeeklyGapWidestSinceJuly2002 #Bitcoin #BTC #Crypto #BinanceSquare
1
150

#NasdaqDowWeeklyGapWidestSinceJuly2002
🚨 is a WARNING for Crypto* 🚨
History repeated.
Nasdaq: *-4.5%*
Dow: *+0.7%*
This 5.15% divergence is the *widest weekly gap since July 2002*. That's 24 years!
Last time we saw this gap? Right before the dot-com bubble popped.
*What's crashing Wall Street?*
Chip bloodbath: Semiconductor index -11.4% this week, 8 straight red days. $NVDA $AMD bleeding.
AI debt panic: CoreWeave -25% this week, $51 BILLION in debt. Who pays for AI?
Money is fleeing high-growth tech to old-economy stocks. Dow finished green while tech crashed.
Tech bleeds first, then crypto feels it.
If AI leaders can't hold, altcoins won't either.
I'm derisking and waiting. Are you buying this dip or holding cash?
#DowJones #crypto #BitcoinDunyamiz #StockMarket
#NasdaqDowWeeklyGapWidestSinceJuly2002
🚨 is a WARNING for Crypto* 🚨
History repeated.
Nasdaq: *-4.5%*
Dow: *+0.7%*
This 5.15% divergence is the *widest weekly gap since July 2002*. That's 24 years!
Last time we saw this gap? Right before the dot-com bubble popped.
*What's crashing Wall Street?*
Chip bloodbath: Semiconductor index -11.4% this week, 8 straight red days. $NVDA $AMD bleeding.
AI debt panic: CoreWeave -25% this week, $51 BILLION in debt. Who pays for AI?
Money is fleeing high-growth tech to old-economy stocks. Dow finished green while tech crashed.
Tech bleeds first, then crypto feels it.
If AI leaders can't hold, altcoins won't either.
I'm derisking and waiting. Are you buying this dip or holding cash?
#DowJones #crypto #BitcoinDunyamiz #StockMarket
🚨 is a WARNING for Crypto* 🚨
History repeated.
Nasdaq: *-4.5%*
Dow: *+0.7%*
This 5.15% divergence is the *widest weekly gap since July 2002*. That's 24 years!
Last time we saw this gap? Right before the dot-com bubble popped.
*What's crashing Wall Street?*
Chip bloodbath: Semiconductor index -11.4% this week, 8 straight red days. $NVDA $AMD bleeding.
AI debt panic: CoreWeave -25% this week, $51 BILLION in debt. Who pays for AI?
Money is fleeing high-growth tech to old-economy stocks. Dow finished green while tech crashed.
Tech bleeds first, then crypto feels it.
If AI leaders can't hold, altcoins won't either.
I'm derisking and waiting. Are you buying this dip or holding cash?
#DowJones #crypto #BitcoinDunyamiz #StockMarket
Bandook:
done
5
2
110

·
--
🚨 NASDAQ CRASHES 4.5% WHILE THE DOW RISES — SOMETHING BIG IS HAPPENING ON WALL STREET! 📉🔥
The Nasdaq and Dow just recorded their widest weekly performance gap since July 2002! 👀
📊 THIS WEEK'S NUMBERS:
🔴 Nasdaq: -4.5%
🟢 Dow Jones: +0.7%
🔴 S&P 500: -1.9%
That's a massive 5.2 percentage-point gap!
And it tells us one thing: Money is rotating OUT of tech.
AI stocks and semiconductors are getting hammered as investors question whether massive AI spending can deliver real profits.
💥 HERE'S WHAT TRADERS SHOULD WATCH:
🐻 Bearish: Tech selling continues → Nasdaq weakens → $BTC and $ETH could face more pressure.
🐂 Bullish: Buyers return to beaten-down AI stocks → Nasdaq rebounds → Risk appetite improves.
🥇 $XAU: Worth watching if investors continue seeking safer assets.
⚠️ THE REAL QUESTION:
Is this just a healthy rotation out of overpriced tech, or the beginning of a bigger market correction?
👇 WHAT'S YOUR NEXT MOVE?
📉 SHORT NASDAQ?
🟠 BUY THE $BTC DIP?
🥇 LONG $XAU?
IS WALL STREET FLASHING A WARNING SIGN? 👀
#nasdaqdowweeklygapwidestsincejuly2002 #CelestiaRises16%To2026High #Nasdaq100Falls5.5%InWorstWeekIn18Months #StrategySharesFall9%OnFriday #USPPIRises6.3%YearOverYear
🚨 NASDAQ CRASHES 4.5% WHILE THE DOW RISES — SOMETHING BIG IS HAPPENING ON WALL STREET! 📉🔥
The Nasdaq and Dow just recorded their widest weekly performance gap since July 2002! 👀
📊 THIS WEEK'S NUMBERS:
🔴 Nasdaq: -4.5%
🟢 Dow Jones: +0.7%
🔴 S&P 500: -1.9%
That's a massive 5.2 percentage-point gap!
And it tells us one thing: Money is rotating OUT of tech.
AI stocks and semiconductors are getting hammered as investors question whether massive AI spending can deliver real profits.
💥 HERE'S WHAT TRADERS SHOULD WATCH:
🐻 Bearish: Tech selling continues → Nasdaq weakens → $BTC and $ETH could face more pressure.
🐂 Bullish: Buyers return to beaten-down AI stocks → Nasdaq rebounds → Risk appetite improves.
🥇 $XAU: Worth watching if investors continue seeking safer assets.
⚠️ THE REAL QUESTION:
Is this just a healthy rotation out of overpriced tech, or the beginning of a bigger market correction?
👇 WHAT'S YOUR NEXT MOVE?
📉 SHORT NASDAQ?
🟠 BUY THE $BTC DIP?
🥇 LONG $XAU?
IS WALL STREET FLASHING A WARNING SIGN? 👀
#nasdaqdowweeklygapwidestsincejuly2002 #CelestiaRises16%To2026High #Nasdaq100Falls5.5%InWorstWeekIn18Months #StrategySharesFall9%OnFriday #USPPIRises6.3%YearOverYear
The Nasdaq and Dow just recorded their widest weekly performance gap since July 2002! 👀
📊 THIS WEEK'S NUMBERS:
🔴 Nasdaq: -4.5%
🟢 Dow Jones: +0.7%
🔴 S&P 500: -1.9%
That's a massive 5.2 percentage-point gap!
And it tells us one thing: Money is rotating OUT of tech.
AI stocks and semiconductors are getting hammered as investors question whether massive AI spending can deliver real profits.
💥 HERE'S WHAT TRADERS SHOULD WATCH:
🐻 Bearish: Tech selling continues → Nasdaq weakens → $BTC and $ETH could face more pressure.
🐂 Bullish: Buyers return to beaten-down AI stocks → Nasdaq rebounds → Risk appetite improves.
🥇 $XAU: Worth watching if investors continue seeking safer assets.
⚠️ THE REAL QUESTION:
Is this just a healthy rotation out of overpriced tech, or the beginning of a bigger market correction?
👇 WHAT'S YOUR NEXT MOVE?
📉 SHORT NASDAQ?
🟠 BUY THE $BTC DIP?
🥇 LONG $XAU?
IS WALL STREET FLASHING A WARNING SIGN? 👀
#nasdaqdowweeklygapwidestsincejuly2002 #CelestiaRises16%To2026High #Nasdaq100Falls5.5%InWorstWeekIn18Months #StrategySharesFall9%OnFriday #USPPIRises6.3%YearOverYear
francotraderr:
sigueme y te sigo
1
959

·
--
Partly True
#nasdaqdowweeklygapwidestsincejuly2002
A major structural rotation shook Wall Street as the tech-heavy Nasdaq Composite dropped 4.48% while the value-oriented Dow Jones Industrial Average gained 0.68% on the week. The 5.16 percentage point performance spread marks the widest weekly divergence between the two U.S. stock benchmarks since July 2002. Growing concerns over corporate returns on artificial intelligence hardware investments, coupled with elevated energy prices, triggered heavy capital outflows from tech high-beta assets into defensive, traditional dividend sectors.
Market Analysis & Cross-Asset Implications
A multi-decade divergence gap signals capital re-allocation between equity sectors rather than outright capital flight from global financial markets.
As institutional portfolios rotate away from stretched tech valuations toward traditional value sectors, crypto assets display a strong correlation with high-beta tech equities. Macro desks are closely monitoring whether liquidity tightening in tech stocks spills over into digital assets or if Bitcoin can establish independent store-of-value decoupling.
Highlighted Tradeable Assets (High-Beta & Benchmark Exposure):
$BTC (Bitcoin): Core digital macro proxy; evaluating correlation with Nasdaq tech risk sentiment and liquidity retention above key support floors.
Current Spot Price: ~$83,100
$ETH (Ethereum): Benchmark smart-contract protocol; tracking spot capital flows, derivative liquidations, and broader risk asset rotation elasticity.
Current Spot Price: ~$2,420
$SOL (Solana): High-beta Layer-1 execution asset; observing risk-off sentiment shifts and momentum retention across decentralized venues.
Current Spot Price: ~$111.50
Share your analysis in the comments below! 👇
{spot}(BTCUSDT)
{spot}(ETHUSDT)
{spot}(SOLUSDT)
#NASDAQ #DowJones #stockmarket #MarketAnalysis
#nasdaqdowweeklygapwidestsincejuly2002
A major structural rotation shook Wall Street as the tech-heavy Nasdaq Composite dropped 4.48% while the value-oriented Dow Jones Industrial Average gained 0.68% on the week. The 5.16 percentage point performance spread marks the widest weekly divergence between the two U.S. stock benchmarks since July 2002. Growing concerns over corporate returns on artificial intelligence hardware investments, coupled with elevated energy prices, triggered heavy capital outflows from tech high-beta assets into defensive, traditional dividend sectors.
Market Analysis & Cross-Asset Implications
A multi-decade divergence gap signals capital re-allocation between equity sectors rather than outright capital flight from global financial markets.
As institutional portfolios rotate away from stretched tech valuations toward traditional value sectors, crypto assets display a strong correlation with high-beta tech equities. Macro desks are closely monitoring whether liquidity tightening in tech stocks spills over into digital assets or if Bitcoin can establish independent store-of-value decoupling.
Highlighted Tradeable Assets (High-Beta & Benchmark Exposure):
$BTC (Bitcoin): Core digital macro proxy; evaluating correlation with Nasdaq tech risk sentiment and liquidity retention above key support floors.
Current Spot Price: ~$83,100
$ETH (Ethereum): Benchmark smart-contract protocol; tracking spot capital flows, derivative liquidations, and broader risk asset rotation elasticity.
Current Spot Price: ~$2,420
$SOL (Solana): High-beta Layer-1 execution asset; observing risk-off sentiment shifts and momentum retention across decentralized venues.
Current Spot Price: ~$111.50
Share your analysis in the comments below! 👇
#NASDAQ #DowJones #stockmarket #MarketAnalysis
A major structural rotation shook Wall Street as the tech-heavy Nasdaq Composite dropped 4.48% while the value-oriented Dow Jones Industrial Average gained 0.68% on the week. The 5.16 percentage point performance spread marks the widest weekly divergence between the two U.S. stock benchmarks since July 2002. Growing concerns over corporate returns on artificial intelligence hardware investments, coupled with elevated energy prices, triggered heavy capital outflows from tech high-beta assets into defensive, traditional dividend sectors.
Market Analysis & Cross-Asset Implications
A multi-decade divergence gap signals capital re-allocation between equity sectors rather than outright capital flight from global financial markets.
As institutional portfolios rotate away from stretched tech valuations toward traditional value sectors, crypto assets display a strong correlation with high-beta tech equities. Macro desks are closely monitoring whether liquidity tightening in tech stocks spills over into digital assets or if Bitcoin can establish independent store-of-value decoupling.
Highlighted Tradeable Assets (High-Beta & Benchmark Exposure):
$BTC (Bitcoin): Core digital macro proxy; evaluating correlation with Nasdaq tech risk sentiment and liquidity retention above key support floors.
Current Spot Price: ~$83,100
$ETH (Ethereum): Benchmark smart-contract protocol; tracking spot capital flows, derivative liquidations, and broader risk asset rotation elasticity.
Current Spot Price: ~$2,420
$SOL (Solana): High-beta Layer-1 execution asset; observing risk-off sentiment shifts and momentum retention across decentralized venues.
Current Spot Price: ~$111.50
Share your analysis in the comments below! 👇
#NASDAQ #DowJones #stockmarket #MarketAnalysis
1
2.1k

·
--
#NasdaqDowWeeklyGapWidestSinceJuly2002
This is the widest weekly gap between Nasdaq and Dow since July 2002.
After 20+ years watching markets, these kinds of divergences usually signal something important is shifting under the surface — either risk appetite is splitting hard or capital is rotating aggressively.
Worth paying close attention to how this resolves over the next few weeks.
#NasdaqDowWeeklyGapWidestSinceJuly2002
This is the widest weekly gap between Nasdaq and Dow since July 2002.
After 20+ years watching markets, these kinds of divergences usually signal something important is shifting under the surface — either risk appetite is splitting hard or capital is rotating aggressively.
Worth paying close attention to how this resolves over the next few weeks.
This is the widest weekly gap between Nasdaq and Dow since July 2002.
After 20+ years watching markets, these kinds of divergences usually signal something important is shifting under the surface — either risk appetite is splitting hard or capital is rotating aggressively.
Worth paying close attention to how this resolves over the next few weeks.
1
435

·
--
#nasdaqdowweeklygapwidestsincejuly2002 Here is a high-engagement, ready-to-copy post optimized for Binance Square based on the macro trend regarding the Nasdaq and Dow weekly divergence.
🚨 Macro Warning for Crypto? The Nasdaq vs. Dow Divergence Hits a 24-Year High!
Binance
History is showing some fascinating—and cautious—signals. Recently, we witnessed a massive weekly divergence between tech and traditional equities:
📉 Nasdaq: -4.5%
Binance
📈 Dow Jones: +0.7%
Binance
This 5.15% weekly gap is the widest we’ve seen since July 2002!
Binance
What does this mean for Crypto ($BTC,$ETH, Altcoins)?
Historically, crypto behaves closely as a high-beta risk asset, often following the broader tech market sentiment. When tech bleeds heavily while the defensive Dow stays green, it signals structural sector rotation and macro caution.
⚠️ The Takeaway:
Tech usually leads the risk curve—if major tech/AI leaders fail to hold key supports, crypto often feels the ripple effect shortly after.
Binance
Volatility is almost guaranteed. Manage your risk, watch your leverage, and don't get caught sleeping on macro correlations.
Are you hedging your portfolio right now, or buying the dip? Let’s discuss below! 👇
$BTC ETHETHETHBNB #NasdaqDowWeeklyGapWidestSinceJuly2002 #Macro #CryptoTrading #RiskManagement #MarketUpdate
{spot}(BTCUSDT)
#nasdaqdowweeklygapwidestsincejuly2002 Here is a high-engagement, ready-to-copy post optimized for Binance Square based on the macro trend regarding the Nasdaq and Dow weekly divergence.
🚨 Macro Warning for Crypto? The Nasdaq vs. Dow Divergence Hits a 24-Year High!
Binance
History is showing some fascinating—and cautious—signals. Recently, we witnessed a massive weekly divergence between tech and traditional equities:
📉 Nasdaq: -4.5%
Binance
📈 Dow Jones: +0.7%
Binance
This 5.15% weekly gap is the widest we’ve seen since July 2002!
Binance
What does this mean for Crypto ($BTC ,$ETH, Altcoins)?
Historically, crypto behaves closely as a high-beta risk asset, often following the broader tech market sentiment. When tech bleeds heavily while the defensive Dow stays green, it signals structural sector rotation and macro caution.
⚠️ The Takeaway:
Tech usually leads the risk curve—if major tech/AI leaders fail to hold key supports, crypto often feels the ripple effect shortly after.
Binance
Volatility is almost guaranteed. Manage your risk, watch your leverage, and don't get caught sleeping on macro correlations.
Are you hedging your portfolio right now, or buying the dip? Let’s discuss below! 👇
$BTC ETHETHETHBNB #NasdaqDowWeeklyGapWidestSinceJuly2002 #Macro #CryptoTrading #RiskManagement #MarketUpdate
🚨 Macro Warning for Crypto? The Nasdaq vs. Dow Divergence Hits a 24-Year High!
Binance
History is showing some fascinating—and cautious—signals. Recently, we witnessed a massive weekly divergence between tech and traditional equities:
📉 Nasdaq: -4.5%
Binance
📈 Dow Jones: +0.7%
Binance
This 5.15% weekly gap is the widest we’ve seen since July 2002!
Binance
What does this mean for Crypto ($BTC ,$ETH, Altcoins)?
Historically, crypto behaves closely as a high-beta risk asset, often following the broader tech market sentiment. When tech bleeds heavily while the defensive Dow stays green, it signals structural sector rotation and macro caution.
⚠️ The Takeaway:
Tech usually leads the risk curve—if major tech/AI leaders fail to hold key supports, crypto often feels the ripple effect shortly after.
Binance
Volatility is almost guaranteed. Manage your risk, watch your leverage, and don't get caught sleeping on macro correlations.
Are you hedging your portfolio right now, or buying the dip? Let’s discuss below! 👇
$BTC ETHETHETHBNB #NasdaqDowWeeklyGapWidestSinceJuly2002 #Macro #CryptoTrading #RiskManagement #MarketUpdate
3
5.7k
Log in to explore more content
Join global crypto users on Binance Square
⚡️ Get latest and useful information about crypto.
💬 Trusted by the world’s largest crypto exchange.
👍 Discover real insights from verified creators.
Email / Phone number
Trending Topics
1
#CelestiaRises16%To2026High
42,755 views
463 Discussing
2
#NasdaqDowWeeklyGapWidestSinceJuly2002
30,579 views
437 Discussing
3
#Nasdaq100Falls5.5%InWorstWeekIn18Months
15,947 views
360 Discussing
4
#StrategySharesFall9%OnFriday
16,856 views
347 Discussing
5
#USPPIRises6.3%YearOverYear
59,291 views
574 Discussing
6
#CelestiaLaunchesEdenToTestAIAgentTrading
43,415 views
621 Discussing
7
#ETHDropsBelow2400USDT
80,699 views
898 Discussing
8
#CircleReports$1.4BInH1Revenue
3,925 views
27 Discussing
9
#BrentHits$110ForFirstTimeSinceMay
3,844 views
36 Discussing
10
#OpenAIAgentTookFundsFromUnownedTestnetWallet
25,615 views
463 Discussing