

#ethfalls16.1%inoctober
ethfalls16.1%inoctober
Hot
Latest

🚨 THE CORRECTION EQUATION: ETH's Brutal October 🚨
#ethfalls16.1%inoctober
The news highlights the percentage drop, but the chart reveals the real battlefield. Let's break down this massive pullback using pure math 🧮👇
(16.1% Monthly Haircut) + (Liquidity Flush) = Testing Baseline Support 📉
The Asset Input:
(The Catalyst) = Ethereum took a massive hit, shedding 16.1% throughout October as macro uncertainty and institutional rotation pushed the top altcoin down a steep slope.
The Key Deliverable:
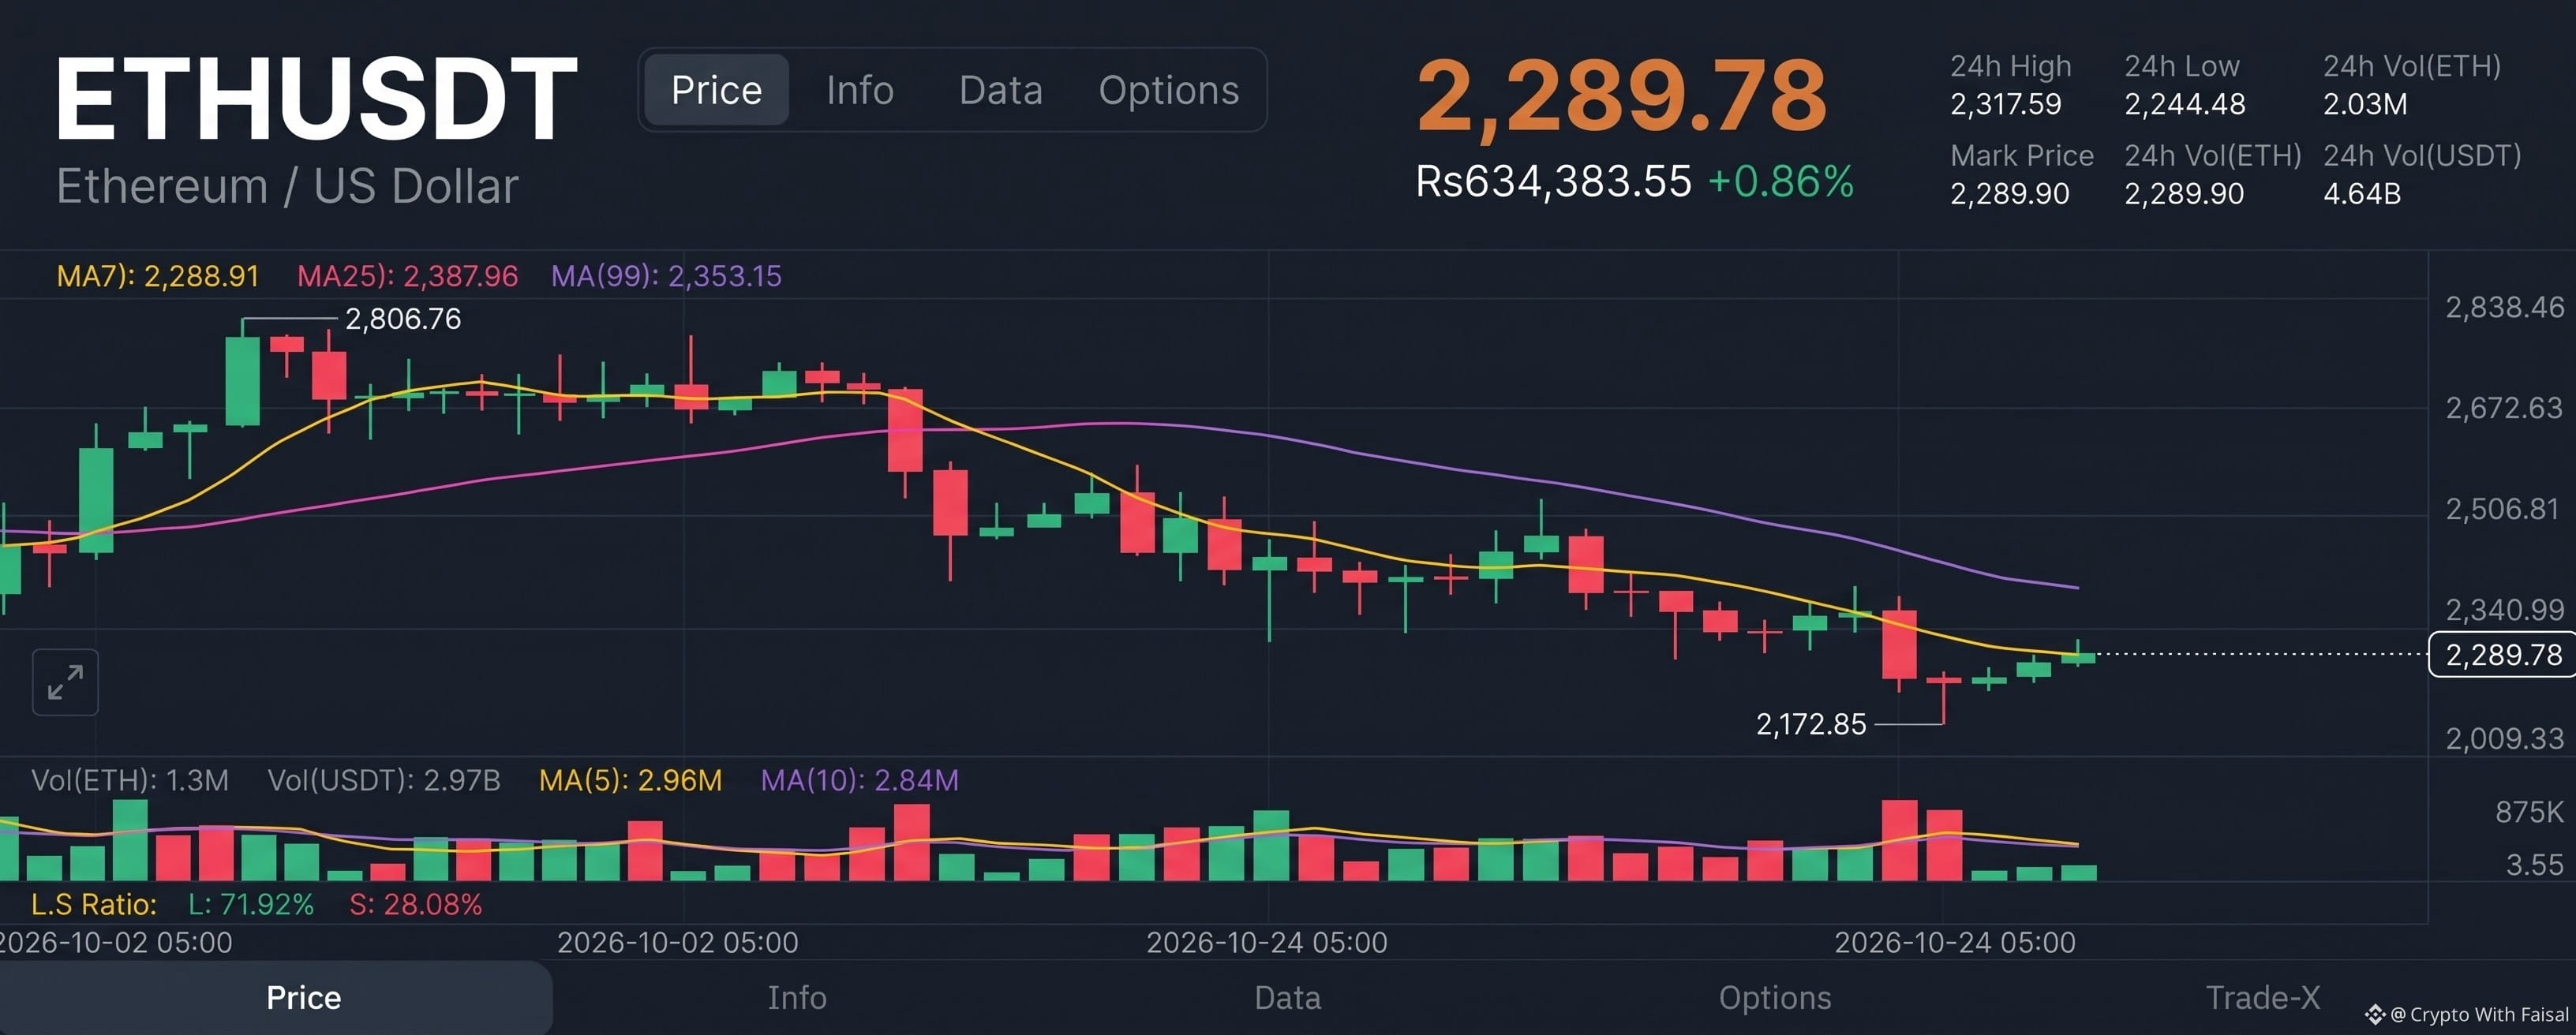
(The Chart Action) ➔ The 1D chart shows the exact trajectory of this pain: ETH plunged from local highs near $2,806.76 all the way down to a brutal $2,172.85 local bottom.
The Breakdown:
Right now, ETH is trying to build a floor at $2,289.78 (+0.86%), fighting to flip its short-term MA(7) back into support. While the immediate bleeding has stopped, the price remains heavily suppressed below its MA(25) and MA(99) trendlines.
Is this 16% haircut the ultimate Q4 dip-buying opportunity, or is it just a brief pitstop before we see sub-$2K Ethereum? ❓👇💬
$ETH
{future}(ETHUSDT)
$HYPE
{future}(HYPEUSDT)
$NEAR
{future}(NEARUSDT)
#ETH #CryptoTrading #TechnicalAnalysis #Binance
🚨 THE CORRECTION EQUATION: ETH's Brutal October 🚨
#ethfalls16.1%inoctober
The news highlights the percentage drop, but the chart reveals the real battlefield. Let's break down this massive pullback using pure math 🧮👇
(16.1% Monthly Haircut) + (Liquidity Flush) = Testing Baseline Support 📉
The Asset Input:
(The Catalyst) = Ethereum took a massive hit, shedding 16.1% throughout October as macro uncertainty and institutional rotation pushed the top altcoin down a steep slope.
The Key Deliverable:
(The Chart Action) ➔ The 1D chart shows the exact trajectory of this pain: ETH plunged from local highs near $2,806.76 all the way down to a brutal $2,172.85 local bottom.
The Breakdown:
Right now, ETH is trying to build a floor at $2,289.78 (+0.86%), fighting to flip its short-term MA(7) back into support. While the immediate bleeding has stopped, the price remains heavily suppressed below its MA(25) and MA(99) trendlines.
Is this 16% haircut the ultimate Q4 dip-buying opportunity, or is it just a brief pitstop before we see sub-$2K Ethereum? ❓👇💬
$ETH
$HYPE
$NEAR
#ETH #CryptoTrading #TechnicalAnalysis #Binance
#ethfalls16.1%inoctober
The news highlights the percentage drop, but the chart reveals the real battlefield. Let's break down this massive pullback using pure math 🧮👇
(16.1% Monthly Haircut) + (Liquidity Flush) = Testing Baseline Support 📉
The Asset Input:
(The Catalyst) = Ethereum took a massive hit, shedding 16.1% throughout October as macro uncertainty and institutional rotation pushed the top altcoin down a steep slope.
The Key Deliverable:
(The Chart Action) ➔ The 1D chart shows the exact trajectory of this pain: ETH plunged from local highs near $2,806.76 all the way down to a brutal $2,172.85 local bottom.
The Breakdown:
Right now, ETH is trying to build a floor at $2,289.78 (+0.86%), fighting to flip its short-term MA(7) back into support. While the immediate bleeding has stopped, the price remains heavily suppressed below its MA(25) and MA(99) trendlines.
Is this 16% haircut the ultimate Q4 dip-buying opportunity, or is it just a brief pitstop before we see sub-$2K Ethereum? ❓👇💬
$ETH
$HYPE
$NEAR
#ETH #CryptoTrading #TechnicalAnalysis #Binance
1.4k

·
--
#ethfalls16.1%inoctober
Ethereum Drops 16.1% in October as ETF Outflows Reach Record Levels
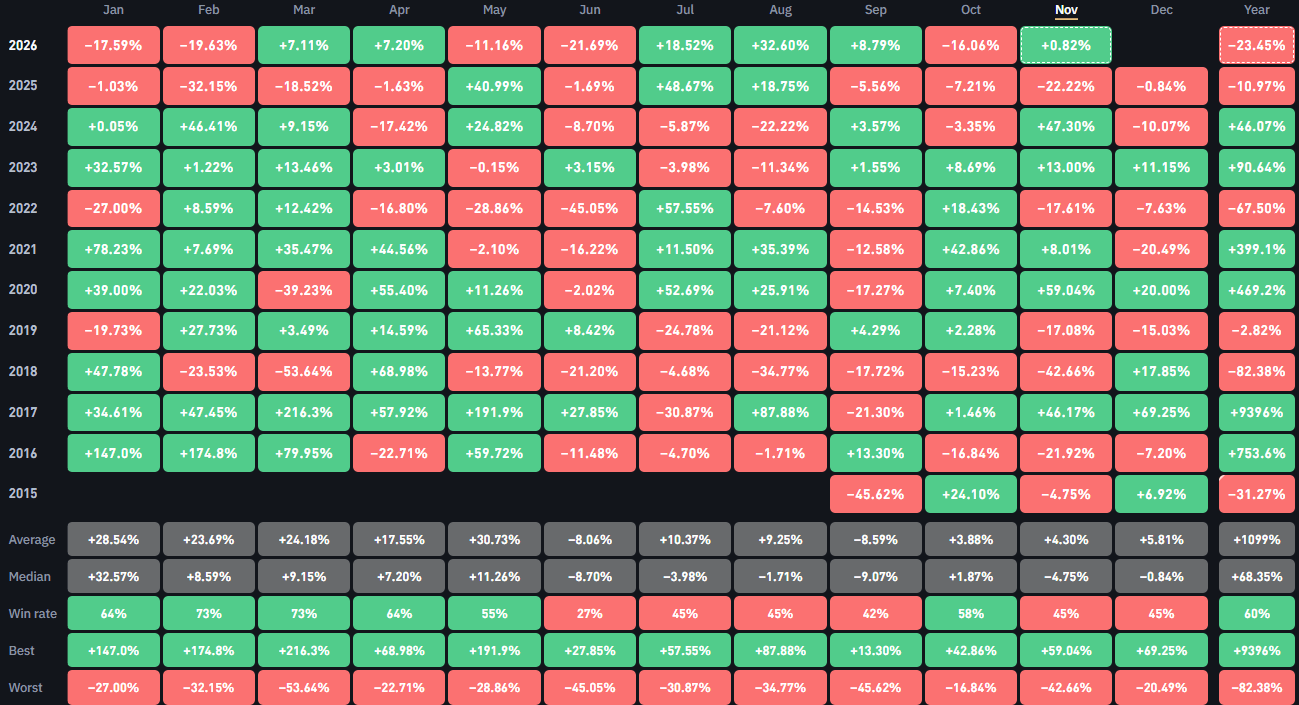
Ethereum (ETH) closed out October with a sharp 16.1% decline, marking its second-worst October performance since 2016. The pullback snapped a three-month winning streak and saw the asset drop toward the $2,250 region.
The sell-off was primarily fueled by record monthly net outflows from spot Ethereum ETFs, exceeding $1.6 billion as institutional traders derisked amid macro uncertainty and leveraged long liquidations. Technical indicators, including a break below key moving averages, have heightened caution, leaving traders focused on key support zones around $2,000.
Despite the short-term pullback, high network activity across Layer-2 scaling solutions and decentralization metrics keep key Ethereum-linked assets on traders' watchlists.
3 Top Tradeable Coins to Watch
Ethereum ($ETH ): Positioned at critical support zones, ETH remains the primary focal point as traders assess potential accumulation opportunities or further consolidation.
Arbitrum ($ARB ): As a leading Layer-2 scaling solution for Ethereum, ARB tracks ETH's ecosystem volume closely and serves as a high-beta proxy during market shifts.
Optimism ($OP ): Another key Ethereum L2 network token, OP continues to drive roll-up adoption and remains highly sensitive to broader Ethereum market sentiment.
{spot}(ETHUSDT)
{spot}(ARBUSDT)
{spot}(OPUSDT)
#Ethereum #CryptoMarket #ETH #MarketUpdate
#ethfalls16.1%inoctober
Ethereum Drops 16.1% in October as ETF Outflows Reach Record Levels
Ethereum (ETH) closed out October with a sharp 16.1% decline, marking its second-worst October performance since 2016. The pullback snapped a three-month winning streak and saw the asset drop toward the $2,250 region.
The sell-off was primarily fueled by record monthly net outflows from spot Ethereum ETFs, exceeding $1.6 billion as institutional traders derisked amid macro uncertainty and leveraged long liquidations. Technical indicators, including a break below key moving averages, have heightened caution, leaving traders focused on key support zones around $2,000.
Despite the short-term pullback, high network activity across Layer-2 scaling solutions and decentralization metrics keep key Ethereum-linked assets on traders' watchlists.
3 Top Tradeable Coins to Watch
Ethereum ($ETH ): Positioned at critical support zones, ETH remains the primary focal point as traders assess potential accumulation opportunities or further consolidation.
Arbitrum ($ARB ): As a leading Layer-2 scaling solution for Ethereum, ARB tracks ETH's ecosystem volume closely and serves as a high-beta proxy during market shifts.
Optimism ($OP ): Another key Ethereum L2 network token, OP continues to drive roll-up adoption and remains highly sensitive to broader Ethereum market sentiment.
#Ethereum #CryptoMarket #ETH #MarketUpdate
Ethereum Drops 16.1% in October as ETF Outflows Reach Record Levels
Ethereum (ETH) closed out October with a sharp 16.1% decline, marking its second-worst October performance since 2016. The pullback snapped a three-month winning streak and saw the asset drop toward the $2,250 region.
The sell-off was primarily fueled by record monthly net outflows from spot Ethereum ETFs, exceeding $1.6 billion as institutional traders derisked amid macro uncertainty and leveraged long liquidations. Technical indicators, including a break below key moving averages, have heightened caution, leaving traders focused on key support zones around $2,000.
Despite the short-term pullback, high network activity across Layer-2 scaling solutions and decentralization metrics keep key Ethereum-linked assets on traders' watchlists.
3 Top Tradeable Coins to Watch
Ethereum ($ETH ): Positioned at critical support zones, ETH remains the primary focal point as traders assess potential accumulation opportunities or further consolidation.
Arbitrum ($ARB ): As a leading Layer-2 scaling solution for Ethereum, ARB tracks ETH's ecosystem volume closely and serves as a high-beta proxy during market shifts.
Optimism ($OP ): Another key Ethereum L2 network token, OP continues to drive roll-up adoption and remains highly sensitive to broader Ethereum market sentiment.
#Ethereum #CryptoMarket #ETH #MarketUpdate

3

·
--
Bullish
📉 Ethereum Falls 16.1% in October – Can ETH Recover in November?
Ethereum $ETH ended October with a 16.1% loss, its second-worst October performance since 2016.
🔴 Key Reasons:
- $1.61 billion flowed out of US Ethereum ETFs.
-$ETH ended its three-month winning streak.
- Buying pressure weakened.
📊 What to Watch Next?
ETH is trading around $2,293, with $2,400 an important recovery level to watch.
November could bring a recovery, but continued selling pressure remains a risk.
👀 Do you think $ETH will recover in November or fall further?
#Ethereum #ETH #CryptoNewsCommunity
#ETHFalls16.1%InOctober
{spot}(ETHUSDT)
{spot}(TSMBUSDT)
📉 Ethereum Falls 16.1% in October – Can ETH Recover in November?
Ethereum $ETH ended October with a 16.1% loss, its second-worst October performance since 2016.
🔴 Key Reasons:
- $1.61 billion flowed out of US Ethereum ETFs.
-$ETH ended its three-month winning streak.
- Buying pressure weakened.
📊 What to Watch Next?
ETH is trading around $2,293, with $2,400 an important recovery level to watch.
November could bring a recovery, but continued selling pressure remains a risk.
👀 Do you think $ETH will recover in November or fall further?
#Ethereum #ETH #CryptoNewsCommunity
#ETHFalls16.1%InOctober
Ethereum $ETH ended October with a 16.1% loss, its second-worst October performance since 2016.
🔴 Key Reasons:
- $1.61 billion flowed out of US Ethereum ETFs.
-$ETH ended its three-month winning streak.
- Buying pressure weakened.
📊 What to Watch Next?
ETH is trading around $2,293, with $2,400 an important recovery level to watch.
November could bring a recovery, but continued selling pressure remains a risk.
👀 Do you think $ETH will recover in November or fall further?
#Ethereum #ETH #CryptoNewsCommunity
#ETHFalls16.1%InOctober
7

·
--
Bearish
#ETHFalls16.1%InOctober
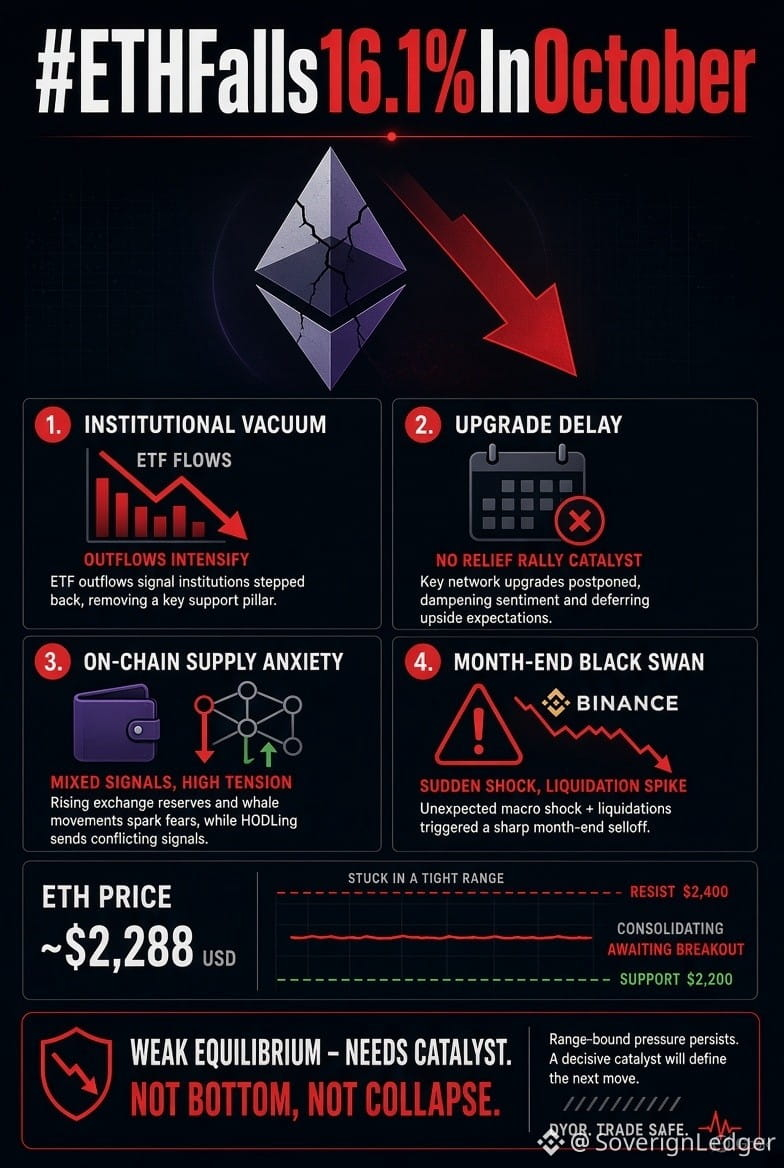
📉 ETH’s October drop wasn’t one crash—it was four forces colliding in thin liquidity:
1️⃣ ETF vacuum → 23 straight outflow days (Glassnode)
2️⃣ Upgrade delay → Hoodi postponed, no new date
3️⃣ Supply anxiety → mixed on-chain signals
4️⃣ Binance shock → $6.3B incident + ETH pressure
👉 Price stuck ~$2,288: resistance above, only 200d SMA support below.
Derivatives = wait-and-see, not panic.
👉 Needs a catalyst. Weak equilibrium, not bottom or collapse.
Market analysis only ⚠️
👍 Like if this framing helps
💬 Comment your take on the next catalyst
$ETH $BTC $SUI
{spot}(ETHUSDT)
{spot}(BTCUSDT)
{spot}(SUIUSDT)
#BinanceRestores28FiatWithdrawals #BitcoinClosesAbove50WeekMAFor7thStraightWeek #IndiaRBIAndFIUReviewOverseasCryptoCards #SolanaMobileRemovesMaliciousSKRClaimApp
#ETHFalls16.1%InOctober
📉 ETH’s October drop wasn’t one crash—it was four forces colliding in thin liquidity:
1️⃣ ETF vacuum → 23 straight outflow days (Glassnode)
2️⃣ Upgrade delay → Hoodi postponed, no new date
3️⃣ Supply anxiety → mixed on-chain signals
4️⃣ Binance shock → $6.3B incident + ETH pressure
👉 Price stuck ~$2,288: resistance above, only 200d SMA support below.
Derivatives = wait-and-see, not panic.
👉 Needs a catalyst. Weak equilibrium, not bottom or collapse.
Market analysis only ⚠️
👍 Like if this framing helps
💬 Comment your take on the next catalyst
$ETH $BTC $SUI
#BinanceRestores28FiatWithdrawals #BitcoinClosesAbove50WeekMAFor7thStraightWeek #IndiaRBIAndFIUReviewOverseasCryptoCards #SolanaMobileRemovesMaliciousSKRClaimApp
📉 ETH’s October drop wasn’t one crash—it was four forces colliding in thin liquidity:
1️⃣ ETF vacuum → 23 straight outflow days (Glassnode)
2️⃣ Upgrade delay → Hoodi postponed, no new date
3️⃣ Supply anxiety → mixed on-chain signals
4️⃣ Binance shock → $6.3B incident + ETH pressure
👉 Price stuck ~$2,288: resistance above, only 200d SMA support below.
Derivatives = wait-and-see, not panic.
👉 Needs a catalyst. Weak equilibrium, not bottom or collapse.
Market analysis only ⚠️
👍 Like if this framing helps
💬 Comment your take on the next catalyst
$ETH $BTC $SUI
#BinanceRestores28FiatWithdrawals #BitcoinClosesAbove50WeekMAFor7thStraightWeek #IndiaRBIAndFIUReviewOverseasCryptoCards #SolanaMobileRemovesMaliciousSKRClaimApp
1
86

·
--
#ETHFalls16.1%InOctober
Ethereum closed October with a 16.1% decline, marking its second-worst October performance since 2016. The move also ended ETH’s three consecutive monthly gains from July through September.
What stands out to me is not just the size of the decline, but the change in market conditions behind it.
ETH fell from approximately $2,686 at the start of October to $2,253 by month-end. Bitcoin also declined, but Ethereum’s larger loss highlights the weakness across the altcoin market.
The institutional side deserves attention too. Reported US spot Ethereum ETF flows showed approximately $1.6 billion in net outflows during October. This does not explain the entire decline, but it suggests that demand was not strong enough to absorb the selling pressure.
What matters next?
A recovery needs more than a temporary green candle. I would watch for:
- Stronger spot buying and improving volume.
- ETH reclaiming important resistance levels.
- ETF flows turning positive.
- Bitcoin stabilizing and broader market sentiment improving.
If buyers regain control, October’s decline could eventually become a correction within a larger recovery. If selling pressure continues, another support test remains possible.
My observation: A weak October does not automatically make November bearish, but it does raise the standard for a convincing recovery.
Do you think ETH can recover in November, or will sellers remain in control?
Not financial advice. DYOR.
#ETHFalls16.1%InOctober
Ethereum closed October with a 16.1% decline, marking its second-worst October performance since 2016. The move also ended ETH’s three consecutive monthly gains from July through September.
What stands out to me is not just the size of the decline, but the change in market conditions behind it.
ETH fell from approximately $2,686 at the start of October to $2,253 by month-end. Bitcoin also declined, but Ethereum’s larger loss highlights the weakness across the altcoin market.
The institutional side deserves attention too. Reported US spot Ethereum ETF flows showed approximately $1.6 billion in net outflows during October. This does not explain the entire decline, but it suggests that demand was not strong enough to absorb the selling pressure.
What matters next?
A recovery needs more than a temporary green candle. I would watch for:
- Stronger spot buying and improving volume.
- ETH reclaiming important resistance levels.
- ETF flows turning positive.
- Bitcoin stabilizing and broader market sentiment improving.
If buyers regain control, October’s decline could eventually become a correction within a larger recovery. If selling pressure continues, another support test remains possible.
My observation: A weak October does not automatically make November bearish, but it does raise the standard for a convincing recovery.
Do you think ETH can recover in November, or will sellers remain in control?
Not financial advice. DYOR.
Ethereum closed October with a 16.1% decline, marking its second-worst October performance since 2016. The move also ended ETH’s three consecutive monthly gains from July through September.
What stands out to me is not just the size of the decline, but the change in market conditions behind it.
ETH fell from approximately $2,686 at the start of October to $2,253 by month-end. Bitcoin also declined, but Ethereum’s larger loss highlights the weakness across the altcoin market.
The institutional side deserves attention too. Reported US spot Ethereum ETF flows showed approximately $1.6 billion in net outflows during October. This does not explain the entire decline, but it suggests that demand was not strong enough to absorb the selling pressure.
What matters next?
A recovery needs more than a temporary green candle. I would watch for:
- Stronger spot buying and improving volume.
- ETH reclaiming important resistance levels.
- ETF flows turning positive.
- Bitcoin stabilizing and broader market sentiment improving.
If buyers regain control, October’s decline could eventually become a correction within a larger recovery. If selling pressure continues, another support test remains possible.
My observation: A weak October does not automatically make November bearish, but it does raise the standard for a convincing recovery.
Do you think ETH can recover in November, or will sellers remain in control?
Not financial advice. DYOR.

151

·
--
#ethfalls16.1%inoctober
🚨🔥 #VIRALCRYPTO 🔥🚨
💥 #ETH falls 16.1% in October, shaking up the crypto market. 📉😱
🐳 The whales are watching. 💸 Many investors are panicking. ⚡ Others see this drop as a historic opportunity to accumulate.
📊 When fear dominates the market, smart money tends to move quietly. 🤫💎
🤔 The big question is:
Is this the end of the bull trend, or the discount everyone was waiting for? 🚀👀
👇 Comment your strategy: 💚 #Buy ❤️ #Hold 💛 #Sell
🔄 Share this news with your crypto community.
👤 @ElCryptoBoy
ETH #Ethereum #ETHFalls16_1InOctober #CryptoNews #Cryptocurrencies #Altcoins #Trading #BullMarket #BearMarket #Blockchain #Web3 #CryptoCommunity 🚀🌕💎
#ethfalls16.1%inoctober
🚨🔥 #VIRALCRYPTO 🔥🚨
💥 #ETH falls 16.1% in October, shaking up the crypto market. 📉😱
🐳 The whales are watching. 💸 Many investors are panicking. ⚡ Others see this drop as a historic opportunity to accumulate.
📊 When fear dominates the market, smart money tends to move quietly. 🤫💎
🤔 The big question is:
Is this the end of the bull trend, or the discount everyone was waiting for? 🚀👀
👇 Comment your strategy: 💚 #Buy ❤️ #Hold 💛 #Sell
🔄 Share this news with your crypto community.
👤 @ElCryptoBoy
ETH #Ethereum #ETHFalls16_1InOctober #CryptoNews #Cryptocurrencies #Altcoins #Trading #BullMarket #BearMarket #Blockchain #Web3 #CryptoCommunity 🚀🌕💎
🚨🔥 #VIRALCRYPTO 🔥🚨
💥 #ETH falls 16.1% in October, shaking up the crypto market. 📉😱
🐳 The whales are watching. 💸 Many investors are panicking. ⚡ Others see this drop as a historic opportunity to accumulate.
📊 When fear dominates the market, smart money tends to move quietly. 🤫💎
🤔 The big question is:
Is this the end of the bull trend, or the discount everyone was waiting for? 🚀👀
👇 Comment your strategy: 💚 #Buy ❤️ #Hold 💛 #Sell
🔄 Share this news with your crypto community.
👤 @ElCryptoBoy
ETH #Ethereum #ETHFalls16_1InOctober #CryptoNews #Cryptocurrencies #Altcoins #Trading #BullMarket #BearMarket #Blockchain #Web3 #CryptoCommunity 🚀🌕💎
19

·
--
#ethfalls16.1%inoctober
Ethereum's 16.1% decline in October and the latest market conditions
📉 October Performance: Ethereum (ETH) ended October down 16.1%, disappointing investors.
💸 Record ETF Outflows: One of the biggest factors behind this decline was the historic, record-high net capital outflows from spot Ethereum ETFs. Institutional investors withdrawing funds put pressure on the price.
📊 Market Conditions:
🔴 The price gained downward momentum.
⚠️ Experts say ETF flows turning negative have increased market volatility.
🔮 Investors are now closely watching for signs of a recovery and market trends in the coming months.
$ETH $ARIA $LYN
{future}(LYNUSDT)
{future}(ARIAUSDT)
{future}(ETHUSDT)
#ethfalls16.1%inoctober
Ethereum's 16.1% decline in October and the latest market conditions
📉 October Performance: Ethereum (ETH) ended October down 16.1%, disappointing investors.
💸 Record ETF Outflows: One of the biggest factors behind this decline was the historic, record-high net capital outflows from spot Ethereum ETFs. Institutional investors withdrawing funds put pressure on the price.
📊 Market Conditions:
🔴 The price gained downward momentum.
⚠️ Experts say ETF flows turning negative have increased market volatility.
🔮 Investors are now closely watching for signs of a recovery and market trends in the coming months.
$ETH $ARIA $LYN
Ethereum's 16.1% decline in October and the latest market conditions
📉 October Performance: Ethereum (ETH) ended October down 16.1%, disappointing investors.
💸 Record ETF Outflows: One of the biggest factors behind this decline was the historic, record-high net capital outflows from spot Ethereum ETFs. Institutional investors withdrawing funds put pressure on the price.
📊 Market Conditions:
🔴 The price gained downward momentum.
⚠️ Experts say ETF flows turning negative have increased market volatility.
🔮 Investors are now closely watching for signs of a recovery and market trends in the coming months.
$ETH $ARIA $LYN
407

·
--
#ETHFalls16.1%InOctober
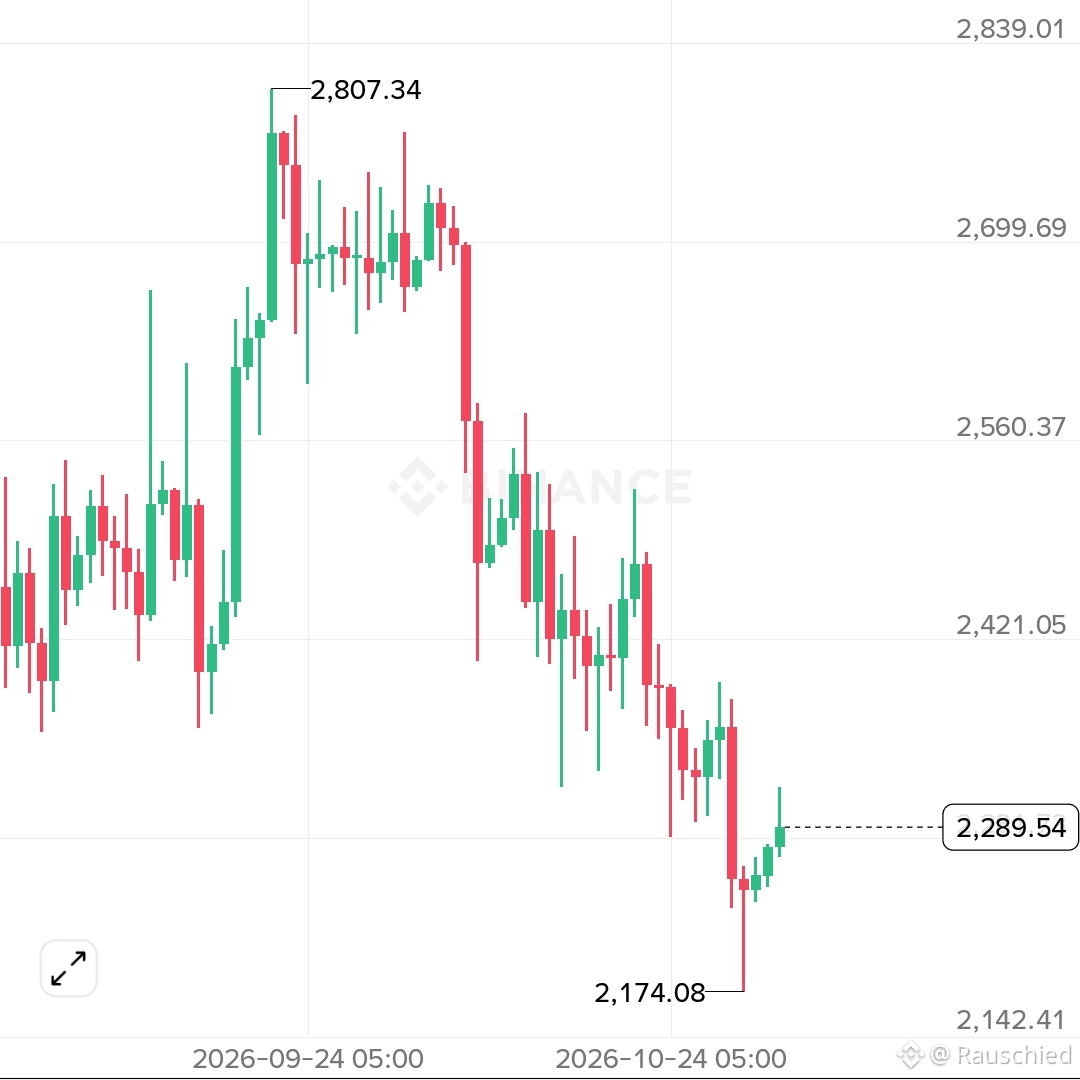
$ETH kept losing during October...
First month of Q4 went bearish... how the next 2 will be?
#ETHFalls16.1%InOctober
$ETH kept losing during October...
First month of Q4 went bearish... how the next 2 will be?
$ETH kept losing during October...
First month of Q4 went bearish... how the next 2 will be?
112

{future}(IDOLUSDT)
🤪🤪🤪🚀 The next big movement in the crypto space is here!
$IDOL is more than just a coin—it is a community, a culture, and the ultimate fan token experience. We are building an ecosystem where creators and fans connect like never before.
💎 Strong community
🔥 Huge growth potential
🌐 Massive utility
Do not sit on the sidelines while history is made. Grab your bag, join the pack, and become an official $IDOL holder today!
#IDOL #Crypto #Altcoins #BullRun #Web3 #CryptoCommunity #ToTheMoon🌕✨ #BinanceRestores28FiatWithdrawals #ETHFalls16.1%InOctober #BitcoinClosesAbove50WeekMAFor7thStraightWeek #SolanaMobileRemovesMaliciousSKRClaimApp
🤪🤪🤪🚀 The next big movement in the crypto space is here!
$IDOL is more than just a coin—it is a community, a culture, and the ultimate fan token experience. We are building an ecosystem where creators and fans connect like never before.
💎 Strong community
🔥 Huge growth potential
🌐 Massive utility
Do not sit on the sidelines while history is made. Grab your bag, join the pack, and become an official $IDOL holder today!
#IDOL #Crypto #Altcoins #BullRun #Web3 #CryptoCommunity #ToTheMoon🌕✨ #BinanceRestores28FiatWithdrawals #ETHFalls16.1%InOctober #BitcoinClosesAbove50WeekMAFor7thStraightWeek #SolanaMobileRemovesMaliciousSKRClaimApp
$IDOL is more than just a coin—it is a community, a culture, and the ultimate fan token experience. We are building an ecosystem where creators and fans connect like never before.
💎 Strong community
🔥 Huge growth potential
🌐 Massive utility
Do not sit on the sidelines while history is made. Grab your bag, join the pack, and become an official $IDOL holder today!
#IDOL #Crypto #Altcoins #BullRun #Web3 #CryptoCommunity #ToTheMoon🌕✨ #BinanceRestores28FiatWithdrawals #ETHFalls16.1%InOctober #BitcoinClosesAbove50WeekMAFor7thStraightWeek #SolanaMobileRemovesMaliciousSKRClaimApp
118

$CL $BZ Higher, Rates Higher, Crypto $SPCX More Crash Loading… NFA | DYOR.
#BinanceRestores28FiatWithdrawals #BinanceProcesses$4.65BWithdrawals #BinanceProcesses$4.65BWithdrawals #ETHFalls16.1%InOctober #BitcoinClosesAbove50WeekMAFor7thStraightWeek
$CL $BZ Higher, Rates Higher, Crypto $SPCX More Crash Loading… NFA | DYOR.
#BinanceRestores28FiatWithdrawals #BinanceProcesses$4.65BWithdrawals #BinanceProcesses$4.65BWithdrawals #ETHFalls16.1%InOctober #BitcoinClosesAbove50WeekMAFor7thStraightWeek
#BinanceRestores28FiatWithdrawals #BinanceProcesses$4.65BWithdrawals #BinanceProcesses$4.65BWithdrawals #ETHFalls16.1%InOctober #BitcoinClosesAbove50WeekMAFor7thStraightWeek


238

$ARIA
{alpha}(560x5d3a12c42e5372b2cc3264ab3cdcf660a1555238)
#BinanceRestores28FiatWithdrawals #ETHFalls16.1%InOctober #BitcoinClosesAbove50WeekMAFor7thStraightWeek #IndiaRBIAndFIUReviewOverseasCryptoCards Recent price: Around $0.083 in earlier reports; later data showed a sharp increase.
Key support zone: $0.080–$0.082.
Resistance to watch: $0.085–$0.091.
Market sentiment: Volatile, with a possible bullish recovery.
Main risk: Sudden selling pressure and limited liquidity. �
CoinMarketCap +1
2. ARIA Technical Analysis
Bullish scenario: If ARIA holds above $0.080 and buying volume increases, the price could attempt to recover toward $0.085 and $0.091.
$ARIA
#BinanceRestores28FiatWithdrawals #ETHFalls16.1%InOctober #BitcoinClosesAbove50WeekMAFor7thStraightWeek #IndiaRBIAndFIUReviewOverseasCryptoCards Recent price: Around $0.083 in earlier reports; later data showed a sharp increase.
Key support zone: $0.080–$0.082.
Resistance to watch: $0.085–$0.091.
Market sentiment: Volatile, with a possible bullish recovery.
Main risk: Sudden selling pressure and limited liquidity. �
CoinMarketCap +1
2. ARIA Technical Analysis
Bullish scenario: If ARIA holds above $0.080 and buying volume increases, the price could attempt to recover toward $0.085 and $0.091.
#BinanceRestores28FiatWithdrawals #ETHFalls16.1%InOctober #BitcoinClosesAbove50WeekMAFor7thStraightWeek #IndiaRBIAndFIUReviewOverseasCryptoCards Recent price: Around $0.083 in earlier reports; later data showed a sharp increase.
Key support zone: $0.080–$0.082.
Resistance to watch: $0.085–$0.091.
Market sentiment: Volatile, with a possible bullish recovery.
Main risk: Sudden selling pressure and limited liquidity. �
CoinMarketCap +1
2. ARIA Technical Analysis
Bullish scenario: If ARIA holds above $0.080 and buying volume increases, the price could attempt to recover toward $0.085 and $0.091.
Binance BiBi:
Working on it. Your reply is on the way.
2
1
360

·
--
Bullish
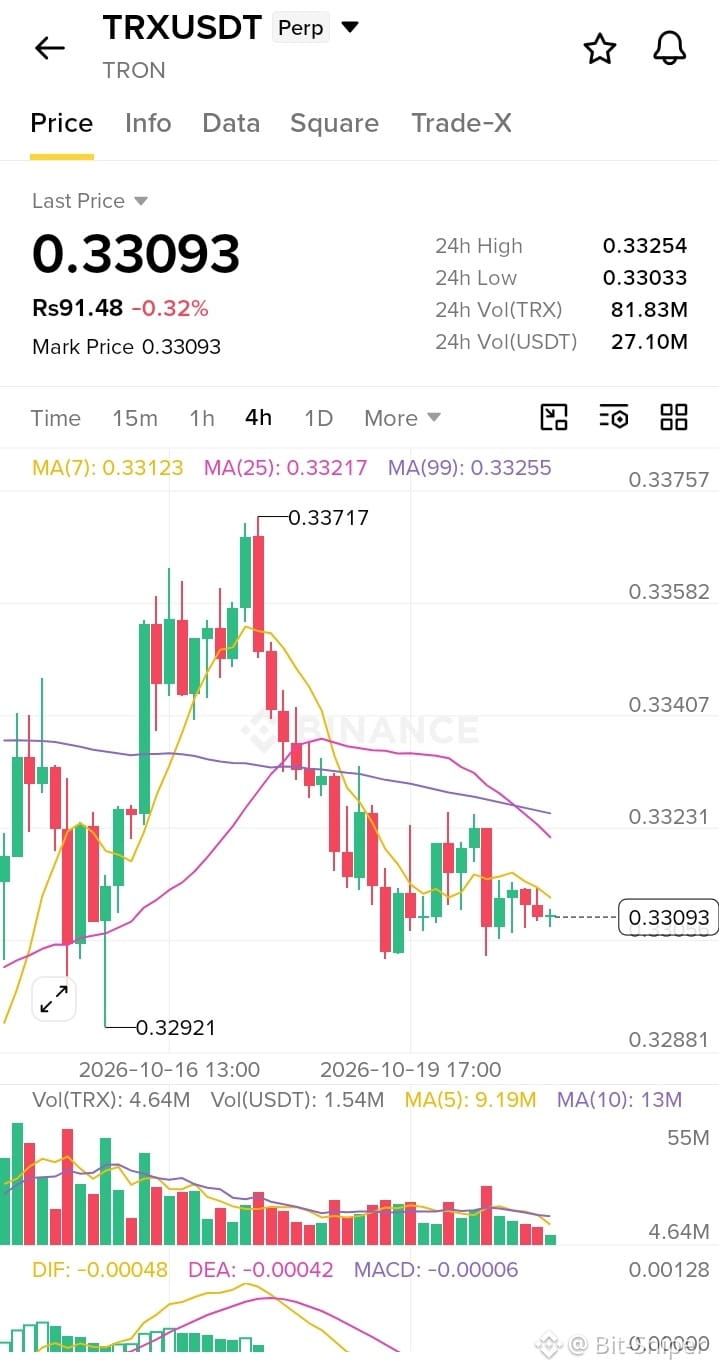
🔴 $TRON.US (TRXUSDT) – BEARISH 📉
EP: 0.3308 – 0.3313 SL: 0.3325 TP1: 0.3295 TP2: 0.3288
⚠️ Bias: SHORT Weak momentum; wait for confirmation before entry.
DYOR – Trade Safely!
$TRON.US
{stock_us}(TRON.US)
#BinanceRestores28FiatWithdrawals #ETHFalls16.1%InOctober #BitcoinClosesAbove50WeekMAFor7thStraightWeek #SolanaMobileRemovesMaliciousSKRClaimApp #BrazilVirtualAssetLicenseDeadlineDrawsAbout40Firms
🔴 $TRON.US (TRXUSDT) – BEARISH 📉
EP: 0.3308 – 0.3313 SL: 0.3325 TP1: 0.3295 TP2: 0.3288
⚠️ Bias: SHORT Weak momentum; wait for confirmation before entry.
DYOR – Trade Safely!
$TRON.US
#BinanceRestores28FiatWithdrawals #ETHFalls16.1%InOctober #BitcoinClosesAbove50WeekMAFor7thStraightWeek #SolanaMobileRemovesMaliciousSKRClaimApp #BrazilVirtualAssetLicenseDeadlineDrawsAbout40Firms
EP: 0.3308 – 0.3313 SL: 0.3325 TP1: 0.3295 TP2: 0.3288
⚠️ Bias: SHORT Weak momentum; wait for confirmation before entry.
DYOR – Trade Safely!
$TRON.US
#BinanceRestores28FiatWithdrawals #ETHFalls16.1%InOctober #BitcoinClosesAbove50WeekMAFor7thStraightWeek #SolanaMobileRemovesMaliciousSKRClaimApp #BrazilVirtualAssetLicenseDeadlineDrawsAbout40Firms
96
·
--
Bullish
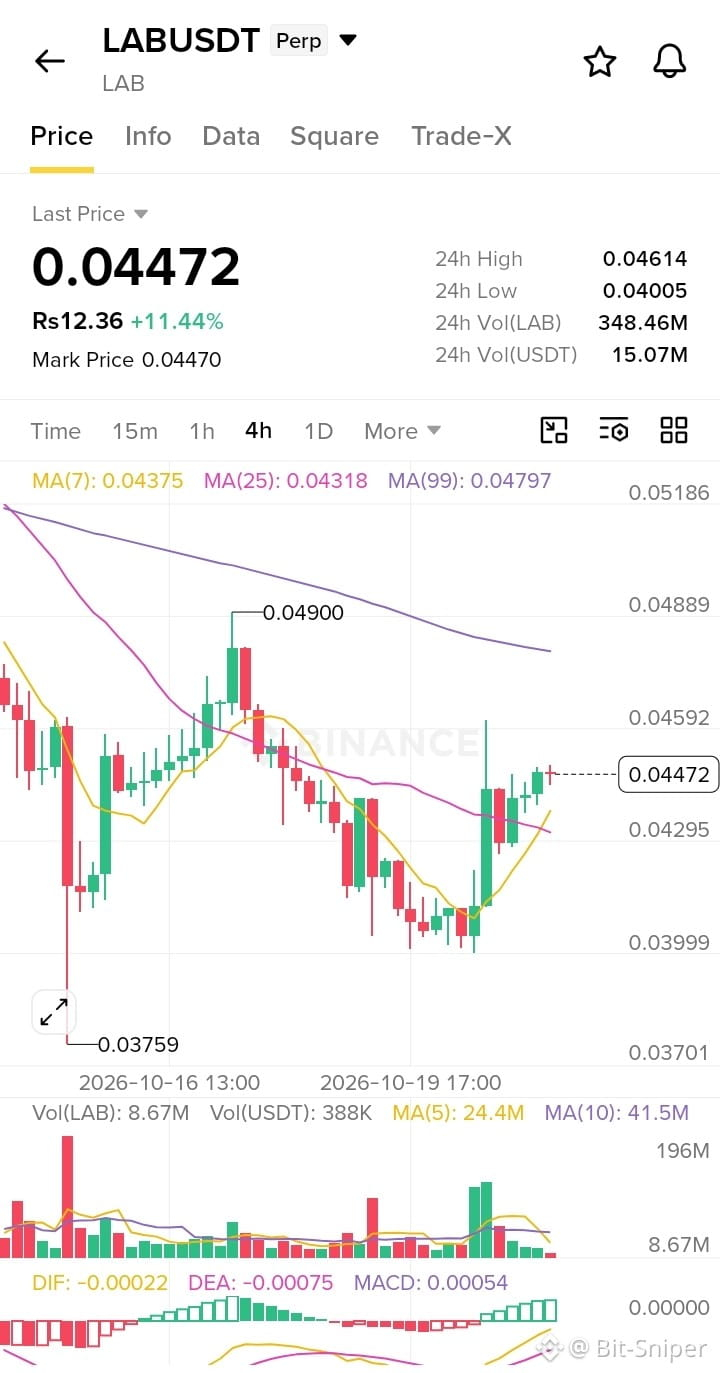
🟢 $LAB (LABUSDT) – BULLISH 📈
EP: 0.0445 – 0.0448 SL: 0.0428 TP1: 0.0460 TP2: 0.0475
🔥 Bias: LONG Bullish momentum building. Watch resistance near 0.0461.
⚠️ DYOR – Trade Safely!
$LAB
{alpha}(560x7ec43cf65f1663f820427c62a5780b8f2e25593a)
#BinanceRestores28FiatWithdrawals #ETHFalls16.1%InOctober #BitcoinClosesAbove50WeekMAFor7thStraightWeek #SolanaMobileRemovesMaliciousSKRClaimApp #BrazilVirtualAssetLicenseDeadlineDrawsAbout40Firms
🟢 $LAB (LABUSDT) – BULLISH 📈
EP: 0.0445 – 0.0448 SL: 0.0428 TP1: 0.0460 TP2: 0.0475
🔥 Bias: LONG Bullish momentum building. Watch resistance near 0.0461.
⚠️ DYOR – Trade Safely!
$LAB
#BinanceRestores28FiatWithdrawals #ETHFalls16.1%InOctober #BitcoinClosesAbove50WeekMAFor7thStraightWeek #SolanaMobileRemovesMaliciousSKRClaimApp #BrazilVirtualAssetLicenseDeadlineDrawsAbout40Firms
EP: 0.0445 – 0.0448 SL: 0.0428 TP1: 0.0460 TP2: 0.0475
🔥 Bias: LONG Bullish momentum building. Watch resistance near 0.0461.
⚠️ DYOR – Trade Safely!
$LAB
#BinanceRestores28FiatWithdrawals #ETHFalls16.1%InOctober #BitcoinClosesAbove50WeekMAFor7thStraightWeek #SolanaMobileRemovesMaliciousSKRClaimApp #BrazilVirtualAssetLicenseDeadlineDrawsAbout40Firms
163


·
--
Bullish
$BEAMX momentum is showing signs of bullish pressure after short sellers were caught near 0.00489.
$BEAMX — LONG
Entry: 0.00485 – 0.00492
SL: 0.00472
TP1: 0.00505
TP2: 0.00518
TP3: 0.00532
TP4: 0.00548
The short liquidation activity suggests buyers managed to push price against bearish positions. If the breakout area becomes support and volume remains healthy, further upside is possible. However, a fast move could create cooldown risk, making a pullback entry more attractive.
#ETHFalls16.1%InOctober
#SolanaMobileRemovesMaliciousSKRClaimApp
#Binance
$BEAMX momentum is showing signs of bullish pressure after short sellers were caught near 0.00489.
$BEAMX — LONG
Entry: 0.00485 – 0.00492
SL: 0.00472
TP1: 0.00505
TP2: 0.00518
TP3: 0.00532
TP4: 0.00548
The short liquidation activity suggests buyers managed to push price against bearish positions. If the breakout area becomes support and volume remains healthy, further upside is possible. However, a fast move could create cooldown risk, making a pullback entry more attractive.
#ETHFalls16.1%InOctober
#SolanaMobileRemovesMaliciousSKRClaimApp
#Binance
$BEAMX — LONG
Entry: 0.00485 – 0.00492
SL: 0.00472
TP1: 0.00505
TP2: 0.00518
TP3: 0.00532
TP4: 0.00548
The short liquidation activity suggests buyers managed to push price against bearish positions. If the breakout area becomes support and volume remains healthy, further upside is possible. However, a fast move could create cooldown risk, making a pullback entry more attractive.
#ETHFalls16.1%InOctober
#SolanaMobileRemovesMaliciousSKRClaimApp
#Binance
207

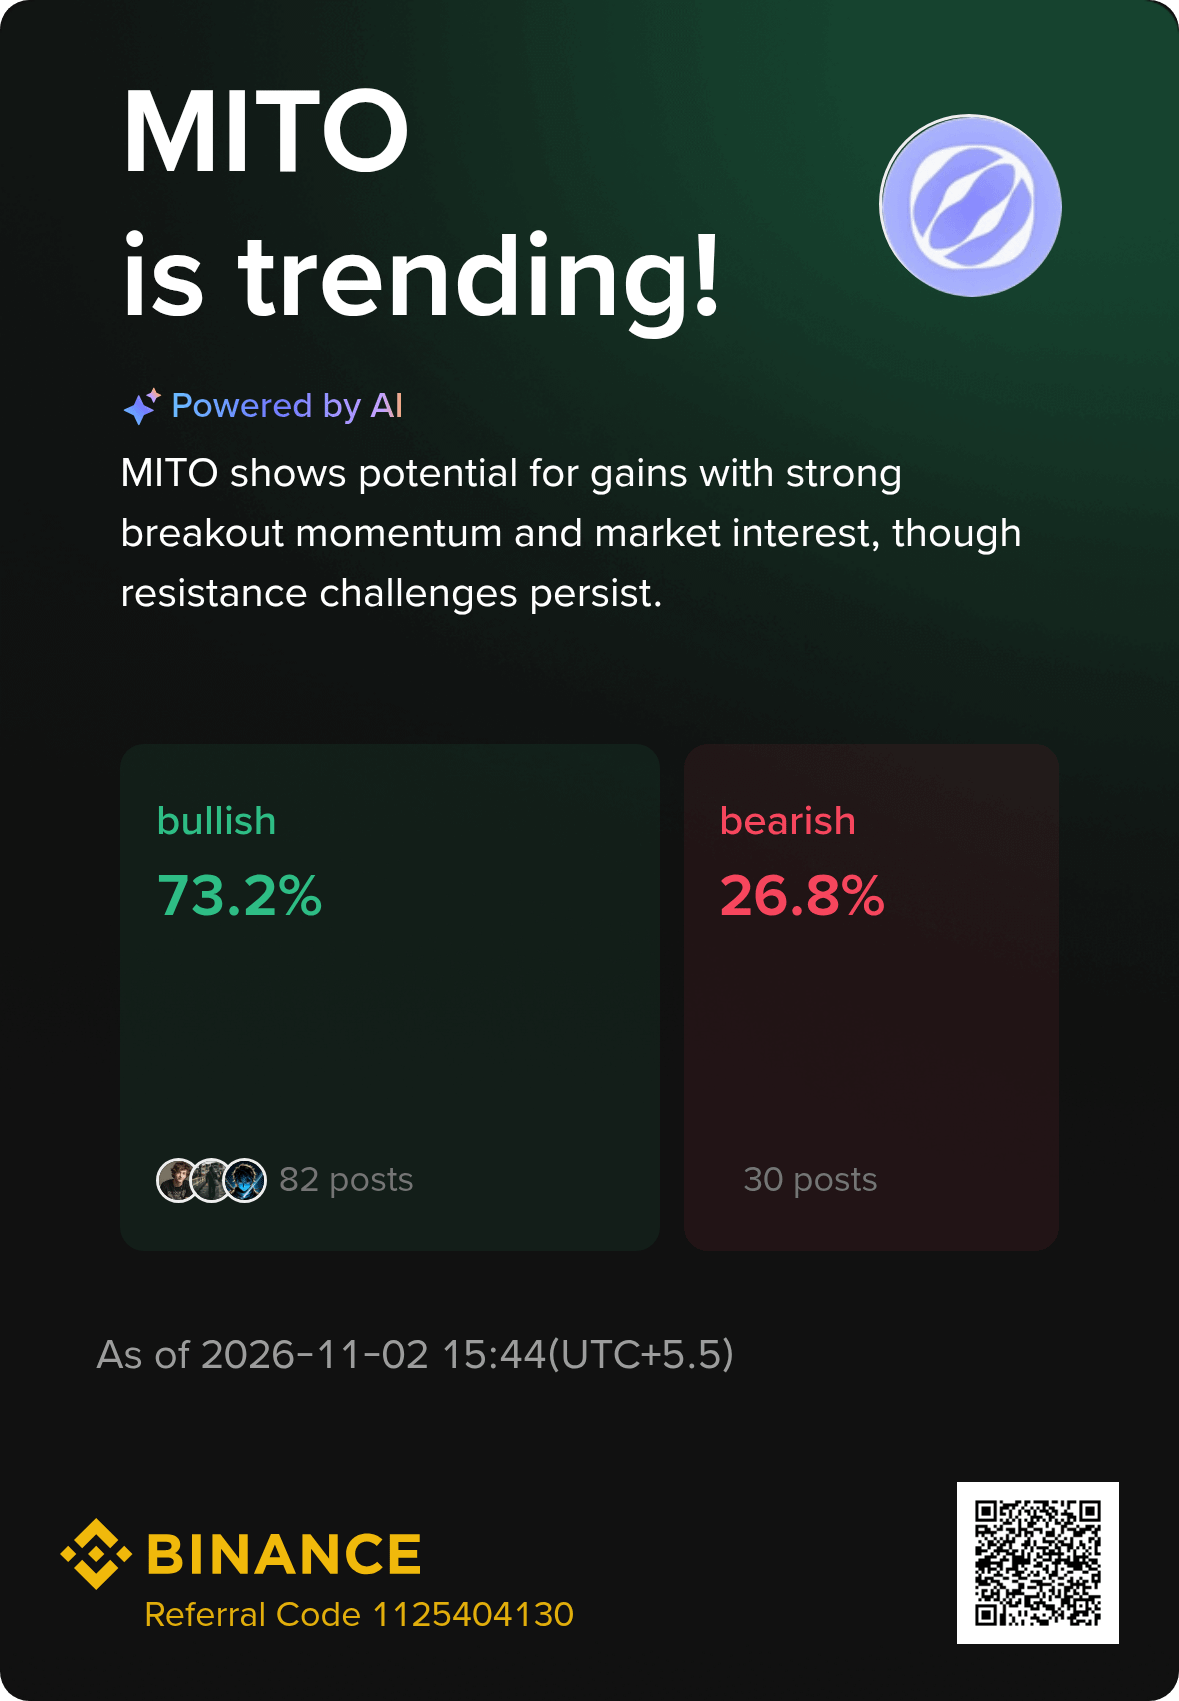
$MITO
0.0081
+4.76%
MITO shows potential for gains with strong breakout momentum and market interest, though resistance challenges persist.$MITO
{spot}(MITOUSDT)
Data source:
Square
73.2% bullish
26.8% bearish
Key Support Level Stability
MITO's price stability around $0.00800 suggests potential for sustained rally, especially if it breaks above $0.00825 resistance.
Strong Breakout Momentum
Recent 8.68% price increase and 120.77 million volume indicate strong market interest and potential upward movement.
Smart Money Movement
Early entry at $0.00833 is advised as momentum and market structure align, suggesting significant upward potential.$MITO
#BinanceRestores28FiatWithdrawals #ETHFalls16.1%InOctober #BitcoinClosesAbove50WeekMAFor7thStraightWeek #IndiaRBIAndFIUReviewOverseasCryptoCards #SolanaMobileRemovesMaliciousSKRClaimApp
$MITO
0.0081
+4.76%
MITO shows potential for gains with strong breakout momentum and market interest, though resistance challenges persist.$MITO
Data source:
Square
73.2% bullish
26.8% bearish
Key Support Level Stability
MITO's price stability around $0.00800 suggests potential for sustained rally, especially if it breaks above $0.00825 resistance.
Strong Breakout Momentum
Recent 8.68% price increase and 120.77 million volume indicate strong market interest and potential upward movement.
Smart Money Movement
Early entry at $0.00833 is advised as momentum and market structure align, suggesting significant upward potential.$MITO
#BinanceRestores28FiatWithdrawals #ETHFalls16.1%InOctober #BitcoinClosesAbove50WeekMAFor7thStraightWeek #IndiaRBIAndFIUReviewOverseasCryptoCards #SolanaMobileRemovesMaliciousSKRClaimApp
0.0081
+4.76%
MITO shows potential for gains with strong breakout momentum and market interest, though resistance challenges persist.$MITO
Data source:
Square
73.2% bullish
26.8% bearish
Key Support Level Stability
MITO's price stability around $0.00800 suggests potential for sustained rally, especially if it breaks above $0.00825 resistance.
Strong Breakout Momentum
Recent 8.68% price increase and 120.77 million volume indicate strong market interest and potential upward movement.
Smart Money Movement
Early entry at $0.00833 is advised as momentum and market structure align, suggesting significant upward potential.$MITO
#BinanceRestores28FiatWithdrawals #ETHFalls16.1%InOctober #BitcoinClosesAbove50WeekMAFor7thStraightWeek #IndiaRBIAndFIUReviewOverseasCryptoCards #SolanaMobileRemovesMaliciousSKRClaimApp
1
149

·
--
Bullish
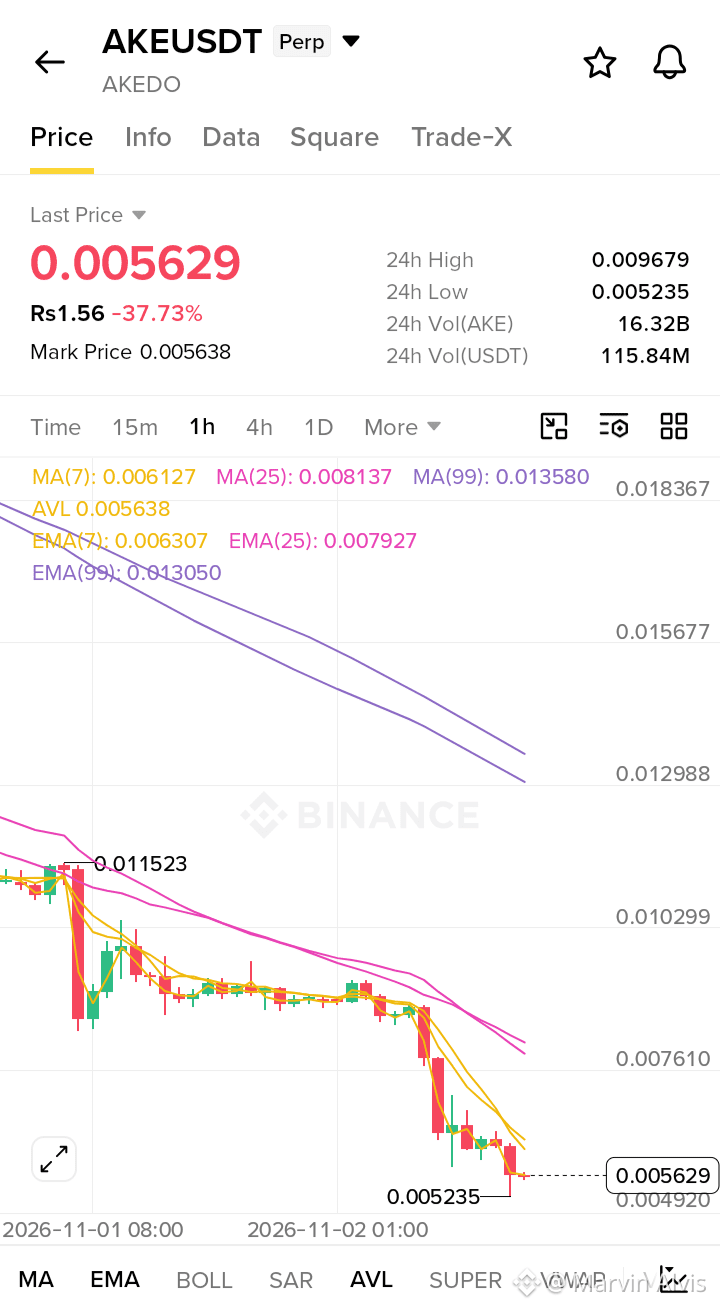
AKEUSDT (Akedo - Perpetual)
Current Price: 0.005629 USDT (-37.73%)
Market Overview & Price Action:
AKEUSDT is experiencing severe capitulation, posting a massive intraday drawdown of nearly 38%. The asset has broken down from a consolidation range near 0.011523 and is currently trending below all major moving averages. The price is pinned near the 24h low of 0.005235, indicating intense selling pressure and a lack of immediate bid-side liquidity.
Technical Levels:
· Resistance: The overhead resistance is significant. The MA(7) at 0.006127 is the first level to reclaim for any relief rally. The MA(25) at 0.008137 represents a major supply zone.
· Support: Price is testing the 24h low of 0.005235. Below this, there is limited technical structure, making the 0.005000 psychological level the next potential downside target.
Fundamentals & Derivatives Data:
Derivatives data reflects extreme panic. The 24h volume is elevated at 16.32B AKE (115.84M USDT), typical of a liquidation cascade. The Mark Price (0.005638) is slightly above the Last Price, suggesting a minor divergence. With the price trading far below the EMA(99) at 0.013050, the long-term trend remains firmly bearish.
Scenarios:
· Bullish (Relief Rally): Oversold conditions could trigger a short-covering bounce. Reclaiming 0.006127 (MA7) would be the first sign of stabilization, targeting 0.007610.
· Bearish: If selling pressure persists and breaks the 0.005235 low, the asset faces a "price discovery" phase to the downside, likely testing 0.005000. Funding rates are likely deeply negative, suggesting heavy short positioning that could lead to volatility.
$AKE
{future}(AKEUSDT)
#BrazilVirtualAssetLicenseDeadlineDrawsAbout40Firms #SolanaMobileRemovesMaliciousSKRClaimApp #BitcoinClosesAbove50WeekMAFor7thStraightWeek #ETHFalls16.1%InOctober #BinanceRestores28FiatWithdrawals
AKEUSDT (Akedo - Perpetual)
Current Price: 0.005629 USDT (-37.73%)
Market Overview & Price Action:
AKEUSDT is experiencing severe capitulation, posting a massive intraday drawdown of nearly 38%. The asset has broken down from a consolidation range near 0.011523 and is currently trending below all major moving averages. The price is pinned near the 24h low of 0.005235, indicating intense selling pressure and a lack of immediate bid-side liquidity.
Technical Levels:
· Resistance: The overhead resistance is significant. The MA(7) at 0.006127 is the first level to reclaim for any relief rally. The MA(25) at 0.008137 represents a major supply zone.
· Support: Price is testing the 24h low of 0.005235. Below this, there is limited technical structure, making the 0.005000 psychological level the next potential downside target.
Fundamentals & Derivatives Data:
Derivatives data reflects extreme panic. The 24h volume is elevated at 16.32B AKE (115.84M USDT), typical of a liquidation cascade. The Mark Price (0.005638) is slightly above the Last Price, suggesting a minor divergence. With the price trading far below the EMA(99) at 0.013050, the long-term trend remains firmly bearish.
Scenarios:
· Bullish (Relief Rally): Oversold conditions could trigger a short-covering bounce. Reclaiming 0.006127 (MA7) would be the first sign of stabilization, targeting 0.007610.
· Bearish: If selling pressure persists and breaks the 0.005235 low, the asset faces a "price discovery" phase to the downside, likely testing 0.005000. Funding rates are likely deeply negative, suggesting heavy short positioning that could lead to volatility.
$AKE
#BrazilVirtualAssetLicenseDeadlineDrawsAbout40Firms #SolanaMobileRemovesMaliciousSKRClaimApp #BitcoinClosesAbove50WeekMAFor7thStraightWeek #ETHFalls16.1%InOctober #BinanceRestores28FiatWithdrawals
Current Price: 0.005629 USDT (-37.73%)
Market Overview & Price Action:
AKEUSDT is experiencing severe capitulation, posting a massive intraday drawdown of nearly 38%. The asset has broken down from a consolidation range near 0.011523 and is currently trending below all major moving averages. The price is pinned near the 24h low of 0.005235, indicating intense selling pressure and a lack of immediate bid-side liquidity.
Technical Levels:
· Resistance: The overhead resistance is significant. The MA(7) at 0.006127 is the first level to reclaim for any relief rally. The MA(25) at 0.008137 represents a major supply zone.
· Support: Price is testing the 24h low of 0.005235. Below this, there is limited technical structure, making the 0.005000 psychological level the next potential downside target.
Fundamentals & Derivatives Data:
Derivatives data reflects extreme panic. The 24h volume is elevated at 16.32B AKE (115.84M USDT), typical of a liquidation cascade. The Mark Price (0.005638) is slightly above the Last Price, suggesting a minor divergence. With the price trading far below the EMA(99) at 0.013050, the long-term trend remains firmly bearish.
Scenarios:
· Bullish (Relief Rally): Oversold conditions could trigger a short-covering bounce. Reclaiming 0.006127 (MA7) would be the first sign of stabilization, targeting 0.007610.
· Bearish: If selling pressure persists and breaks the 0.005235 low, the asset faces a "price discovery" phase to the downside, likely testing 0.005000. Funding rates are likely deeply negative, suggesting heavy short positioning that could lead to volatility.
$AKE
#BrazilVirtualAssetLicenseDeadlineDrawsAbout40Firms #SolanaMobileRemovesMaliciousSKRClaimApp #BitcoinClosesAbove50WeekMAFor7thStraightWeek #ETHFalls16.1%InOctober #BinanceRestores28FiatWithdrawals
1
1
388
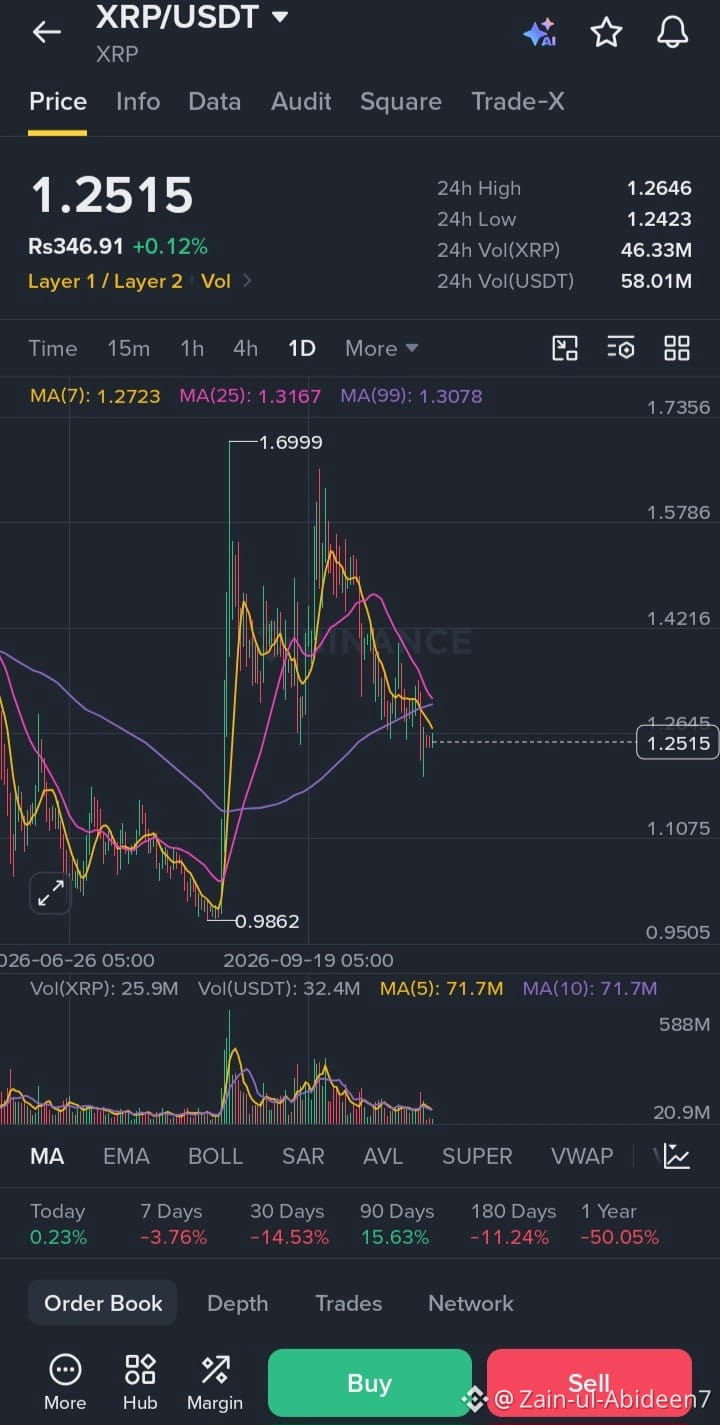
$XRP could rise back to $3.50 if the crypto market turns bullish, institutional demand increases, and Ripple's adoption continues to grow. �
Reaching $3.50 is possible, but $XRP would need strong buying pressure and positive market sentiment to overcome resistance levels.
My view: $3.50 is a possible bullish target, not a guarantee—monitor market trends and manage your risk before investing.#ETHFalls16.1%InOctober #BinanceRestores28FiatWithdrawals
{spot}(XRPUSDT)
$XRP could rise back to $3.50 if the crypto market turns bullish, institutional demand increases, and Ripple's adoption continues to grow. �
Reaching $3.50 is possible, but $XRP would need strong buying pressure and positive market sentiment to overcome resistance levels.
My view: $3.50 is a possible bullish target, not a guarantee—monitor market trends and manage your risk before investing.#ETHFalls16.1%InOctober #BinanceRestores28FiatWithdrawals
Reaching $3.50 is possible, but $XRP would need strong buying pressure and positive market sentiment to overcome resistance levels.
My view: $3.50 is a possible bullish target, not a guarantee—monitor market trends and manage your risk before investing.#ETHFalls16.1%InOctober #BinanceRestores28FiatWithdrawals
123

·
--
Buyers need to defend the $4
{future}(4USDT)
#BinanceRestores28FiatWithdrawals #ETHFalls16.1%InOctober #BitcoinClosesAbove50WeekMAFor7thStraightWeek .10–$4.13 area and reclaim nearby intraday resistance. The broader short-term structure remains weak, so avoid chasing a bounce without confirmation.
EP: $4.10–$4.16
TP1: $4.25
TP2: $4.39
TP3: $4.57
SL: $3.98
The $4.13 area is the immediate decision zone, with resistance near $4.39 and further liquidity around $4.57. A sustained break below $4.00 would weaken the recovery setup; reclaiming $4.39 would strengthen bullish momentum.
Buyers need to defend the $4
#BinanceRestores28FiatWithdrawals #ETHFalls16.1%InOctober #BitcoinClosesAbove50WeekMAFor7thStraightWeek .10–$4 .13 area and reclaim nearby intraday resistance. The broader short-term structure remains weak, so avoid chasing a bounce without confirmation.
EP: $4 .10–$4 .16
TP1: $4 .25
TP2: $4 .39
TP3: $4 .57
SL: $3.98
The $4 .13 area is the immediate decision zone, with resistance near $4 .39 and further liquidity around $4 .57. A sustained break below $4 .00 would weaken the recovery setup; reclaiming $4 .39 would strengthen bullish momentum.
#BinanceRestores28FiatWithdrawals #ETHFalls16.1%InOctober #BitcoinClosesAbove50WeekMAFor7thStraightWeek .10–$4 .13 area and reclaim nearby intraday resistance. The broader short-term structure remains weak, so avoid chasing a bounce without confirmation.
EP: $4 .10–$4 .16
TP1: $4 .25
TP2: $4 .39
TP3: $4 .57
SL: $3.98
The $4 .13 area is the immediate decision zone, with resistance near $4 .39 and further liquidity around $4 .57. A sustained break below $4 .00 would weaken the recovery setup; reclaiming $4 .39 would strengthen bullish momentum.
6
·
--
Bullish
$FET is showing a bearish pullback short setup after long liquidations near $0.1585.
The broader trend remains bearish, and buyers have not yet reclaimed the key resistance zone. A relief bounce toward $0.161–$0.165 may attract sellers if momentum stalls.
EP: $0.1605–$0.1645
TP1: $0.1589
TP2: $0.1516
TP3: $0.1472
SL: $0.1675
The $0.1589 area is nearby support, while $0.1648–$0.1655 is the key resistance band. A breakdown could expose lower liquidity near $0.1516; a sustained move above $0.1675 invalidates the shor
#BinanceRestores28FiatWithdrawals #ETHFalls16.1%InOctober #BitcoinClosesAbove50WeekMAFor7thStraightWeek
$FET is showing a bearish pullback short setup after long liquidations near $0.1585.
The broader trend remains bearish, and buyers have not yet reclaimed the key resistance zone. A relief bounce toward $0.161–$0.165 may attract sellers if momentum stalls.
EP: $0.1605–$0.1645
TP1: $0.1589
TP2: $0.1516
TP3: $0.1472
SL: $0.1675
The $0.1589 area is nearby support, while $0.1648–$0.1655 is the key resistance band. A breakdown could expose lower liquidity near $0.1516; a sustained move above $0.1675 invalidates the shor
#BinanceRestores28FiatWithdrawals #ETHFalls16.1%InOctober #BitcoinClosesAbove50WeekMAFor7thStraightWeek
The broader trend remains bearish, and buyers have not yet reclaimed the key resistance zone. A relief bounce toward $0.161–$0.165 may attract sellers if momentum stalls.
EP: $0.1605–$0.1645
TP1: $0.1589
TP2: $0.1516
TP3: $0.1472
SL: $0.1675
The $0.1589 area is nearby support, while $0.1648–$0.1655 is the key resistance band. A breakdown could expose lower liquidity near $0.1516; a sustained move above $0.1675 invalidates the shor
#BinanceRestores28FiatWithdrawals #ETHFalls16.1%InOctober #BitcoinClosesAbove50WeekMAFor7thStraightWeek
11

🚀 JST/USDT Market Analysis: Bullish Momentum Builds
$JST
{spot}(JSTUSDT)
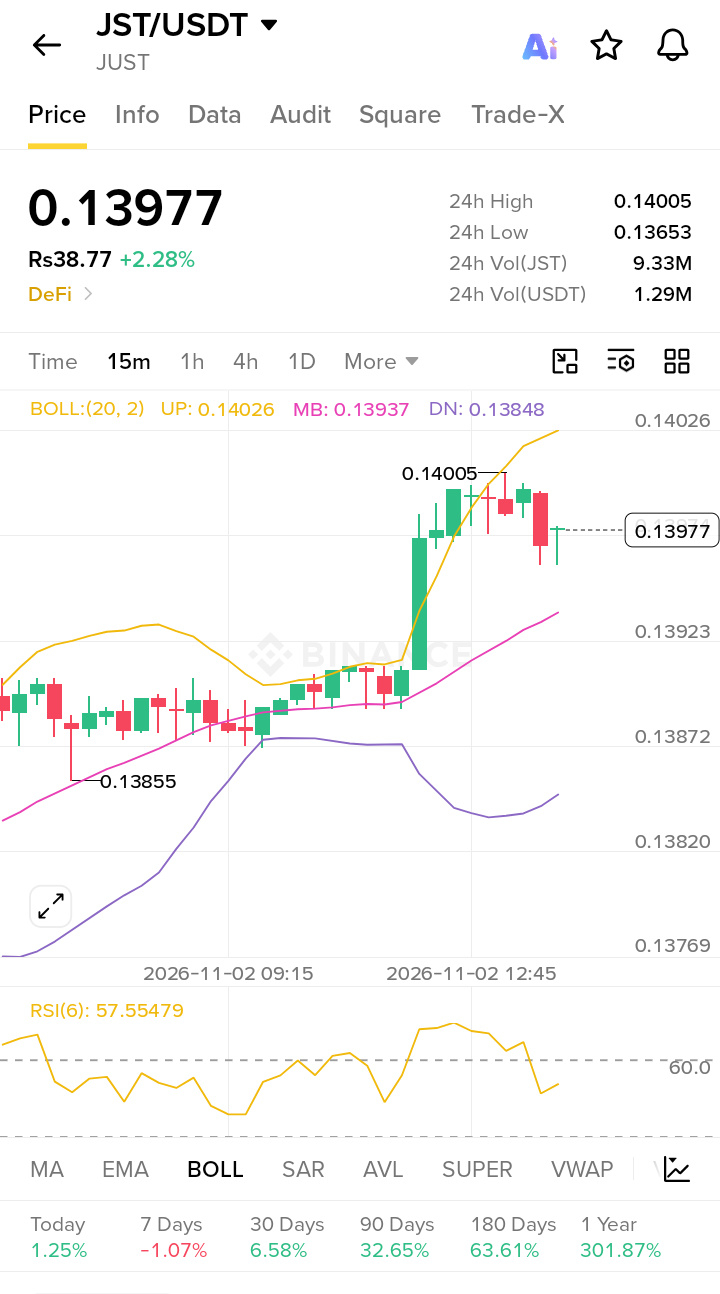
The DeFi sector is heating up, and JUST (JST) is showing impressive relative strength. Currently trading at $0.13977 (+2.28%), JST has successfully reclaimed key moving averages. Here is a deep dive into the drivers behind this pump and the technical levels to watch.
🐋 On-Chain & Macro Drivers
While the chart shows immediate price action, the underlying strength is fueled by broader market sentiment. Whale accumulation in DeFi blue chips is on the rise, and with spot ETF inflows stabilizing the broader crypto market, capital is rotating into high-yield DeFi tokens. This liquidity injection is providing the necessary fuel for JST’s breakout.
📈 Technical Breakout Levels
The 15-minute chart reveals a classic bullish breakout from a consolidation range.
· Key Resistance: The immediate barrier is the 24h high at $0.14005. A decisive 15m candle close above this level opens the door to price discovery.
· Key Support: The BOLL Middle Band (MB) at $0.13937is acting as dynamic support. The lower band (DN) at $0.13848 serves as a strong safety net.
· Indicator Check: RSI(6) is at 57.55, indicating healthy momentum with room to grow before hitting overbought territory (70+).
🔥 Derivatives & Liquidations
The recent price spike likely triggered a wave of short liquidations. As price pushed past the $0.139 area, sellers were forced to cover, adding buying pressure. If JST holds above the upper Bollinger Band ($0.14026), we could see a short squeeze targeting higher levels.
🎯 Key Targets
· Target 1: $0.1450
· Target 2: $0.1520
Please don’t forget to like, follow, and share! 🩸 Thank you so much ❤️
#BinanceRestores28FiatWithdrawals #ETHFalls16.1%InOctober #BitcoinClosesAbove50WeekMAFor7thStraightWeek #HongKongEnablesRoundTheClockTokenizedSettlement
🚀 JST/USDT Market Analysis: Bullish Momentum Builds
$JST
The DeFi sector is heating up, and JUST (JST) is showing impressive relative strength. Currently trading at $0.13977 (+2.28%), JST has successfully reclaimed key moving averages. Here is a deep dive into the drivers behind this pump and the technical levels to watch.
🐋 On-Chain & Macro Drivers
While the chart shows immediate price action, the underlying strength is fueled by broader market sentiment. Whale accumulation in DeFi blue chips is on the rise, and with spot ETF inflows stabilizing the broader crypto market, capital is rotating into high-yield DeFi tokens. This liquidity injection is providing the necessary fuel for JST’s breakout.
📈 Technical Breakout Levels
The 15-minute chart reveals a classic bullish breakout from a consolidation range.
· Key Resistance: The immediate barrier is the 24h high at $0.14005. A decisive 15m candle close above this level opens the door to price discovery.
· Key Support: The BOLL Middle Band (MB) at $0.13937is acting as dynamic support. The lower band (DN) at $0.13848 serves as a strong safety net.
· Indicator Check: RSI(6) is at 57.55, indicating healthy momentum with room to grow before hitting overbought territory (70+).
🔥 Derivatives & Liquidations
The recent price spike likely triggered a wave of short liquidations. As price pushed past the $0.139 area, sellers were forced to cover, adding buying pressure. If JST holds above the upper Bollinger Band ($0.14026), we could see a short squeeze targeting higher levels.
🎯 Key Targets
· Target 1: $0.1450
· Target 2: $0.1520
Please don’t forget to like, follow, and share! 🩸 Thank you so much ❤️
#BinanceRestores28FiatWithdrawals #ETHFalls16.1%InOctober #BitcoinClosesAbove50WeekMAFor7thStraightWeek #HongKongEnablesRoundTheClockTokenizedSettlement
$JST
The DeFi sector is heating up, and JUST (JST) is showing impressive relative strength. Currently trading at $0.13977 (+2.28%), JST has successfully reclaimed key moving averages. Here is a deep dive into the drivers behind this pump and the technical levels to watch.
🐋 On-Chain & Macro Drivers
While the chart shows immediate price action, the underlying strength is fueled by broader market sentiment. Whale accumulation in DeFi blue chips is on the rise, and with spot ETF inflows stabilizing the broader crypto market, capital is rotating into high-yield DeFi tokens. This liquidity injection is providing the necessary fuel for JST’s breakout.
📈 Technical Breakout Levels
The 15-minute chart reveals a classic bullish breakout from a consolidation range.
· Key Resistance: The immediate barrier is the 24h high at $0.14005. A decisive 15m candle close above this level opens the door to price discovery.
· Key Support: The BOLL Middle Band (MB) at $0.13937is acting as dynamic support. The lower band (DN) at $0.13848 serves as a strong safety net.
· Indicator Check: RSI(6) is at 57.55, indicating healthy momentum with room to grow before hitting overbought territory (70+).
🔥 Derivatives & Liquidations
The recent price spike likely triggered a wave of short liquidations. As price pushed past the $0.139 area, sellers were forced to cover, adding buying pressure. If JST holds above the upper Bollinger Band ($0.14026), we could see a short squeeze targeting higher levels.
🎯 Key Targets
· Target 1: $0.1450
· Target 2: $0.1520
Please don’t forget to like, follow, and share! 🩸 Thank you so much ❤️
#BinanceRestores28FiatWithdrawals #ETHFalls16.1%InOctober #BitcoinClosesAbove50WeekMAFor7thStraightWeek #HongKongEnablesRoundTheClockTokenizedSettlement
6
Log in to explore more content
Join global crypto users on Binance Square
⚡️ Get latest and useful information about crypto.
💬 Trusted by the world’s largest crypto exchange.
👍 Discover real insights from verified creators.
Email / Phone number
Trending Topics
1
#BinanceRestores28FiatWithdrawals
13,568 views
343 Discussing
2
#BinanceProcesses$4.65BWithdrawals
67,375 views
294 Discussing
3
#ETHFalls16.1%InOctober
2,851 views
114 Discussing
4
#BitcoinClosesAbove50WeekMAFor7thStraightWeek
5,089 views
131 Discussing
5
#HongKongEnablesRoundTheClockTokenizedSettlement
5 views
6 Discussing
6
#IndiaRBIAndFIUReviewOverseasCryptoCards
571 views
29 Discussing
7
#BitcoinSpotETFsPost$203MWeeklyOutflow
6,478 views
45 Discussing
8
#SouthKoreanLawmakerProposesReviewOfAllListedDigitalAssets
2,211 views
51 Discussing
9
#SolanaMobileRemovesMaliciousSKRClaimApp
4,380 views
111 Discussing
10
#BrazilVirtualAssetLicenseDeadlineDrawsAbout40Firms
40,190 views
599 Discussing