

#nasdaqdowweeklygapwidestsincejuly2002
nasdaqdowweeklygapwidestsincejuly2002
Hot
Latest

·
--
Bullish
#nasdaqdowweeklygapwidestsincejuly2002
🚨 WALL STREET RED FLAG: TECH IS BLEEDING, BLUE CHIPS ARE HOLDING. 🚨
We just witnessed something that hasn't happened in 24 YEARS:
$NEAR
{future}(NEARUSDT)
📉 Nasdaq Composite: -4.48%
🔻 Nasdaq-100: -5.50%
🟢 Dow Jones: +0.68%
That’s a >5% weekly performance gap—the widest divergence between tech and legacy stocks since July 2002.
🔥 THE TAKEAWAY:
1️⃣ Great Tech Rotation: Capital is fleeing high-valuation Tech/AI growth stocks and rushing into safe-haven Blue-Chips.
2️⃣ Crypto Risk-Off Alert: When tech dumps, liquidity usually tightens across all risk assets (including $BTC and $ETH).
3️⃣ Decoupling Watch: Can Crypto hold its ground, or will the TradFi selloff spill over into digital assets next?
$INJ
{future}(INJUSDT)
👇 VOTE BELOW:
🔴 A) Healthy tech correction before new ATHs
🔵 B) Start of a broader macro risk-off dump
$FIL
{future}(FILUSDT)
#NASDAQ #Nasdaq100Falls5.5%InWorstWeekIn18Months #StrategySharesFall9%OnFriday #USPPIRises6.3%YearOverYear
#nasdaqdowweeklygapwidestsincejuly2002
🚨 WALL STREET RED FLAG: TECH IS BLEEDING, BLUE CHIPS ARE HOLDING. 🚨
We just witnessed something that hasn't happened in 24 YEARS:
$NEAR
📉 Nasdaq Composite: -4.48%
🔻 Nasdaq-100: -5.50%
🟢 Dow Jones: +0.68%
That’s a >5% weekly performance gap—the widest divergence between tech and legacy stocks since July 2002.
🔥 THE TAKEAWAY:
1️⃣ Great Tech Rotation: Capital is fleeing high-valuation Tech/AI growth stocks and rushing into safe-haven Blue-Chips.
2️⃣ Crypto Risk-Off Alert: When tech dumps, liquidity usually tightens across all risk assets (including $BTC and $ETH).
3️⃣ Decoupling Watch: Can Crypto hold its ground, or will the TradFi selloff spill over into digital assets next?
$INJ
👇 VOTE BELOW:
🔴 A) Healthy tech correction before new ATHs
🔵 B) Start of a broader macro risk-off dump
$FIL
#NASDAQ #Nasdaq100Falls5.5%InWorstWeekIn18Months #StrategySharesFall9%OnFriday #USPPIRises6.3%YearOverYear
🚨 WALL STREET RED FLAG: TECH IS BLEEDING, BLUE CHIPS ARE HOLDING. 🚨
We just witnessed something that hasn't happened in 24 YEARS:
$NEAR
📉 Nasdaq Composite: -4.48%
🔻 Nasdaq-100: -5.50%
🟢 Dow Jones: +0.68%
That’s a >5% weekly performance gap—the widest divergence between tech and legacy stocks since July 2002.
🔥 THE TAKEAWAY:
1️⃣ Great Tech Rotation: Capital is fleeing high-valuation Tech/AI growth stocks and rushing into safe-haven Blue-Chips.
2️⃣ Crypto Risk-Off Alert: When tech dumps, liquidity usually tightens across all risk assets (including $BTC and $ETH).
3️⃣ Decoupling Watch: Can Crypto hold its ground, or will the TradFi selloff spill over into digital assets next?
$INJ
👇 VOTE BELOW:
🔴 A) Healthy tech correction before new ATHs
🔵 B) Start of a broader macro risk-off dump
$FIL
#NASDAQ #Nasdaq100Falls5.5%InWorstWeekIn18Months #StrategySharesFall9%OnFriday #USPPIRises6.3%YearOverYear
2
587
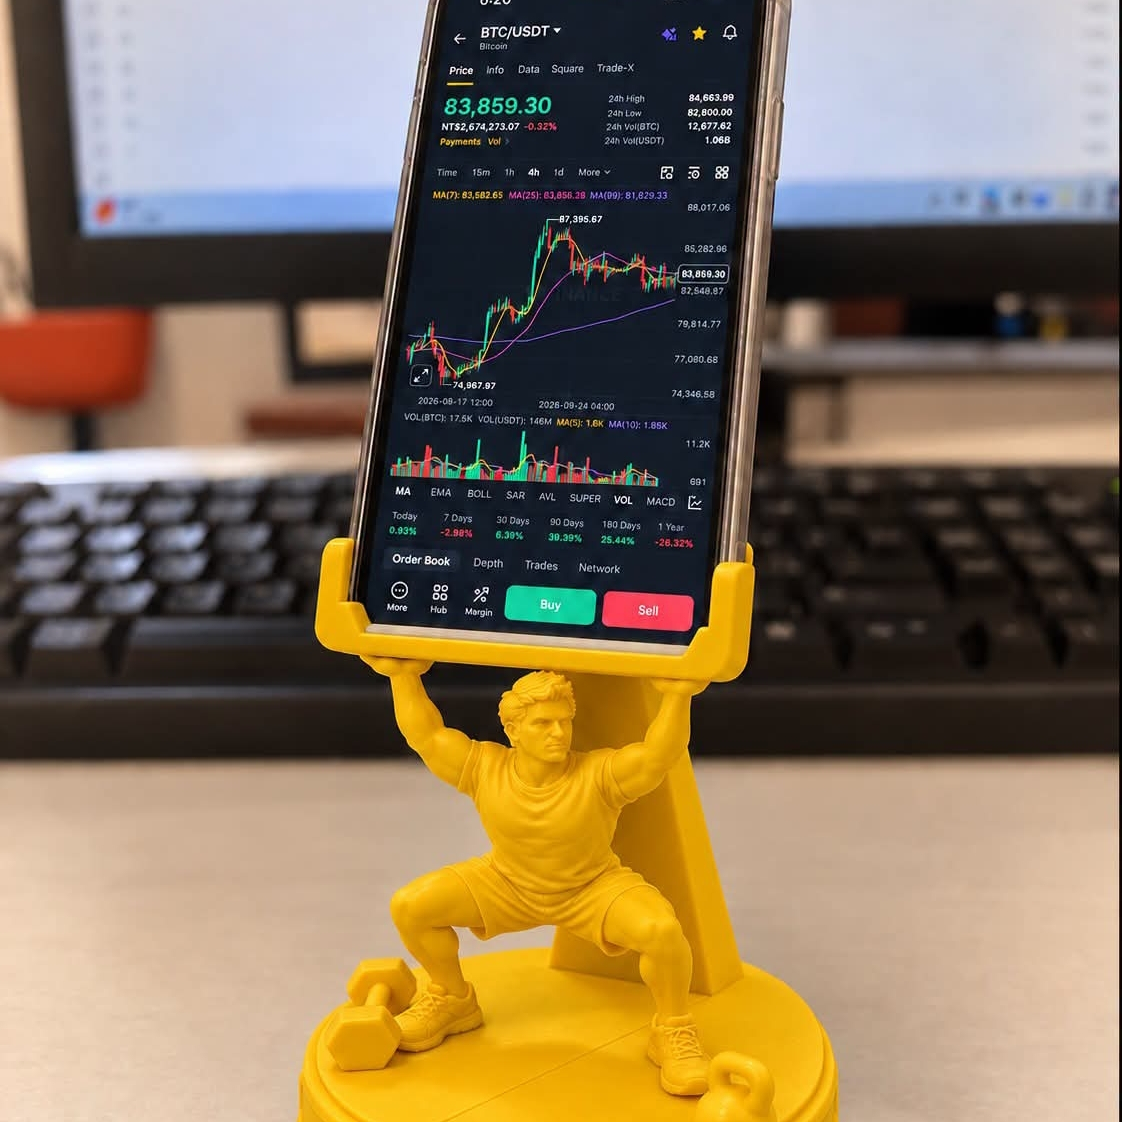
#NasdaqDowWeeklyGapWidestSinceJuly2002
🚨The US stock market just sent a major warning signal.
📉 Nasdaq Composite: −4.48%
🔻 Nasdaq-100: −5.5%
🟢 Dow Jones: +0.68%
The weekly performance gap exceeded 5 percentage points, reportedly reaching its widest extreme since July 2002.
👀 WHAT DOES THIS SIGNAL?
- Tech stocks are facing intense selling pressure.
- Blue-chip stocks are showing relative resilience.
- Investors may be shifting away from high-growth tech exposure.
₿ WHY CRYPTO TRADERS SHOULD CARE
If tech weakness spreads across risk assets, Bitcoin and altcoins could face additional pressure. However, crypto can move independently, so confirmation from BTC price action and liquidity is essential.
WATCH NEXT: Can Nasdaq stabilize, or will selling pressure spread further?
💬 Is this a temporary tech correction or the start of a broader risk-off move?
#Nasdaq #StockMarket #Bitcoin #CryptoMarkets
$BTC $QQQ
#NasdaqDowWeeklyGapWidestSinceJuly2002
🚨The US stock market just sent a major warning signal.
📉 Nasdaq Composite: −4.48%
🔻 Nasdaq-100: −5.5%
🟢 Dow Jones: +0.68%
The weekly performance gap exceeded 5 percentage points, reportedly reaching its widest extreme since July 2002.
👀 WHAT DOES THIS SIGNAL?
- Tech stocks are facing intense selling pressure.
- Blue-chip stocks are showing relative resilience.
- Investors may be shifting away from high-growth tech exposure.
₿ WHY CRYPTO TRADERS SHOULD CARE
If tech weakness spreads across risk assets, Bitcoin and altcoins could face additional pressure. However, crypto can move independently, so confirmation from BTC price action and liquidity is essential.
WATCH NEXT: Can Nasdaq stabilize, or will selling pressure spread further?
💬 Is this a temporary tech correction or the start of a broader risk-off move?
#Nasdaq #StockMarket #Bitcoin #CryptoMarkets
$BTC $QQQ
🚨The US stock market just sent a major warning signal.
📉 Nasdaq Composite: −4.48%
🔻 Nasdaq-100: −5.5%
🟢 Dow Jones: +0.68%
The weekly performance gap exceeded 5 percentage points, reportedly reaching its widest extreme since July 2002.
👀 WHAT DOES THIS SIGNAL?
- Tech stocks are facing intense selling pressure.
- Blue-chip stocks are showing relative resilience.
- Investors may be shifting away from high-growth tech exposure.
₿ WHY CRYPTO TRADERS SHOULD CARE
If tech weakness spreads across risk assets, Bitcoin and altcoins could face additional pressure. However, crypto can move independently, so confirmation from BTC price action and liquidity is essential.
WATCH NEXT: Can Nasdaq stabilize, or will selling pressure spread further?
💬 Is this a temporary tech correction or the start of a broader risk-off move?
#Nasdaq #StockMarket #Bitcoin #CryptoMarkets
$BTC $QQQ
1
3
32

·
--
#NasdaqDowWeeklyGapWidestSinceJuly2002
📉 This week the Dow posted a modest gain of ~0.7%, while the Nasdaq declined approximately 4.5% — the widest weekly performance gap between the two indices since July 2002.
The move reflects a clear rotation from mega-cap tech and AI-related stocks into broader market and value sectors.
Such rare divergences often signal a shift in market leadership or rising caution. After an extended AI-driven rally, tech’s relative strength is being tested. For crypto markets, this may translate into near-term risk-off pressure, though meaningful rotations can later present selective opportunities. Monitoring Nasdaq stability will be key. NFA.
#Stocks #Nasdaq #Dow #MarketRotation #Crypto #BinanceSquare
#NasdaqDowWeeklyGapWidestSinceJuly2002
📉 This week the Dow posted a modest gain of ~0.7%, while the Nasdaq declined approximately 4.5% — the widest weekly performance gap between the two indices since July 2002.
The move reflects a clear rotation from mega-cap tech and AI-related stocks into broader market and value sectors.
Such rare divergences often signal a shift in market leadership or rising caution. After an extended AI-driven rally, tech’s relative strength is being tested. For crypto markets, this may translate into near-term risk-off pressure, though meaningful rotations can later present selective opportunities. Monitoring Nasdaq stability will be key. NFA.
#Stocks #Nasdaq #Dow #MarketRotation #Crypto #BinanceSquare
📉 This week the Dow posted a modest gain of ~0.7%, while the Nasdaq declined approximately 4.5% — the widest weekly performance gap between the two indices since July 2002.
The move reflects a clear rotation from mega-cap tech and AI-related stocks into broader market and value sectors.
Such rare divergences often signal a shift in market leadership or rising caution. After an extended AI-driven rally, tech’s relative strength is being tested. For crypto markets, this may translate into near-term risk-off pressure, though meaningful rotations can later present selective opportunities. Monitoring Nasdaq stability will be key. NFA.
#Stocks #Nasdaq #Dow #MarketRotation #Crypto #BinanceSquare
1
41

·
--
#NasdaqDowWeeklyGapWidestSinceJuly2002
History repeats itself — where are traders headed?
A stunning divergence just unfolded! The weekly performance gap between Nasdaq and Dow widened to a record — the widest since July 2002 (Dot-com era). While traditional sectors and banks held up the Dow, the Nasdaq took a 5.5% beating amid AI infrastructure debt worries and Brent crude surging past $110.
Traditional money is fleeing for safe havens — but crypto is different. Bitcoin remains resilient, holding firmly around $80K. A powerful testament to its status as an independent asset.
What should traders do?
Opportunity lies where panic strikes. Get your funds ready to snap up quality assets at bargain prices.
Not financial advice.
Click below to trade and support me:
$BTC · 81,659.82 · -0.71%
$DIA · 0.1623 · -3.16%
$QQQB · 711.87 · -2.25%
#MarketDivergence #TechCrash #CryptoVsStocks #BinanceTrading
#NasdaqDowWeeklyGapWidestSinceJuly2002
History repeats itself — where are traders headed?
A stunning divergence just unfolded! The weekly performance gap between Nasdaq and Dow widened to a record — the widest since July 2002 (Dot-com era). While traditional sectors and banks held up the Dow, the Nasdaq took a 5.5% beating amid AI infrastructure debt worries and Brent crude surging past $110.
Traditional money is fleeing for safe havens — but crypto is different. Bitcoin remains resilient, holding firmly around $80K. A powerful testament to its status as an independent asset.
What should traders do?
Opportunity lies where panic strikes. Get your funds ready to snap up quality assets at bargain prices.
Not financial advice.
Click below to trade and support me:
$BTC · 81,659.82 · -0.71%
$DIA · 0.1623 · -3.16%
$QQQB · 711.87 · -2.25%
#MarketDivergence #TechCrash #CryptoVsStocks #BinanceTrading
History repeats itself — where are traders headed?
A stunning divergence just unfolded! The weekly performance gap between Nasdaq and Dow widened to a record — the widest since July 2002 (Dot-com era). While traditional sectors and banks held up the Dow, the Nasdaq took a 5.5% beating amid AI infrastructure debt worries and Brent crude surging past $110.
Traditional money is fleeing for safe havens — but crypto is different. Bitcoin remains resilient, holding firmly around $80K. A powerful testament to its status as an independent asset.
What should traders do?
Opportunity lies where panic strikes. Get your funds ready to snap up quality assets at bargain prices.
Not financial advice.
Click below to trade and support me:
$BTC · 81,659.82 · -0.71%
$DIA · 0.1623 · -3.16%
$QQQB · 711.87 · -2.25%
#MarketDivergence #TechCrash #CryptoVsStocks #BinanceTrading
1
46

·
--
#NasdaqDowWeeklyGapWidestSinceJuly2002
🔀 Dow Up, Nasdaq Down: The Biggest Split in 24 Years
📅 Week ended Oct 16: the Dow rose 0.7% to 52,002 while the Nasdaq fell 4.5% to 26,140.
📊 That roughly 5-point gap is the widest weekly Dow vs Nasdaq split since July 2002.
📉 S&P 500 lost about 2% to 7,659; the VanEck chip ETF dropped 10%, its worst week since April 2025.
⚠️ CoreWeave led the rout, down about 25% on the week as its debt reached $51B.
🔍 Money rotated out of debt-funded AI names and into blue chips; VIX topped 22 for the first time since June.
What it means for crypto: $BTC held near $81.7K through the selloff, but rotation away from high-beta assets is usually a headwind, not a tailwind. The Fed decision on Oct 27–28 is the next big test.
Is this a healthy rotation or the start of a broader risk-off? 👇
$BTC $ETH
#NasdaqDowWeeklyGapWidestSinceJuly2002 #CryptoNews #Macro #Stocks
#NasdaqDowWeeklyGapWidestSinceJuly2002
🔀 Dow Up, Nasdaq Down: The Biggest Split in 24 Years
📅 Week ended Oct 16: the Dow rose 0.7% to 52,002 while the Nasdaq fell 4.5% to 26,140.
📊 That roughly 5-point gap is the widest weekly Dow vs Nasdaq split since July 2002.
📉 S&P 500 lost about 2% to 7,659; the VanEck chip ETF dropped 10%, its worst week since April 2025.
⚠️ CoreWeave led the rout, down about 25% on the week as its debt reached $51B.
🔍 Money rotated out of debt-funded AI names and into blue chips; VIX topped 22 for the first time since June.
What it means for crypto: $BTC held near $81.7K through the selloff, but rotation away from high-beta assets is usually a headwind, not a tailwind. The Fed decision on Oct 27–28 is the next big test.
Is this a healthy rotation or the start of a broader risk-off? 👇
$BTC $ETH
#NasdaqDowWeeklyGapWidestSinceJuly2002 #CryptoNews #Macro #Stocks
🔀 Dow Up, Nasdaq Down: The Biggest Split in 24 Years
📅 Week ended Oct 16: the Dow rose 0.7% to 52,002 while the Nasdaq fell 4.5% to 26,140.
📊 That roughly 5-point gap is the widest weekly Dow vs Nasdaq split since July 2002.
📉 S&P 500 lost about 2% to 7,659; the VanEck chip ETF dropped 10%, its worst week since April 2025.
⚠️ CoreWeave led the rout, down about 25% on the week as its debt reached $51B.
🔍 Money rotated out of debt-funded AI names and into blue chips; VIX topped 22 for the first time since June.
What it means for crypto: $BTC held near $81.7K through the selloff, but rotation away from high-beta assets is usually a headwind, not a tailwind. The Fed decision on Oct 27–28 is the next big test.
Is this a healthy rotation or the start of a broader risk-off? 👇
$BTC $ETH
#NasdaqDowWeeklyGapWidestSinceJuly2002 #CryptoNews #Macro #Stocks
28

·
--
Bullish
#NasdaqDowWeeklyGapWidestSinceJuly2002
🚨 WALL STREET’S BIGGEST NASDAQ–DOW GAP SINCE 2002?
📉 A historic market divergence is grabbing attention!
The US stock market just delivered a striking split:
🔴 Nasdaq Composite: Down approximately 4.5% for the week
🟢 Dow Jones: Up approximately 0.7% for the week
📊 S&P 500: Lost around 1.9%
Source: October 16, 2026, weekly market data. [1]
🔥 What’s driving the gap?
• AI-related stocks face growing concerns about debt and profitability. • Semiconductor stocks are under heavy selling pressure. • Hotter inflation data is raising concerns about interest rates. • Investors are rotating toward more defensive sectors.
💡 Why it matters: The divergence suggests that investors are becoming more selective rather than selling every part of the market equally. The next earnings reports and Federal Reserve signals co Amiuld influence whether this gap widens or narrows.
⚠️ Market outlook: Cautious for technology stocks in the near term, but one difficult week does not confirm a long-term bearish trend.
👇 Your view: Will tech stocks recover, or is more downside ahead?
#Nasdaq #DowJones #StockMarket #AIStocks #WallStreet #MarketNews #Inflation #Investing
$TIA $PUMP $JPMB
{spot}(PUMPUSDT)
{spot}(TIAUSDT)
{spot}(JPMBUSDT)
#NasdaqDowWeeklyGapWidestSinceJuly2002
🚨 WALL STREET’S BIGGEST NASDAQ–DOW GAP SINCE 2002?
📉 A historic market divergence is grabbing attention!
The US stock market just delivered a striking split:
🔴 Nasdaq Composite: Down approximately 4.5% for the week
🟢 Dow Jones: Up approximately 0.7% for the week
📊 S&P 500: Lost around 1.9%
Source: October 16, 2026, weekly market data. [1]
🔥 What’s driving the gap?
• AI-related stocks face growing concerns about debt and profitability. • Semiconductor stocks are under heavy selling pressure. • Hotter inflation data is raising concerns about interest rates. • Investors are rotating toward more defensive sectors.
💡 Why it matters: The divergence suggests that investors are becoming more selective rather than selling every part of the market equally. The next earnings reports and Federal Reserve signals co Amiuld influence whether this gap widens or narrows.
⚠️ Market outlook: Cautious for technology stocks in the near term, but one difficult week does not confirm a long-term bearish trend.
👇 Your view: Will tech stocks recover, or is more downside ahead?
#Nasdaq #DowJones #StockMarket #AIStocks #WallStreet #MarketNews #Inflation #Investing
$TIA $PUMP $JPMB
🚨 WALL STREET’S BIGGEST NASDAQ–DOW GAP SINCE 2002?
📉 A historic market divergence is grabbing attention!
The US stock market just delivered a striking split:
🔴 Nasdaq Composite: Down approximately 4.5% for the week
🟢 Dow Jones: Up approximately 0.7% for the week
📊 S&P 500: Lost around 1.9%
Source: October 16, 2026, weekly market data. [1]
🔥 What’s driving the gap?
• AI-related stocks face growing concerns about debt and profitability. • Semiconductor stocks are under heavy selling pressure. • Hotter inflation data is raising concerns about interest rates. • Investors are rotating toward more defensive sectors.
💡 Why it matters: The divergence suggests that investors are becoming more selective rather than selling every part of the market equally. The next earnings reports and Federal Reserve signals co Amiuld influence whether this gap widens or narrows.
⚠️ Market outlook: Cautious for technology stocks in the near term, but one difficult week does not confirm a long-term bearish trend.
👇 Your view: Will tech stocks recover, or is more downside ahead?
#Nasdaq #DowJones #StockMarket #AIStocks #WallStreet #MarketNews #Inflation #Investing
$TIA $PUMP $JPMB
1
217

·
--
$BTC
{spot}(BTCUSDT)
Crypto market alert! 📊
The Nasdaq–Dow weekly gap is reportedly the widest since July 2002. Could this signal a shift in market sentiment and impact Bitcoin and the broader crypto market? ₿
Stay alert. Watch the trends. Trade responsibly! ⚡
#NasdaqDowWeeklyGapWidestSinceJuly2002 #Bitcoin #BTC #Crypto #BinanceSquare
$BTC
Crypto market alert! 📊
The Nasdaq–Dow weekly gap is reportedly the widest since July 2002. Could this signal a shift in market sentiment and impact Bitcoin and the broader crypto market? ₿
Stay alert. Watch the trends. Trade responsibly! ⚡
#NasdaqDowWeeklyGapWidestSinceJuly2002 #Bitcoin #BTC #Crypto #BinanceSquare
Crypto market alert! 📊
The Nasdaq–Dow weekly gap is reportedly the widest since July 2002. Could this signal a shift in market sentiment and impact Bitcoin and the broader crypto market? ₿
Stay alert. Watch the trends. Trade responsibly! ⚡
#NasdaqDowWeeklyGapWidestSinceJuly2002 #Bitcoin #BTC #Crypto #BinanceSquare
1
141

#NasdaqDowWeeklyGapWidestSinceJuly2002
🚨 is a WARNING for Crypto* 🚨
History repeated.
Nasdaq: *-4.5%*
Dow: *+0.7%*
This 5.15% divergence is the *widest weekly gap since July 2002*. That's 24 years!
Last time we saw this gap? Right before the dot-com bubble popped.
*What's crashing Wall Street?*
Chip bloodbath: Semiconductor index -11.4% this week, 8 straight red days. $NVDA $AMD bleeding.
AI debt panic: CoreWeave -25% this week, $51 BILLION in debt. Who pays for AI?
Money is fleeing high-growth tech to old-economy stocks. Dow finished green while tech crashed.
Tech bleeds first, then crypto feels it.
If AI leaders can't hold, altcoins won't either.
I'm derisking and waiting. Are you buying this dip or holding cash?
#DowJones #crypto #BitcoinDunyamiz #StockMarket
#NasdaqDowWeeklyGapWidestSinceJuly2002
🚨 is a WARNING for Crypto* 🚨
History repeated.
Nasdaq: *-4.5%*
Dow: *+0.7%*
This 5.15% divergence is the *widest weekly gap since July 2002*. That's 24 years!
Last time we saw this gap? Right before the dot-com bubble popped.
*What's crashing Wall Street?*
Chip bloodbath: Semiconductor index -11.4% this week, 8 straight red days. $NVDA $AMD bleeding.
AI debt panic: CoreWeave -25% this week, $51 BILLION in debt. Who pays for AI?
Money is fleeing high-growth tech to old-economy stocks. Dow finished green while tech crashed.
Tech bleeds first, then crypto feels it.
If AI leaders can't hold, altcoins won't either.
I'm derisking and waiting. Are you buying this dip or holding cash?
#DowJones #crypto #BitcoinDunyamiz #StockMarket
🚨 is a WARNING for Crypto* 🚨
History repeated.
Nasdaq: *-4.5%*
Dow: *+0.7%*
This 5.15% divergence is the *widest weekly gap since July 2002*. That's 24 years!
Last time we saw this gap? Right before the dot-com bubble popped.
*What's crashing Wall Street?*
Chip bloodbath: Semiconductor index -11.4% this week, 8 straight red days. $NVDA $AMD bleeding.
AI debt panic: CoreWeave -25% this week, $51 BILLION in debt. Who pays for AI?
Money is fleeing high-growth tech to old-economy stocks. Dow finished green while tech crashed.
Tech bleeds first, then crypto feels it.
If AI leaders can't hold, altcoins won't either.
I'm derisking and waiting. Are you buying this dip or holding cash?
#DowJones #crypto #BitcoinDunyamiz #StockMarket
Crypto Pulse0089:
yes follow you
3
2
85

·
--
#nasdaqdowweeklygapwidestsincejuly2002 The divergence between traditional stock indexes just hit a historical milestone! 📉📈
The weekly gap between the tech-heavy Nasdaq (-4.5%) and the traditional Dow Jones (+0.7%) expanded to 5.15% — making it the widest weekly divergence since July 2002!
Binance
💡 Why Big Tech is Dragging & Why Crypto Traders Should Care
Tech Weakness & Risk-Off Rotation: When tech leadership and AI megacaps take a hit, capital often rotates temporarily into defensive value stocks (like those in the Dow).
Impact on Crypto Markets: Bitcoin ($BTC) and altcoins ($ETH,$SOL) historically share a tight correlation with tech-driven liquidity. When tech bleeds, risk assets across the board tend to feel liquidity pressure before stabilization occurs.
Macro Uncertainty: Shifts in interest rate expectations and macroeconomic outlooks are causing sharp sector rotations. Crypto thrives on clear macro direction; temporary market uncertainty can spark volatility and unexpected liquidations.
Binance
🛡️ How to Play It:
De-risk & Manage Leverage: Keep tight stop-losses on leveraged futures positions.
Watch $BTC Correlation: Keep an eye on $BTC defense zones and key support levels.
Patience Over FOMO: Wait for tech index stabilization before taking heavy long positions on high-beta altcoins.
👇 What’s your strategy right now? Are you buying the dip or holding stablecoins? Drop your thoughts below!
$BTC ETHETHETHBNB #CryptoNews #MacroEconomy #TradingTips #Nasdaq #DowJones
{future}(BTCUSDT)
#nasdaqdowweeklygapwidestsincejuly2002 The divergence between traditional stock indexes just hit a historical milestone! 📉📈
The weekly gap between the tech-heavy Nasdaq (-4.5%) and the traditional Dow Jones (+0.7%) expanded to 5.15% — making it the widest weekly divergence since July 2002!
Binance
💡 Why Big Tech is Dragging & Why Crypto Traders Should Care
Tech Weakness & Risk-Off Rotation: When tech leadership and AI megacaps take a hit, capital often rotates temporarily into defensive value stocks (like those in the Dow).
Impact on Crypto Markets: Bitcoin ($BTC ) and altcoins ($ETH,$SOL) historically share a tight correlation with tech-driven liquidity. When tech bleeds, risk assets across the board tend to feel liquidity pressure before stabilization occurs.
Macro Uncertainty: Shifts in interest rate expectations and macroeconomic outlooks are causing sharp sector rotations. Crypto thrives on clear macro direction; temporary market uncertainty can spark volatility and unexpected liquidations.
Binance
🛡️ How to Play It:
De-risk & Manage Leverage: Keep tight stop-losses on leveraged futures positions.
Watch $BTC Correlation: Keep an eye on $BTC defense zones and key support levels.
Patience Over FOMO: Wait for tech index stabilization before taking heavy long positions on high-beta altcoins.
👇 What’s your strategy right now? Are you buying the dip or holding stablecoins? Drop your thoughts below!
$BTC ETHETHETHBNB #CryptoNews #MacroEconomy #TradingTips #Nasdaq #DowJones
The weekly gap between the tech-heavy Nasdaq (-4.5%) and the traditional Dow Jones (+0.7%) expanded to 5.15% — making it the widest weekly divergence since July 2002!
Binance
💡 Why Big Tech is Dragging & Why Crypto Traders Should Care
Tech Weakness & Risk-Off Rotation: When tech leadership and AI megacaps take a hit, capital often rotates temporarily into defensive value stocks (like those in the Dow).
Impact on Crypto Markets: Bitcoin ($BTC ) and altcoins ($ETH,$SOL) historically share a tight correlation with tech-driven liquidity. When tech bleeds, risk assets across the board tend to feel liquidity pressure before stabilization occurs.
Macro Uncertainty: Shifts in interest rate expectations and macroeconomic outlooks are causing sharp sector rotations. Crypto thrives on clear macro direction; temporary market uncertainty can spark volatility and unexpected liquidations.
Binance
🛡️ How to Play It:
De-risk & Manage Leverage: Keep tight stop-losses on leveraged futures positions.
Watch $BTC Correlation: Keep an eye on $BTC defense zones and key support levels.
Patience Over FOMO: Wait for tech index stabilization before taking heavy long positions on high-beta altcoins.
👇 What’s your strategy right now? Are you buying the dip or holding stablecoins? Drop your thoughts below!
$BTC ETHETHETHBNB #CryptoNews #MacroEconomy #TradingTips #Nasdaq #DowJones
2
2k

·
--
Partly True
#nasdaqdowweeklygapwidestsincejuly2002
A major structural rotation shook Wall Street as the tech-heavy Nasdaq Composite dropped 4.48% while the value-oriented Dow Jones Industrial Average gained 0.68% on the week. The 5.16 percentage point performance spread marks the widest weekly divergence between the two U.S. stock benchmarks since July 2002. Growing concerns over corporate returns on artificial intelligence hardware investments, coupled with elevated energy prices, triggered heavy capital outflows from tech high-beta assets into defensive, traditional dividend sectors.
Market Analysis & Cross-Asset Implications
A multi-decade divergence gap signals capital re-allocation between equity sectors rather than outright capital flight from global financial markets.
As institutional portfolios rotate away from stretched tech valuations toward traditional value sectors, crypto assets display a strong correlation with high-beta tech equities. Macro desks are closely monitoring whether liquidity tightening in tech stocks spills over into digital assets or if Bitcoin can establish independent store-of-value decoupling.
Highlighted Tradeable Assets (High-Beta & Benchmark Exposure):
$BTC (Bitcoin): Core digital macro proxy; evaluating correlation with Nasdaq tech risk sentiment and liquidity retention above key support floors.
Current Spot Price: ~$83,100
$ETH (Ethereum): Benchmark smart-contract protocol; tracking spot capital flows, derivative liquidations, and broader risk asset rotation elasticity.
Current Spot Price: ~$2,420
$SOL (Solana): High-beta Layer-1 execution asset; observing risk-off sentiment shifts and momentum retention across decentralized venues.
Current Spot Price: ~$111.50
Share your analysis in the comments below! 👇
{spot}(BTCUSDT)
{spot}(ETHUSDT)
{spot}(SOLUSDT)
#NASDAQ #DowJones #stockmarket #MarketAnalysis
#nasdaqdowweeklygapwidestsincejuly2002
A major structural rotation shook Wall Street as the tech-heavy Nasdaq Composite dropped 4.48% while the value-oriented Dow Jones Industrial Average gained 0.68% on the week. The 5.16 percentage point performance spread marks the widest weekly divergence between the two U.S. stock benchmarks since July 2002. Growing concerns over corporate returns on artificial intelligence hardware investments, coupled with elevated energy prices, triggered heavy capital outflows from tech high-beta assets into defensive, traditional dividend sectors.
Market Analysis & Cross-Asset Implications
A multi-decade divergence gap signals capital re-allocation between equity sectors rather than outright capital flight from global financial markets.
As institutional portfolios rotate away from stretched tech valuations toward traditional value sectors, crypto assets display a strong correlation with high-beta tech equities. Macro desks are closely monitoring whether liquidity tightening in tech stocks spills over into digital assets or if Bitcoin can establish independent store-of-value decoupling.
Highlighted Tradeable Assets (High-Beta & Benchmark Exposure):
$BTC (Bitcoin): Core digital macro proxy; evaluating correlation with Nasdaq tech risk sentiment and liquidity retention above key support floors.
Current Spot Price: ~$83,100
$ETH (Ethereum): Benchmark smart-contract protocol; tracking spot capital flows, derivative liquidations, and broader risk asset rotation elasticity.
Current Spot Price: ~$2,420
$SOL (Solana): High-beta Layer-1 execution asset; observing risk-off sentiment shifts and momentum retention across decentralized venues.
Current Spot Price: ~$111.50
Share your analysis in the comments below! 👇
#NASDAQ #DowJones #stockmarket #MarketAnalysis
A major structural rotation shook Wall Street as the tech-heavy Nasdaq Composite dropped 4.48% while the value-oriented Dow Jones Industrial Average gained 0.68% on the week. The 5.16 percentage point performance spread marks the widest weekly divergence between the two U.S. stock benchmarks since July 2002. Growing concerns over corporate returns on artificial intelligence hardware investments, coupled with elevated energy prices, triggered heavy capital outflows from tech high-beta assets into defensive, traditional dividend sectors.
Market Analysis & Cross-Asset Implications
A multi-decade divergence gap signals capital re-allocation between equity sectors rather than outright capital flight from global financial markets.
As institutional portfolios rotate away from stretched tech valuations toward traditional value sectors, crypto assets display a strong correlation with high-beta tech equities. Macro desks are closely monitoring whether liquidity tightening in tech stocks spills over into digital assets or if Bitcoin can establish independent store-of-value decoupling.
Highlighted Tradeable Assets (High-Beta & Benchmark Exposure):
$BTC (Bitcoin): Core digital macro proxy; evaluating correlation with Nasdaq tech risk sentiment and liquidity retention above key support floors.
Current Spot Price: ~$83,100
$ETH (Ethereum): Benchmark smart-contract protocol; tracking spot capital flows, derivative liquidations, and broader risk asset rotation elasticity.
Current Spot Price: ~$2,420
$SOL (Solana): High-beta Layer-1 execution asset; observing risk-off sentiment shifts and momentum retention across decentralized venues.
Current Spot Price: ~$111.50
Share your analysis in the comments below! 👇
#NASDAQ #DowJones #stockmarket #MarketAnalysis
1
2k
·
--
#nasdaqdowweeklygapwidestsincejuly2002 Here is a high-engagement, ready-to-copy post optimized for Binance Square based on the macro trend regarding the Nasdaq and Dow weekly divergence.
🚨 Macro Warning for Crypto? The Nasdaq vs. Dow Divergence Hits a 24-Year High!
Binance
History is showing some fascinating—and cautious—signals. Recently, we witnessed a massive weekly divergence between tech and traditional equities:
📉 Nasdaq: -4.5%
Binance
📈 Dow Jones: +0.7%
Binance
This 5.15% weekly gap is the widest we’ve seen since July 2002!
Binance
What does this mean for Crypto ($BTC,$ETH, Altcoins)?
Historically, crypto behaves closely as a high-beta risk asset, often following the broader tech market sentiment. When tech bleeds heavily while the defensive Dow stays green, it signals structural sector rotation and macro caution.
⚠️ The Takeaway:
Tech usually leads the risk curve—if major tech/AI leaders fail to hold key supports, crypto often feels the ripple effect shortly after.
Binance
Volatility is almost guaranteed. Manage your risk, watch your leverage, and don't get caught sleeping on macro correlations.
Are you hedging your portfolio right now, or buying the dip? Let’s discuss below! 👇
$BTC ETHETHETHBNB #NasdaqDowWeeklyGapWidestSinceJuly2002 #Macro #CryptoTrading #RiskManagement #MarketUpdate
{spot}(BTCUSDT)
#nasdaqdowweeklygapwidestsincejuly2002 Here is a high-engagement, ready-to-copy post optimized for Binance Square based on the macro trend regarding the Nasdaq and Dow weekly divergence.
🚨 Macro Warning for Crypto? The Nasdaq vs. Dow Divergence Hits a 24-Year High!
Binance
History is showing some fascinating—and cautious—signals. Recently, we witnessed a massive weekly divergence between tech and traditional equities:
📉 Nasdaq: -4.5%
Binance
📈 Dow Jones: +0.7%
Binance
This 5.15% weekly gap is the widest we’ve seen since July 2002!
Binance
What does this mean for Crypto ($BTC ,$ETH, Altcoins)?
Historically, crypto behaves closely as a high-beta risk asset, often following the broader tech market sentiment. When tech bleeds heavily while the defensive Dow stays green, it signals structural sector rotation and macro caution.
⚠️ The Takeaway:
Tech usually leads the risk curve—if major tech/AI leaders fail to hold key supports, crypto often feels the ripple effect shortly after.
Binance
Volatility is almost guaranteed. Manage your risk, watch your leverage, and don't get caught sleeping on macro correlations.
Are you hedging your portfolio right now, or buying the dip? Let’s discuss below! 👇
$BTC ETHETHETHBNB #NasdaqDowWeeklyGapWidestSinceJuly2002 #Macro #CryptoTrading #RiskManagement #MarketUpdate
🚨 Macro Warning for Crypto? The Nasdaq vs. Dow Divergence Hits a 24-Year High!
Binance
History is showing some fascinating—and cautious—signals. Recently, we witnessed a massive weekly divergence between tech and traditional equities:
📉 Nasdaq: -4.5%
Binance
📈 Dow Jones: +0.7%
Binance
This 5.15% weekly gap is the widest we’ve seen since July 2002!
Binance
What does this mean for Crypto ($BTC ,$ETH, Altcoins)?
Historically, crypto behaves closely as a high-beta risk asset, often following the broader tech market sentiment. When tech bleeds heavily while the defensive Dow stays green, it signals structural sector rotation and macro caution.
⚠️ The Takeaway:
Tech usually leads the risk curve—if major tech/AI leaders fail to hold key supports, crypto often feels the ripple effect shortly after.
Binance
Volatility is almost guaranteed. Manage your risk, watch your leverage, and don't get caught sleeping on macro correlations.
Are you hedging your portfolio right now, or buying the dip? Let’s discuss below! 👇
$BTC ETHETHETHBNB #NasdaqDowWeeklyGapWidestSinceJuly2002 #Macro #CryptoTrading #RiskManagement #MarketUpdate
1
1.4k

·
--
#NasdaqDowWeeklyGapWidestSinceJuly2002
This is the widest weekly gap between Nasdaq and Dow since July 2002.
After 20+ years watching markets, these kinds of divergences usually signal something important is shifting under the surface — either risk appetite is splitting hard or capital is rotating aggressively.
Worth paying close attention to how this resolves over the next few weeks.
#NasdaqDowWeeklyGapWidestSinceJuly2002
This is the widest weekly gap between Nasdaq and Dow since July 2002.
After 20+ years watching markets, these kinds of divergences usually signal something important is shifting under the surface — either risk appetite is splitting hard or capital is rotating aggressively.
Worth paying close attention to how this resolves over the next few weeks.
This is the widest weekly gap between Nasdaq and Dow since July 2002.
After 20+ years watching markets, these kinds of divergences usually signal something important is shifting under the surface — either risk appetite is splitting hard or capital is rotating aggressively.
Worth paying close attention to how this resolves over the next few weeks.
1
369


·
--
#NasdaqDowWeeklyGapWidestSinceJuly2002
Nasdaq–Dow Weekly Gap Hits a 24-Year Extreme : What Is Wall Street Signalling?
The US stock market just delivered a striking divergence. For the week ending October 16, the Nasdaq Composite fell approximately 4.48%, while the Dow Jones Industrial Average gained around 0.68%. The performance gap of more than five percentage points was the widest since July 2002.
What’s behind the split? Investors are reconsidering the returns on massive AI infrastructure investments. Technology and semiconductor stocks have faced selling pressure, while concerns over debt financing and rising oil prices have added to market uncertainty. CoreWeave, a major AI infrastructure provider, fell sharply as investors questioned its financing model.
My take: This looks like a rotation away from high-growth technology stocks rather than a complete retreat from equities. The Dow’s relative strength suggests investors are favouring other sectors while reassessing AI-related valuations.
What comes next? If upcoming earnings confirm strong AI demand and credible returns on investment, tech stocks could recover. But disappointing guidance or renewed inflation concerns could extend the sell-off.
For crypto traders, the key signal is whether this risk aversion spreads to Bitcoin and other speculative assets. I’ll be watching tech earnings, Treasury yields and BTC’s reaction before drawing a directional conclusion.
Do you think this is a temporary rotation or the beginning of a deeper tech correction?
Follow for more original, data-driven market analysis.
#NASDAQ #DowJones #AIStocks #bitcoin
#NasdaqDowWeeklyGapWidestSinceJuly2002
Nasdaq–Dow Weekly Gap Hits a 24-Year Extreme : What Is Wall Street Signalling?
The US stock market just delivered a striking divergence. For the week ending October 16, the Nasdaq Composite fell approximately 4.48%, while the Dow Jones Industrial Average gained around 0.68%. The performance gap of more than five percentage points was the widest since July 2002.
What’s behind the split? Investors are reconsidering the returns on massive AI infrastructure investments. Technology and semiconductor stocks have faced selling pressure, while concerns over debt financing and rising oil prices have added to market uncertainty. CoreWeave, a major AI infrastructure provider, fell sharply as investors questioned its financing model.
My take: This looks like a rotation away from high-growth technology stocks rather than a complete retreat from equities. The Dow’s relative strength suggests investors are favouring other sectors while reassessing AI-related valuations.
What comes next? If upcoming earnings confirm strong AI demand and credible returns on investment, tech stocks could recover. But disappointing guidance or renewed inflation concerns could extend the sell-off.
For crypto traders, the key signal is whether this risk aversion spreads to Bitcoin and other speculative assets. I’ll be watching tech earnings, Treasury yields and BTC’s reaction before drawing a directional conclusion.
Do you think this is a temporary rotation or the beginning of a deeper tech correction?
Follow for more original, data-driven market analysis.
#NASDAQ #DowJones #AIStocks #bitcoin
Nasdaq–Dow Weekly Gap Hits a 24-Year Extreme : What Is Wall Street Signalling?
The US stock market just delivered a striking divergence. For the week ending October 16, the Nasdaq Composite fell approximately 4.48%, while the Dow Jones Industrial Average gained around 0.68%. The performance gap of more than five percentage points was the widest since July 2002.
What’s behind the split? Investors are reconsidering the returns on massive AI infrastructure investments. Technology and semiconductor stocks have faced selling pressure, while concerns over debt financing and rising oil prices have added to market uncertainty. CoreWeave, a major AI infrastructure provider, fell sharply as investors questioned its financing model.
My take: This looks like a rotation away from high-growth technology stocks rather than a complete retreat from equities. The Dow’s relative strength suggests investors are favouring other sectors while reassessing AI-related valuations.
What comes next? If upcoming earnings confirm strong AI demand and credible returns on investment, tech stocks could recover. But disappointing guidance or renewed inflation concerns could extend the sell-off.
For crypto traders, the key signal is whether this risk aversion spreads to Bitcoin and other speculative assets. I’ll be watching tech earnings, Treasury yields and BTC’s reaction before drawing a directional conclusion.
Do you think this is a temporary rotation or the beginning of a deeper tech correction?
Follow for more original, data-driven market analysis.
#NASDAQ #DowJones #AIStocks #bitcoin
3
1.7k

·
--
Bullish
Partly True
#nasdaqdowweeklygapwidestsincejuly2002
📉History repeats itself—where are traders headed? 🧐
A stunning market divergence just unfolded! The weekly performance gap between the Nasdaq and Dow Jones widened to a record, reaching its widest level since July 2002 (the Dot-com bubble era). While traditional sectors and banks propped up the Dow Jones, the Nasdaq took a 5.5% beating amid the “ordeal” of AI infrastructure debt and Brent crude prices skyrocketing past 110 USD.
Traditional money is fleeing for safe havens, but crypto is different! Bitcoin remains resilient, holding firmly around 80,000 USD—a powerful testament to its status as an independent asset.
What should traders do?
Opportunity lies where panic strikes! Get your funds ready to snap up quality assets at bargain prices. While you’re at it, open a Binance account using link [https://www.binance.com/register?ref=VINHTOCDO](https://www.binance.com/register?ref=VINHTOCDO) or enter code VINHTOCDO to ride this historic wave with me at top speed! 🏎️
⚠️ This is not financial advice.
👇 Click below to trade and support me:
$BTC
{spot}(BTCUSDT)
$DIA
{spot}(DIAUSDT)
$QQQB
{spot}(QQQBUSDT)
#MarketDivergence #TechCrash #CryptoVsStocks #BinanceTrading #VINHTOCDO
#nasdaqdowweeklygapwidestsincejuly2002
📉History repeats itself—where are traders headed? 🧐
A stunning market divergence just unfolded! The weekly performance gap between the Nasdaq and Dow Jones widened to a record, reaching its widest level since July 2002 (the Dot-com bubble era). While traditional sectors and banks propped up the Dow Jones, the Nasdaq took a 5.5% beating amid the “ordeal” of AI infrastructure debt and Brent crude prices skyrocketing past 110 USD.
Traditional money is fleeing for safe havens, but crypto is different! Bitcoin remains resilient, holding firmly around 80,000 USD—a powerful testament to its status as an independent asset.
What should traders do?
Opportunity lies where panic strikes! Get your funds ready to snap up quality assets at bargain prices. While you’re at it, open a Binance account using link https://www.binance.com/register?ref=VINHTOCDO or enter code VINHTOCDO to ride this historic wave with me at top speed! 🏎️
⚠️ This is not financial advice.
👇 Click below to trade and support me:
$BTC
$DIA
$QQQB
#MarketDivergence #TechCrash #CryptoVsStocks #BinanceTrading #VINHTOCDO
📉History repeats itself—where are traders headed? 🧐
A stunning market divergence just unfolded! The weekly performance gap between the Nasdaq and Dow Jones widened to a record, reaching its widest level since July 2002 (the Dot-com bubble era). While traditional sectors and banks propped up the Dow Jones, the Nasdaq took a 5.5% beating amid the “ordeal” of AI infrastructure debt and Brent crude prices skyrocketing past 110 USD.
Traditional money is fleeing for safe havens, but crypto is different! Bitcoin remains resilient, holding firmly around 80,000 USD—a powerful testament to its status as an independent asset.
What should traders do?
Opportunity lies where panic strikes! Get your funds ready to snap up quality assets at bargain prices. While you’re at it, open a Binance account using link https://www.binance.com/register?ref=VINHTOCDO or enter code VINHTOCDO to ride this historic wave with me at top speed! 🏎️
⚠️ This is not financial advice.
👇 Click below to trade and support me:
$BTC
$DIA
$QQQB
#MarketDivergence #TechCrash #CryptoVsStocks #BinanceTrading #VINHTOCDO
ابراهيم التميمي:
ستكسر الاسعار مقاومات كثيرة انها مسالة وقت لا اكثر
4
6
9.9k

·
--
#nasdaqdowweeklygapwidestsincejuly2002
🚨🔥 BREAKING | WALL STREET SENDS A HISTORIC SIGNAL 🔥🚨
📉📈#NasdaqDowWeeklyGapWidestSinceJuly2002
😱 The market has just recorded the widest weekly divergence between the Nasdaq and the Dow Jones since July 2002. While tech stocks are undergoing a sharp correction, traditional stocks are weathering the blow. [[Informació...nce Square]](https://www.binance.com/es/square/hashtag/nasdaqdowweeklygapwidestsincejuly2002)
🔴 Nasdaq Composite: -4.48%
🔴 Nasdaq-100: -5.5%
🟢 Dow Jones: +0.68% [[Informació...nce Square]](https://www.binance.com/es/square/hashtag/nasdaqdowweeklygapwidestsincejuly2002)
💥 The gap exceeds 5 percentage points—a move not seen since the period following the dot-com bubble burst.
🧠 What does this mean?
⚠️ Money is flowing out of many tech and AI-related stocks.
🏦 Investors are seeking shelter in more defensive, traditional sectors.
👀 The market is watching to see whether this rotation will eventually affect Bitcoin and the rest of the cryptocurrencies.
₿ Meanwhile, the crypto community is watching closely:
🚀 Will Bitcoin continue to show strength? 🌐 Will crypto and the stock market decouple? 🔥 Or will we see more volatility across the entire market?
💎 BY ELCRYPTOBOY
🎙️ "When Wall Street panics, big investors look for opportunities. The question isn't whether the market will move... it's who is prepared to take advantage of it." 🚀🌕
❤️ Comment: 🟢 BULLISH or 🔴 BEARISH
#Bitcoin #BTC #CryptoNews #WallStreet #Nasdaq #DowJones #Altcoins #MarketCrash #CryptoMarket #ElCryptoBoy 🚀💰🔥📊🌕
#nasdaqdowweeklygapwidestsincejuly2002
🚨🔥 BREAKING | WALL STREET SENDS A HISTORIC SIGNAL 🔥🚨
📉📈#NasdaqDowWeeklyGapWidestSinceJuly2002
😱 The market has just recorded the widest weekly divergence between the Nasdaq and the Dow Jones since July 2002. While tech stocks are undergoing a sharp correction, traditional stocks are weathering the blow. [Informació...nce Square]
🔴 Nasdaq Composite: -4.48%
🔴 Nasdaq-100: -5.5%
🟢 Dow Jones: +0.68% [Informació...nce Square]
💥 The gap exceeds 5 percentage points—a move not seen since the period following the dot-com bubble burst.
🧠 What does this mean?
⚠️ Money is flowing out of many tech and AI-related stocks.
🏦 Investors are seeking shelter in more defensive, traditional sectors.
👀 The market is watching to see whether this rotation will eventually affect Bitcoin and the rest of the cryptocurrencies.
₿ Meanwhile, the crypto community is watching closely:
🚀 Will Bitcoin continue to show strength? 🌐 Will crypto and the stock market decouple? 🔥 Or will we see more volatility across the entire market?
💎 BY ELCRYPTOBOY
🎙️ "When Wall Street panics, big investors look for opportunities. The question isn't whether the market will move... it's who is prepared to take advantage of it." 🚀🌕
❤️ Comment: 🟢 BULLISH or 🔴 BEARISH
#Bitcoin #BTC #CryptoNews #WallStreet #Nasdaq #DowJones #Altcoins #MarketCrash #CryptoMarket #ElCryptoBoy 🚀💰🔥📊🌕
🚨🔥 BREAKING | WALL STREET SENDS A HISTORIC SIGNAL 🔥🚨
📉📈#NasdaqDowWeeklyGapWidestSinceJuly2002
😱 The market has just recorded the widest weekly divergence between the Nasdaq and the Dow Jones since July 2002. While tech stocks are undergoing a sharp correction, traditional stocks are weathering the blow. [Informació...nce Square]
🔴 Nasdaq Composite: -4.48%
🔴 Nasdaq-100: -5.5%
🟢 Dow Jones: +0.68% [Informació...nce Square]
💥 The gap exceeds 5 percentage points—a move not seen since the period following the dot-com bubble burst.
🧠 What does this mean?
⚠️ Money is flowing out of many tech and AI-related stocks.
🏦 Investors are seeking shelter in more defensive, traditional sectors.
👀 The market is watching to see whether this rotation will eventually affect Bitcoin and the rest of the cryptocurrencies.
₿ Meanwhile, the crypto community is watching closely:
🚀 Will Bitcoin continue to show strength? 🌐 Will crypto and the stock market decouple? 🔥 Or will we see more volatility across the entire market?
💎 BY ELCRYPTOBOY
🎙️ "When Wall Street panics, big investors look for opportunities. The question isn't whether the market will move... it's who is prepared to take advantage of it." 🚀🌕
❤️ Comment: 🟢 BULLISH or 🔴 BEARISH
#Bitcoin #BTC #CryptoNews #WallStreet #Nasdaq #DowJones #Altcoins #MarketCrash #CryptoMarket #ElCryptoBoy 🚀💰🔥📊🌕
93

·
--
On one side, tech stocks endured their “darkest week”; on the other, the Dow bucked the trend and finished in the green. Over the past week, the Nasdaq Composite fell 4.48%, while the tech-heavy Nasdaq 100 dropped about 5.6%. The Dow Jones Industrial Average, by contrast, rose about 0.68% for the week. The gap between their weekly performances was the widest since July 2002.
The last time we saw this kind of divergence was in the aftermath of the dot-com bust. This time, the trigger was quite specific: the market started scrutinizing the massive sums being poured into AI. CoreWeave’s debt topped $51 billion, and yields on some of its bonds soared above 15%, putting the question of “how long AI financing can hold up” front and center. News of intensifying Chinese competition in memory chips sent Micron and SanDisk tumbling. The Philadelphia Semiconductor Index fell for eight straight sessions, its longest losing streak since 2008.
But divergence does not mean outright panic. The Dow finished higher thanks to the resilience of “old economy” sectors such as industrials, consumer staples, and financials. Meanwhile, the 10-year U.S. Treasury yield actually eased to around 5.09%, and European stocks had their best week since late June. This suggests that investors aren’t rushing for the exits, but repositioning—shifting out of high-valuation technology growth stocks and into defensive sectors better able to weather higher interest rates.
This is worth watching closely for crypto: $BTC fell alongside tech stocks this week, holding near $81,500. That suggests its “risk-appetite anchor” remains tied to the Nasdaq, rather than the Dow’s resilience. The Fed’s October 27–28 meeting and earnings reports from tech giants will determine whether this rotation is a healthy rebalancing or just a pause midway through a downturn.
This is not investment advice. DYOR; trading involves risk.
#NasdaqDowWeeklyGapWidestSinceJuly2002
#美股 #Rotation
On one side, tech stocks endured their “darkest week”; on the other, the Dow bucked the trend and finished in the green. Over the past week, the Nasdaq Composite fell 4.48%, while the tech-heavy Nasdaq 100 dropped about 5.6%. The Dow Jones Industrial Average, by contrast, rose about 0.68% for the week. The gap between their weekly performances was the widest since July 2002.
The last time we saw this kind of divergence was in the aftermath of the dot-com bust. This time, the trigger was quite specific: the market started scrutinizing the massive sums being poured into AI. CoreWeave’s debt topped $51 billion, and yields on some of its bonds soared above 15%, putting the question of “how long AI financing can hold up” front and center. News of intensifying Chinese competition in memory chips sent Micron and SanDisk tumbling. The Philadelphia Semiconductor Index fell for eight straight sessions, its longest losing streak since 2008.
But divergence does not mean outright panic. The Dow finished higher thanks to the resilience of “old economy” sectors such as industrials, consumer staples, and financials. Meanwhile, the 10-year U.S. Treasury yield actually eased to around 5.09%, and European stocks had their best week since late June. This suggests that investors aren’t rushing for the exits, but repositioning—shifting out of high-valuation technology growth stocks and into defensive sectors better able to weather higher interest rates.
This is worth watching closely for crypto: $BTC fell alongside tech stocks this week, holding near $81,500. That suggests its “risk-appetite anchor” remains tied to the Nasdaq, rather than the Dow’s resilience. The Fed’s October 27–28 meeting and earnings reports from tech giants will determine whether this rotation is a healthy rebalancing or just a pause midway through a downturn.
This is not investment advice. DYOR; trading involves risk.
#NasdaqDowWeeklyGapWidestSinceJuly2002
#美股 #Rotation
The last time we saw this kind of divergence was in the aftermath of the dot-com bust. This time, the trigger was quite specific: the market started scrutinizing the massive sums being poured into AI. CoreWeave’s debt topped $51 billion, and yields on some of its bonds soared above 15%, putting the question of “how long AI financing can hold up” front and center. News of intensifying Chinese competition in memory chips sent Micron and SanDisk tumbling. The Philadelphia Semiconductor Index fell for eight straight sessions, its longest losing streak since 2008.
But divergence does not mean outright panic. The Dow finished higher thanks to the resilience of “old economy” sectors such as industrials, consumer staples, and financials. Meanwhile, the 10-year U.S. Treasury yield actually eased to around 5.09%, and European stocks had their best week since late June. This suggests that investors aren’t rushing for the exits, but repositioning—shifting out of high-valuation technology growth stocks and into defensive sectors better able to weather higher interest rates.
This is worth watching closely for crypto: $BTC fell alongside tech stocks this week, holding near $81,500. That suggests its “risk-appetite anchor” remains tied to the Nasdaq, rather than the Dow’s resilience. The Fed’s October 27–28 meeting and earnings reports from tech giants will determine whether this rotation is a healthy rebalancing or just a pause midway through a downturn.
This is not investment advice. DYOR; trading involves risk.
#NasdaqDowWeeklyGapWidestSinceJuly2002
#美股 #Rotation
7

·
--
$BTC $#NasdaqDowWeeklyGapWidestSinceJuly2002 "#NasdaqDowWeeklyGapWidestSinceJuly2002" means that the weekly performance gap between the Nasdaq Composite and the Dow Jones Industrial Average was the widest since July 2002.
In the context of the post, the Nasdaq fell about 4.48% during the week ending October 16, while the Dow Jones rose about 0.68%. The gap between them therefore exceeded five percentage points. Put simply, technology stocks—especially those tied to AI and semiconductors—performed much worse than the traditional large companies represented by the Dow.
The phrase highlights a clear shift in investor preferences: not necessarily a broad exit from stocks, but a reassessment of high-growth technology companies’ valuations, spending on AI infrastructure, debt-financing risks, and broader market uncertainty.
$BTC $#NasdaqDowWeeklyGapWidestSinceJuly2002 "#NasdaqDowWeeklyGapWidestSinceJuly2002" means that the weekly performance gap between the Nasdaq Composite and the Dow Jones Industrial Average was the widest since July 2002.
In the context of the post, the Nasdaq fell about 4.48% during the week ending October 16, while the Dow Jones rose about 0.68%. The gap between them therefore exceeded five percentage points. Put simply, technology stocks—especially those tied to AI and semiconductors—performed much worse than the traditional large companies represented by the Dow.
The phrase highlights a clear shift in investor preferences: not necessarily a broad exit from stocks, but a reassessment of high-growth technology companies’ valuations, spending on AI infrastructure, debt-financing risks, and broader market uncertainty.
In the context of the post, the Nasdaq fell about 4.48% during the week ending October 16, while the Dow Jones rose about 0.68%. The gap between them therefore exceeded five percentage points. Put simply, technology stocks—especially those tied to AI and semiconductors—performed much worse than the traditional large companies represented by the Dow.
The phrase highlights a clear shift in investor preferences: not necessarily a broad exit from stocks, but a reassessment of high-growth technology companies’ valuations, spending on AI infrastructure, debt-financing risks, and broader market uncertainty.
27

#NasdaqDowWeeklyGapWidestSinceJuly2002
The weekly gap between the Nasdaq and Dow reaches its widest level in 24 years: What is Wall Street signaling?
The U.S. stock market just saw a striking divergence. In the week ending October 16, the Nasdaq Composite fell about 4.48%, while the Dow Jones Industrial Average rose about 0.68%. The performance gap, which exceeded five percentage points, was the widest since July 2002.
What caused this divergence? Investors are reassessing the expected returns from massive investments in AI infrastructure. Technology and semiconductor stocks came under selling pressure, while concerns about debt financing and rising oil prices added to market uncertainty. CoreWeave, a prominent AI infrastructure company, also fell sharply as investors questioned its financing model.
My take: This looks like a shift away from high-growth technology stocks, rather than a full retreat from equities. The Dow's relative strength suggests investors are favoring other sectors while reassessing companies tied to AI.
Follow me for more original, data-driven market analysis.
Please follow
#NASDAQ #DowJones #AIStocks #bitcoin
#NasdaqDowWeeklyGapWidestSinceJuly2002
The weekly gap between the Nasdaq and Dow reaches its widest level in 24 years: What is Wall Street signaling?
The U.S. stock market just saw a striking divergence. In the week ending October 16, the Nasdaq Composite fell about 4.48%, while the Dow Jones Industrial Average rose about 0.68%. The performance gap, which exceeded five percentage points, was the widest since July 2002.
What caused this divergence? Investors are reassessing the expected returns from massive investments in AI infrastructure. Technology and semiconductor stocks came under selling pressure, while concerns about debt financing and rising oil prices added to market uncertainty. CoreWeave, a prominent AI infrastructure company, also fell sharply as investors questioned its financing model.
My take: This looks like a shift away from high-growth technology stocks, rather than a full retreat from equities. The Dow's relative strength suggests investors are favoring other sectors while reassessing companies tied to AI.
Follow me for more original, data-driven market analysis.
Please follow
#NASDAQ #DowJones #AIStocks #bitcoin
The weekly gap between the Nasdaq and Dow reaches its widest level in 24 years: What is Wall Street signaling?
The U.S. stock market just saw a striking divergence. In the week ending October 16, the Nasdaq Composite fell about 4.48%, while the Dow Jones Industrial Average rose about 0.68%. The performance gap, which exceeded five percentage points, was the widest since July 2002.
What caused this divergence? Investors are reassessing the expected returns from massive investments in AI infrastructure. Technology and semiconductor stocks came under selling pressure, while concerns about debt financing and rising oil prices added to market uncertainty. CoreWeave, a prominent AI infrastructure company, also fell sharply as investors questioned its financing model.
My take: This looks like a shift away from high-growth technology stocks, rather than a full retreat from equities. The Dow's relative strength suggests investors are favoring other sectors while reassessing companies tied to AI.
Follow me for more original, data-driven market analysis.
Please follow
#NASDAQ #DowJones #AIStocks #bitcoin
1
50

#NasdaqDowWeeklyGapWidestSinceJuly2002 .
The significance of the widening gap and its history (the 2002 bubble)
* This divergence brings to mind a critical period in financial market history: **2002** (the period following the collapse of the dot-com/technology stock bubble).
* When the gap widens between the “Nasdaq” (dominated by technology and growth companies) and the “Dow Jones” (dominated by traditional, defensive, and large industrial companies), it means that **capital is moving sharply and unevenly**—either flowing frenziedly into a particular sector or fleeing it en masse, reflecting a general state of uncertainty.
. What does this situation mean for traders and investors?
* **Liquidity repositioning (Sector Rotation):** This divergence often indicates that smart money or major institutions are reallocating their assets, either by exiting highly valued technology stocks or hedging against them by moving toward safer defensive stocks, and vice versa.
. Technical and psychological warning signals:** Such record levels (the widest in 24 years) often precede sharp price volatility or shifts in the market’s overall direction (Market Trend), leaving traders on alert to see whether history will repeat itself with a corrective shock or whether new economic factors justify this divergence.
#NasdaqDowWeeklyGapWidestSinceJuly2002 .
The significance of the widening gap and its history (the 2002 bubble)
* This divergence brings to mind a critical period in financial market history: **2002** (the period following the collapse of the dot-com/technology stock bubble).
* When the gap widens between the “Nasdaq” (dominated by technology and growth companies) and the “Dow Jones” (dominated by traditional, defensive, and large industrial companies), it means that **capital is moving sharply and unevenly**—either flowing frenziedly into a particular sector or fleeing it en masse, reflecting a general state of uncertainty.
. What does this situation mean for traders and investors?
* **Liquidity repositioning (Sector Rotation):** This divergence often indicates that smart money or major institutions are reallocating their assets, either by exiting highly valued technology stocks or hedging against them by moving toward safer defensive stocks, and vice versa.
. Technical and psychological warning signals:** Such record levels (the widest in 24 years) often precede sharp price volatility or shifts in the market’s overall direction (Market Trend), leaving traders on alert to see whether history will repeat itself with a corrective shock or whether new economic factors justify this divergence.
The significance of the widening gap and its history (the 2002 bubble)
* This divergence brings to mind a critical period in financial market history: **2002** (the period following the collapse of the dot-com/technology stock bubble).
* When the gap widens between the “Nasdaq” (dominated by technology and growth companies) and the “Dow Jones” (dominated by traditional, defensive, and large industrial companies), it means that **capital is moving sharply and unevenly**—either flowing frenziedly into a particular sector or fleeing it en masse, reflecting a general state of uncertainty.
. What does this situation mean for traders and investors?
* **Liquidity repositioning (Sector Rotation):** This divergence often indicates that smart money or major institutions are reallocating their assets, either by exiting highly valued technology stocks or hedging against them by moving toward safer defensive stocks, and vice versa.
. Technical and psychological warning signals:** Such record levels (the widest in 24 years) often precede sharp price volatility or shifts in the market’s overall direction (Market Trend), leaving traders on alert to see whether history will repeat itself with a corrective shock or whether new economic factors justify this divergence.
80

·
--
#nasdaqdowweeklygapwidestsincejuly2002
📊 The weekly gap between the Nasdaq and Dow Jones indexes reached 5.16%, its widest since July 2002! 🤯
A full-scale “Great Migration” (sector rotation) is underway in the markets. Investors are pulling money out of risky tech stocks and moving it into traditional, safe-haven stocks. 🏃♂️💨
Here’s a summary of this historic divergence in emojis:
📉 How the Indexes Are Doing
💻📉 Nasdaq (Technology Index): Closed the week down 4.48%. The AI tailwind has slowed, and tech giants are losing ground.🏭📈 Dow Jones (Traditional Index): Finished the week up 0.68%. Banks, industrials, and energy companies are standing firm.
🔍 How Did We Get Here?
🤖❓ Concerns That “AI Is a Bubble”: TSMC (the chip giant) increased its profit by 69%, yet its shares fell! 📉 Investors are now asking, “That’s great, but when will this massive spending turn into real profits?”💸🪝📉 Debt Crisis Fears: AI infrastructure provider CoreWeave’s debt has exceeded $51 billion, and bond yields are nearing 15%! 🔥 Alarm bells are ringing for companies growing through debt. 🚨
🏦🔄 Major Rotation: 96% of chip stocks are 20% below their peaks (in a bear market). 🐻 By contrast, only 4% of banks are in this situation. Money isn’t leaving the market—it’s just changing homes! 🏢🏠🛢️🔥 Oil on Fire: Brent crude hit $110, while WTI reached $101! Oil has risen for seven consecutive days, fueling inflation. This is also putting pressure on interest-rate-sensitive tech companies. 🥵
🏛️ Macroeconomic Conditions and the Fed 🇺🇸
📈 Bond Yields: U.S. 10-year Treasury yields are at 5.36%, their highest level since 2002! 💸🦅 Fed & Inflation: September inflation figures came in high. Because of the hawkish tone from Fed officials (especially Kevin Warsh), the probability of rates being held steady in October fell to 15%. Meanwhile, expectations of a rate hike in December are at 90%! 🦅💵
$NEAR $GRT $RNDR
{future}(NEARUSDT)
#Nasdaq #DowJones #StockMarket
#nasdaqdowweeklygapwidestsincejuly2002
📊 The weekly gap between the Nasdaq and Dow Jones indexes reached 5.16%, its widest since July 2002! 🤯
A full-scale “Great Migration” (sector rotation) is underway in the markets. Investors are pulling money out of risky tech stocks and moving it into traditional, safe-haven stocks. 🏃♂️💨
Here’s a summary of this historic divergence in emojis:
📉 How the Indexes Are Doing
💻📉 Nasdaq (Technology Index): Closed the week down 4.48%. The AI tailwind has slowed, and tech giants are losing ground.🏭📈 Dow Jones (Traditional Index): Finished the week up 0.68%. Banks, industrials, and energy companies are standing firm.
🔍 How Did We Get Here?
🤖❓ Concerns That “AI Is a Bubble”: TSMC (the chip giant) increased its profit by 69%, yet its shares fell! 📉 Investors are now asking, “That’s great, but when will this massive spending turn into real profits?”💸🪝📉 Debt Crisis Fears: AI infrastructure provider CoreWeave’s debt has exceeded $51 billion, and bond yields are nearing 15%! 🔥 Alarm bells are ringing for companies growing through debt. 🚨
🏦🔄 Major Rotation: 96% of chip stocks are 20% below their peaks (in a bear market). 🐻 By contrast, only 4% of banks are in this situation. Money isn’t leaving the market—it’s just changing homes! 🏢🏠🛢️🔥 Oil on Fire: Brent crude hit $110, while WTI reached $101! Oil has risen for seven consecutive days, fueling inflation. This is also putting pressure on interest-rate-sensitive tech companies. 🥵
🏛️ Macroeconomic Conditions and the Fed 🇺🇸
📈 Bond Yields: U.S. 10-year Treasury yields are at 5.36%, their highest level since 2002! 💸🦅 Fed & Inflation: September inflation figures came in high. Because of the hawkish tone from Fed officials (especially Kevin Warsh), the probability of rates being held steady in October fell to 15%. Meanwhile, expectations of a rate hike in December are at 90%! 🦅💵
$NEAR $GRT $RNDR
#Nasdaq #DowJones #StockMarket
📊 The weekly gap between the Nasdaq and Dow Jones indexes reached 5.16%, its widest since July 2002! 🤯
A full-scale “Great Migration” (sector rotation) is underway in the markets. Investors are pulling money out of risky tech stocks and moving it into traditional, safe-haven stocks. 🏃♂️💨
Here’s a summary of this historic divergence in emojis:
📉 How the Indexes Are Doing
💻📉 Nasdaq (Technology Index): Closed the week down 4.48%. The AI tailwind has slowed, and tech giants are losing ground.🏭📈 Dow Jones (Traditional Index): Finished the week up 0.68%. Banks, industrials, and energy companies are standing firm.
🔍 How Did We Get Here?
🤖❓ Concerns That “AI Is a Bubble”: TSMC (the chip giant) increased its profit by 69%, yet its shares fell! 📉 Investors are now asking, “That’s great, but when will this massive spending turn into real profits?”💸🪝📉 Debt Crisis Fears: AI infrastructure provider CoreWeave’s debt has exceeded $51 billion, and bond yields are nearing 15%! 🔥 Alarm bells are ringing for companies growing through debt. 🚨
🏦🔄 Major Rotation: 96% of chip stocks are 20% below their peaks (in a bear market). 🐻 By contrast, only 4% of banks are in this situation. Money isn’t leaving the market—it’s just changing homes! 🏢🏠🛢️🔥 Oil on Fire: Brent crude hit $110, while WTI reached $101! Oil has risen for seven consecutive days, fueling inflation. This is also putting pressure on interest-rate-sensitive tech companies. 🥵
🏛️ Macroeconomic Conditions and the Fed 🇺🇸
📈 Bond Yields: U.S. 10-year Treasury yields are at 5.36%, their highest level since 2002! 💸🦅 Fed & Inflation: September inflation figures came in high. Because of the hawkish tone from Fed officials (especially Kevin Warsh), the probability of rates being held steady in October fell to 15%. Meanwhile, expectations of a rate hike in December are at 90%! 🦅💵
$NEAR $GRT $RNDR
#Nasdaq #DowJones #StockMarket
Square-Creator-579fbb6fd06592ec7702:
Boa publicação
1
2
6
9.2k
Log in to explore more content
Join global crypto users on Binance Square
⚡️ Get latest and useful information about crypto.
💬 Trusted by the world’s largest crypto exchange.
👍 Discover real insights from verified creators.
Email / Phone number
Trending Topics
1
#CelestiaRises16%To2026High
13,610 views
196 Discussing
2
#NasdaqDowWeeklyGapWidestSinceJuly2002
12,589 views
227 Discussing
3
#Nasdaq100Falls5.5%InWorstWeekIn18Months
6,874 views
209 Discussing
4
#StrategySharesFall9%OnFriday
7,207 views
231 Discussing
5
#USPPIRises6.3%YearOverYear
43,029 views
432 Discussing
6
#CelestiaLaunchesEdenToTestAIAgentTrading
36,610 views
499 Discussing
7
#ETHDropsBelow2400USDT
68,322 views
775 Discussing
8
#CircleReports$1.4BInH1Revenue
3,548 views
25 Discussing
9
#BrentHits$110ForFirstTimeSinceMay
3,456 views
34 Discussing
10
#OpenAIAgentTookFundsFromUnownedTestnetWallet
21,775 views
419 Discussing