
#txn
txn
7,667 views
72 Discussing
Hot
Latest


$TXN BEARS IN CONTROL: EXTREME POSITIVE FUNDING COULD TRAP LATE LONGS
$TXN remains under bearish pressure as the 1H chart continues printing lower highs and lower lows. With price capped below $312.17, the big question is whether crowded long positions will fuel another downside move.
Market Signals to Watch
- Funding Rate: +0.2166%, indicating a strong premium paid by longs to shorts.
- Open Interest: $554K, up 9.5% in 24 hours.
- Taker Flow: 3.50x, with strong buyer activity despite the bearish structure.
- BTC Alignment: Bitcoin's bearish 1H trend adds pressure to the setup.
Key Support and Downside Targets
The immediate levels to monitor are $304.75, $300.86, and $293.49. A decisive breakdown below $293.49 could expose further support at $283.97, $277.35, and $272.67.
Trading Strategy
A potential short setup could emerge if price shows rejection or a swing failure pattern around $309.41–$311.60. Confirmation is essential before entering.
For a possible liquidity-sweep reversal, watch the $300.86–$293.49 demand zone for a bullish lower-timeframe structure shift. Potential recovery targets are $309.41 and $312.17.
Invalidation: A confirmed 1H close above $312.17 would weaken the bearish thesis and open the door toward $313.43 and higher levels.
Bottom Line: Positive funding, rising open interest, and a bearish market structure create a setup worth watching, but they do not guarantee a long squeeze. Wait for price confirmation, manage risk, and avoid chasing volatility.
Not financial advice. Educational analysis only.
#TXN #CryptoTrading #TechnicalAnalysis #FundingRate #BinanceSquare $TXN
{future}(TXNUSDT)
CHIL-WITH-CRYPTO
$TXN BEARS IN CONTROL: EXTREME POSITIVE FUNDING COULD TRAP LATE LONGS
$TXN remains under bearish pressure as the 1H chart continues printing lower highs and lower lows. With price capped below $312.17, the big question is whether crowded long positions will fuel another downside move.
Market Signals to Watch
- Funding Rate: +0.2166%, indicating a strong premium paid by longs to shorts.
- Open Interest: $554K, up 9.5% in 24 hours.
- Taker Flow: 3.50x, with strong buyer activity despite the bearish structure.
- BTC Alignment: Bitcoin's bearish 1H trend adds pressure to the setup.
Key Support and Downside Targets
The immediate levels to monitor are $304.75, $300.86, and $293.49. A decisive breakdown below $293.49 could expose further support at $283.97, $277.35, and $272.67.
Trading Strategy
A potential short setup could emerge if price shows rejection or a swing failure pattern around $309.41–$311.60. Confirmation is essential before entering.
For a possible liquidity-sweep reversal, watch the $300.86–$293.49 demand zone for a bullish lower-timeframe structure shift. Potential recovery targets are $309.41 and $312.17.
Invalidation: A confirmed 1H close above $312.17 would weaken the bearish thesis and open the door toward $313.43 and higher levels.
Bottom Line: Positive funding, rising open interest, and a bearish market structure create a setup worth watching, but they do not guarantee a long squeeze. Wait for price confirmation, manage risk, and avoid chasing volatility.
Not financial advice. Educational analysis only.
#TXN #CryptoTrading #TechnicalAnalysis #FundingRate #BinanceSquare $TXN
CHIL-WITH-CRYPTO
$TXN remains under bearish pressure as the 1H chart continues printing lower highs and lower lows. With price capped below $312.17, the big question is whether crowded long positions will fuel another downside move.
Market Signals to Watch
- Funding Rate: +0.2166%, indicating a strong premium paid by longs to shorts.
- Open Interest: $554K, up 9.5% in 24 hours.
- Taker Flow: 3.50x, with strong buyer activity despite the bearish structure.
- BTC Alignment: Bitcoin's bearish 1H trend adds pressure to the setup.
Key Support and Downside Targets
The immediate levels to monitor are $304.75, $300.86, and $293.49. A decisive breakdown below $293.49 could expose further support at $283.97, $277.35, and $272.67.
Trading Strategy
A potential short setup could emerge if price shows rejection or a swing failure pattern around $309.41–$311.60. Confirmation is essential before entering.
For a possible liquidity-sweep reversal, watch the $300.86–$293.49 demand zone for a bullish lower-timeframe structure shift. Potential recovery targets are $309.41 and $312.17.
Invalidation: A confirmed 1H close above $312.17 would weaken the bearish thesis and open the door toward $313.43 and higher levels.
Bottom Line: Positive funding, rising open interest, and a bearish market structure create a setup worth watching, but they do not guarantee a long squeeze. Wait for price confirmation, manage risk, and avoid chasing volatility.
Not financial advice. Educational analysis only.
#TXN #CryptoTrading #TechnicalAnalysis #FundingRate #BinanceSquare $TXN
CHIL-WITH-CRYPTO
74

·
--
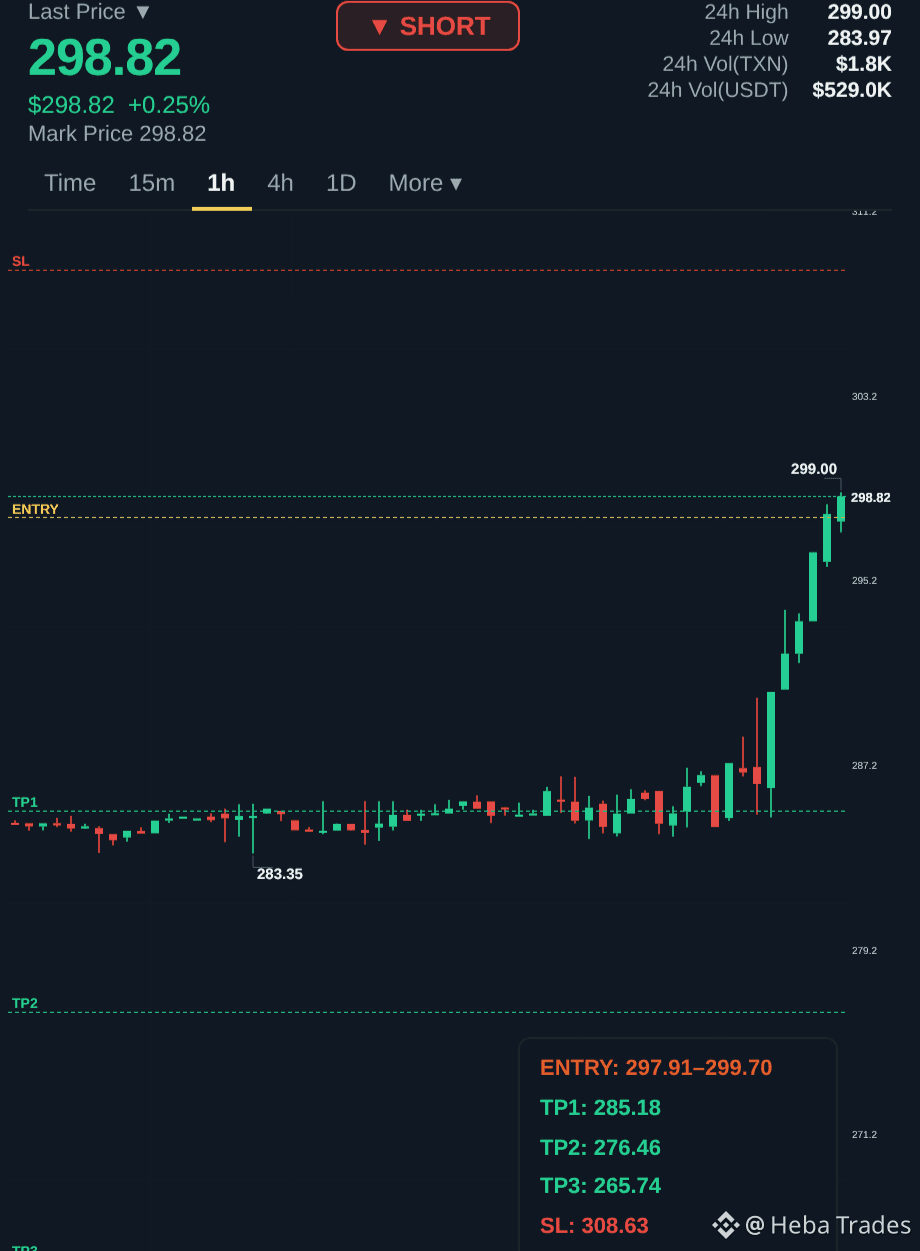
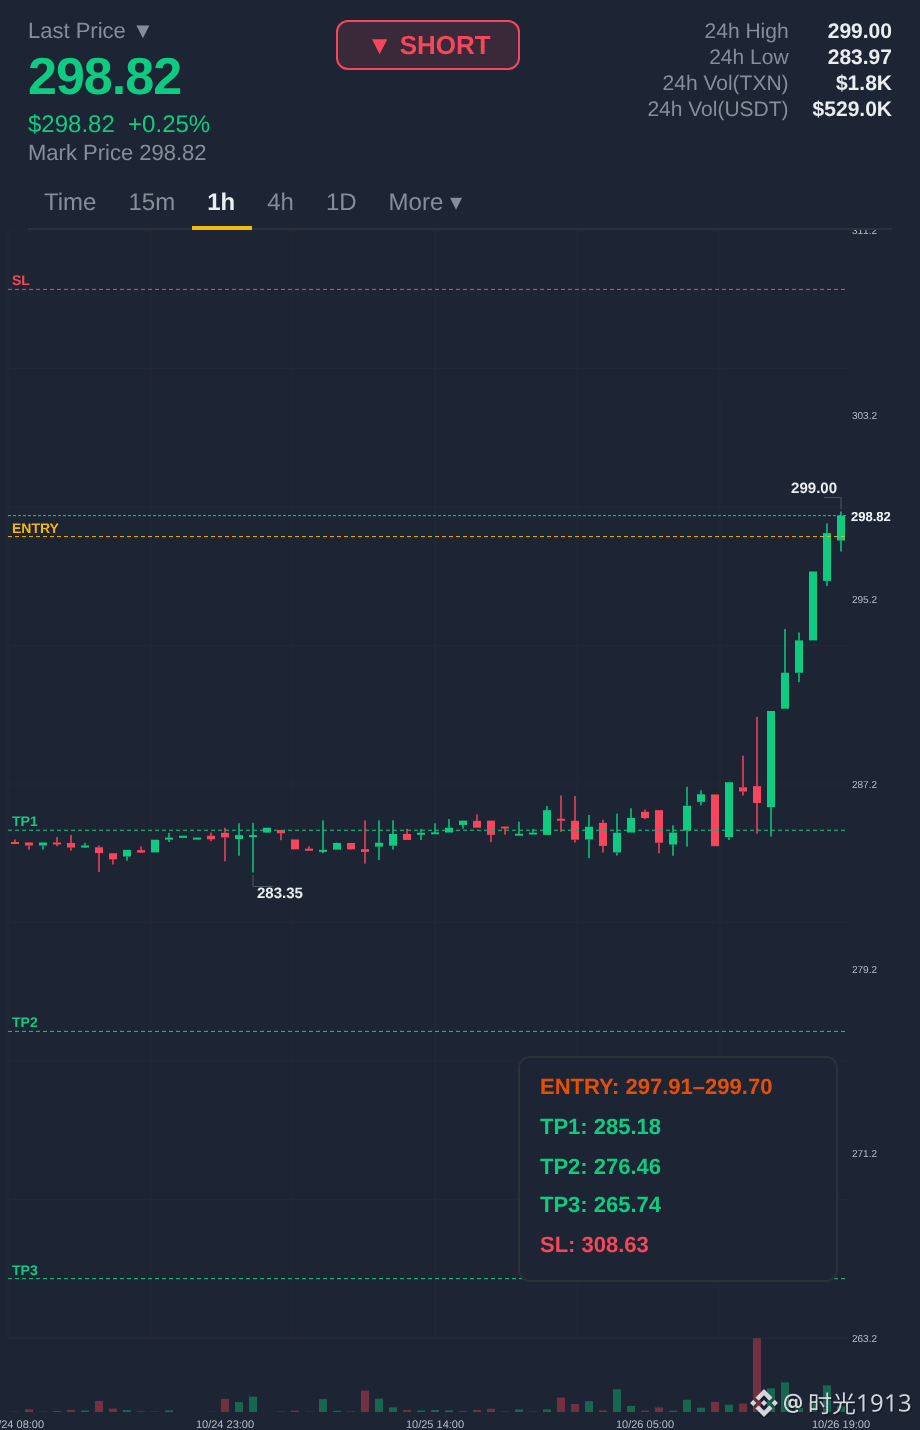
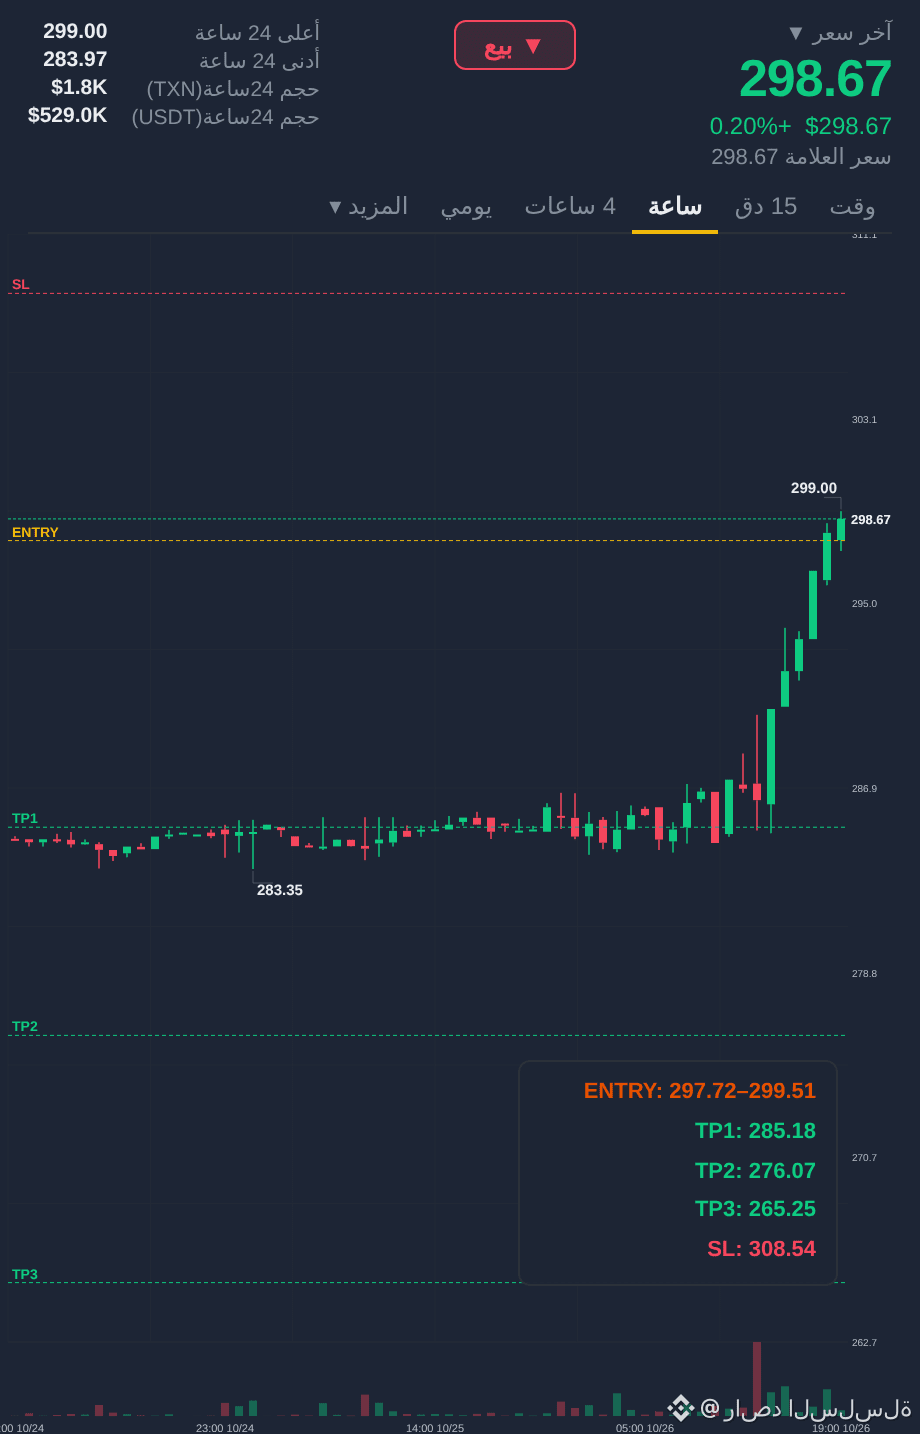
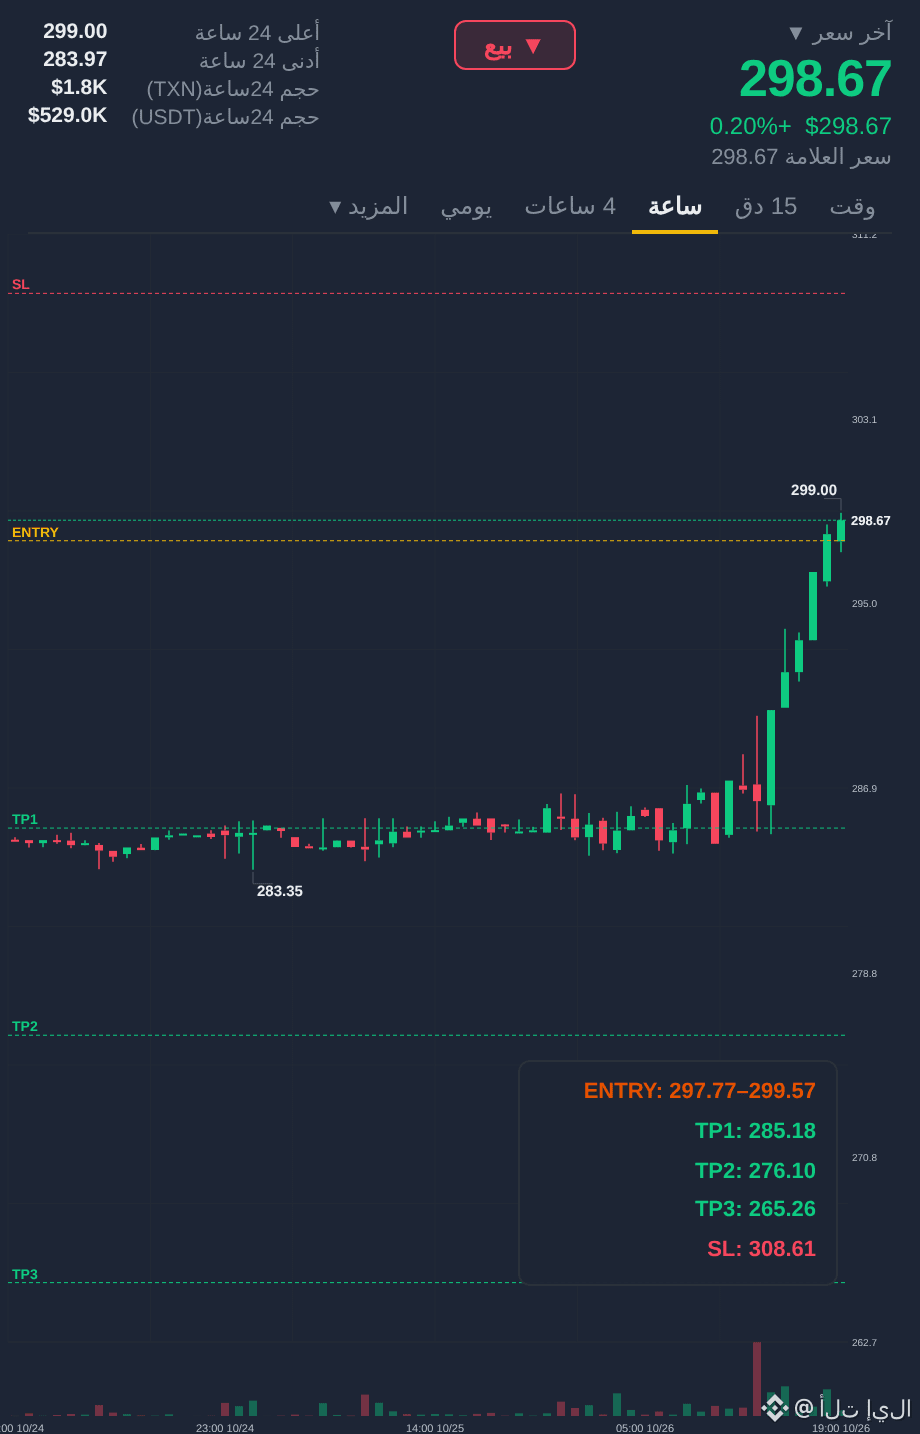
📉 $TXN SHORT SETUP
$TXN is approaching a key 1H resistance zone, with RSI at 82 signaling overbought conditions.
🔻 Entry: $297.91 – $299.70 🎯 TP1: $285.18 🎯 TP2: $276.46 🎯 TP3: $265.74 🛑 Stop Loss: $308.63
Funding Rate: +0.003%
Watch for bearish confirmation before entering. Manage risk carefully.
#TXN #BTC #CHIP #Trading
{future}(TXNUSDT)
📉 $TXN SHORT SETUP
$TXN is approaching a key 1H resistance zone, with RSI at 82 signaling overbought conditions.
🔻 Entry: $297.91 – $299.70 🎯 TP1: $285.18 🎯 TP2: $276.46 🎯 TP3: $265.74 🛑 Stop Loss: $308.63
Funding Rate: +0.003%
Watch for bearish confirmation before entering. Manage risk carefully.
#TXN #BTC #CHIP #Trading
$TXN is approaching a key 1H resistance zone, with RSI at 82 signaling overbought conditions.
🔻 Entry: $297.91 – $299.70 🎯 TP1: $285.18 🎯 TP2: $276.46 🎯 TP3: $265.74 🛑 Stop Loss: $308.63
Funding Rate: +0.003%
Watch for bearish confirmation before entering. Manage risk carefully.
#TXN #BTC #CHIP #Trading
2
161


·
--
$TXN / Tokenized Stock · Premium Monitoring
Token: TXNon | Underlying: TXN | Ratio: 1.01168
On-chain price: $301.15 (24h +4.70%)
Underlying U.S. stock: $297.56
Premium / Discount: +0.04% (vs. underlying fair value)
52-week range: $152.73 - $334.03
Number of holder addresses: 135
Underlying status: paused (Paused for session transition)
Why monitor the premium? The token trades 24/7, while the underlying U.S. stock is quoted only during U.S. market hours.
Premiums are most likely to widen when the market is closed—either due to on-chain buying pressure or growing expectations of redemptions or a trading halt.
Unusual premium swings often reveal sentiment and arbitrage gaps before the price itself does.
Do you find premium monitoring more useful, or is watching the price alone enough? 👇
(For educational purposes only, based on publicly available data. Not investment advice. DYOR.)
#TXN
$TXN / Tokenized Stock · Premium Monitoring
Token: TXNon | Underlying: TXN | Ratio: 1.01168
On-chain price: $301.15 (24h +4.70%)
Underlying U.S. stock: $297.56
Premium / Discount: +0.04% (vs. underlying fair value)
52-week range: $152.73 - $334.03
Number of holder addresses: 135
Underlying status: paused (Paused for session transition)
Why monitor the premium? The token trades 24/7, while the underlying U.S. stock is quoted only during U.S. market hours.
Premiums are most likely to widen when the market is closed—either due to on-chain buying pressure or growing expectations of redemptions or a trading halt.
Unusual premium swings often reveal sentiment and arbitrage gaps before the price itself does.
Do you find premium monitoring more useful, or is watching the price alone enough? 👇
(For educational purposes only, based on publicly available data. Not investment advice. DYOR.)
#TXN
Token: TXNon | Underlying: TXN | Ratio: 1.01168
On-chain price: $301.15 (24h +4.70%)
Underlying U.S. stock: $297.56
Premium / Discount: +0.04% (vs. underlying fair value)
52-week range: $152.73 - $334.03
Number of holder addresses: 135
Underlying status: paused (Paused for session transition)
Why monitor the premium? The token trades 24/7, while the underlying U.S. stock is quoted only during U.S. market hours.
Premiums are most likely to widen when the market is closed—either due to on-chain buying pressure or growing expectations of redemptions or a trading halt.
Unusual premium swings often reveal sentiment and arbitrage gaps before the price itself does.
Do you find premium monitoring more useful, or is watching the price alone enough? 👇
(For educational purposes only, based on publicly available data. Not investment advice. DYOR.)
#TXN
73



#股票财报季
#TXN
Business assessment: Texas Instruments’ operating recovery is supported by solid fundamentals. The recovery in analog chip demand and higher capacity utilization have driven a significant improvement in margins. However, free cash flow growth has also been boosted by lower capital expenditure and policy incentives. Current results are not yet sufficient to demonstrate a structural improvement of similar magnitude in long-term earnings potential.
Investment assessment: The current valuation already reflects strong expectations for an earnings recovery and improved cash flow. The available evidence is insufficient to conclude that Texas Instruments is significantly undervalued. Its investment potential going forward depends on whether growth can withstand the semiconductor cycle and whether strong cash flow can be sustained at normal levels of capital expenditure.
{stock_us}(TXN.US)
#股票财报季
#TXN
Business assessment: Texas Instruments’ operating recovery is supported by solid fundamentals. The recovery in analog chip demand and higher capacity utilization have driven a significant improvement in margins. However, free cash flow growth has also been boosted by lower capital expenditure and policy incentives. Current results are not yet sufficient to demonstrate a structural improvement of similar magnitude in long-term earnings potential.
Investment assessment: The current valuation already reflects strong expectations for an earnings recovery and improved cash flow. The available evidence is insufficient to conclude that Texas Instruments is significantly undervalued. Its investment potential going forward depends on whether growth can withstand the semiconductor cycle and whether strong cash flow can be sustained at normal levels of capital expenditure.
#TXN
Business assessment: Texas Instruments’ operating recovery is supported by solid fundamentals. The recovery in analog chip demand and higher capacity utilization have driven a significant improvement in margins. However, free cash flow growth has also been boosted by lower capital expenditure and policy incentives. Current results are not yet sufficient to demonstrate a structural improvement of similar magnitude in long-term earnings potential.
Investment assessment: The current valuation already reflects strong expectations for an earnings recovery and improved cash flow. The available evidence is insufficient to conclude that Texas Instruments is significantly undervalued. Its investment potential going forward depends on whether growth can withstand the semiconductor cycle and whether strong cash flow can be sustained at normal levels of capital expenditure.
TXNUS+0.73%
54
·
--
$TXN / Tokenized Stock · Premium Monitoring
Token: TXNon | Underlying: TXN | Multiplier: 1.01168
On-chain price: $280.91 (24h +1.47%)
Underlying U.S. stock: $279.72
Premium / discount: -0.74% (vs. underlying fair value)
52-week range: $152.73 - $334.03
Number of holder addresses: 134
Underlying status: paused (Paused for session transition)
Why monitor the premium: The token can be traded 24/7, while the underlying U.S. stock is quoted only during U.S. market hours.
Premiums are most likely to widen when the market is closed—either due to buying pressure on-chain or growing expectations of redemptions / trading halts.
Unusual premium swings often reveal sentiment and arbitrage gaps earlier than the price itself.
Do you find premium monitoring more useful, or is just looking at the price enough? 👇
(The above is for public-data education only, not investment advice. DYOR)
#TXN
$TXN / Tokenized Stock · Premium Monitoring
Token: TXNon | Underlying: TXN | Multiplier: 1.01168
On-chain price: $280.91 (24h +1.47%)
Underlying U.S. stock: $279.72
Premium / discount: -0.74% (vs. underlying fair value)
52-week range: $152.73 - $334.03
Number of holder addresses: 134
Underlying status: paused (Paused for session transition)
Why monitor the premium: The token can be traded 24/7, while the underlying U.S. stock is quoted only during U.S. market hours.
Premiums are most likely to widen when the market is closed—either due to buying pressure on-chain or growing expectations of redemptions / trading halts.
Unusual premium swings often reveal sentiment and arbitrage gaps earlier than the price itself.
Do you find premium monitoring more useful, or is just looking at the price enough? 👇
(The above is for public-data education only, not investment advice. DYOR)
#TXN
Token: TXNon | Underlying: TXN | Multiplier: 1.01168
On-chain price: $280.91 (24h +1.47%)
Underlying U.S. stock: $279.72
Premium / discount: -0.74% (vs. underlying fair value)
52-week range: $152.73 - $334.03
Number of holder addresses: 134
Underlying status: paused (Paused for session transition)
Why monitor the premium: The token can be traded 24/7, while the underlying U.S. stock is quoted only during U.S. market hours.
Premiums are most likely to widen when the market is closed—either due to buying pressure on-chain or growing expectations of redemptions / trading halts.
Unusual premium swings often reveal sentiment and arbitrage gaps earlier than the price itself.
Do you find premium monitoring more useful, or is just looking at the price enough? 👇
(The above is for public-data education only, not investment advice. DYOR)
#TXN
·
--
$TXN / Tokenized Stocks · Premium Monitoring
Token: TXNon | Underlying: TXN | Ratio: 1.01168
On-chain price: $279.39 (24h -0.66%)
Underlying U.S. stock: $276.17
Premium / Discount: -0.00% (vs. underlying fair value) (Underlying market closed; comparison uses the most recent closing price)
52-week range: $152.73 - $334.03
Number of holder addresses: 134
Underlying status: closed (Weekend or Holiday)
Why monitor the premium: Tokens can be traded 24/7, while underlying U.S. stocks are quoted only during U.S. market hours.
Premiums are most likely to widen when the market is closed—either buyers are rushing in on-chain, or expectations of redemptions/suspension are building.
Unusual premium swings often reveal sentiment and arbitrage gaps earlier than the price itself.
Do you find premium monitoring more useful, or is just watching the price enough? 👇
(The above is for educational purposes based on public data, not investment advice. DYOR)
#TXN
$TXN / Tokenized Stocks · Premium Monitoring
Token: TXNon | Underlying: TXN | Ratio: 1.01168
On-chain price: $279.39 (24h -0.66%)
Underlying U.S. stock: $276.17
Premium / Discount: -0.00% (vs. underlying fair value) (Underlying market closed; comparison uses the most recent closing price)
52-week range: $152.73 - $334.03
Number of holder addresses: 134
Underlying status: closed (Weekend or Holiday)
Why monitor the premium: Tokens can be traded 24/7, while underlying U.S. stocks are quoted only during U.S. market hours.
Premiums are most likely to widen when the market is closed—either buyers are rushing in on-chain, or expectations of redemptions/suspension are building.
Unusual premium swings often reveal sentiment and arbitrage gaps earlier than the price itself.
Do you find premium monitoring more useful, or is just watching the price enough? 👇
(The above is for educational purposes based on public data, not investment advice. DYOR)
#TXN
Token: TXNon | Underlying: TXN | Ratio: 1.01168
On-chain price: $279.39 (24h -0.66%)
Underlying U.S. stock: $276.17
Premium / Discount: -0.00% (vs. underlying fair value) (Underlying market closed; comparison uses the most recent closing price)
52-week range: $152.73 - $334.03
Number of holder addresses: 134
Underlying status: closed (Weekend or Holiday)
Why monitor the premium: Tokens can be traded 24/7, while underlying U.S. stocks are quoted only during U.S. market hours.
Premiums are most likely to widen when the market is closed—either buyers are rushing in on-chain, or expectations of redemptions/suspension are building.
Unusual premium swings often reveal sentiment and arbitrage gaps earlier than the price itself.
Do you find premium monitoring more useful, or is just watching the price enough? 👇
(The above is for educational purposes based on public data, not investment advice. DYOR)
#TXN

·
--
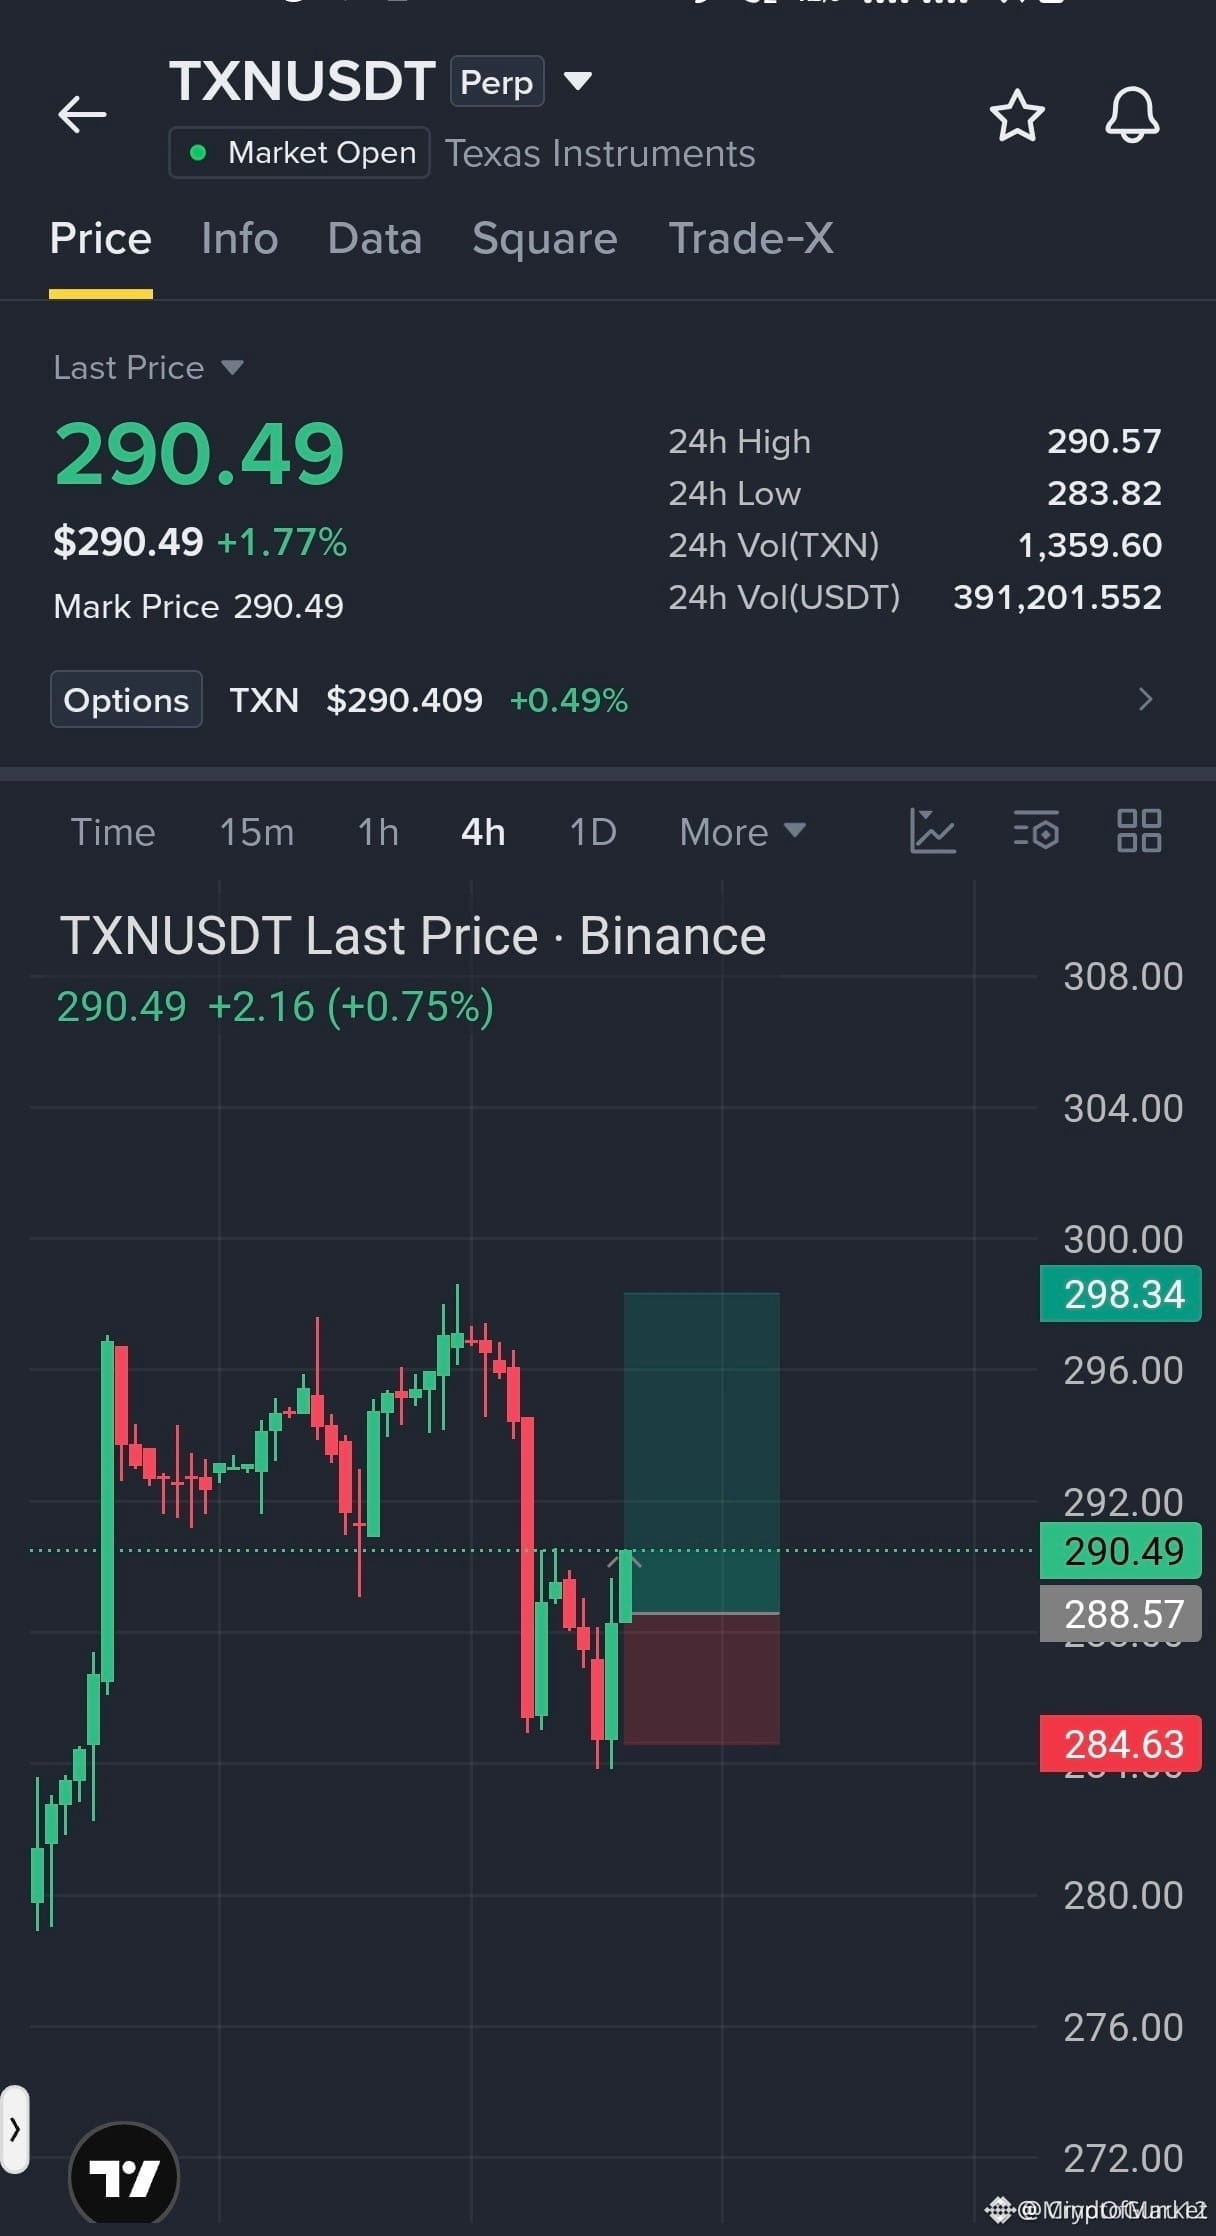
🚨 $TXN RECLAIMS 288.57 KEY ZONE AS SMART MONEY BULLS TARGET 298.00! 📈
Entry: 288.57 ⚡
Target: 298.00 🚀
Stop Loss: 284.63 ⚠️
Institutional order flow has defended the 284–286 demand block with precision, triggering a rapid reclaim of 288.57 on the 4H timeframe. 📊 Sellers failed to sweep lower liquidity, leaving behind a clean market structure shift as upward momentum expands.
Holding firmly above 288.57 keeps this bullish recovery structure intact for a expansion toward the 298.00 liquidity target. 📌 Risk remains tightly defined below 284.63 to ensure optimal execution parameters. 💬 Are you targeting the 298 expansion or waiting for a retest of demand? 👇
⚠️ Not financial advice. Always manage your risk. 🛡️
🏷️ #TXN #LongSetup #Breakout #Crypto #Trading
🎯 🦈
🚨 $TXN RECLAIMS 288.57 KEY ZONE AS SMART MONEY BULLS TARGET 298.00! 📈
Entry: 288.57 ⚡
Target: 298.00 🚀
Stop Loss: 284.63 ⚠️
Institutional order flow has defended the 284–286 demand block with precision, triggering a rapid reclaim of 288.57 on the 4H timeframe. 📊 Sellers failed to sweep lower liquidity, leaving behind a clean market structure shift as upward momentum expands.
Holding firmly above 288.57 keeps this bullish recovery structure intact for a expansion toward the 298.00 liquidity target. 📌 Risk remains tightly defined below 284.63 to ensure optimal execution parameters. 💬 Are you targeting the 298 expansion or waiting for a retest of demand? 👇
⚠️ Not financial advice. Always manage your risk. 🛡️
🏷️ #TXN #LongSetup #Breakout #Crypto #Trading
🎯 🦈
Entry: 288.57 ⚡
Target: 298.00 🚀
Stop Loss: 284.63 ⚠️
Institutional order flow has defended the 284–286 demand block with precision, triggering a rapid reclaim of 288.57 on the 4H timeframe. 📊 Sellers failed to sweep lower liquidity, leaving behind a clean market structure shift as upward momentum expands.
Holding firmly above 288.57 keeps this bullish recovery structure intact for a expansion toward the 298.00 liquidity target. 📌 Risk remains tightly defined below 284.63 to ensure optimal execution parameters. 💬 Are you targeting the 298 expansion or waiting for a retest of demand? 👇
⚠️ Not financial advice. Always manage your risk. 🛡️
🏷️ #TXN #LongSetup #Breakout #Crypto #Trading
🎯 🦈
10

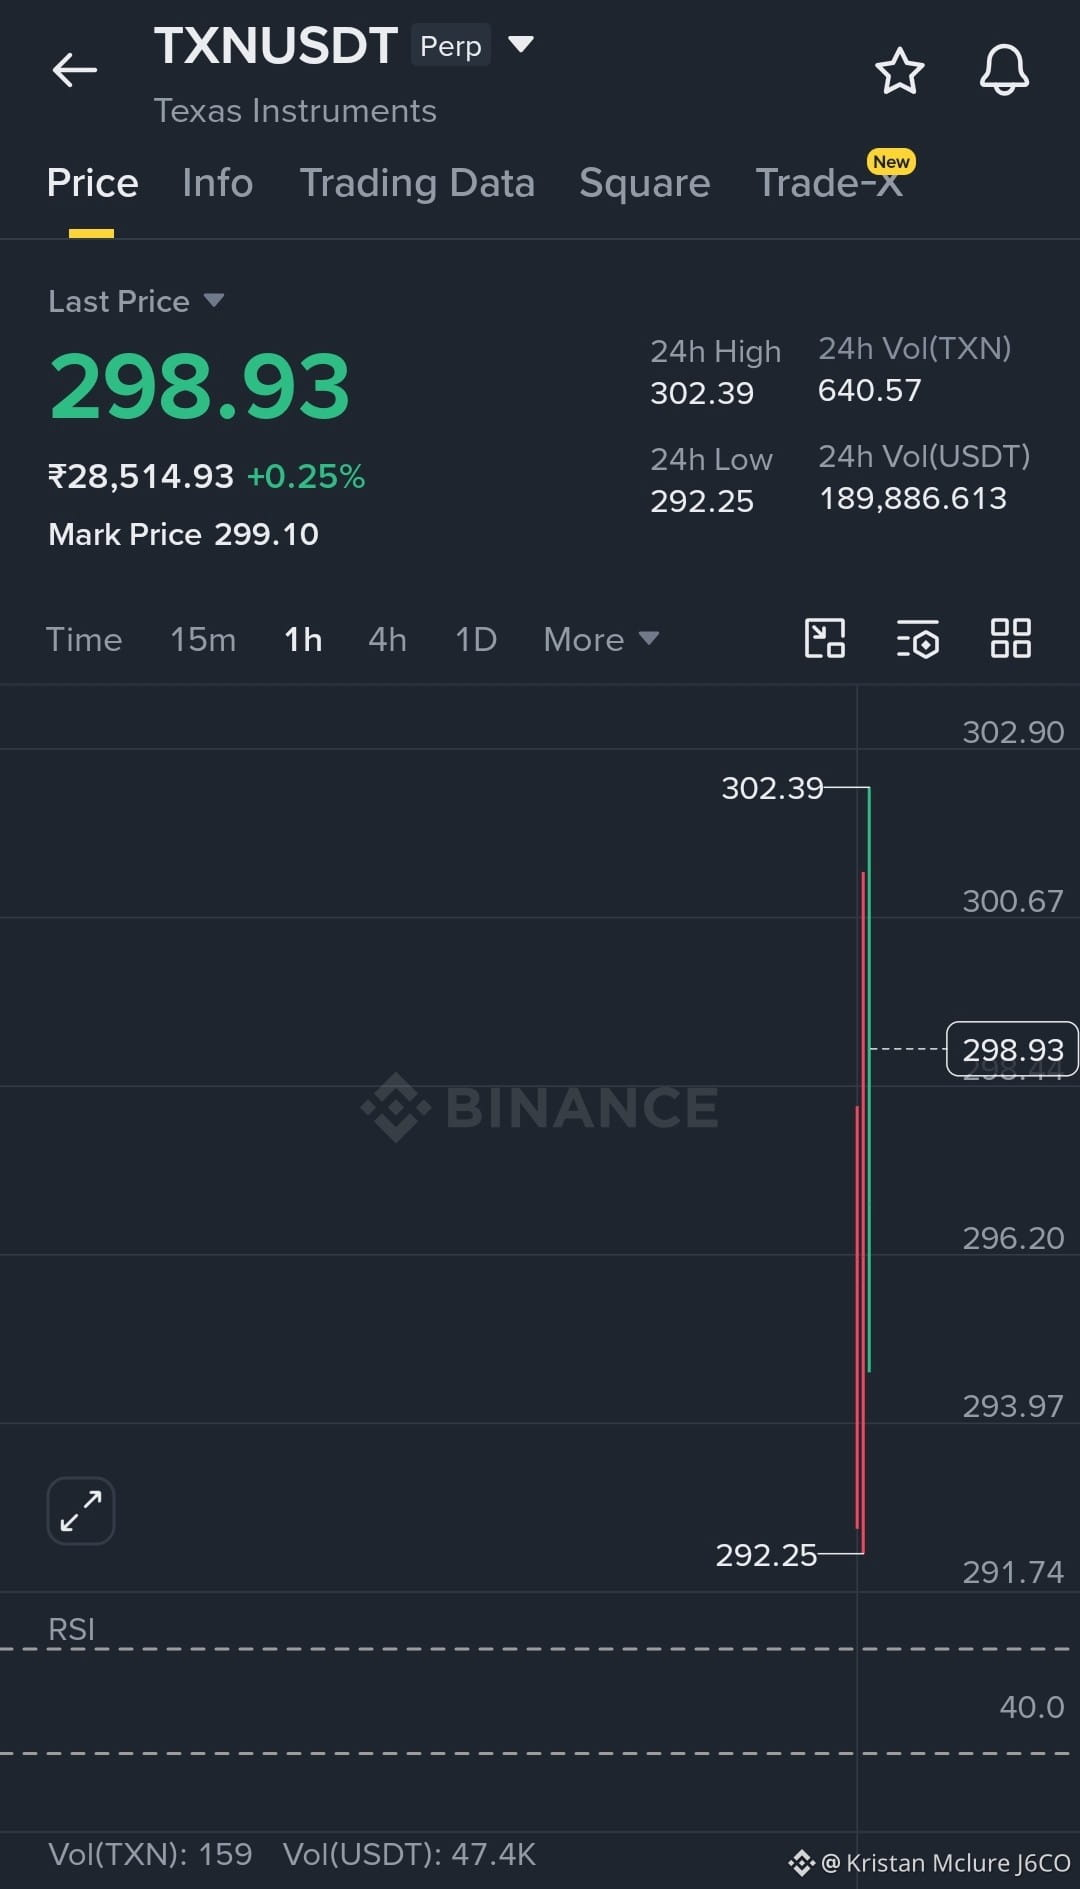
$TXN futures just opened and immediately swept both sides of the market, dropping to $292.25 before ripping to $302.39 in the same launch range. That's exactly the kind of price discovery action traders expect from a fresh listing.
Setup:
• Entry: $297 – $299
• Target 1: $302.40 🎯
• Target 2: $307.00 🎯
• Target 3: $312.00 🎯
• Stop-Loss: $294.00
Analysis: With almost no chart history available, the launch range is the only structure that matters right now. The flush to $292.25 looks like an early liquidity grab, and buyers responded immediately by driving price above $300. What's notable is that TXN didn't stay at the lows for long—every dip was bought and price quickly returned to the middle-upper part of the range. As long as $297-$299 holds, bulls remain in control. A clean break above $302.39 would put TXN into fresh price discovery and could attract another wave of momentum traders. Below $294, the launch momentum starts to weaken and the market may need more time to build a base.
New futures listings are rarely clean trends on day one. Right now, TXN is trading exactly like a fresh market should—high volatility, liquidity sweeps, and traders fighting to establish fair value. 🚀📈
Trade #TXN here
{future}(TXNUSDT)
$DATAIP $BREV
$TXN futures just opened and immediately swept both sides of the market, dropping to $292.25 before ripping to $302.39 in the same launch range. That's exactly the kind of price discovery action traders expect from a fresh listing.
Setup:
• Entry: $297 – $299
• Target 1: $302.40 🎯
• Target 2: $307.00 🎯
• Target 3: $312.00 🎯
• Stop-Loss: $294.00
Analysis: With almost no chart history available, the launch range is the only structure that matters right now. The flush to $292.25 looks like an early liquidity grab, and buyers responded immediately by driving price above $300. What's notable is that TXN didn't stay at the lows for long—every dip was bought and price quickly returned to the middle-upper part of the range. As long as $297-$299 holds, bulls remain in control. A clean break above $302.39 would put TXN into fresh price discovery and could attract another wave of momentum traders. Below $294, the launch momentum starts to weaken and the market may need more time to build a base.
New futures listings are rarely clean trends on day one. Right now, TXN is trading exactly like a fresh market should—high volatility, liquidity sweeps, and traders fighting to establish fair value. 🚀📈
Trade #TXN here
$DATAIP $BREV
Setup:
• Entry: $297 – $299
• Target 1: $302.40 🎯
• Target 2: $307.00 🎯
• Target 3: $312.00 🎯
• Stop-Loss: $294.00
Analysis: With almost no chart history available, the launch range is the only structure that matters right now. The flush to $292.25 looks like an early liquidity grab, and buyers responded immediately by driving price above $300. What's notable is that TXN didn't stay at the lows for long—every dip was bought and price quickly returned to the middle-upper part of the range. As long as $297-$299 holds, bulls remain in control. A clean break above $302.39 would put TXN into fresh price discovery and could attract another wave of momentum traders. Below $294, the launch momentum starts to weaken and the market may need more time to build a base.
New futures listings are rarely clean trends on day one. Right now, TXN is trading exactly like a fresh market should—high volatility, liquidity sweeps, and traders fighting to establish fair value. 🚀📈
Trade #TXN here
$DATAIP $BREV
1
379

·
--
Watching $TXN during the day: in the past 24 hours, it’s up 1.212%, with the price at 260.55. The funding rate is exactly 0.00000000—neither longs nor shorts have paid any premium. That suggests the political narrative hasn’t yet forced positions out. Trading volume is 82153.75 USD, open interest is 931.68. The stock is cold, and there’s a lack of tradable catalysts on the policy front. This equity contract is still being driven by the sector’s beta. I won’t touch it—I'll only discuss direction if the funding rate is clearly skewed away from zero, or if open interest doubles. Right now, chasing longs based on political expectations is not something I can provide a stop-loss level for.
Trading tag: #TradFi #链上美股 #TXN
Where do you think this line of reasoning is most likely to be wrong?
Watching $TXN during the day: in the past 24 hours, it’s up 1.212%, with the price at 260.55. The funding rate is exactly 0.00000000—neither longs nor shorts have paid any premium. That suggests the political narrative hasn’t yet forced positions out. Trading volume is 82153.75 USD, open interest is 931.68. The stock is cold, and there’s a lack of tradable catalysts on the policy front. This equity contract is still being driven by the sector’s beta. I won’t touch it—I'll only discuss direction if the funding rate is clearly skewed away from zero, or if open interest doubles. Right now, chasing longs based on political expectations is not something I can provide a stop-loss level for.
Trading tag: #TradFi #链上美股 #TXN
Where do you think this line of reasoning is most likely to be wrong?
Trading tag: #TradFi #链上美股 #TXN
Where do you think this line of reasoning is most likely to be wrong?
36

·
--
Market Flash: $TXN 📊
Suggested Direction: Short
Entry: 260.0145-261.8911
Stop-Loss Reference: 262.9336
Target Prices: 258.5549/256.4698/253.3421
Analysis: Wow, TXN’s price action is really getting people impatient. The short-term moving averages have already crossed below the long-term moving average, and the MACD has also formed a dead cross—this is a textbook bearish signal. Now the price is hovering around the short-term moving average again, which is exactly the kind of frustrating “chop” pattern that wears people down. I suggest everyone exit the trade as soon as possible. I’ve also marked the stop-loss around 262—adjust your position size according to your own risk tolerance. Don’t let this market turn you into a rookie.
Tip: Suggested Stop-Loss Level: 262.933632. Please adjust your position based on your own risk preference.
#TXN
Market Flash: $TXN 📊
Suggested Direction: Short
Entry: 260.0145-261.8911
Stop-Loss Reference: 262.9336
Target Prices: 258.5549/256.4698/253.3421
Analysis: Wow, TXN’s price action is really getting people impatient. The short-term moving averages have already crossed below the long-term moving average, and the MACD has also formed a dead cross—this is a textbook bearish signal. Now the price is hovering around the short-term moving average again, which is exactly the kind of frustrating “chop” pattern that wears people down. I suggest everyone exit the trade as soon as possible. I’ve also marked the stop-loss around 262—adjust your position size according to your own risk tolerance. Don’t let this market turn you into a rookie.
Tip: Suggested Stop-Loss Level: 262.933632. Please adjust your position based on your own risk preference.
#TXN
Suggested Direction: Short
Entry: 260.0145-261.8911
Stop-Loss Reference: 262.9336
Target Prices: 258.5549/256.4698/253.3421
Analysis: Wow, TXN’s price action is really getting people impatient. The short-term moving averages have already crossed below the long-term moving average, and the MACD has also formed a dead cross—this is a textbook bearish signal. Now the price is hovering around the short-term moving average again, which is exactly the kind of frustrating “chop” pattern that wears people down. I suggest everyone exit the trade as soon as possible. I’ve also marked the stop-loss around 262—adjust your position size according to your own risk tolerance. Don’t let this market turn you into a rookie.
Tip: Suggested Stop-Loss Level: 262.933632. Please adjust your position based on your own risk preference.
#TXN
26
·
--
TXNUSDT 260.55, up 1.212% over the past 24 hours. Funding fee: 0. Position size: 931.68. Both long and short haven’t paid for the political side—funding fee is staying at zero, which indicates nobody is using leverage to take sides. OI also hasn’t moved. Assessment: politics hasn’t been priced in; price is just tracking the spot. The counterpoint is that it’s up 1.212%, but that doesn’t amount to a breakout. Only if the funding fee turns positive or breaks below 260.55 would I change my stance. For now, I won’t add to the position—I’ll wait for the funding fee to show a direction.
Trading tag: #TradFi #链上美股 #TXN
Where do you think this set of assumptions is most likely to be wrong?
TXNUSDT 260.55, up 1.212% over the past 24 hours. Funding fee: 0. Position size: 931.68. Both long and short haven’t paid for the political side—funding fee is staying at zero, which indicates nobody is using leverage to take sides. OI also hasn’t moved. Assessment: politics hasn’t been priced in; price is just tracking the spot. The counterpoint is that it’s up 1.212%, but that doesn’t amount to a breakout. Only if the funding fee turns positive or breaks below 260.55 would I change my stance. For now, I won’t add to the position—I’ll wait for the funding fee to show a direction.
Trading tag: #TradFi #链上美股 #TXN
Where do you think this set of assumptions is most likely to be wrong?
Trading tag: #TradFi #链上美股 #TXN
Where do you think this set of assumptions is most likely to be wrong?
43
·
--
$TXN rallied 4.615% in a single day, with the price holding above $272.9. Political uncertainty has intensified, and capital has flowed into defensive sectors. The cash-flow business of this industrial giant has become a safe haven. The funding rate turned positive in tandem to 0.000227; bullish sentiment is warming up but not overheated. Together with the upward price action, this points to a mild long-biased setup.
From the opposing view: if political risk clears up later, capital could quickly rotate back into growth stocks. The absolute size of the position holdings is not high, which limits the potential for a short-term surge.
Trading tag: #TradFi #链上美股 #TXN
Where do you think this assessment is most likely to be wrong?
$TXN rallied 4.615% in a single day, with the price holding above $272.9. Political uncertainty has intensified, and capital has flowed into defensive sectors. The cash-flow business of this industrial giant has become a safe haven. The funding rate turned positive in tandem to 0.000227; bullish sentiment is warming up but not overheated. Together with the upward price action, this points to a mild long-biased setup.
From the opposing view: if political risk clears up later, capital could quickly rotate back into growth stocks. The absolute size of the position holdings is not high, which limits the potential for a short-term surge.
Trading tag: #TradFi #链上美股 #TXN
Where do you think this assessment is most likely to be wrong?
From the opposing view: if political risk clears up later, capital could quickly rotate back into growth stocks. The absolute size of the position holdings is not high, which limits the potential for a short-term surge.
Trading tag: #TradFi #链上美股 #TXN
Where do you think this assessment is most likely to be wrong?
54

TXN交易额垫底,空单到0
涨太多就该跌,逻辑很简单。
★ $TXN #TXN 【Main】
Current position $264.21, 24h change -0.71%
24h trading volume is only $734k, dead last in the whole market
→ Volume is falling, price is dropping, the shorts thesis holds—continue holding short until it reaches 0
Rallies lack momentum; shorts are in control
A rebound to $317.05 is a good short entry; if it hits $348.76, exit in surrender
These are also good times to short:
····
$FLOCK
Current $0.071040, 24h change +3.94%
Entry: $0.085248—place a short limit order; set stop loss at 10% ($0.093773)
····
$BTW
Current $0.702400, 24h change -7.39%
Entry: $0.842880—place a short limit order; set stop loss at 10% ($0.927168)
····
⚠️ Small capital—test carefully, use strict stop loss, and don’t trade without risk control
#altcoins
TXN交易额垫底,空单到0
涨太多就该跌,逻辑很简单。
★ $TXN #TXN 【Main】
Current position $264.21, 24h change -0.71%
24h trading volume is only $734k, dead last in the whole market
→ Volume is falling, price is dropping, the shorts thesis holds—continue holding short until it reaches 0
Rallies lack momentum; shorts are in control
A rebound to $317.05 is a good short entry; if it hits $348.76, exit in surrender
These are also good times to short:
····
$FLOCK
Current $0.071040, 24h change +3.94%
Entry: $0.085248—place a short limit order; set stop loss at 10% ($0.093773)
····
$BTW
Current $0.702400, 24h change -7.39%
Entry: $0.842880—place a short limit order; set stop loss at 10% ($0.927168)
····
⚠️ Small capital—test carefully, use strict stop loss, and don’t trade without risk control
#altcoins
涨太多就该跌,逻辑很简单。
★ $TXN #TXN 【Main】
Current position $264.21, 24h change -0.71%
24h trading volume is only $734k, dead last in the whole market
→ Volume is falling, price is dropping, the shorts thesis holds—continue holding short until it reaches 0
Rallies lack momentum; shorts are in control
A rebound to $317.05 is a good short entry; if it hits $348.76, exit in surrender
These are also good times to short:
····
$FLOCK
Current $0.071040, 24h change +3.94%
Entry: $0.085248—place a short limit order; set stop loss at 10% ($0.093773)
····
$BTW
Current $0.702400, 24h change -7.39%
Entry: $0.842880—place a short limit order; set stop loss at 10% ($0.927168)
····
⚠️ Small capital—test carefully, use strict stop loss, and don’t trade without risk control
#altcoins
29

@Square-Creator-5a9c08b8a02fe Current Trend: 🟢 Bullish (medium to long term), with short-term consolidation
Price: Around $293–300 after a strong rally in recent months.
Trend: The stock remains above its major long-term moving averages, indicating the primary uptrend is still intact despite recent profit-taking.
Resistance: $305–310, followed by the all-time high area near $330–335.
Support: $285–290, with stronger support around $270–275.
Momentum: Neutral to slightly bullish. A breakout above $305 could trigger another move toward the previous highs, while losing $285 may lead to a deeper pullback.
Trading outlook
Bullish scenario: Hold above $290 and break $305 → target $320–330.
Bearish scenario: Close below $285 → downside risk toward $270.
Overall rating: Moderately Bullish (7.5/10). The long-term trend remains positive, but traders should watch for a confirmed breakout above resistance before expecting another strong upward leg.
#TXN #USADP98KMiss #BitcoinWorstFirstHalfSince2022 #AvalancheTreasuryFlagsGoingConcernRisk #levelsabovemagical
$TXN
{future}(TXNUSDT)
$BIRB
{future}(BIRBUSDT)
$ALLO
{future}(ALLOUSDT)
@Levels Above Magical Current Trend: 🟢 Bullish (medium to long term), with short-term consolidation
Price: Around $293–300 after a strong rally in recent months.
Trend: The stock remains above its major long-term moving averages, indicating the primary uptrend is still intact despite recent profit-taking.
Resistance: $305–310, followed by the all-time high area near $330–335.
Support: $285–290, with stronger support around $270–275.
Momentum: Neutral to slightly bullish. A breakout above $305 could trigger another move toward the previous highs, while losing $285 may lead to a deeper pullback.
Trading outlook
Bullish scenario: Hold above $290 and break $305 → target $320–330.
Bearish scenario: Close below $285 → downside risk toward $270.
Overall rating: Moderately Bullish (7.5/10). The long-term trend remains positive, but traders should watch for a confirmed breakout above resistance before expecting another strong upward leg.
#TXN #USADP98KMiss #BitcoinWorstFirstHalfSince2022 #AvalancheTreasuryFlagsGoingConcernRisk #levelsabovemagical
$TXN
$BIRB
$ALLO
Price: Around $293–300 after a strong rally in recent months.
Trend: The stock remains above its major long-term moving averages, indicating the primary uptrend is still intact despite recent profit-taking.
Resistance: $305–310, followed by the all-time high area near $330–335.
Support: $285–290, with stronger support around $270–275.
Momentum: Neutral to slightly bullish. A breakout above $305 could trigger another move toward the previous highs, while losing $285 may lead to a deeper pullback.
Trading outlook
Bullish scenario: Hold above $290 and break $305 → target $320–330.
Bearish scenario: Close below $285 → downside risk toward $270.
Overall rating: Moderately Bullish (7.5/10). The long-term trend remains positive, but traders should watch for a confirmed breakout above resistance before expecting another strong upward leg.
#TXN #USADP98KMiss #BitcoinWorstFirstHalfSince2022 #AvalancheTreasuryFlagsGoingConcernRisk #levelsabovemagical
$TXN
$BIRB
$ALLO
1
239

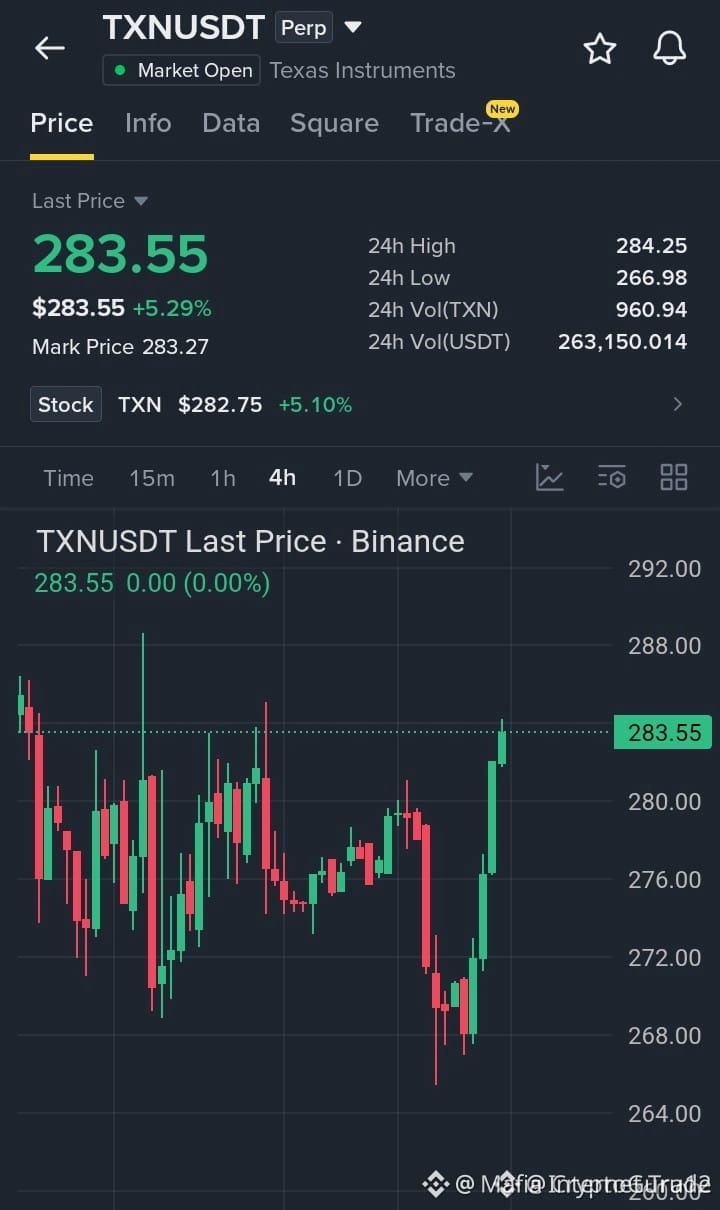
🚨 $TXN BULLS HOLD THE LINE — BREAKOUT UNLEASHES THE NEXT LEG UP ⚡🐂
Entry: 282.50 – 284.00 ⚡
Target: 287.00 / 291.00 / 296.00 🚀
Stop Loss: 277.00 ⚠️
Buyers just turned support into a fortress, absorbing every dip and flipping the narrative. 📊 The recoil off that defended zone shows serious bid presence underneath, momentum has rotated back to the long side. The real trigger sits at the recent high — clear that and the market opens up fresh air above.
Risk window is tight, with a structured invalidation at 277.00 and stacked targets that scale out beautifully. 🎯 Forcing the entry? No. Waiting for the confirmed breakout or a retest of 282.50–284.00 gives you the sharper risk-to-reward. 🔍
💭 Are you buying the breakout or waiting for the retest to load up? 👇
⚠️ Not financial advice. Always manage your risk. 🛡️
🏷️ #TXN #LongSetup #Breakout #Momentum #Crypto
📈 🎯
🚨 $TXN BULLS HOLD THE LINE — BREAKOUT UNLEASHES THE NEXT LEG UP ⚡🐂
Entry: 282.50 – 284.00 ⚡
Target: 287.00 / 291.00 / 296.00 🚀
Stop Loss: 277.00 ⚠️
Buyers just turned support into a fortress, absorbing every dip and flipping the narrative. 📊 The recoil off that defended zone shows serious bid presence underneath, momentum has rotated back to the long side. The real trigger sits at the recent high — clear that and the market opens up fresh air above.
Risk window is tight, with a structured invalidation at 277.00 and stacked targets that scale out beautifully. 🎯 Forcing the entry? No. Waiting for the confirmed breakout or a retest of 282.50–284.00 gives you the sharper risk-to-reward. 🔍
💭 Are you buying the breakout or waiting for the retest to load up? 👇
⚠️ Not financial advice. Always manage your risk. 🛡️
🏷️ #TXN #LongSetup #Breakout #Momentum #Crypto
📈 🎯
Entry: 282.50 – 284.00 ⚡
Target: 287.00 / 291.00 / 296.00 🚀
Stop Loss: 277.00 ⚠️
Buyers just turned support into a fortress, absorbing every dip and flipping the narrative. 📊 The recoil off that defended zone shows serious bid presence underneath, momentum has rotated back to the long side. The real trigger sits at the recent high — clear that and the market opens up fresh air above.
Risk window is tight, with a structured invalidation at 277.00 and stacked targets that scale out beautifully. 🎯 Forcing the entry? No. Waiting for the confirmed breakout or a retest of 282.50–284.00 gives you the sharper risk-to-reward. 🔍
💭 Are you buying the breakout or waiting for the retest to load up? 👇
⚠️ Not financial advice. Always manage your risk. 🛡️
🏷️ #TXN #LongSetup #Breakout #Momentum #Crypto
📈 🎯
10

·
--
Bearish
Short Trade Setup
$TXN /USDT Short Setup
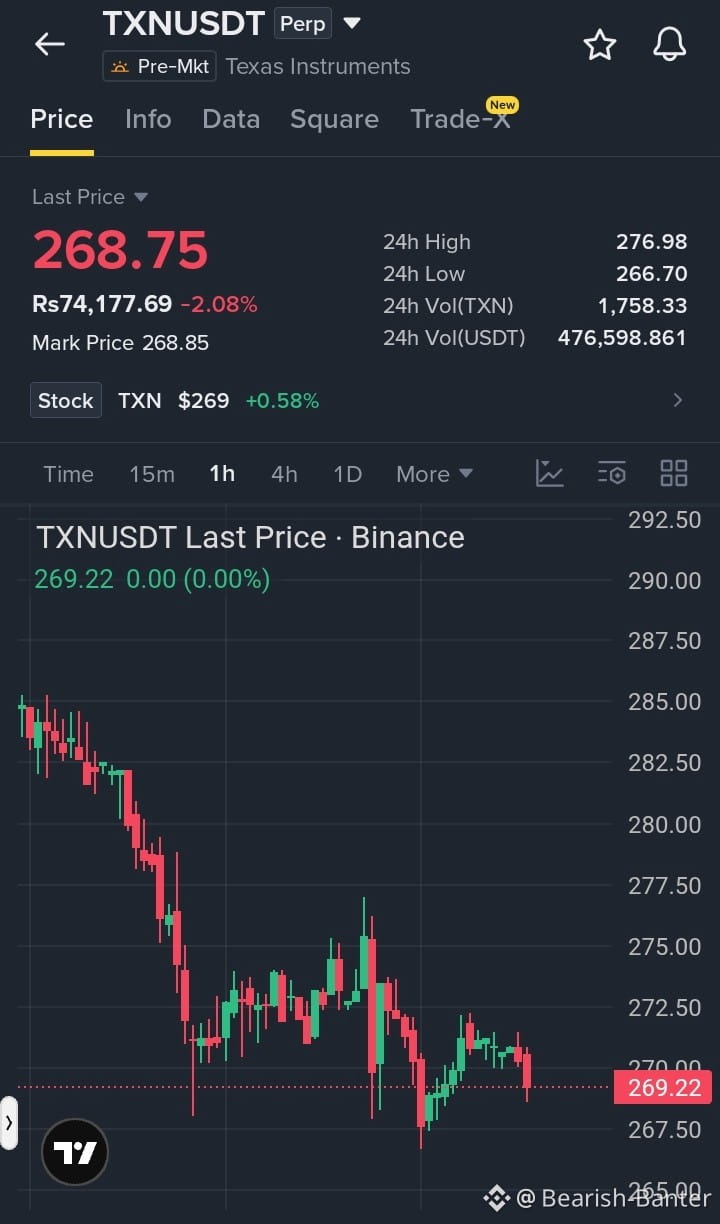
#TXN /USDT is showing bearish momentum on the 1H chart after rejection around $272–$275. A short setup looks interesting below $269, with downside targets near $267 and $265. Wait for confirmation and manage risk carefully.
{future}(TXNUSDT)
$BB
{spot}(BBUSDT)
$BTW
{future}(BTWUSDT)
Short Trade Setup
$TXN /USDT Short Setup
#TXN /USDT is showing bearish momentum on the 1H chart after rejection around $272–$275. A short setup looks interesting below $269, with downside targets near $267 and $265. Wait for confirmation and manage risk carefully.
$BB
$BTW
$TXN /USDT Short Setup
#TXN /USDT is showing bearish momentum on the 1H chart after rejection around $272–$275. A short setup looks interesting below $269, with downside targets near $267 and $265. Wait for confirmation and manage risk carefully.
$BB
$BTW
1
286

·
--
$TXN 30 minutes slightly bullish; after the golden cross, the volume expansion indicator has just confirmed the bullish trend 🔥
════════════════════
🔴 $TXN 30 minutes Bullish Signal
⚠️ Technicals: ADX (25) trend is forming and becoming available to participate; MACD bullish momentum is strengthening; EMA bullish alignment; KDJ golden cross has not entered overbought; trading volume increased by 2.1x; short-term outlook remains bullish.
════════════════════
🔔 Watch for firsthand market-move anomalies 🔔
#技术分析 #TXN
📌 When trading, pay attention to whether the candlestick pattern matches
$TXN 30 minutes slightly bullish; after the golden cross, the volume expansion indicator has just confirmed the bullish trend 🔥
════════════════════
🔴 $TXN 30 minutes Bullish Signal
⚠️ Technicals: ADX (25) trend is forming and becoming available to participate; MACD bullish momentum is strengthening; EMA bullish alignment; KDJ golden cross has not entered overbought; trading volume increased by 2.1x; short-term outlook remains bullish.
════════════════════
🔔 Watch for firsthand market-move anomalies 🔔
#技术分析 #TXN
📌 When trading, pay attention to whether the candlestick pattern matches
════════════════════
🔴 $TXN 30 minutes Bullish Signal
⚠️ Technicals: ADX (25) trend is forming and becoming available to participate; MACD bullish momentum is strengthening; EMA bullish alignment; KDJ golden cross has not entered overbought; trading volume increased by 2.1x; short-term outlook remains bullish.
════════════════════
🔔 Watch for firsthand market-move anomalies 🔔
#技术分析 #TXN
📌 When trading, pay attention to whether the candlestick pattern matches
TXNUS+0.73%
30
Log in to explore more content
Join global crypto users on Binance Square
⚡️ Get latest and useful information about crypto.
💬 Trusted by the world’s largest crypto exchange.
👍 Discover real insights from verified creators.
Email / Phone number
Trending Topics
1
#USMidterms-WhatAreMarketsExpecting?
124,368 views
975 Discussing
2
#USOctoberNFP-AreRateCutsStillPossible
266,971 views
2,077 Discussing
3
#CircleQ3Revenue865M
20 views
42 Discussing
4
#AMDBeatsExpectations-AINarrativeContinues
30,319 views
371 Discussing
5
#BinanceIncidentReport
281,394 views
1,510 Discussing
6
#AnthropicIPOPricedDownasInvestorsEye$1.5T
19,888 views
113 Discussing
7
#HongKongPassesCryptoAssetReportingFrameworkAmendment
28 views
6 Discussing
8
#37thQuarterlyBNBBurnRemoves1.64MillionBNB
1,961 views
74 Discussing
9
#BinanceReopensWithdrawalsForMoreAssets
387,002 views
2,450 Discussing
10
#HongKongToLicenseVirtualAssetCustodyAndAdvisory
4,142 views
110 Discussing