

量化员-小姐姐
2k Posts

量化员-小姐姐
Report
Block User
我有一个梦想,达到1万粉丝要多久?每天自动分享一些区块链项目知识。
Open Trade

UNI Holder
High-Frequency Trader
8.5 Years
34 Following
31 Followers
27 Liked
Posts
Portfolio
All
Quotes
·
--
$CRWD / Tokenized Stocks · Premium Monitoring
Token: CRWDon | Underlying: CRWD | Multiplier: 4
On-chain price: $1,077.26 (24h +3.80%)
Underlying U.S. stock: $269.53
Premium / discount: -0.08% (vs. underlying fair value) (Underlying market is closed; comparison uses the latest closing price)
52-week range: $85.68 - $286.99
Number of holder addresses: 220
Underlying status: closed
Why monitor the premium? The token can be traded 24/7, while the underlying U.S. stock is quoted only during U.S. market hours.
Premiums are most likely to widen when markets are closed—whether due to buying pressure on-chain or growing expectations of redemptions or a trading halt.
Unusual premium movements often reveal sentiment and arbitrage gaps earlier than the price itself.
Do you find premium monitoring more useful, or is just watching the price enough? 👇
(The above is for informational purposes only and is based on publicly available data. Not investment advice. DYOR.)
#CRWD
·
--
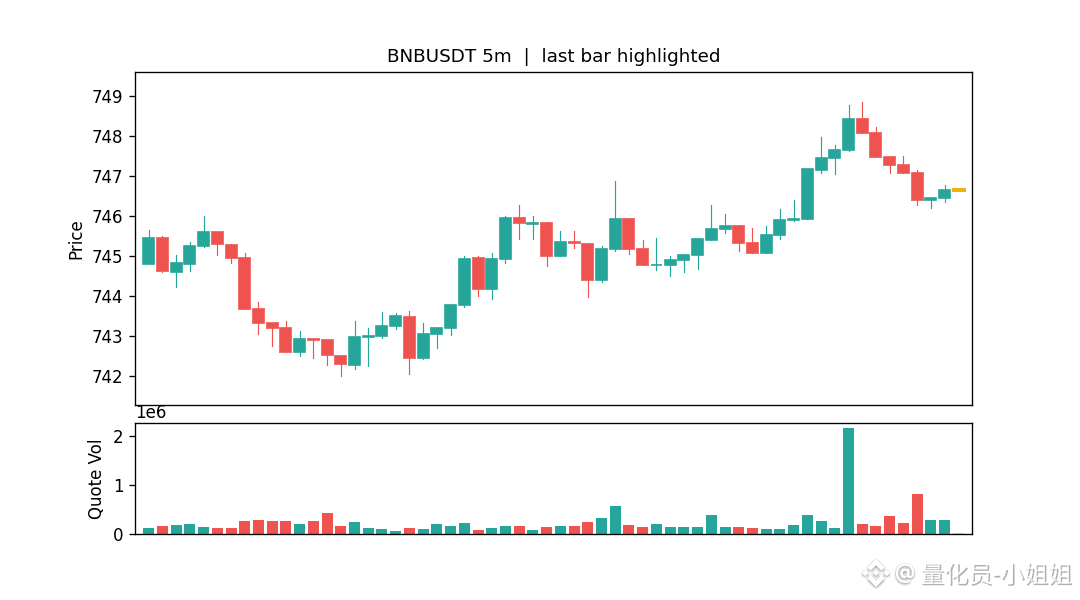
$BNB just saw its volume spike to 13.9× its usual 5-minute volume—this isn’t random noise.
Let’s break down what’s moving.
5m volume: $29,478 (≈13.9× normal)
5m change: -0.00% ▼
Price: $747.06
Time: 2026-10-28 04:20 UTC
My take: This kind of volume often shows up before a genuine move—or it could just be a quick liquidity sweep that fizzles out. I’ll watch the price action after the close to see if it can hold above the breakout level.
Have you seen $BNB make an early move before, or was it a fakeout shakeout? Share your thoughts 👇
#BNB #Binance Coin
·
--
$MSTR / Tokenized Stocks · Premium Monitor
Token: MSTRon | Underlying: MSTR | Multiplier: 1
On-chain price: $142.28 (24h +1.70%)
Underlying U.S. stock: $142.17
Premium / Discount: +0.08% (vs. underlying fair value)
52-week range: $81.81 - $299.80
Number of holder addresses: 1929
Underlying status: overnight
Why monitor the premium? Tokens trade 24/7, while the underlying U.S. stock is quoted only during U.S. market hours.
Premiums are most likely to widen when markets are closed—either due to on-chain buying pressure or growing expectations of redemptions or a trading halt.
Unusual premium swings often reveal sentiment and arbitrage gaps before the price itself does.
Do you find premium monitoring more useful, or is watching the price alone enough? 👇
(The above is for educational purposes based on public data, not investment advice. DYOR)
#MSTR #MicroStrategy
·
--
$HIMS / Tokenized Stocks · Premium Monitoring
Token: HIMSon | Underlying: HIMS | Multiplier: 1
On-chain price: $28.00 (24h +1.44%)
Underlying U.S. stock: $28.00
Premium / discount: +0.00% (vs. underlying fair value)
52-week range: $13.74 - $50.19
Number of holder addresses: 536
Underlying status: overnight
Why monitor the premium? Tokens can be traded 24/7, while underlying U.S. stocks are quoted only during U.S. market hours.
Premiums are most likely to widen when markets are closed—whether due to on-chain buying pressure or growing expectations of redemptions or trading halts.
Unusual premium swings often reveal sentiment and arbitrage gaps before the price itself does.
Do you find premium monitoring more useful, or is just watching the price enough? 👇
(The above is educational information based on public data, not investment advice. DYOR.)
#HIMS
·
--
🔍 $ERA Price Drop Breakdown
5m: +0.25%
1h: -0.62%
4h: -0.62%
24h: -2.78%
Current price: 0.0805, 24h trading volume: $9.49 million
The decline was mainly concentrated in the 1h period, suggesting a sudden sell-off.
Do you think this is panic selling or a trend reversal? 👇
(Data analysis, not investment advice. DYOR)
#ERA
5m: +0.25%
1h: -0.62%
4h: -0.62%
24h: -2.78%
Current price: 0.0805, 24h trading volume: $9.49 million
The decline was mainly concentrated in the 1h period, suggesting a sudden sell-off.
Do you think this is panic selling or a trend reversal? 👇
(Data analysis, not investment advice. DYOR)
#ERA
·
--
🔍 $NIL Price Drop Breakdown
5m: -0.07%
1h: -3.01%
4h: -3.01%
24h: -2.90%
Current price: 0.08924, 24h trading volume: $23.88 million
Most of the decline happened within 1h, indicating a sudden sell-off.
Do you think this is an emotional sell-off or a trend reversal? 👇
(Data analysis, not investment advice. DYOR.)
#NIL
5m: -0.07%
1h: -3.01%
4h: -3.01%
24h: -2.90%
Current price: 0.08924, 24h trading volume: $23.88 million
Most of the decline happened within 1h, indicating a sudden sell-off.
Do you think this is an emotional sell-off or a trend reversal? 👇
(Data analysis, not investment advice. DYOR.)
#NIL
2
·
--
🔍 $ZRO Price Movement Breakdown
5 min: +0.00%
1h: +0.24%
4h: +0.24%
24h: +3.19%
Current price: 1.681, 24h trading volume: $5.59M
Up +3.19% in a day, with gains spread across no particular short-term period—more like a gradual rise throughout the day.
Do you think this is a genuine breakout or a pump-and-dump? 👇
(Data breakdown, not investment advice. DYOR.)
#ZRO
1
·
--
🔍 $BMT Price Movement Breakdown
5 min: -0.17%
1h: +3.74%
4h: +3.74%
24h: -3.42%
Current price: 0.02912, 24h trading volume: $8.19 million
Most of the gains came within 1h, suggesting a sudden pump.
Do you think this is a genuine breakout or a pump-and-dump? 👇
(Data analysis, not investment advice. DYOR.)
#BMT
5 min: -0.17%
1h: +3.74%
4h: +3.74%
24h: -3.42%
Current price: 0.02912, 24h trading volume: $8.19 million
Most of the gains came within 1h, suggesting a sudden pump.
Do you think this is a genuine breakout or a pump-and-dump? 👇
(Data analysis, not investment advice. DYOR.)
#BMT
·
--
🔍 $HYPE Price movement breakdown
5 min: +0.02%
1h: +0.27%
4h: +0.27%
24h: +3.45%
Current price: 81.52, 24h trading volume: $26.64 million
Up +3.45% in a day, with gains not concentrated in any one short timeframe—more like a gradual push upward throughout the day.
Do you think this is a genuine breakout or a pump-and-dump? 👇
(Data analysis, not investment advice. DYOR)
#HYPE
·
--
🔍 $FET Price Gain Breakdown
5 minutes: +0.05%
1h: +0.11%
4h: +0.11%
24h: +3.58%
Current price: 0.1825, 24h trading volume: $13.39 million
Up +3.58% in a day, with gains not concentrated in any short time frame—more like a gradual rise throughout the day.
Do you think this is a real breakout or a pump-and-dump? 👇
(Data breakdown, not investment advice. DYOR)
#FET #FetchAI
15
·
--
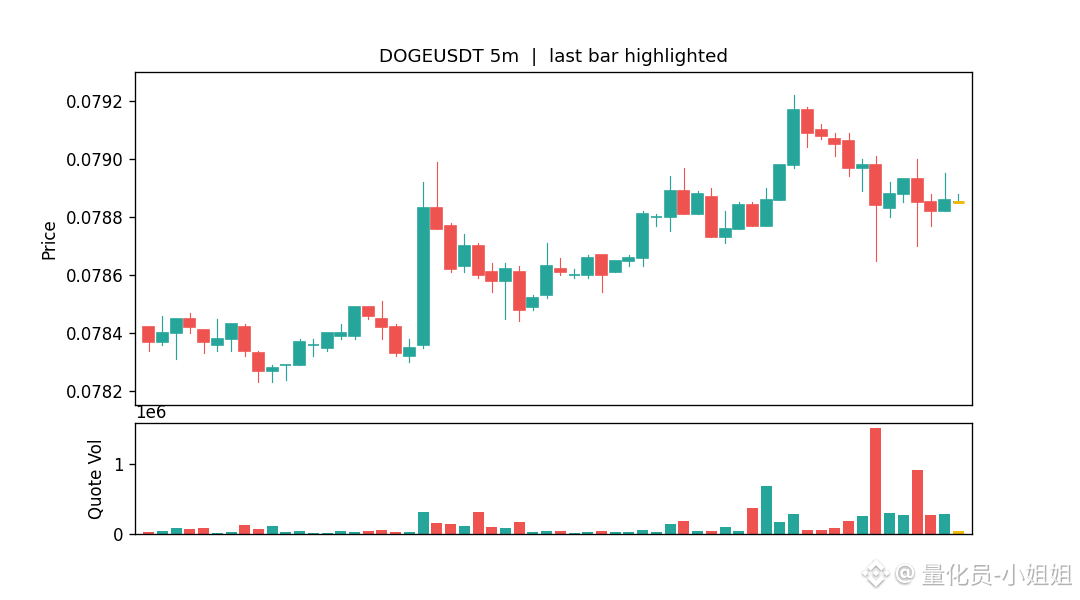
$DOGE just saw its volume surge to 23.7x its usual 5-minute level—this isn’t random fluctuation.
Let’s break down what’s actually moving.
5m volume: $75,799 (≈23.7x normal)
5m change: -0.01% ▼
Price: $0.07883
Time: 2026-10-28 00:45 UTC
My take: This kind of volume often shows up before a genuine move—or it could just be a quick liquidity sweep that fizzles out. I’ll watch the closing price to see if it can hold above the breakout level.
Have you seen $DOGE make an early move before, or was it a fake breakout shakeout? Share your thoughts 👇
#DOGE #Dogecoin
·
--
🔍 $NEAR Price Movement Breakdown
5 min: +0.04%
1h: -0.15%
4h: -0.15%
24h: +3.96%
Current price: 4.675, 24h trading volume: $93.31 million
Up +3.96% in a single day, with gains not concentrated in any one short-term period—more like a steady climb throughout the day.
Do you think this is a genuine breakout or a pump-and-dump? 👇
(Data analysis, not investment advice. DYOR)
#NEAR #Near
5
·
--
🔍 $BCH Price Increase Breakdown
5 min: -0.03%
1h: -0.34%
4h: -0.30%
24h: +4.54%
Current price: 295, 24h trading volume: $10.74 million
Up +4.54% in a day, with gains not concentrated in any one short-term period—more like a gradual rise throughout the day.
Do you think this is a genuine breakout or a pump-and-dump? 👇
(Data breakdown, not investment advice. DYOR)
#BCH
·
--
🔍 $ZEC Price Gain Breakdown
5 min: -0.08%
1h: -0.67%
4h: -0.67%
24h: +5.20%
Current price: 1300.93, 24h trading volume: $157 million
Up +5.20% in a day, with the gains spread across multiple time frames rather than concentrated in one short period—more like a steady, gradual rise throughout the day.
Do you think this is a real breakout or a pump-and-dump? 👇
(Data analysis, not investment advice. DYOR)
#ZEC
·
--
🔍 $SYN price drop breakdown
5 minutes: +0.00%
1h: -0.16%
4h: -0.16%
24h: -5.35%
Current price: 0.17808, 24h trading volume: $6.1 million
Down -5.35% in a single day. The sell-off wasn’t concentrated in any one short timeframe; it looks more like a gradual decline throughout the day.
Do you think this is panic selling or a weakening trend? 👇
(Data breakdown, not investment advice. DYOR)
#SYN
1
·
--
🔍 $KORUB Price Gain Breakdown
5 min: -0.25%
1h: +1.67%
4h: +1.58%
24h: +5.54%
Current price: 12.2; 24h trading volume: $5.47M
Most of the gains happened within 1h, suggesting a sudden pump.
Do you think this is a genuine breakout or a pump-and-dump? 👇
(Data analysis, not investment advice. DYOR.)
#KORUB
5 min: -0.25%
1h: +1.67%
4h: +1.58%
24h: +5.54%
Current price: 12.2; 24h trading volume: $5.47M
Most of the gains happened within 1h, suggesting a sudden pump.
Do you think this is a genuine breakout or a pump-and-dump? 👇
(Data analysis, not investment advice. DYOR.)
#KORUB
·
--
🔍 $CHIP Price Gain Breakdown
5 min: -0.17%
1h: +0.39%
4h: +0.39%
24h: +5.43%
Current price: 0.05432, 24h trading volume: $6.25 million
Up +5.43% in a day, with the gains not concentrated in any one short-term period—more like a steady, gradual rise throughout the day.
Do you think this is a genuine breakout or a pump-and-dump? 👇
(Data breakdown, not investment advice. DYOR)
#CHIP
·
--
🔍 $PEPE Price Movement Breakdown
5 minutes: +0.22%
1h: -0.22%
4h: -0.22%
24h: +6.00%
Current price: 4.59e-06, 24h trading volume: $28.87 million
Up +6.00% in a single day, with gains not concentrated in any one short-term period—more like a gradual rise throughout the day.
Do you think this is a real breakout or a pump-and-dump? 👇
(Data breakdown, not investment advice. DYOR)
#PEPE #Pepe
·
--
🔍 $INIT Price Movement Breakdown
5 min: -0.16%
1h: -0.29%
4h: -0.29%
24h: +6.88%
Current price: 0.16601, 24h trading volume: $5.4 million
Up +6.88% in a single day, with gains not concentrated in any short-term period—more like a steady climb throughout the day.
Do you think this is a genuine breakout or a pump-and-dump? 👇
(Data breakdown, not investment advice. DYOR.)
#INIT
·
--
🔍 $SOXLB Price Movement Breakdown
5m: -0.18%
1h: -0.61%
4h: -0.51%
24h: +7.18%
Current price: 100.21, 24h trading volume: $47.03 million
Up +7.18% in a single day, with the gains not concentrated in any one short time frame—more like a steady rise throughout the day.
Do you think this is a genuine breakout or a pump-and-dump? 👇
(Data analysis, not investment advice. DYOR)
#SOXLB
Log in to explore more content
Join global crypto users on Binance Square
⚡️ Get latest and useful information about crypto.
💬 Trusted by the world’s largest crypto exchange.
👍 Discover real insights from verified creators.
Email / Phone number