

CHILL-WITH-CRYPTO
12.3k Posts

CHILL-WITH-CRYPTO
 Square Verified+
Report
Block User
hi crypto users all crypto activity news & earn setretgy here
Open Trade

PEPE Holder
Frequent Trader
3.8 Years
929 Following
31.4K+ Followers
16.4K+ Liked
Posts
Portfolio
All
Quotes
Videos
Live
PINNED
·
--
Bearish
🔥🛑The $SPCX Crash Isn’t Over… The Real Test May Still Be Ahead
While most traders are calling a bottom, I believe the real supply shock hasn’t even arrived yet.💥🔥
📉 SpaceX is already down nearly 50% from its IPO highs. Retail sees a bargain. Smart money may still be waiting.
Here’s the key detail almost everyone is ignoring:
Only ~5% of shares are actively trading
The remaining 95% hasn’t fully entered the market
After Q2 earnings, the float could expand in multiple waves:
+20%
+14%
+14%
+28%
That means millions of new shares hitting a market that already rejected $225. This isn’t necessarily about SpaceX being a weak company—it’s about supply temporarily overwhelming demand.
⚠️ Add in the recent bearish catalysts:
Japan’s reusable rocket breakthrough
Starship Flight 13 delays
A valuation that many still consider expensive
Every negative headline becomes more powerful when fresh shares keep flooding the market. But here’s the opportunity 👇
🔥 When the final unlock is behind us, the forced selling pressure disappears. That’s often the moment institutions begin accumulating while retail has already given up.
I’m still waiting.
I believe the best SPCX opportunity of 2026 may come after the unlock waves, not before them.
Most traders will buy the first dip. A few will buy when fear is at its peak.
History shows that those are often the investors who capture the biggest moves.
#SPCX #SpaceX #StockMarket #Investing #IPO $SPCX
{future}(SPCXUSDT)
$SPCXB
{spot}(SPCXBUSDT)
🔥🛑The $SPCX Crash Isn’t Over… The Real Test May Still Be Ahead
While most traders are calling a bottom, I believe the real supply shock hasn’t even arrived yet.💥🔥
📉 SpaceX is already down nearly 50% from its IPO highs. Retail sees a bargain. Smart money may still be waiting.
Here’s the key detail almost everyone is ignoring:
Only ~5% of shares are actively trading
The remaining 95% hasn’t fully entered the market
After Q2 earnings, the float could expand in multiple waves:
+20%
+14%
+14%
+28%
That means millions of new shares hitting a market that already rejected $225. This isn’t necessarily about SpaceX being a weak company—it’s about supply temporarily overwhelming demand.
⚠️ Add in the recent bearish catalysts:
Japan’s reusable rocket breakthrough
Starship Flight 13 delays
A valuation that many still consider expensive
Every negative headline becomes more powerful when fresh shares keep flooding the market. But here’s the opportunity 👇
🔥 When the final unlock is behind us, the forced selling pressure disappears. That’s often the moment institutions begin accumulating while retail has already given up.
I’m still waiting.
I believe the best SPCX opportunity of 2026 may come after the unlock waves, not before them.
Most traders will buy the first dip. A few will buy when fear is at its peak.
History shows that those are often the investors who capture the biggest moves.
#SPCX #SpaceX #StockMarket #Investing #IPO $SPCX
$SPCXB
$ SPCX Bullish Start Here?
47%
Nothing Bullish $SPCX?
31%
Coming soon Bullish $SPCX?
22%
59 votes • Voting closed
6
1
8
5.3k
PINNED
·
--
Bullish
🚨 Elon Musk's Wealth Is Almost Impossible to Comprehend.
With a net worth approaching $1 TRILLION, Elon Musk could buy every major automaker in the United States, Europe, and Japan—including GM, Ford, Toyota, BMW, Mercedes-Benz, Volkswagen, Honda, Nissan, and more—whose combined value is estimated at around $900 billion, and still have over $100 billion left.
To put it into perspective: • He could fund NASA's annual budget 41 times. • If Musk were a country, his wealth would exceed the GDP of 156 nations, according to Bloomberg.
One person. One fortune. A level of wealth that is reshaping the conversation around business, technology, and global influence.
#ElonMusk #Tesla #SpaceX #Business #Wealth $SPCXB
{spot}(SPCXBUSDT)
$TSLAB
{spot}(TSLABUSDT)
$SPCX
{future}(SPCXUSDT)
🚨 Elon Musk's Wealth Is Almost Impossible to Comprehend.
With a net worth approaching $1 TRILLION, Elon Musk could buy every major automaker in the United States, Europe, and Japan—including GM, Ford, Toyota, BMW, Mercedes-Benz, Volkswagen, Honda, Nissan, and more—whose combined value is estimated at around $900 billion, and still have over $100 billion left.
To put it into perspective: • He could fund NASA's annual budget 41 times. • If Musk were a country, his wealth would exceed the GDP of 156 nations, according to Bloomberg.
One person. One fortune. A level of wealth that is reshaping the conversation around business, technology, and global influence.
#ElonMusk #Tesla #SpaceX #Business #Wealth $SPCXB
$TSLAB
$SPCX

4
1
8
4.8k
·
--
Bullish
BREAKING: SpaceX and Tesla Explore Potential Merger as Elon Musk Steps Aside From Board Discussions
A major corporate development is drawing global attention as SpaceX and Tesla explore the possibility of a merger that could reshape the future of artificial intelligence, electric vehicles, robotics, and space technology.
According to Bloomberg reporting published on October 20, 2026, Elon Musk revealed that both companies had formed special committees of independent directors to examine a potential business combination. The development was discussed during SpaceX’s third-quarter earnings call.
Why Is Musk Not Participating?
Musk said he cannot participate in the committees’ discussions because he is a conflicted party. His position as the leader of both companies creates potential governance concerns, making independent oversight important when evaluating a transaction that could affect shareholders of both businesses.
What Could a Merger Mean?
A potential combination could bring together Tesla’s electric vehicles, energy storage, and robotics operations with SpaceX’s rocket-launch capabilities and Starlink satellite internet network.
Artificial intelligence is another major connection. Musk has highlighted opportunities for cooperation in AI software, robotics, and advanced computing infrastructure.
However, significant questions remain regarding valuation, transaction structure, shareholder interests, and the terms of any possible agreement.
No. Both companies have established special committees, but this does not mean a deal is guaranteed. Musk has acknowledged that the committees have not agreed on transaction terms and that shareholder support would be necessary.
For investors, this is an important development to monitor, not a reason to assume a merger will happen.
The next major catalyst will be whether the independent committees recommend moving forward and whether the companies disclose concrete terms
#Tesla #SpaceX #ElonMusk #ArtificialIntelligence #StockMarket
{spot}(TSLABUSDT)
$TSLA
{future}(TSLAUSDT)
$SPCX
{future}(SPCXUSDT)
BREAKING: SpaceX and Tesla Explore Potential Merger as Elon Musk Steps Aside From Board Discussions
A major corporate development is drawing global attention as SpaceX and Tesla explore the possibility of a merger that could reshape the future of artificial intelligence, electric vehicles, robotics, and space technology.
According to Bloomberg reporting published on October 20, 2026, Elon Musk revealed that both companies had formed special committees of independent directors to examine a potential business combination. The development was discussed during SpaceX’s third-quarter earnings call.
Why Is Musk Not Participating?
Musk said he cannot participate in the committees’ discussions because he is a conflicted party. His position as the leader of both companies creates potential governance concerns, making independent oversight important when evaluating a transaction that could affect shareholders of both businesses.
What Could a Merger Mean?
A potential combination could bring together Tesla’s electric vehicles, energy storage, and robotics operations with SpaceX’s rocket-launch capabilities and Starlink satellite internet network.
Artificial intelligence is another major connection. Musk has highlighted opportunities for cooperation in AI software, robotics, and advanced computing infrastructure.
However, significant questions remain regarding valuation, transaction structure, shareholder interests, and the terms of any possible agreement.
No. Both companies have established special committees, but this does not mean a deal is guaranteed. Musk has acknowledged that the committees have not agreed on transaction terms and that shareholder support would be necessary.
For investors, this is an important development to monitor, not a reason to assume a merger will happen.
The next major catalyst will be whether the independent committees recommend moving forward and whether the companies disclose concrete terms
#Tesla #SpaceX #ElonMusk #ArtificialIntelligence #StockMarket
$TSLA
$SPCX

1
79
·
--
Bullish
$LYN SURGES 3% IN 15 MINUTES AS VOLUME EXPLODES 23.6X — IS A BIGGER MOVE COMING?
$LYN is attracting serious market attention after a sharp 3% rally in just 15 minutes, accompanied by an extraordinary 23.6x volume spike. This explosive move signals a potential momentum shift, but will buyers have enough strength to sustain the rally?
Market Structure and Momentum
My short-term bias on LYN remains bullish. The 1-hour structure is firmly positive, with price trading above both EMA20 and EMA200. The massive volume expansion could indicate aggressive buying, fresh market participation, or a liquidity-driven move.
However, there is an important risk to consider: the daily and weekly trends remain bearish. This means the current rally could develop into a powerful recovery, but it could also become a temporary bounce within a broader downtrend. Confirmation is essential before entering a position.
Potential Entry and Targets
The preferred long-entry zone is 0.01411–0.01418, provided price retests this area and shows a convincing bullish reaction. Watch for a bullish engulfing candle, a lower-timeframe market structure shift, or a strong rejection wick before considering an entry.
Potential upside targets:
- TP1: 0.01433
- TP2: 0.01523
- TP3: 0.01576
Consider taking partial profits at each target rather than assuming the entire move will continue.
Risk Management and Confirmation
The key invalidation level is 0.01358. A confirmed 1-hour close below this level would weaken the bullish setup and could shift momentum toward further downside.
Market flow: Open Interest at $7.8M, up 2.4% over 24 hours; funding at +0.0167%; taker ratio at 0.92x. These figures warrant caution because the taker ratio does not independently confirm buyer dominance.
My strategy: Wait for the retest, demand confirmation, and avoid chasing the pump.
This is an educational market analysis, not financial advice. Always manage risk.
CHIL-WITH-CRYPTO
#LYN #CryptoTrading #TechnicalAnalysis #Altcoins #BinanceSquare $LYN
{future}(LYNUSDT)
$LYN SURGES 3% IN 15 MINUTES AS VOLUME EXPLODES 23.6X — IS A BIGGER MOVE COMING?
$LYN is attracting serious market attention after a sharp 3% rally in just 15 minutes, accompanied by an extraordinary 23.6x volume spike. This explosive move signals a potential momentum shift, but will buyers have enough strength to sustain the rally?
Market Structure and Momentum
My short-term bias on LYN remains bullish. The 1-hour structure is firmly positive, with price trading above both EMA20 and EMA200. The massive volume expansion could indicate aggressive buying, fresh market participation, or a liquidity-driven move.
However, there is an important risk to consider: the daily and weekly trends remain bearish. This means the current rally could develop into a powerful recovery, but it could also become a temporary bounce within a broader downtrend. Confirmation is essential before entering a position.
Potential Entry and Targets
The preferred long-entry zone is 0.01411–0.01418, provided price retests this area and shows a convincing bullish reaction. Watch for a bullish engulfing candle, a lower-timeframe market structure shift, or a strong rejection wick before considering an entry.
Potential upside targets:
- TP1: 0.01433
- TP2: 0.01523
- TP3: 0.01576
Consider taking partial profits at each target rather than assuming the entire move will continue.
Risk Management and Confirmation
The key invalidation level is 0.01358. A confirmed 1-hour close below this level would weaken the bullish setup and could shift momentum toward further downside.
Market flow: Open Interest at $7.8M, up 2.4% over 24 hours; funding at +0.0167%; taker ratio at 0.92x. These figures warrant caution because the taker ratio does not independently confirm buyer dominance.
My strategy: Wait for the retest, demand confirmation, and avoid chasing the pump.
This is an educational market analysis, not financial advice. Always manage risk.
CHIL-WITH-CRYPTO
#LYN #CryptoTrading #TechnicalAnalysis #Altcoins #BinanceSquare $LYN
57
·
--
Bullish
$MRNA LIQUIDITY SWEEP AT $196.98: IS A BULLISH BREAKOUT LOADING?
$MRNA is approaching a critical decision point after sweeping liquidity above $196.98 and slipping back below resistance. Is this a temporary shakeout before another rally, or a warning that buyers are losing control? The next confirmed move could provide the answer.
Market Structure: Bullish Bias
My bias remains bullish because the 1H structure is trending upward, supported by a bullish daily outlook and BTC strength. The weekly timeframe remains range-bound, so patience is essential. The recent liquidity sweep could have cleared stops, but it does not guarantee continuation.
Critical Breakout Confirmation
The key level is $196.98. I want to see price reclaim this resistance with a strong 15M bullish engulfing candle or a clear lower-timeframe market structure shift. A successful retest holding above resistance would strengthen the bullish continuation setup.
Potential Long Entry
Entry zone: $196.80–$197.10, only after a convincing reclaim and confirmation that buyers can defend the level.
Avoid entering prematurely while price remains below $196.98. A failed breakout can quickly turn into another rejection.
4. Upside Targets
Target 1: $204.18
Target 2: $208.60
Target 3: $217.12
These are potential resistance zones, not guaranteed price destinations. Consider securing partial profits as price approaches each target.
Risk Management and Invalidation
If price rejects $196.98 again and falls below $194.30, reassess the setup rather than forcing a long entry. A confirmed close below $175.58 would invalidate the broader bullish thesis and shift my bias toward bearish.
Derivatives Flow
Open interest stands at $4.7M, up 6.7% over 24 hours. Funding is neutral at 0.0000%, while the taker ratio is 0.89x. Rising open interest indicates increased positioning, but the taker ratio suggests buyers have yet to establish clear dominance.
Wait for the reclaim, demand confirmation, and never chase an unconfirmed breakout.
Educational analysis only.
#MRNA #CryptoTrading
{future}(MRNAUSDT)
$MRNA LIQUIDITY SWEEP AT $196.98: IS A BULLISH BREAKOUT LOADING?
$MRNA is approaching a critical decision point after sweeping liquidity above $196.98 and slipping back below resistance. Is this a temporary shakeout before another rally, or a warning that buyers are losing control? The next confirmed move could provide the answer.
Market Structure: Bullish Bias
My bias remains bullish because the 1H structure is trending upward, supported by a bullish daily outlook and BTC strength. The weekly timeframe remains range-bound, so patience is essential. The recent liquidity sweep could have cleared stops, but it does not guarantee continuation.
Critical Breakout Confirmation
The key level is $196.98. I want to see price reclaim this resistance with a strong 15M bullish engulfing candle or a clear lower-timeframe market structure shift. A successful retest holding above resistance would strengthen the bullish continuation setup.
Potential Long Entry
Entry zone: $196.80–$197.10, only after a convincing reclaim and confirmation that buyers can defend the level.
Avoid entering prematurely while price remains below $196.98. A failed breakout can quickly turn into another rejection.
4. Upside Targets
Target 1: $204.18
Target 2: $208.60
Target 3: $217.12
These are potential resistance zones, not guaranteed price destinations. Consider securing partial profits as price approaches each target.
Risk Management and Invalidation
If price rejects $196.98 again and falls below $194.30, reassess the setup rather than forcing a long entry. A confirmed close below $175.58 would invalidate the broader bullish thesis and shift my bias toward bearish.
Derivatives Flow
Open interest stands at $4.7M, up 6.7% over 24 hours. Funding is neutral at 0.0000%, while the taker ratio is 0.89x. Rising open interest indicates increased positioning, but the taker ratio suggests buyers have yet to establish clear dominance.
Wait for the reclaim, demand confirmation, and never chase an unconfirmed breakout.
Educational analysis only.
#MRNA #CryptoTrading
42
·
--
Bullish
$MU GAINS 2.7% WITH FRESH 4H BULLISH DIVERGENCE: CAN PRICE BREAK ABOVE $939?
$MU is showing promising bullish momentum, gaining 2.7% while demonstrating relative strength against Bitcoin. With a bullish 1H structure and a fresh 4H divergence, traders are watching whether buyers can overcome the resistance standing directly ahead.
Market Structure and Relative Strength
My bias remains bullish. MU continues to print higher highs and higher lows on the 1H timeframe, while BTC also maintains a bullish short-term structure. The fresh 4H bullish divergence against BTC adds confidence to the continuation thesis, although confirmation is still required.
Critical Resistance Zone
Price is testing the 932.86–939.14 resistance area after sweeping the previous high near 932 and filling a nearby 1H fair value gap. A strong 1H close above 939.14 could open the door toward the next resistance at 959.50.
However, rejection here could trigger a temporary pullback before another attempt.
Potential Long Entry Zones
The first demand zone is 900.88–901.11, where previous breakout support and FVG confluence may attract buyers. Watch for a bullish engulfing candle, rejection wick, or 5M–15M market structure shift before considering entry.
Deeper support lies near 885.85, followed by the 873.28–871.60 demand zone. A liquidity sweep and strong reclaim could offer another potential setup.
Targets and Invalidation
First objective: 932.86–939.14.
Second objective: 959.50.
Risk protection requires careful planning. A 1H close below 906.21 would invalidate the current bullish thesis, although this level sits below the first entry zone and requires a clear position-sizing strategy.
Derivatives Flow Check
Open interest is $162.5M, down 4.7% over 24 hours. Funding is +0.0006%, and the taker ratio is 1.13x. A reported $95K sell over approximately four minutes warrants monitoring but does not independently establish a bearish reversal.
Avoid chasing resistance. Wait for confirmation and manage risk.
Not investment advice.
#MU #CryptoTrading #TechnicalAnalysis $MU
{future}(MUUSDT)
$MU GAINS 2.7% WITH FRESH 4H BULLISH DIVERGENCE: CAN PRICE BREAK ABOVE $939?
$MU is showing promising bullish momentum, gaining 2.7% while demonstrating relative strength against Bitcoin. With a bullish 1H structure and a fresh 4H divergence, traders are watching whether buyers can overcome the resistance standing directly ahead.
Market Structure and Relative Strength
My bias remains bullish. MU continues to print higher highs and higher lows on the 1H timeframe, while BTC also maintains a bullish short-term structure. The fresh 4H bullish divergence against BTC adds confidence to the continuation thesis, although confirmation is still required.
Critical Resistance Zone
Price is testing the 932.86–939.14 resistance area after sweeping the previous high near 932 and filling a nearby 1H fair value gap. A strong 1H close above 939.14 could open the door toward the next resistance at 959.50.
However, rejection here could trigger a temporary pullback before another attempt.
Potential Long Entry Zones
The first demand zone is 900.88–901.11, where previous breakout support and FVG confluence may attract buyers. Watch for a bullish engulfing candle, rejection wick, or 5M–15M market structure shift before considering entry.
Deeper support lies near 885.85, followed by the 873.28–871.60 demand zone. A liquidity sweep and strong reclaim could offer another potential setup.
Targets and Invalidation
First objective: 932.86–939.14.
Second objective: 959.50.
Risk protection requires careful planning. A 1H close below 906.21 would invalidate the current bullish thesis, although this level sits below the first entry zone and requires a clear position-sizing strategy.
Derivatives Flow Check
Open interest is $162.5M, down 4.7% over 24 hours. Funding is +0.0006%, and the taker ratio is 1.13x. A reported $95K sell over approximately four minutes warrants monitoring but does not independently establish a bearish reversal.
Avoid chasing resistance. Wait for confirmation and manage risk.
Not investment advice.
#MU #CryptoTrading #TechnicalAnalysis $MU
41
·
--
Bullish
$EWY GAINS 2.9% AND OUTPERFORMS BTC: IS THE NEXT BULLISH LEG APPROACHING?
EWY is showing promising strength with a steady 2.9% climb and improving performance against Bitcoin. With bullish market structure and a successful reclaim of key support, traders should watch whether buyers can push price toward the next resistance levels.
Bullish Structure and Relative Strength
My bias remains bullish. The 1H structure is holding above the recent higher low at 154.21 and the EMA bands, while BTC's bullish structure provides additional support. The previous 4H bullish divergence and EWY's relative outperformance suggest strengthening momentum, although confirmation remains essential.
Liquidity Sweep and Support Reclaim
Price recently swept below 154.21 but failed to sustain the breakdown. Buyers subsequently reclaimed the key fair value gap (FVG) support, with price moving above 157.50. This behavior suggests demand is returning and supports the continuation thesis, provided buyers defend the reclaimed levels.
3. Key Upside Targets
Target 1: 158.13
Target 2: 159.06
Target 3: 159.68
Extended target: 162.06 if momentum continues.
These are potential resistance zones where price may pause or experience profit-taking.
Potential Entry Zone
The preferred pullback area is 156.20–155.00, where FVG support and demand may converge. Look for a bullish engulfing candle, sweep-and-reclaim, or strong rejection wick. A 5M bullish market structure shift or convincing 1H confirmation would strengthen the setup.
Avoid chasing price after an extended move, especially while relative volume remains low.
Risk Management and Market Flow
A 1H close below 154.21 would invalidate the bullish structure and shift the bias toward bearish. Open interest stands at $39.4M, down 1.2% over 24 hours, while funding is +0.0050% and the taker ratio is 1.00x. These figures offer limited directional confirmation, so price action remains decisive.
Wait for confirmation, respect invalidation, and manage risk at every target.
Not investment advice.
{future}(EWYUSDT)
#EWY #CryptoTrading
$EWY GAINS 2.9% AND OUTPERFORMS BTC: IS THE NEXT BULLISH LEG APPROACHING?
EWY is showing promising strength with a steady 2.9% climb and improving performance against Bitcoin. With bullish market structure and a successful reclaim of key support, traders should watch whether buyers can push price toward the next resistance levels.
Bullish Structure and Relative Strength
My bias remains bullish. The 1H structure is holding above the recent higher low at 154.21 and the EMA bands, while BTC's bullish structure provides additional support. The previous 4H bullish divergence and EWY's relative outperformance suggest strengthening momentum, although confirmation remains essential.
Liquidity Sweep and Support Reclaim
Price recently swept below 154.21 but failed to sustain the breakdown. Buyers subsequently reclaimed the key fair value gap (FVG) support, with price moving above 157.50. This behavior suggests demand is returning and supports the continuation thesis, provided buyers defend the reclaimed levels.
3. Key Upside Targets
Target 1: 158.13
Target 2: 159.06
Target 3: 159.68
Extended target: 162.06 if momentum continues.
These are potential resistance zones where price may pause or experience profit-taking.
Potential Entry Zone
The preferred pullback area is 156.20–155.00, where FVG support and demand may converge. Look for a bullish engulfing candle, sweep-and-reclaim, or strong rejection wick. A 5M bullish market structure shift or convincing 1H confirmation would strengthen the setup.
Avoid chasing price after an extended move, especially while relative volume remains low.
Risk Management and Market Flow
A 1H close below 154.21 would invalidate the bullish structure and shift the bias toward bearish. Open interest stands at $39.4M, down 1.2% over 24 hours, while funding is +0.0050% and the taker ratio is 1.00x. These figures offer limited directional confirmation, so price action remains decisive.
Wait for confirmation, respect invalidation, and manage risk at every target.
Not investment advice.
#EWY #CryptoTrading
68
·
--
Bullish
$INIT EXPLODES 6.4% IN 15 MINUTES AS VOLUME SURGES 16X: REAL BREAKOUT OR PUMP TRAP?
$INIT is attracting serious attention after a powerful 6.4% rally in just 15 minutes, backed by an extraordinary 16x volume spike. With bullish market structure and strong momentum, the big question is whether this move can develop into a sustained breakout.
1. Multi-Timeframe Trend Analysis
My bias remains bullish on INITUSDT. The 1H structure shows bullish momentum, supported by bullish daily, weekly, and BTC trends. The combination of a sharp price increase and exceptional volume suggests aggressive market participation, although it does not independently confirm smart-money accumulation.
2. Critical Support Zone
The $0.1622–$0.1618 area is the key zone to watch. These levels previously acted as resistance and could now become support. If price pulls back into this region and forms a bullish engulfing candle, pin bar, or swing-failure pattern, it may provide a potential continuation setup.
Avoid chasing the breakout after such a vertical move. Patience and confirmation matter more than entering at any price.
3. Upside Targets
Target 1: $0.1745
Target 2: $0.1872
Target 3: $0.1950
Extended target: $0.2078 if bullish momentum continues.
Consider securing partial profits near resistance levels rather than assuming price will reach every target.
4. Deeper Pullback Opportunities
If $0.1622 fails to hold, watch $0.1569 and $0.1495 for potential demand. Any long setup at these levels should require a confirmed reclaim and bullish reversal signal.
5. Derivatives Flow and Invalidation
Open interest stands at $10.4M, up 9.1% over 24 hours. Funding is +0.0050%, while the taker ratio is 0.97x. Rising open interest indicates increased positioning, but the mixed flow data means confirmation remains important.
A 1H close below $0.1491 would invalidate the bullish thesis.
Follow the trend, wait for a healthy pullback, and prioritize risk management over FOMO.
Not investment advice.
#INIT #CryptoTrading #TechnicalAnalysis #Altcoins #BinanceSquare
{future}(INITUSDT)
$INIT EXPLODES 6.4% IN 15 MINUTES AS VOLUME SURGES 16X: REAL BREAKOUT OR PUMP TRAP?
$INIT is attracting serious attention after a powerful 6.4% rally in just 15 minutes, backed by an extraordinary 16x volume spike. With bullish market structure and strong momentum, the big question is whether this move can develop into a sustained breakout.
1. Multi-Timeframe Trend Analysis
My bias remains bullish on INITUSDT. The 1H structure shows bullish momentum, supported by bullish daily, weekly, and BTC trends. The combination of a sharp price increase and exceptional volume suggests aggressive market participation, although it does not independently confirm smart-money accumulation.
2. Critical Support Zone
The $0.1622–$0.1618 area is the key zone to watch. These levels previously acted as resistance and could now become support. If price pulls back into this region and forms a bullish engulfing candle, pin bar, or swing-failure pattern, it may provide a potential continuation setup.
Avoid chasing the breakout after such a vertical move. Patience and confirmation matter more than entering at any price.
3. Upside Targets
Target 1: $0.1745
Target 2: $0.1872
Target 3: $0.1950
Extended target: $0.2078 if bullish momentum continues.
Consider securing partial profits near resistance levels rather than assuming price will reach every target.
4. Deeper Pullback Opportunities
If $0.1622 fails to hold, watch $0.1569 and $0.1495 for potential demand. Any long setup at these levels should require a confirmed reclaim and bullish reversal signal.
5. Derivatives Flow and Invalidation
Open interest stands at $10.4M, up 9.1% over 24 hours. Funding is +0.0050%, while the taker ratio is 0.97x. Rising open interest indicates increased positioning, but the mixed flow data means confirmation remains important.
A 1H close below $0.1491 would invalidate the bullish thesis.
Follow the trend, wait for a healthy pullback, and prioritize risk management over FOMO.
Not investment advice.
#INIT #CryptoTrading #TechnicalAnalysis #Altcoins #BinanceSquare
36
·
--
Bearish
$DOT BEARS REMAIN IN CONTROL: LIQUIDITY SWEEP ABOVE $0.9936 FAILS TO REVERSE THE DOWNTREND
Polkadot ($DOT) remains under pressure, with a 1.6% decline over 24 hours reinforcing the current bearish outlook. Despite a brief liquidity sweep above $0.9936, price action has yet to deliver convincing evidence of a trend reversal. Is this another opportunity for sellers to regain control?
1. Multi-Timeframe Market Structure
My bias remains bearish on DOTUSDT.P. The 1H chart continues to show lower highs and lower lows, while the daily and weekly structures also lean bearish. This alignment supports the possibility of further downside, although confirmation is still essential.
2. Liquidity Sweep: Reversal or Trap?
The 15-minute wick above $0.9936 followed by a close back below suggests a potential buy-side liquidity grab. Rather than confirming bullish momentum, this rejection may create an opportunity for sellers if price fails to reclaim resistance.
3. Key Short Entry Zone
Potential entry: $0.9900–$0.9950.
Wait for a weak bounce, bearish engulfing candle, or lower-high formation on the 15M or 1H timeframe. A failed reclaim of $1.0012–$1.0025 would strengthen the bearish setup. Negative VWAP positioning and sell-side order flow would provide additional confirmation.
4. Downside Targets
TP1: $0.9862
TP2: $0.9715
TP3: $0.9418
These are potential support and liquidity areas, not guaranteed destinations. Monitor price reactions at each level.
5. Invalidation and Market Flow
A confirmed 1H close above $1.0125 would invalidate this bearish thesis and suggest a possible bullish structure shift.
Open interest stands at $34.6M, down 1.9% over 24 hours. Funding is -0.0048%, while the taker ratio is 1.07x. These metrics require context and do not independently confirm direction.
My Strategy: Avoid chasing the breakdown. Wait for a confirmed rejection, manage risk carefully, and let price action validate the setup.
Not investment advice. Educational analysis only.
#DOT #Polkadot #CryptoTrading #TechnicalAnalysis #BinanceSquare $DOT
{future}(DOTUSDT)
$DOT BEARS REMAIN IN CONTROL: LIQUIDITY SWEEP ABOVE $0.9936 FAILS TO REVERSE THE DOWNTREND
Polkadot ($DOT ) remains under pressure, with a 1.6% decline over 24 hours reinforcing the current bearish outlook. Despite a brief liquidity sweep above $0.9936, price action has yet to deliver convincing evidence of a trend reversal. Is this another opportunity for sellers to regain control?
1. Multi-Timeframe Market Structure
My bias remains bearish on DOTUSDT.P. The 1H chart continues to show lower highs and lower lows, while the daily and weekly structures also lean bearish. This alignment supports the possibility of further downside, although confirmation is still essential.
2. Liquidity Sweep: Reversal or Trap?
The 15-minute wick above $0.9936 followed by a close back below suggests a potential buy-side liquidity grab. Rather than confirming bullish momentum, this rejection may create an opportunity for sellers if price fails to reclaim resistance.
3. Key Short Entry Zone
Potential entry: $0.9900–$0.9950.
Wait for a weak bounce, bearish engulfing candle, or lower-high formation on the 15M or 1H timeframe. A failed reclaim of $1.0012–$1.0025 would strengthen the bearish setup. Negative VWAP positioning and sell-side order flow would provide additional confirmation.
4. Downside Targets
TP1: $0.9862
TP2: $0.9715
TP3: $0.9418
These are potential support and liquidity areas, not guaranteed destinations. Monitor price reactions at each level.
5. Invalidation and Market Flow
A confirmed 1H close above $1.0125 would invalidate this bearish thesis and suggest a possible bullish structure shift.
Open interest stands at $34.6M, down 1.9% over 24 hours. Funding is -0.0048%, while the taker ratio is 1.07x. These metrics require context and do not independently confirm direction.
My Strategy: Avoid chasing the breakdown. Wait for a confirmed rejection, manage risk carefully, and let price action validate the setup.
Not investment advice. Educational analysis only.
#DOT #Polkadot #CryptoTrading #TechnicalAnalysis #BinanceSquare $DOT
51
·
--
Bearish
$BTR BREAKDOWN: 3.7% CRASH IN 15 MINUTES AS VOLUME EXPLODES 4.8X
$BTR is showing serious short-term weakness after a sharp 3.7% drop in just 15 minutes, accompanied by a massive 4.8x volume spike. Is this aggressive distribution, a liquidation flush, or the beginning of another bearish leg?
Market Structure: Bearish
My bias remains bearish on the 1H timeframe. Price has broken down sharply and failed to reclaim important resistance levels, suggesting sellers are maintaining control. Although the daily market structure and BTC trend remain bullish, the lower-timeframe weakness makes immediate long positions risky.
Key Resistance and Short Entry Zone
The 0.05362–0.05575 region is the zone to watch. If price retests this area and produces a bearish engulfing candle, rejection wick, or a fresh M15 structure breakdown, a short setup may develop.
Avoid chasing the price after a sharp decline. Waiting for a confirmed retest can offer a better risk-to-reward opportunity.
Downside Targets
Target 1: 0.05039
Target 2: 0.04910
Target 3: 0.04821
Extended target: 0.04569 if selling pressure continues.
Invalidation and Risk Management
The 0.05793 level is critical. A confirmed close above this swing high would invalidate the current bearish thesis and could signal a bullish structure reversal. Always define risk before entering a trade.
Derivatives Flow Check
Open interest stands at $7.5M, up 2.6% over 24 hours, while funding is positive at 0.0279% and the taker ratio is 1.39x. These figures suggest positioning remains active, but they do not independently confirm future price direction. Watch whether buyers defend support or become trapped during another downward move.
My Strategy: Wait for confirmation, respect the resistance zone, and never confuse a temporary bounce with a confirmed trend reversal.
Not investment advice. Educational analysis only.
#BTR #CryptoTrading #TechnicalAnalysis #BinanceSquare #Altcoins $BTR
{future}(BTRUSDT)
$BTR BREAKDOWN: 3.7% CRASH IN 15 MINUTES AS VOLUME EXPLODES 4.8X
$BTR is showing serious short-term weakness after a sharp 3.7% drop in just 15 minutes, accompanied by a massive 4.8x volume spike. Is this aggressive distribution, a liquidation flush, or the beginning of another bearish leg?
Market Structure: Bearish
My bias remains bearish on the 1H timeframe. Price has broken down sharply and failed to reclaim important resistance levels, suggesting sellers are maintaining control. Although the daily market structure and BTC trend remain bullish, the lower-timeframe weakness makes immediate long positions risky.
Key Resistance and Short Entry Zone
The 0.05362–0.05575 region is the zone to watch. If price retests this area and produces a bearish engulfing candle, rejection wick, or a fresh M15 structure breakdown, a short setup may develop.
Avoid chasing the price after a sharp decline. Waiting for a confirmed retest can offer a better risk-to-reward opportunity.
Downside Targets
Target 1: 0.05039
Target 2: 0.04910
Target 3: 0.04821
Extended target: 0.04569 if selling pressure continues.
Invalidation and Risk Management
The 0.05793 level is critical. A confirmed close above this swing high would invalidate the current bearish thesis and could signal a bullish structure reversal. Always define risk before entering a trade.
Derivatives Flow Check
Open interest stands at $7.5M, up 2.6% over 24 hours, while funding is positive at 0.0279% and the taker ratio is 1.39x. These figures suggest positioning remains active, but they do not independently confirm future price direction. Watch whether buyers defend support or become trapped during another downward move.
My Strategy: Wait for confirmation, respect the resistance zone, and never confuse a temporary bounce with a confirmed trend reversal.
Not investment advice. Educational analysis only.
#BTR #CryptoTrading #TechnicalAnalysis #BinanceSquare #Altcoins $BTR
57
·
--
Bullish
$AIN USDT Explodes 251% in 24 Hours: Is Another Breakout Coming?
AINUSDT has delivered an explosive rally, climbing 251.01% in 24 hours and reaching 0.15320. Price is now trading around 0.14016, consolidating after a powerful upward move. The big question is whether buyers can push toward new highs or whether a deeper pullback is approaching.
Technical Breakdown
The 15-minute structure remains bullish, with price holding well above the Supertrend at 0.11090 and Parabolic SAR at 0.12951. However, momentum is cooling. MACD has turned negative, with DIF at 0.01082 below DEA at 0.01226, while RSI(6) sits near 62.44.
This combination suggests that buyers still have the broader intraday advantage, but chasing an extended rally carries significant risk.
Key Trading Levels
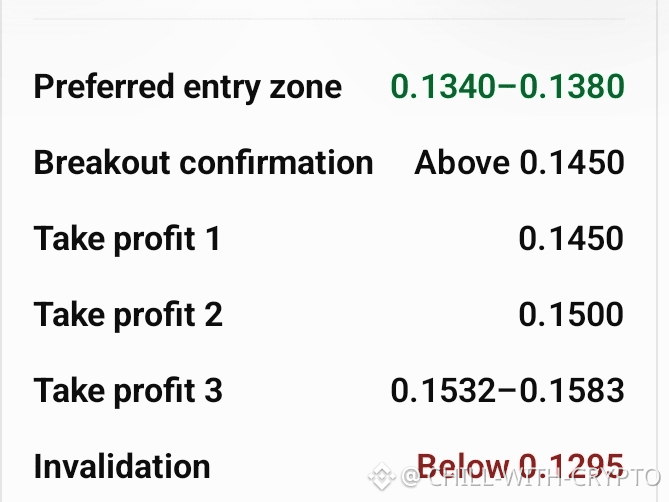
Potential pullback entry: 0.1340–0.1380, provided support holds and a bullish reversal signal appears.
Breakout trigger: A confirmed 15-minute close above 0.1450, followed by a successful retest.
Upside targets:
- TP1: 0.1450
- TP2: 0.1500
- TP3: 0.1532
- Extended target: 0.1583
Risk management: A sustained move below 0.1295 would invalidate this proposed bullish setup and could expose price to deeper support.
My Trading Bias
I remain cautiously bullish while price holds above 0.1295. My preferred strategy is to wait for a controlled pullback and confirmation rather than buying directly into resistance. A clean breakout above 0.15320 could strengthen the continuation case, but failure to hold support may trigger profit-taking.
After a 251% rally, capital protection matters more than chasing every candle. Use appropriate leverage, define risk before entry, and remember that these levels are based on the screenshot rather than live market verification.
Not investment advice. Educational report only.
#AINUSDT #CryptoTrading #TechnicalAnalysis #BinanceFutures #Altcoins $AIN
{future}(AINUSDT)
$AIN USDT Explodes 251% in 24 Hours: Is Another Breakout Coming?
AINUSDT has delivered an explosive rally, climbing 251.01% in 24 hours and reaching 0.15320. Price is now trading around 0.14016, consolidating after a powerful upward move. The big question is whether buyers can push toward new highs or whether a deeper pullback is approaching.
Technical Breakdown
The 15-minute structure remains bullish, with price holding well above the Supertrend at 0.11090 and Parabolic SAR at 0.12951. However, momentum is cooling. MACD has turned negative, with DIF at 0.01082 below DEA at 0.01226, while RSI(6) sits near 62.44.
This combination suggests that buyers still have the broader intraday advantage, but chasing an extended rally carries significant risk.
Key Trading Levels
Potential pullback entry: 0.1340–0.1380, provided support holds and a bullish reversal signal appears.
Breakout trigger: A confirmed 15-minute close above 0.1450, followed by a successful retest.
Upside targets:
- TP1: 0.1450
- TP2: 0.1500
- TP3: 0.1532
- Extended target: 0.1583
Risk management: A sustained move below 0.1295 would invalidate this proposed bullish setup and could expose price to deeper support.
My Trading Bias
I remain cautiously bullish while price holds above 0.1295. My preferred strategy is to wait for a controlled pullback and confirmation rather than buying directly into resistance. A clean breakout above 0.15320 could strengthen the continuation case, but failure to hold support may trigger profit-taking.
After a 251% rally, capital protection matters more than chasing every candle. Use appropriate leverage, define risk before entry, and remember that these levels are based on the screenshot rather than live market verification.
Not investment advice. Educational report only.
#AINUSDT #CryptoTrading #TechnicalAnalysis #BinanceFutures #Altcoins $AIN
106
·
--
Bullish
$BTW Surges 4.9% on 3x Volume: Bullish Reversal or Just a Short Squeeze?
BTW is showing a powerful short-term move, jumping 4.9% alongside a 3x volume spike. But is this the beginning of a genuine trend reversal, or simply a short squeeze trapping late buyers?
My current bias is cautiously bullish in the very short term, while the broader 1H structure remains bearish with lower highs and lower lows. The sharp rebound from the 1.01–1.13 demand zone suggests aggressive dip-buying or potential short liquidations, but one explosive candle does not confirm a sustainable reversal.
Key Trading Levels to Watch
The 1.26–1.32 zone is the first area to monitor for a potential pullback and bullish reaction. Traders should wait for clear confirmation, such as a bullish engulfing candle, a strong rejection wick, or a lower-timeframe market structure shift.
If buyers regain control, the first upside targets are 1.50 and 1.68. A convincing breakout and sustained close above 1.68 could open the way toward 1.92 and 2.15.
However, rejection at resistance could bring renewed selling pressure. A move below 1.26 would weaken the immediate bullish setup, while losing the 1.13–1.01 demand zone could expose 0.88 and the lower 0.82–0.65 support region.
Derivatives Data Tells Another Story
Open interest stands at $24.4M, down 7.1% over 24 hours. Funding is slightly positive at +0.0050%, while the taker ratio sits at 1.01x.
Falling open interest during a price surge can indicate short covering rather than strong new-position accumulation. Therefore, confirmation from price structure and sustained buying pressure remains essential.
My Strategy: Avoid chasing the pump. Watch 1.26–1.32 for a confirmed bullish reaction, target 1.50 and 1.68, and reassess momentum at each resistance. A sustained move above 1.68 would strengthen the reversal thesis.
The volume spike is impressive, but confirmation matters more than excitement.
Not investment advice. Educational report only.
#BTW #CryptoTrading #TechnicalAnalysis #Altcoins #BinanceSquare $BTW
{future}(BTWUSDT)
$BTW Surges 4.9% on 3x Volume: Bullish Reversal or Just a Short Squeeze?
BTW is showing a powerful short-term move, jumping 4.9% alongside a 3x volume spike. But is this the beginning of a genuine trend reversal, or simply a short squeeze trapping late buyers?
My current bias is cautiously bullish in the very short term, while the broader 1H structure remains bearish with lower highs and lower lows. The sharp rebound from the 1.01–1.13 demand zone suggests aggressive dip-buying or potential short liquidations, but one explosive candle does not confirm a sustainable reversal.
Key Trading Levels to Watch
The 1.26–1.32 zone is the first area to monitor for a potential pullback and bullish reaction. Traders should wait for clear confirmation, such as a bullish engulfing candle, a strong rejection wick, or a lower-timeframe market structure shift.
If buyers regain control, the first upside targets are 1.50 and 1.68. A convincing breakout and sustained close above 1.68 could open the way toward 1.92 and 2.15.
However, rejection at resistance could bring renewed selling pressure. A move below 1.26 would weaken the immediate bullish setup, while losing the 1.13–1.01 demand zone could expose 0.88 and the lower 0.82–0.65 support region.
Derivatives Data Tells Another Story
Open interest stands at $24.4M, down 7.1% over 24 hours. Funding is slightly positive at +0.0050%, while the taker ratio sits at 1.01x.
Falling open interest during a price surge can indicate short covering rather than strong new-position accumulation. Therefore, confirmation from price structure and sustained buying pressure remains essential.
My Strategy: Avoid chasing the pump. Watch 1.26–1.32 for a confirmed bullish reaction, target 1.50 and 1.68, and reassess momentum at each resistance. A sustained move above 1.68 would strengthen the reversal thesis.
The volume spike is impressive, but confirmation matters more than excitement.
Not investment advice. Educational report only.
#BTW #CryptoTrading #TechnicalAnalysis #Altcoins #BinanceSquare $BTW
80
·
--
Bullish
$BR Bulls Eye a Liquidity Sweep at 0.5049: Is the Next Breakout Loading?
$BR is showing promising bullish signals as the 1H market structure continues to form higher highs and higher lows. The recent wick above 0.5049 on the 15-minute chart highlights a potential buy-side liquidity sweep, putting the spotlight on the next directional move.
Market Structure and Bias
My bias remains cautiously bullish while the 1H structure holds its higher-low formation. The liquidity sweep could indicate a stop hunt around resistance, but confirmation is essential before assuming bullish continuation. Bearish daily and BTC conditions remain important risks.
Key Entry Zones
The ideal area to monitor is 0.4767–0.4691. A strong bullish engulfing candle, a convincing rejection wick, or a lower-timeframe market structure shift could provide confirmation for a potential long setup.
Alternatively, a pullback followed by a decisive reclaim of 0.5049 could signal renewed buying pressure. Avoid chasing a breakout without confirmation.
Price Targets
- TP1: 0.5151
- TP2: 0.5366
- TP3: 0.5578
Consider taking partial profits at resistance levels and managing risk as price moves in your favor.
Invalidation Level
A 1H candle close below 0.4725 would weaken the bullish structure and invalidate this setup. If support fails, reassess rather than forcing a long position.
Market Flow Snapshot
- Open Interest: $7.1M (+0.7% over 24 hours)
- Funding Rate: +0.0050%
- Taker Ratio: 1.09x
These readings suggest a modest positive flow bias, but they do not independently confirm accumulation or guarantee a breakout.
My Strategy: Wait for confirmation, respect the support zone, and let price action determine the next move. No FOMO, no blind entries, just disciplined risk management.
This is an educational market analysis, not financial advice. Always do your own research.
#BR #CryptoTrading #TechnicalAnalysis #BinanceSquare #Altcoins
{future}(BRUSDT)
$BR Bulls Eye a Liquidity Sweep at 0.5049: Is the Next Breakout Loading?
$BR is showing promising bullish signals as the 1H market structure continues to form higher highs and higher lows. The recent wick above 0.5049 on the 15-minute chart highlights a potential buy-side liquidity sweep, putting the spotlight on the next directional move.
Market Structure and Bias
My bias remains cautiously bullish while the 1H structure holds its higher-low formation. The liquidity sweep could indicate a stop hunt around resistance, but confirmation is essential before assuming bullish continuation. Bearish daily and BTC conditions remain important risks.
Key Entry Zones
The ideal area to monitor is 0.4767–0.4691. A strong bullish engulfing candle, a convincing rejection wick, or a lower-timeframe market structure shift could provide confirmation for a potential long setup.
Alternatively, a pullback followed by a decisive reclaim of 0.5049 could signal renewed buying pressure. Avoid chasing a breakout without confirmation.
Price Targets
- TP1: 0.5151
- TP2: 0.5366
- TP3: 0.5578
Consider taking partial profits at resistance levels and managing risk as price moves in your favor.
Invalidation Level
A 1H candle close below 0.4725 would weaken the bullish structure and invalidate this setup. If support fails, reassess rather than forcing a long position.
Market Flow Snapshot
- Open Interest: $7.1M (+0.7% over 24 hours)
- Funding Rate: +0.0050%
- Taker Ratio: 1.09x
These readings suggest a modest positive flow bias, but they do not independently confirm accumulation or guarantee a breakout.
My Strategy: Wait for confirmation, respect the support zone, and let price action determine the next move. No FOMO, no blind entries, just disciplined risk management.
This is an educational market analysis, not financial advice. Always do your own research.
#BR #CryptoTrading #TechnicalAnalysis #BinanceSquare #Altcoins
206
·
--
Bullish
$SYN Surges 21.92% Then Reverses: Is the Rally Losing Momentum?
Synapse ($SYN) has delivered an impressive rally, climbing from approximately $0.15603 to a 24-hour high of $0.20455. However, the latest 15-minute chart shows a sharp pullback, raising an important question: is this a healthy correction or the beginning of a deeper retracement?
Technical Breakdown
My short-term bias is cautiously bearish while momentum remains weak. SYN is trading around $0.18936 after rejecting the $0.20455 resistance area.
The Parabolic SAR sits near $0.20289, above the current price, while MACD shows a bearish crossover configuration with a negative histogram. RSI(6) is approximately 32.07, suggesting selling pressure has pushed momentum close to oversold territory.
However, oversold conditions can produce a temporary bounce, so confirmation is essential.
Key Levels to Watch
Support: $0.18520–$0.18560.
If this zone holds and buyers reclaim $0.18950–$0.19000, a recovery toward $0.19200 and $0.19630 becomes possible. Stronger momentum could open the way toward $0.20289 and the previous high of $0.20455.
If support breaks decisively, downside levels near $0.18000 and $0.17490 become relevant.
Trading Strategy
I would avoid chasing either direction at the current price. A potential long requires bullish rejection and a confirmed reclaim of resistance. Conversely, a breakdown below $0.18520 followed by a failed retest would strengthen the bearish case.
Final Verdict: SYN remains significantly higher over 24 hours, but short-term momentum is weakening. Watch support, wait for confirmation, and manage risk carefully.
This analysis is based on the provided screenshot, not live market data. Educational purposes only, not financial advice.
#SYN #Synapse #CryptoTrading #TechnicalAnalysis #Altcoins
{future}(SYNUSDT)
$SYN Surges 21.92% Then Reverses: Is the Rally Losing Momentum?
Synapse ($SYN ) has delivered an impressive rally, climbing from approximately $0.15603 to a 24-hour high of $0.20455. However, the latest 15-minute chart shows a sharp pullback, raising an important question: is this a healthy correction or the beginning of a deeper retracement?
Technical Breakdown
My short-term bias is cautiously bearish while momentum remains weak. SYN is trading around $0.18936 after rejecting the $0.20455 resistance area.
The Parabolic SAR sits near $0.20289, above the current price, while MACD shows a bearish crossover configuration with a negative histogram. RSI(6) is approximately 32.07, suggesting selling pressure has pushed momentum close to oversold territory.
However, oversold conditions can produce a temporary bounce, so confirmation is essential.
Key Levels to Watch
Support: $0.18520–$0.18560.
If this zone holds and buyers reclaim $0.18950–$0.19000, a recovery toward $0.19200 and $0.19630 becomes possible. Stronger momentum could open the way toward $0.20289 and the previous high of $0.20455.
If support breaks decisively, downside levels near $0.18000 and $0.17490 become relevant.
Trading Strategy
I would avoid chasing either direction at the current price. A potential long requires bullish rejection and a confirmed reclaim of resistance. Conversely, a breakdown below $0.18520 followed by a failed retest would strengthen the bearish case.
Final Verdict: SYN remains significantly higher over 24 hours, but short-term momentum is weakening. Watch support, wait for confirmation, and manage risk carefully.
This analysis is based on the provided screenshot, not live market data. Educational purposes only, not financial advice.
#SYN #Synapse #CryptoTrading #TechnicalAnalysis #Altcoins
75
·
--
Bullish
$GNS Explodes 2.6% on 13.3x Volume: Smart Money Accumulation or a Temporary Stop Hunt?
Gains Network ($GNS) is attracting attention after a sharp 2.6% price jump accompanied by an extraordinary 13.3x volume spike. This sudden surge signals intense market activity, but the big question remains: are buyers preparing a reversal, or is this simply a liquidity-driven move?
Market Structure and Bias
My bias is cautiously bullish for a tactical long. The volume expansion suggests aggressive participation, potentially reflecting accumulation or a stop-driven rebound. However, the 1-hour structure remains bearish, so this move is not yet a confirmed trend reversal.
The critical resistance sits at $0.414. A clean breakout and sustained hold above this level could signal a structural shift and strengthen the bullish case.
Potential Entry Zone
The preferred entry area is $0.390–$0.398, provided price action confirms buyer strength. Look for a bullish engulfing candle, a strong pin-bar rejection, or a clear 5-minute market structure shift from lower lows to higher highs.
Ideally, price should close above $0.398 with sustained volume, followed by a successful retest where buyers defend the breakout level.
Upside Targets
Target 1: $0.414 — key supply and potential trend-flip level.
Target 2: $0.426 — next resistance zone.
Target 3: $0.460 — potential continuation target.
Target 4: $0.485 — extended target if bullish momentum accelerates.
Risk Management and Invalidation
The $0.381 swing low is the critical downside reference. A confirmed 1-hour close below this level would invalidate the immediate bullish thesis and put further downside back in focus. If price loses $0.398 and reverses sharply, avoid forcing an entry.
One major warning: Bitcoin's broader structure remains bearish. Renewed BTC selling pressure could quickly undermine this setup, regardless of GNS's volume spike.
Final Verdict: GNS has momentum, but confirmation must come first. $GNS
{spot}(GNSUSDT)
#GNS #CryptoTrading
$GNS Explodes 2.6% on 13.3x Volume: Smart Money Accumulation or a Temporary Stop Hunt?
Gains Network ($GNS ) is attracting attention after a sharp 2.6% price jump accompanied by an extraordinary 13.3x volume spike. This sudden surge signals intense market activity, but the big question remains: are buyers preparing a reversal, or is this simply a liquidity-driven move?
Market Structure and Bias
My bias is cautiously bullish for a tactical long. The volume expansion suggests aggressive participation, potentially reflecting accumulation or a stop-driven rebound. However, the 1-hour structure remains bearish, so this move is not yet a confirmed trend reversal.
The critical resistance sits at $0.414. A clean breakout and sustained hold above this level could signal a structural shift and strengthen the bullish case.
Potential Entry Zone
The preferred entry area is $0.390–$0.398, provided price action confirms buyer strength. Look for a bullish engulfing candle, a strong pin-bar rejection, or a clear 5-minute market structure shift from lower lows to higher highs.
Ideally, price should close above $0.398 with sustained volume, followed by a successful retest where buyers defend the breakout level.
Upside Targets
Target 1: $0.414 — key supply and potential trend-flip level.
Target 2: $0.426 — next resistance zone.
Target 3: $0.460 — potential continuation target.
Target 4: $0.485 — extended target if bullish momentum accelerates.
Risk Management and Invalidation
The $0.381 swing low is the critical downside reference. A confirmed 1-hour close below this level would invalidate the immediate bullish thesis and put further downside back in focus. If price loses $0.398 and reverses sharply, avoid forcing an entry.
One major warning: Bitcoin's broader structure remains bearish. Renewed BTC selling pressure could quickly undermine this setup, regardless of GNS's volume spike.
Final Verdict: GNS has momentum, but confirmation must come first. $GNS
#GNS #CryptoTrading
80
·
--
Bullish
$ENA Bulls Defend Key Support: Is the Next Rally Toward $0.21795 Loading?
Ethena ($ENA) is showing a potentially bullish setup after a liquidity sweep below $0.20696. The key question now is whether buyers can reclaim control and push price toward the next resistance zone.
Market Structure and Bias
My bias remains bullish on the 1-hour timeframe. The recent wick below $0.20696 may represent a liquidity grab, shaking out weaker positions before a possible continuation move. However, this interpretation still needs confirmation from price action.
The critical higher low remains at $0.20455. As long as this level holds, the bullish structure stays intact, keeping the door open for another attempt toward local resistance.
The ideal entry area is around $0.20700, but I would not enter blindly. First, I want to see price reclaim this level and confirm buyer strength through a bullish engulfing candle or a strong pin-bar rejection on the 15-minute or 1-hour chart.
Targets to Watch
Target 1: $0.21350 — local resistance.
Target 2: $0.21475–$0.21673 — potential supply zone.
Target 3: $0.21795 — previous swing high and potential upside extension.
Invalidation and Risk Management
A confirmed 1-hour close below $0.20455 would invalidate this bullish setup. If that happens, I would step aside rather than force a trade. Risk management remains essential, especially when trading volatile altcoins.
Market Flow Check
Open interest stands at $106.8M, down 3.8% over 24 hours. Funding is slightly positive at +0.0050%, while the taker ratio is 0.97x. These figures do not yet confirm aggressive buyer dominance.
One important caution: this setup runs against the current 1-hour BTC structure and the 1-hour/daily indicator direction. Therefore, stronger confirmation is necessary before considering an entry.
Conclusion: ENA favors bullish continuation above $0.20455, but confirmation matters more than prediction. Watch the reclaim, respect invalidation, and avoid chasing price.
Educational analysis only
#ENA #Ethena #CryptoTrading
{future}(ENAUSDT)
$ENA Bulls Defend Key Support: Is the Next Rally Toward $0.21795 Loading?
Ethena ($ENA ) is showing a potentially bullish setup after a liquidity sweep below $0.20696. The key question now is whether buyers can reclaim control and push price toward the next resistance zone.
Market Structure and Bias
My bias remains bullish on the 1-hour timeframe. The recent wick below $0.20696 may represent a liquidity grab, shaking out weaker positions before a possible continuation move. However, this interpretation still needs confirmation from price action.
The critical higher low remains at $0.20455. As long as this level holds, the bullish structure stays intact, keeping the door open for another attempt toward local resistance.
The ideal entry area is around $0.20700, but I would not enter blindly. First, I want to see price reclaim this level and confirm buyer strength through a bullish engulfing candle or a strong pin-bar rejection on the 15-minute or 1-hour chart.
Targets to Watch
Target 1: $0.21350 — local resistance.
Target 2: $0.21475–$0.21673 — potential supply zone.
Target 3: $0.21795 — previous swing high and potential upside extension.
Invalidation and Risk Management
A confirmed 1-hour close below $0.20455 would invalidate this bullish setup. If that happens, I would step aside rather than force a trade. Risk management remains essential, especially when trading volatile altcoins.
Market Flow Check
Open interest stands at $106.8M, down 3.8% over 24 hours. Funding is slightly positive at +0.0050%, while the taker ratio is 0.97x. These figures do not yet confirm aggressive buyer dominance.
One important caution: this setup runs against the current 1-hour BTC structure and the 1-hour/daily indicator direction. Therefore, stronger confirmation is necessary before considering an entry.
Conclusion: ENA favors bullish continuation above $0.20455, but confirmation matters more than prediction. Watch the reclaim, respect invalidation, and avoid chasing price.
Educational analysis only
#ENA #Ethena #CryptoTrading
130
·
--
Bearish
$POLYX Drops 3.5% on 2.8x Volume: Is a Deeper Correction Coming?
POLYX is showing signs of short-term weakness after dropping 3.5% in just 15 minutes with a 2.8x volume spike. Is this smart-money distribution or a liquidity sweep before a potential recovery?
Market Bias: Cautiously Bearish
The sharp sell-off, upper wick, and rejection from resistance suggest strong selling pressure. However, the volume spike alone cannot confirm institutional selling. Price action and follow-through remain essential.
The 1H structure is still technically bullish, but bearish daily and weekly trends, alongside weakness in BTC, increase downside risks. Any long position currently carries counter-trend risk.
Key Support Levels
- 0.0350: Immediate support.
- 0.0342: Next downside target.
- 0.0331: Critical 1H structural level.
- 0.0329, 0.0325 and 0.0320: Further downside levels if selling accelerates.
A strong break below 0.0350 could expose lower support zones. Acceptance below 0.0331 would strengthen the bearish outlook and potentially confirm a 1H trend reversal.
Potential Short Setup
Watch for a failed bounce around 0.0362–0.0365 or bearish rejection near 0.0374. A lower high or bearish 5M–15M market structure shift would provide better confirmation before entry.
Potential take-profit levels are 0.0350, 0.0342 and 0.0329. A strong 1H close above 0.0374 would weaken the bearish setup, while a sustained reclaim above 0.0382 could restore bullish momentum.
Derivatives Snapshot
Open interest stands at $2.2M, up 1.0% over 24 hours. Funding is -0.1789%, and the taker ratio is 1.01x. Negative funding may indicate crowded shorts, creating potential squeeze risk if buyers regain control.
Final Verdict: POLYX is approaching a crucial decision zone. Watch 0.0350 closely, wait for confirmation, and avoid chasing volatility.
Not investment advice. Educational analysis only.
#POLYX #CryptoTrading #TechnicalAnalysis #Altcoins #BinanceSquare
{future}(POLYXUSDT)
CHIL-WITH-CRYPTO
$POLYX Drops 3.5% on 2.8x Volume: Is a Deeper Correction Coming?
POLYX is showing signs of short-term weakness after dropping 3.5% in just 15 minutes with a 2.8x volume spike. Is this smart-money distribution or a liquidity sweep before a potential recovery?
Market Bias: Cautiously Bearish
The sharp sell-off, upper wick, and rejection from resistance suggest strong selling pressure. However, the volume spike alone cannot confirm institutional selling. Price action and follow-through remain essential.
The 1H structure is still technically bullish, but bearish daily and weekly trends, alongside weakness in BTC, increase downside risks. Any long position currently carries counter-trend risk.
Key Support Levels
- 0.0350: Immediate support.
- 0.0342: Next downside target.
- 0.0331: Critical 1H structural level.
- 0.0329, 0.0325 and 0.0320: Further downside levels if selling accelerates.
A strong break below 0.0350 could expose lower support zones. Acceptance below 0.0331 would strengthen the bearish outlook and potentially confirm a 1H trend reversal.
Potential Short Setup
Watch for a failed bounce around 0.0362–0.0365 or bearish rejection near 0.0374. A lower high or bearish 5M–15M market structure shift would provide better confirmation before entry.
Potential take-profit levels are 0.0350, 0.0342 and 0.0329. A strong 1H close above 0.0374 would weaken the bearish setup, while a sustained reclaim above 0.0382 could restore bullish momentum.
Derivatives Snapshot
Open interest stands at $2.2M, up 1.0% over 24 hours. Funding is -0.1789%, and the taker ratio is 1.01x. Negative funding may indicate crowded shorts, creating potential squeeze risk if buyers regain control.
Final Verdict: POLYX is approaching a crucial decision zone. Watch 0.0350 closely, wait for confirmation, and avoid chasing volatility.
Not investment advice. Educational analysis only.
#POLYX #CryptoTrading #TechnicalAnalysis #Altcoins #BinanceSquare
CHIL-WITH-CRYPTO
50
·
--
Bullish
💰 $AGT Jumps 3.2% on Nearly 3x Volume — Reversal Incoming or Just a Bear-Market Bounce?
$AGT is showing signs of short-term buying pressure, but is this the beginning of a recovery or simply another counter-trend bounce? The volume spike is attracting attention, yet confirmation remains essential.
Market Structure: Cautiously Bullish
AGT surged 3.2% in 15 minutes alongside a reported 2.9x volume increase. The move followed a sweep of the 0.05688 liquidity low, suggesting a possible liquidity grab and renewed buying interest. However, the 1H trend remains bearish, with price trading below both EMA20 and EMA200.
Key Resistance to Watch
The 0.0658–0.0665 supply zone is the first major hurdle. A clean breakout and sustained hold above this region could strengthen bullish momentum, while reclaiming the 0.06417 structure level would provide another important confirmation signal.
Potential Entry Zone
The 0.0588–0.0605 area is worth monitoring for a potential retest. Rather than chasing the initial spike, look for a 5M or 15M bullish engulfing candle, a strong rejection wick, or a lower-timeframe market structure shift before considering an entry.
Upside Targets
- TP1: 0.0658
- TP2: 0.0703
- TP3: 0.0733
- Extended target: 0.0810
Consider taking partial profits near resistance rather than assuming every target will be reached.
Risk Levels
A decisive break below 0.05688 would weaken the bullish bounce scenario and expose potential downside toward 0.0521 and 0.0463.
Derivatives Snapshot
- Open Interest: $23.2M, down 11.5% over 24 hours
- Funding Rate: +0.0129%
- Taker Ratio: 1.03x
Despite the positive taker ratio, falling open interest means the move alone does not confirm fresh accumulation. The derivatives data should be monitored alongside price action.
My Verdict: AGT offers a possible short-term bounce opportunity, but the bearish 1H and BTC trends demand caution. A confirmed breakout matters more than a temporary volume spike. Wait for confirmation, manage risk, and avoid chasing momentum.
$AGT
{future}(AGTUSDT)
#AGT #CryptoTrading
💰 $AGT Jumps 3.2% on Nearly 3x Volume — Reversal Incoming or Just a Bear-Market Bounce?
$AGT is showing signs of short-term buying pressure, but is this the beginning of a recovery or simply another counter-trend bounce? The volume spike is attracting attention, yet confirmation remains essential.
Market Structure: Cautiously Bullish
AGT surged 3.2% in 15 minutes alongside a reported 2.9x volume increase. The move followed a sweep of the 0.05688 liquidity low, suggesting a possible liquidity grab and renewed buying interest. However, the 1H trend remains bearish, with price trading below both EMA20 and EMA200.
Key Resistance to Watch
The 0.0658–0.0665 supply zone is the first major hurdle. A clean breakout and sustained hold above this region could strengthen bullish momentum, while reclaiming the 0.06417 structure level would provide another important confirmation signal.
Potential Entry Zone
The 0.0588–0.0605 area is worth monitoring for a potential retest. Rather than chasing the initial spike, look for a 5M or 15M bullish engulfing candle, a strong rejection wick, or a lower-timeframe market structure shift before considering an entry.
Upside Targets
- TP1: 0.0658
- TP2: 0.0703
- TP3: 0.0733
- Extended target: 0.0810
Consider taking partial profits near resistance rather than assuming every target will be reached.
Risk Levels
A decisive break below 0.05688 would weaken the bullish bounce scenario and expose potential downside toward 0.0521 and 0.0463.
Derivatives Snapshot
- Open Interest: $23.2M, down 11.5% over 24 hours
- Funding Rate: +0.0129%
- Taker Ratio: 1.03x
Despite the positive taker ratio, falling open interest means the move alone does not confirm fresh accumulation. The derivatives data should be monitored alongside price action.
My Verdict: AGT offers a possible short-term bounce opportunity, but the bearish 1H and BTC trends demand caution. A confirmed breakout matters more than a temporary volume spike. Wait for confirmation, manage risk, and avoid chasing momentum.
$AGT
#AGT #CryptoTrading
58
·
--
Bullish
📣BREAKING: Mecca Pact Delegations Head to Tehran as Middle East Tensions Rise
A significant diplomatic development is drawing attention across the Middle East as senior officials from Saudi Arabia, Pakistan, and Türkiye engage in talks with Iranian leaders in Tehran on October 26, 2026. The discussions come amid heightened regional tensions and concerns about further escalation involving Iran, the United States, and Israel.
According to reports attributed to Reuters and the Associated Press, the delegations include Saudi Defence Minister Prince Khalid bin Salman, Pakistan’s Army Chief Field Marshal Asim Munir, and Türkiye’s intelligence chief Ibrahim Kalin. Their reported discussions focus on regional security and efforts to reduce tensions.
The diplomatic initiative comes amid concerns about Houthi missile and drone attacks targeting Saudi Arabia and continuing tensions between Washington and Tehran. Pakistan and Qatar have also been involved in diplomatic efforts aimed at encouraging dialogue and preventing a wider regional conflict.
The meeting is particularly important because Saudi Arabia, Pakistan, and Türkiye have been associated with discussions on regional security cooperation. However, the precise legal status, membership, and provisions of any reported Mecca defence pact should be verified through official documents before claims about mutual defence obligations are treated as established fact.
The broader conflict involving Iran, Israel, and the United States continues to raise concerns about regional stability. Lebanon and tensions involving Israel and Hezbollah remain important parts of the wider security picture. However, their inclusion as formal agenda items in the Tehran meeting should not be claimed without explicit confirmation from reliable reporting or official statements.
The key questions are whether these discussions can support diplomatic communication, reduce the risk of escalation, and produce concrete steps toward regional stability.
#MiddleEast #Geopolitics #NewsUpdated #EarningsSeason
CHIL-WITH-CRYPTO

107
Log in to explore more content
Join global crypto users on Binance Square
⚡️ Get latest and useful information about crypto.
💬 Trusted by the world’s largest crypto exchange.
👍 Discover real insights from verified creators.
Email / Phone number