

#sox
sox
57,349 views
100 Discussing
Hot
Latest

·
--
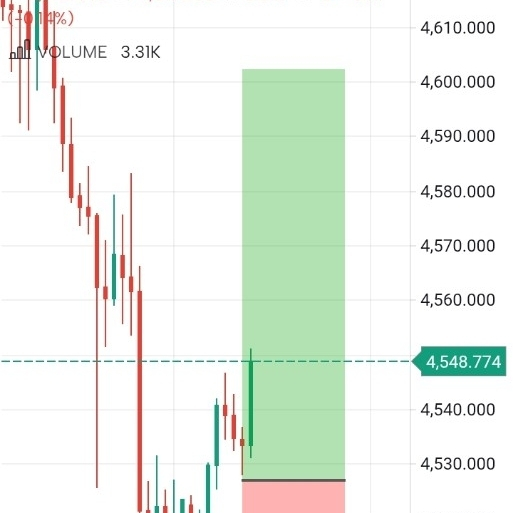
LONG / BUY setup $SOXSB
{spot}(SOXSBUSDT)
Entry: $31.00–31.30
Stop Loss: $30.50
TP1: $32.00
TP2: $32.80
TP3: $33.50
$XRP
#SOX
LONG / BUY setup $SOXSB
Entry: $31.00–31.30
Stop Loss: $30.50
TP1: $32.00
TP2: $32.80
TP3: $33.50
$XRP
#SOX
Entry: $31.00–31.30
Stop Loss: $30.50
TP1: $32.00
TP2: $32.80
TP3: $33.50
$XRP
#SOX
2
83

·
--
5-minute trend scan reveals 2 clear opportunities.
Short $SOX. Under a three-cycle resonance-down structure: 5-minute downtrend, 15-minute downtrend, and 1-hour downtrend. The three-cycle trend strengths are 71, 72, and 67 respectively, with fully aligned direction. Currently, the last ~3 bearish candles show 0 bullish candles. The close at 33.82 is 1.8% below the 5-minute EMA20. Price keeps weakening along the short-term moving averages and is in an accelerating sell-off phase. The breakout status indicates continuation of the downtrend with a 1.05x volume expansion. Bearish momentum has not shown any exhaustion signal. Entry score: 66. Structure score: 64. No known resistance levels on the higher timeframe. There is a price vacuum overhead, with low resistance during the decline—this is a textbook-style trend-following continuation.
Current price: 33.82. Entry: 33.70–33.90. Stop loss: 34.65 (above the prior high 34.63). Target: 31.80. Risk/reward: 2.3:1.
Conclusion: You can short. Three cycles moving in the same direction qualifies as a trend-following setup. If a pullback enters the entry zone but the upper edge is not broken, continue holding. When reaching the target, take profit on half first. If 34.65 is broken, exit immediately without hesitation.
$PEPE goes long. Volumetric breakout continuation within a ranging structure: volume expands 2.64x, clearly higher than the recent average. In the last ~2 candles there are 2 bullish candles and 0 bearish candles. On the 1-hour chart, it is in a strong uptrend (strength 89). The higher timeframe direction provides support to the upside. 5-minute range, 15-minute range, and 1-hour strong uptrend. Entry score: 53. Structure score: 52. A known higher-timeframe resistance is 0.96% above. After breakout, upside room is limited, but the volume expansion and trend-confluence signal is clear—suitable for a light position trial only; do not chase.
Current price: 0.004972. Entry: 0.004900–0.004990. Stop loss: 0.004800. Target: 0.005250. Risk/reward: 2.1:1.
Conclusion: You can buy. With a breakout continuation on volume and the higher-timeframe trend pointing up, hold if the pullback does not break the lower edge of the entry zone. If the stop-loss level is broken, exit unconditionally—do not hold through the stop.
Overall assessment: The three-cycle resonance quality of SOX is clearly higher than PEPE’s consolidation-breakout. Priority should be given to SOX; PEPE is for light positions only. Within the current scan window, other symbols are mostly failed breakouts or low-volume consolidation/observation states. None meet the criteria for the third setup—quality over quantity.
Suggested position sizing: no more than 10% per coin.
#SOX #PEPE #做空 #做多 #Technical Analysis
155
·
--
Bullish
Semiconductors in the zone of historical overheating
Index of semiconductors (SOX$SOXL ) rose more than 100% above its 200-week moving average (MA). Last week we closed above this threshold.
And the only time we saw a similar breakout was in November 1999, exactly 4 months before the global peak of the bull market in March. 2000-го.
Yes, the profits of companies now cannot be compared with those of the past (fundamentals have become tougher), but ignore such technicalities. Anomaly is impossible.
#USA #Aİ #SOX #chips
185




·
--
🚨 $SOX SEMICONDUCTOR SECTOR FLASHING THE FIRST BULLISH STRUCTURE SINCE THE 20% DUMP 💥
Entry: SOX 1% daily reclaim ⚡
Target: Full retrace of June losses 🚀
Stop Loss: Below Thursday's 8.2% surge low ⚠️
📊 The tape is shifting. After the worst monthly performance since 2008, the PHLX Semiconductor Index is printing its first institutional accumulation signals — an 8.2% one-day surge last Thursday, the largest in 15 months, followed by sustained buying into Monday's close. 📈 This is the classic reclaim of a liquidity void that caught the crowd leaning short.
🔍 The smart money narrative is clear: BofA sees hyperscaler capex hitting $860B this year, up 80% YoY, while UBS projects AI spending at $900B rising to $1.2T by 2027. 💡 Citi calls the pullback a "buying opportunity," with data centers representing 34% of semiconductor demand and 2026-27 EPS estimates already revised up 7-8%. The question is no longer whether AI is overheated — it's which names still have the fundamentals to run. 💬 Are you rotating into the hardware chain or waiting for one final sweep below the lows? 👇
⚠️ Not financial advice. Always manage your risk. 🛡️
🏷️ #SOX #Semiconductors #AI #ChipStocks #InstitutionalFlow
🔥 🦈
28

·
--
Bearish
$SOXS : Bearish Reversal Signal ⚡
The price is trading at $46.28 after a clear rejection at the Supertrend (47.57) and the upper Bollinger Band (47.39). We observe:
🔸 RSI(6) at 47.57, fallen back below 50 after a peak — loss of bullish momentum
🔸 Price has fallen back below the EMA(7) at 46.45 and is near the Bollinger Band (46.30).
🔸 Red candles have dominated the last 15-minute periods, with volume declining.
This structure suggests a continuation of the downward trend if the selling pressure is confirmed.
My plan
entry between 44.5 and 45
take profit 1: 43
take profit 2: 42
⚠️5x-10x leverage, risk management essential.
trade 👇
{future}(SOXSUSDT)
#sox #crypto #trade #bank
$SOXS : Bearish Reversal Signal ⚡
The price is trading at $46.28 after a clear rejection at the Supertrend (47.57) and the upper Bollinger Band (47.39). We observe:
🔸 RSI(6) at 47.57, fallen back below 50 after a peak — loss of bullish momentum
🔸 Price has fallen back below the EMA(7) at 46.45 and is near the Bollinger Band (46.30).
🔸 Red candles have dominated the last 15-minute periods, with volume declining.
This structure suggests a continuation of the downward trend if the selling pressure is confirmed.
My plan
entry between 44.5 and 45
take profit 1: 43
take profit 2: 42
⚠️5x-10x leverage, risk management essential.
trade 👇
#sox #crypto #trade #bank
53

5-minute trend scan reveals 2 clear opportunities.
$SOX short. A three-cycle downward trend resonance; after volume expands 1.16x and the backtested resistance level is reached, it gets rejected and bears down. 5-minute downtrend, 15-minute downtrend, 1-hour downtrend. Entry score 95, structure score 73. Higher-timeframe space structure is a vacuum.
Current price 50.67. Entry 50.50–50.80, stop loss 51.10, target 49.80, reward-to-risk ratio 1.6:1.
Conclusion: You can short. Entry score is extremely high; three-cycle bearish resonance, and resistance is confirmed via backtest.
$ZEN long. Three-cycle upward trend resonance; volume expands 2.19x to break above the previous high, and the close holds above the pressure level. 5-minute uptrend, 15-minute uptrend, 1-hour uptrend. Entry score 69, structure score 84. Higher-timeframe space structure is a vacuum.
Current price 6.283. Entry 6.20–6.35, stop loss 6.05, target 6.70, reward-to-risk ratio 1.7:1.
Conclusion: It can be bought. Breakout confirmed with volume expansion; multi-timeframe resonance; structure score is extremely high.
Recommended position size: no more than 10% per coin.
#SOX #ZEN
38

$SOX DROPS TO ONE-MONTH LOW – DECLINE ACCELERATING 🔥
The Philadelphia Semiconductor Index just hit a one-month low with the decline expanding to 4.45%. That’s the sharpest single-day move since mid-June, and it’s flashing serious risk-off signals across tech-linked assets.
When semis bleed this hard, crypto usually catches the spillover within hours. If $SOX fails to reclaim the 4% level by close, expect rotation out of risk assets. I’m watching for a bid at key support zones overnight.
Are you hedging or waiting to buy the dip?
Not financial advice. Always manage your risk.
#SOX #Semiconductor #MarketDrop #MacroAlert #RiskOff
🔥
29

·
--
Bullish
🟢 SOXL Short Liquidation Alert 🚨
A $50.8K SOXL short position was liquidated at $175.82, signaling strong bullish pressure as bears were forced to exit.
🎯 Target Entry Zone: Around $175.82 after confirmation.
🛑 Stop Loss: Below the nearest support level.
🎯 Take Profit: Scale out at key resistance levels and manage risk carefully.
Always wait for confirmation before entering a trade—avoid chasing the move.
#SOX L #Trading #Liquidation #Crypto #BinanceSquare #Write2Earn
{future}(SOXLUSDT)
🟢 SOXL Short Liquidation Alert 🚨
A $50.8K SOXL short position was liquidated at $175.82, signaling strong bullish pressure as bears were forced to exit.
🎯 Target Entry Zone: Around $175.82 after confirmation.
🛑 Stop Loss: Below the nearest support level.
🎯 Take Profit: Scale out at key resistance levels and manage risk carefully.
Always wait for confirmation before entering a trade—avoid chasing the move.
#SOX L #Trading #Liquidation #Crypto #BinanceSquare #Write2Earn
253

·
--
Verified
#半导体 #白银 #SOX
When comparing semiconductors and silver, I guess many people would find it surprising, but the trend really does look quite similar. Semiconductor storage stocks—SanDisk, Micron, Hynix, Samsung, and others—this round of pullback is a very standard channel-down move. After the U.S. stock market closed last night, this downward structure is still continuing. To reverse it will require time.
Here, I think Morgan Stanley’s perspective is quite interesting. Morgan Stanley’s strategy team released a new strategy research report. In one sentence:
The selling that started in June is basically over. The S&P 500’s year-end target is 8000. The AI theme hasn’t ended—it’s entered a second phase:
The market has started to “pick companies.” Previously, the market liked: high growth, high leverage, high beta. Now the market likes: stable earnings, high profit margins, strong cash flow, and high ROE. The market’s focus has undergone a fundamental shift.
As for semiconductors, Morgan Stanley believes: the short term can still rise, but it will be difficult to lead the rally again. Morgan Stanley compares the semiconductors’ performance with that of silver mining stocks from four months ago. At present, the trends look quite consistent.
3
13
13.2k


·
--
Bullish
📈 Innovation often begins with the technology powering everything behind the scenes.
$SOXL reflects growing interest in the semiconductor industry, a sector that continues supporting advancements in AI, computing, and digital transformation around the world.
#SOXlayer #Technology #InnovationPartnership #sox $SOXL
{future}(SOXLUSDT)
📈 Innovation often begins with the technology powering everything behind the scenes.
$SOXL reflects growing interest in the semiconductor industry, a sector that continues supporting advancements in AI, computing, and digital transformation around the world.
#SOXlayer #Technology #InnovationPartnership #sox $SOXL
$SOXL reflects growing interest in the semiconductor industry, a sector that continues supporting advancements in AI, computing, and digital transformation around the world.
#SOXlayer #Technology #InnovationPartnership #sox $SOXL
105

·
--
SEMICONDUCTOR INDEX SHOWS SIGNS OF HISTORICAL FRENZY AMID AI TRADING SHIFT 📈
The semiconductor sector is seeing a massive rotation as investors shift capital from large-cap tech into chip stocks. With the monthly RSI hitting levels not seen since the dot-com era, the momentum is undeniably strong but the structure is getting fragile.
We are seeing a rare combination of rising spot prices and rising volatility, which usually precedes a sharp move in either direction. While some see this as a mid-cycle overheat, the parallels to late-stage bubbles are becoming harder to ignore.
Are you trimming your exposure here or riding the momentum?
Not financial advice. Always manage your risk.
#SOX #AI #Semiconductors #MarketAnalysis #Trading
⚡
26

#PhiladelphiaSemiconductorIndexFalls4% | SOX Update🚨
Philadelphia Semiconductor Index drops -4% 📉
Heavy selling in semis. SOX breaking key support with bearish volume.
#SOX #Semiconductors #Nasdaq #Markets
#PhiladelphiaSemiconductorIndexFalls4% | SOX Update🚨
Philadelphia Semiconductor Index drops -4% 📉
Heavy selling in semis. SOX breaking key support with bearish volume.
#SOX #Semiconductors #Nasdaq #Markets
Philadelphia Semiconductor Index drops -4% 📉
Heavy selling in semis. SOX breaking key support with bearish volume.
#SOX #Semiconductors #Nasdaq #Markets
49
5-minute trend scan reveals 2 clear opportunities.
$SOX short. Three-cycle downward trend resonance; after volume expands 1.16x and the backtest hits the resistance level, price is under pressure. 5-minute downtrend, 15-minute downtrend, 1-hour downtrend. Entry score 95, structure score 73. High-timeframe space structure is a vacuum.
Current price 50.67. Entry 50.50–50.80, stop loss 51.10, target 49.80, risk-reward ratio 1.6:1.
Conclusion: You can short. Entry score is extremely high; three-cycle bearish resonance; resistance confirmed via backtest.
$ZEN long. Three-cycle uptrend resonance; volume expands 2.19x and breaks above the previous high, then closes and holds above the pressure level. 5-minute uptrend, 15-minute uptrend, 1-hour uptrend. Entry score 69, structure score 84. High-timeframe space structure is a vacuum.
Current price 6.283. Entry 6.20–6.35, stop loss 6.05, target 6.70, risk-reward ratio 1.7:1.
Conclusion: You can buy. Breakout confirmed by volume expansion; multi-timeframe resonance; structure score is very high.
Recommended position sizing: no more than 10% per coin.
#SOX #ZEN
24

$SOX IS SEEING A DIP THAT INSTITUTIONS CALL A BUYING OPPORTUNITY 🔥
The Philadelphia Semiconductor Index dropped 5.4% last week but reversed on Monday with storage names leading the charge. J.P. Morgan sees the chip upcycle extending through 2028, meaning the recent weakness is a structural buying zone rather than a distribution top.
Funds are rotating back into AI hardware names — Marvell, Broadcom, Western Digital all bounced sharply. The market is pricing certainty in the supply side while staying cautious on AI applications that face margin compression.
Does this rotation signal institutional positioning ahead of the next semiconductor leg, or is it just a dead cat bounce in an overextended cycle?
Not financial advice. Always manage your risk.
#SOX #Semiconductors #AIHardware #Rotation #BuyTheDip
🔥
53

$SOX ENTERS BEAR MARKET AFTER 20% PLUNGE FROM ALL-TIME HIGH 📉
The Philadelphia Semiconductor Index just closed 20% below its June ATH, meeting the technical definition of a bear market. Weekly losses hit 10% — the steepest since April 2025, according to data from Bit.com.
This kind of velocity in a major cyclical index often triggers liquidity cascades across correlated assets. The question is whether we’re seeing a full structural shift or a violent correction before a snap-back.
Are you scaling into semis or waiting for price to reclaim prior support?
Not financial advice. Always manage your risk.
#SOX #BearMarket #Semiconductor #MarketStructure
🔔
52

·
--
My strategy with $SOXLB and $SOXSB is simple:
I don’t try to guess the market.
I keep positions on both sides.
When one of them rises strongly and forms a reversal signal, I realize part of the profit and reinforce the opposite side, which has become cheaper.
So I turn volatility into opportunity, always with discipline, risk management, and a focus on small consistent gains.
#bstock #sox
1
1
178
·
--
Three signals.
RSI on the $KOMA 15-minute timeframe surged to 96.4 overbought. Current price 0.0166. Up 11% in 24h.
RSI on the $KAS 4-hour timeframe surged to 93.8 overbought. Current price 0.0355. Up 17% in 24h.
$SOX 4-hour RSI dumped to 13.4 oversold. Current price 42.7. Down 6% in 24h.
---
RSI $KOMA 15 minutes: 96.4. Extremely overbought. Current price 0.0166. Up 11% in 24h.
Support 0.014 0.0136. Resistance 0.019.
Fee rate +0.024%. Longs are crowded. Long/Short ratio 3.5.
Current price 0.0166. Bias: bearish. Entry zone 0.017-0.018. Stop-loss 0.0195. Target 0.014. Risk/reward about 2:1. RSI 96.4 indicates short-term buying is overheated and longs are too crowded.
RSI $KAS 4 hours: 93.8. Extremely overbought. Current price 0.0355. Up 17% in 24h.
Support 0.033 0.030. Resistance 0.036.
Fee rate +0.005%. Longs have the edge. Long/Short ratio 1.7.
Current price 0.0355. Bias: bearish. Entry zone 0.036-0.037. Stop-loss 0.039. Target 0.033. Risk/reward about 2:1. RSI 93.8 suggests the recent rally has been too strong, and pullback risk is building.
$SOX 4-hour RSI: 13.4. Extremely oversold. Current price 42.7. Down 6% in 24h.
Support 42 41.9. Resistance 44 45.
Fee rate 0%. Balanced between long and short. Long/Short ratio 1.2.
Current price 42.7. Bias: bullish. Entry zone 42-43. Stop-loss 41. Target 45. Risk/reward about 2:1. RSI 13.4 indicates that short-term selling pressure has already been relieved to a fairly high degree.
---
Three coins, two overbought and one oversold. KOMA and KAS are bearish and waiting for a pullback, while SOX is slightly bullish and waiting for a rebound. Position sizing matters more than direction.
I’m watching.
If you need a custom strategy, you can look for Nini.
#KOMA #KAS #SOX #RSI signal
57
Log in to explore more content
Join global crypto users on Binance Square
⚡️ Get latest and useful information about crypto.
💬 Trusted by the world’s largest crypto exchange.
👍 Discover real insights from verified creators.
Email / Phone number
Trending Topics
1
#CryptoVaultDepositsTop$10Billion
8,436 views
132 Discussing
2
#BitcoinSurpasses$83,000
3,047 views
20 Discussing
3
#USD1StablecoinLoses$400MMarketCapInTwoWeeks
2,416 views
67 Discussing
4
#JapanFSAPublishesOnChainFinanceForumMinutes
128,821 views
1,169 Discussing
5
#BitcoinReboundsAbove$82,000
6,729 views
19 Discussing
6
#BankOfRussiaSaysSelfCustodyBanStartsJuly2027
101,156 views
1,022 Discussing
7
#CFTCAdvancesVoluntaryRegCAMFramework
101,988 views
1,175 Discussing
8
#ChinaQ3GDPGrowthQuickensTo4.5%
44,540 views
799 Discussing
9
#ZcashNU7ProposalWouldFreezeSproutSpending
60,446 views
812 Discussing
10
#KOSPIOpens3.17%Lower
52,203 views
659 Discussing