
#nand
nand
12,507 views
65 Discussing
Hot
Latest

·
--
🚨 $SNDK
{future}(SNDKUSDT)
UPDATE: SanDisk Faces a Volatile AI-Driven Market
📉 SanDisk (NASDAQ: SNDK) came under pressure today, with shares falling sharply as investors reassessed high AI-related valuations and the broader semiconductor outlook.
At the same time, the long-term story remains interesting:
🔹 AI infrastructure continues driving demand for NAND flash storage
🔹 SanDisk has highlighted long-term customer partnerships and growth plans
🔹 The company is targeting strong margins and revenue growth through FY2030
🔹 SNDK has experienced an extraordinary rally this year, making volatility a major factor for traders
⚠️ Key Risk: After such a huge rally, profit-taking and AI-sector sentiment can cause large price swings.
📊 My view: SNDK remains an interesting AI-memory/storage stock, but traders should watch momentum and support levels carefully rather than chasing sudden spikes.
#SNDK #SanDisk #Stocks #NAND
🚨 $SNDK
UPDATE: SanDisk Faces a Volatile AI-Driven Market
📉 SanDisk (NASDAQ: SNDK) came under pressure today, with shares falling sharply as investors reassessed high AI-related valuations and the broader semiconductor outlook.
At the same time, the long-term story remains interesting:
🔹 AI infrastructure continues driving demand for NAND flash storage
🔹 SanDisk has highlighted long-term customer partnerships and growth plans
🔹 The company is targeting strong margins and revenue growth through FY2030
🔹 SNDK has experienced an extraordinary rally this year, making volatility a major factor for traders
⚠️ Key Risk: After such a huge rally, profit-taking and AI-sector sentiment can cause large price swings.
📊 My view: SNDK remains an interesting AI-memory/storage stock, but traders should watch momentum and support levels carefully rather than chasing sudden spikes.
#SNDK #SanDisk #Stocks #NAND
UPDATE: SanDisk Faces a Volatile AI-Driven Market
📉 SanDisk (NASDAQ: SNDK) came under pressure today, with shares falling sharply as investors reassessed high AI-related valuations and the broader semiconductor outlook.
At the same time, the long-term story remains interesting:
🔹 AI infrastructure continues driving demand for NAND flash storage
🔹 SanDisk has highlighted long-term customer partnerships and growth plans
🔹 The company is targeting strong margins and revenue growth through FY2030
🔹 SNDK has experienced an extraordinary rally this year, making volatility a major factor for traders
⚠️ Key Risk: After such a huge rally, profit-taking and AI-sector sentiment can cause large price swings.
📊 My view: SNDK remains an interesting AI-memory/storage stock, but traders should watch momentum and support levels carefully rather than chasing sudden spikes.
#SNDK #SanDisk #Stocks #NAND
189

·
--
🚀 $SNDK IS SHOWING STRENGTH AGAIN
SanDisk is rebounding as AI-driven storage demand remains strong.
The real story is enterprise SSD growth + tight NAND supply, not just AI hype. Mizuho remains bullish, while SanDisk and Kioxia plan major investment to expand flash-memory capacity.
📌 Long-term AI storage demand still looks strong.
⚠️ The main risk? $SNDK is already priced at a very high valuation.
Strong fundamentals, but chasing the rally carries risk.
$SNDK #AI #nand
🚀 $SNDK IS SHOWING STRENGTH AGAIN
SanDisk is rebounding as AI-driven storage demand remains strong.
The real story is enterprise SSD growth + tight NAND supply, not just AI hype. Mizuho remains bullish, while SanDisk and Kioxia plan major investment to expand flash-memory capacity.
📌 Long-term AI storage demand still looks strong.
⚠️ The main risk? $SNDK is already priced at a very high valuation.
Strong fundamentals, but chasing the rally carries risk.
$SNDK #AI #nand
SanDisk is rebounding as AI-driven storage demand remains strong.
The real story is enterprise SSD growth + tight NAND supply, not just AI hype. Mizuho remains bullish, while SanDisk and Kioxia plan major investment to expand flash-memory capacity.
📌 Long-term AI storage demand still looks strong.
⚠️ The main risk? $SNDK is already priced at a very high valuation.
Strong fundamentals, but chasing the rally carries risk.
$SNDK #AI #nand
43

🚨 $SNDK
{future}(SNDKUSDT)
— NAND CAPACITY EXPANSION BULLISH WATCH
🔥 Kioxia and are reportedly planning a major ¥5T investment over six years to expand NAND flash production capacity.
📈 If the investment accelerates supply expansion and strengthens the memory cycle, $SNDK could attract renewed bullish momentum.
🎯 Key level: $1,600
🚀 A strong breakout above resistance could open the next upside leg.
⚠️ Big fundamentals don’t guarantee an immediate rally. Watch price action and manage risk before chasing.
#SNDK #NAND #Semiconductor #Stocks
🚨 $SNDK
— NAND CAPACITY EXPANSION BULLISH WATCH
🔥 Kioxia and are reportedly planning a major ¥5T investment over six years to expand NAND flash production capacity.
📈 If the investment accelerates supply expansion and strengthens the memory cycle, $SNDK could attract renewed bullish momentum.
🎯 Key level: $1,600
🚀 A strong breakout above resistance could open the next upside leg.
⚠️ Big fundamentals don’t guarantee an immediate rally. Watch price action and manage risk before chasing.
#SNDK #NAND #Semiconductor #Stocks
— NAND CAPACITY EXPANSION BULLISH WATCH
🔥 Kioxia and are reportedly planning a major ¥5T investment over six years to expand NAND flash production capacity.
📈 If the investment accelerates supply expansion and strengthens the memory cycle, $SNDK could attract renewed bullish momentum.
🎯 Key level: $1,600
🚀 A strong breakout above resistance could open the next upside leg.
⚠️ Big fundamentals don’t guarantee an immediate rally. Watch price action and manage risk before chasing.
#SNDK #NAND #Semiconductor #Stocks
83

·
--
🚨 INSTITUTIONAL HARDWARE DEMAND SURGES AS $NAND MEMORY REVENUE JUMPS 500%! ⚡
High-tier memory storage producers are capturing massive institutional order flow as structural supply tightness drives gross margins from 35.3% to 76.8%. 📊 Quarterly revenue expanded nearly fivefold to 47 billion yuan, signaling unprecedented structural demand across high-performance storage blocks.
A multi-billion dollar capital deployment of $4.9B is allocated for production expansion and next-generation storage R&D. 🔍 With average selling prices holding at 2.73 times prior baselines, smart money is pricing in extended hardware capacity bottlenecks.
💡 How will this persistent memory supply crunch reshape valuations for decentralized storage ecosystems like $FIL ? 👇
⚠️ Not financial advice. Always manage your risk. 🛡️
🏷️ #NAND #FIL #Crypto #Hardware #Macro
⚡ 🔍
🚨 INSTITUTIONAL HARDWARE DEMAND SURGES AS $NAND MEMORY REVENUE JUMPS 500%! ⚡
High-tier memory storage producers are capturing massive institutional order flow as structural supply tightness drives gross margins from 35.3% to 76.8%. 📊 Quarterly revenue expanded nearly fivefold to 47 billion yuan, signaling unprecedented structural demand across high-performance storage blocks.
A multi-billion dollar capital deployment of $4.9B is allocated for production expansion and next-generation storage R&D. 🔍 With average selling prices holding at 2.73 times prior baselines, smart money is pricing in extended hardware capacity bottlenecks.
💡 How will this persistent memory supply crunch reshape valuations for decentralized storage ecosystems like $FIL ? 👇
⚠️ Not financial advice. Always manage your risk. 🛡️
🏷️ #NAND #FIL #Crypto #Hardware #Macro
⚡ 🔍
High-tier memory storage producers are capturing massive institutional order flow as structural supply tightness drives gross margins from 35.3% to 76.8%. 📊 Quarterly revenue expanded nearly fivefold to 47 billion yuan, signaling unprecedented structural demand across high-performance storage blocks.
A multi-billion dollar capital deployment of $4.9B is allocated for production expansion and next-generation storage R&D. 🔍 With average selling prices holding at 2.73 times prior baselines, smart money is pricing in extended hardware capacity bottlenecks.
💡 How will this persistent memory supply crunch reshape valuations for decentralized storage ecosystems like $FIL ? 👇
⚠️ Not financial advice. Always manage your risk. 🛡️
🏷️ #NAND #FIL #Crypto #Hardware #Macro
⚡ 🔍
161

·
--
🚨 INSTITUTIONAL CAPEX EXPLODES AS $NAND FLASH LEADER POSTS ¥33B NET PROFIT! 📊
Institutional capital allocation into memory infrastructure is reaching critical mass following fresh Q1 financial disclosures. 📊 Operating revenues topping ¥47B alongside ¥33.3B in net profit signal massive institutional order absorption and expanding global footprint.
As global NAND Flash delivery metrics consolidate into top-three status, smart money positioning confirms strong fundamental accumulation underlying hardware liquidity pools. ⚡ High-performance storage demand continues to clear structural friction across the tech ecosystem. 💬 How are you positioning around this macro memory rotation? 👇
⚠️ Not financial advice. Always manage your risk. 🛡️
🏷️ #NAND #MarketStructure #Institutional #Liquidity #Tech
🔥 💎
🚨 INSTITUTIONAL CAPEX EXPLODES AS $NAND FLASH LEADER POSTS ¥33B NET PROFIT! 📊
Institutional capital allocation into memory infrastructure is reaching critical mass following fresh Q1 financial disclosures. 📊 Operating revenues topping ¥47B alongside ¥33.3B in net profit signal massive institutional order absorption and expanding global footprint.
As global NAND Flash delivery metrics consolidate into top-three status, smart money positioning confirms strong fundamental accumulation underlying hardware liquidity pools. ⚡ High-performance storage demand continues to clear structural friction across the tech ecosystem. 💬 How are you positioning around this macro memory rotation? 👇
⚠️ Not financial advice. Always manage your risk. 🛡️
🏷️ #NAND #MarketStructure #Institutional #Liquidity #Tech
🔥 💎
Institutional capital allocation into memory infrastructure is reaching critical mass following fresh Q1 financial disclosures. 📊 Operating revenues topping ¥47B alongside ¥33.3B in net profit signal massive institutional order absorption and expanding global footprint.
As global NAND Flash delivery metrics consolidate into top-three status, smart money positioning confirms strong fundamental accumulation underlying hardware liquidity pools. ⚡ High-performance storage demand continues to clear structural friction across the tech ecosystem. 💬 How are you positioning around this macro memory rotation? 👇
⚠️ Not financial advice. Always manage your risk. 🛡️
🏷️ #NAND #MarketStructure #Institutional #Liquidity #Tech
🔥 💎
10

💥 GLOBAL NAND FLASH RECOVERY ACCELERATES AS HARDWARE PROFITS SURGE $NAND 🚀
The memory chip narrative is heating up fast as major producers flip previous losses into explosive net profitability. 📊 First-quarter operating income shattered records with global shipments officially securing a top three position worldwide.
This massive earnings turnaround signals that structural demand for hardware infrastructure is back in aggressive expansion mode. ⚡ Smart money is already mapping out the next leg of this tech liquidity rotation. 💡 Are you bidding this hardware momentum early or waiting for retail crowd FOMO? 👇
⚠️ Not financial advice. Always manage your risk. 🛡️
🏷️ #NAND #TechRally #Semiconductors #Infrastructure
🔥 💎
💥 GLOBAL NAND FLASH RECOVERY ACCELERATES AS HARDWARE PROFITS SURGE $NAND 🚀
The memory chip narrative is heating up fast as major producers flip previous losses into explosive net profitability. 📊 First-quarter operating income shattered records with global shipments officially securing a top three position worldwide.
This massive earnings turnaround signals that structural demand for hardware infrastructure is back in aggressive expansion mode. ⚡ Smart money is already mapping out the next leg of this tech liquidity rotation. 💡 Are you bidding this hardware momentum early or waiting for retail crowd FOMO? 👇
⚠️ Not financial advice. Always manage your risk. 🛡️
🏷️ #NAND #TechRally #Semiconductors #Infrastructure
🔥 💎
The memory chip narrative is heating up fast as major producers flip previous losses into explosive net profitability. 📊 First-quarter operating income shattered records with global shipments officially securing a top three position worldwide.
This massive earnings turnaround signals that structural demand for hardware infrastructure is back in aggressive expansion mode. ⚡ Smart money is already mapping out the next leg of this tech liquidity rotation. 💡 Are you bidding this hardware momentum early or waiting for retail crowd FOMO? 👇
⚠️ Not financial advice. Always manage your risk. 🛡️
🏷️ #NAND #TechRally #Semiconductors #Infrastructure
🔥 💎
36

·
--
SanDisk just ripped from $1,528 to $1,787. That's a 17% single-day move in a semiconductor stock. This doesn't happen without a reason.
📊 Technical Snapshot:
Price: $1,786.85 (+16.93%) | RSI: 57.1 (bullish but not overbought!)
Broke above 50 SMA($1,656) with conviction
75.9% above 3-month low — momentum is real
🧠 The Flash Memory Angle:
NAND pricing has been bottoming. When you combine: (1) AI storage demand exploding, (2) NAND prices stabilizing after 2 years of decline, and (3) enterprise SSD demand from data centers — you get the perfect setup for a flash memory rally.
A 17% move on normal volume (1.2x) is actually MORE bullish than a 17% move on huge volume. It means sellers were scarce — nobody wanted to sell at these prices.
📋 Key Levels:
• New Support: $1,656 (50 SMA, former resistance)
• Resistance: $2,050 | $2,335 (3-month high)
• If it holds above $1,656, this could run to $2,000+
💬 Flash memory stocks: the next semiconductor supercycle trade? 👇
#SanDisk #NAND #Semiconductors
⚠️ Disclaimer: Not financial advice. High-momentum stocks can reverse quickly. DYOR.
SanDisk just ripped from $1,528 to $1,787. That's a 17% single-day move in a semiconductor stock. This doesn't happen without a reason.
📊 Technical Snapshot:
Price: $1,786.85 (+16.93%) | RSI: 57.1 (bullish but not overbought!)
Broke above 50 SMA($1,656) with conviction
75.9% above 3-month low — momentum is real
🧠 The Flash Memory Angle:
NAND pricing has been bottoming. When you combine: (1) AI storage demand exploding, (2) NAND prices stabilizing after 2 years of decline, and (3) enterprise SSD demand from data centers — you get the perfect setup for a flash memory rally.
A 17% move on normal volume (1.2x) is actually MORE bullish than a 17% move on huge volume. It means sellers were scarce — nobody wanted to sell at these prices.
📋 Key Levels:
• New Support: $1,656 (50 SMA, former resistance)
• Resistance: $2,050 | $2,335 (3-month high)
• If it holds above $1,656, this could run to $2,000+
💬 Flash memory stocks: the next semiconductor supercycle trade? 👇
#SanDisk #NAND #Semiconductors
⚠️ Disclaimer: Not financial advice. High-momentum stocks can reverse quickly. DYOR.
📊 Technical Snapshot:
Price: $1,786.85 (+16.93%) | RSI: 57.1 (bullish but not overbought!)
Broke above 50 SMA($1,656) with conviction
75.9% above 3-month low — momentum is real
🧠 The Flash Memory Angle:
NAND pricing has been bottoming. When you combine: (1) AI storage demand exploding, (2) NAND prices stabilizing after 2 years of decline, and (3) enterprise SSD demand from data centers — you get the perfect setup for a flash memory rally.
A 17% move on normal volume (1.2x) is actually MORE bullish than a 17% move on huge volume. It means sellers were scarce — nobody wanted to sell at these prices.
📋 Key Levels:
• New Support: $1,656 (50 SMA, former resistance)
• Resistance: $2,050 | $2,335 (3-month high)
• If it holds above $1,656, this could run to $2,000+
💬 Flash memory stocks: the next semiconductor supercycle trade? 👇
#SanDisk #NAND #Semiconductors
⚠️ Disclaimer: Not financial advice. High-momentum stocks can reverse quickly. DYOR.
33

·
--
🚨 $SNDK SANDisK UPDATE 🚨
SNDK is back in the spotlight! 🔥
📈 SanDisk jumped around 11% on Monday as AI-driven demand continues to boost the memory & storage sector.
The bigger story? 👀
🔹 Strong AI data-center demand 🔹 Positive long-term growth outlook 🔹 Investor Day brought fresh bullish expectations 🔹 Company targets mid-to-high teens annual revenue growth for FY2028–FY2030 🔹 #nand flash demand remains a major catalyst
After a huge rally, volatility can remain high — so don’t chase blindly. ⚠️
$SNDK is definitely a stock worth watching closely. 👑
What do you think?
🚀 Bullish on SNDK or expecting a pullback?
#SNDK #SanDisk #stocks #AI #Semiconductors #NAND #TechStocks #stockmarket
🚨 $SNDK SANDisK UPDATE 🚨
SNDK is back in the spotlight! 🔥
📈 SanDisk jumped around 11% on Monday as AI-driven demand continues to boost the memory & storage sector.
The bigger story? 👀
🔹 Strong AI data-center demand 🔹 Positive long-term growth outlook 🔹 Investor Day brought fresh bullish expectations 🔹 Company targets mid-to-high teens annual revenue growth for FY2028–FY2030 🔹 #nand flash demand remains a major catalyst
After a huge rally, volatility can remain high — so don’t chase blindly. ⚠️
$SNDK is definitely a stock worth watching closely. 👑
What do you think?
🚀 Bullish on SNDK or expecting a pullback?
#SNDK #SanDisk #stocks #AI #Semiconductors #NAND #TechStocks #stockmarket
SNDK is back in the spotlight! 🔥
📈 SanDisk jumped around 11% on Monday as AI-driven demand continues to boost the memory & storage sector.
The bigger story? 👀
🔹 Strong AI data-center demand 🔹 Positive long-term growth outlook 🔹 Investor Day brought fresh bullish expectations 🔹 Company targets mid-to-high teens annual revenue growth for FY2028–FY2030 🔹 #nand flash demand remains a major catalyst
After a huge rally, volatility can remain high — so don’t chase blindly. ⚠️
$SNDK is definitely a stock worth watching closely. 👑
What do you think?
🚀 Bullish on SNDK or expecting a pullback?
#SNDK #SanDisk #stocks #AI #Semiconductors #NAND #TechStocks #stockmarket
1
175

Verified
US Stocks
$SNDK
{future}(SNDKUSDT)
SanDisk has skyrocketed nearly 600% in a year, with AI turning NAND into the 'new oil'
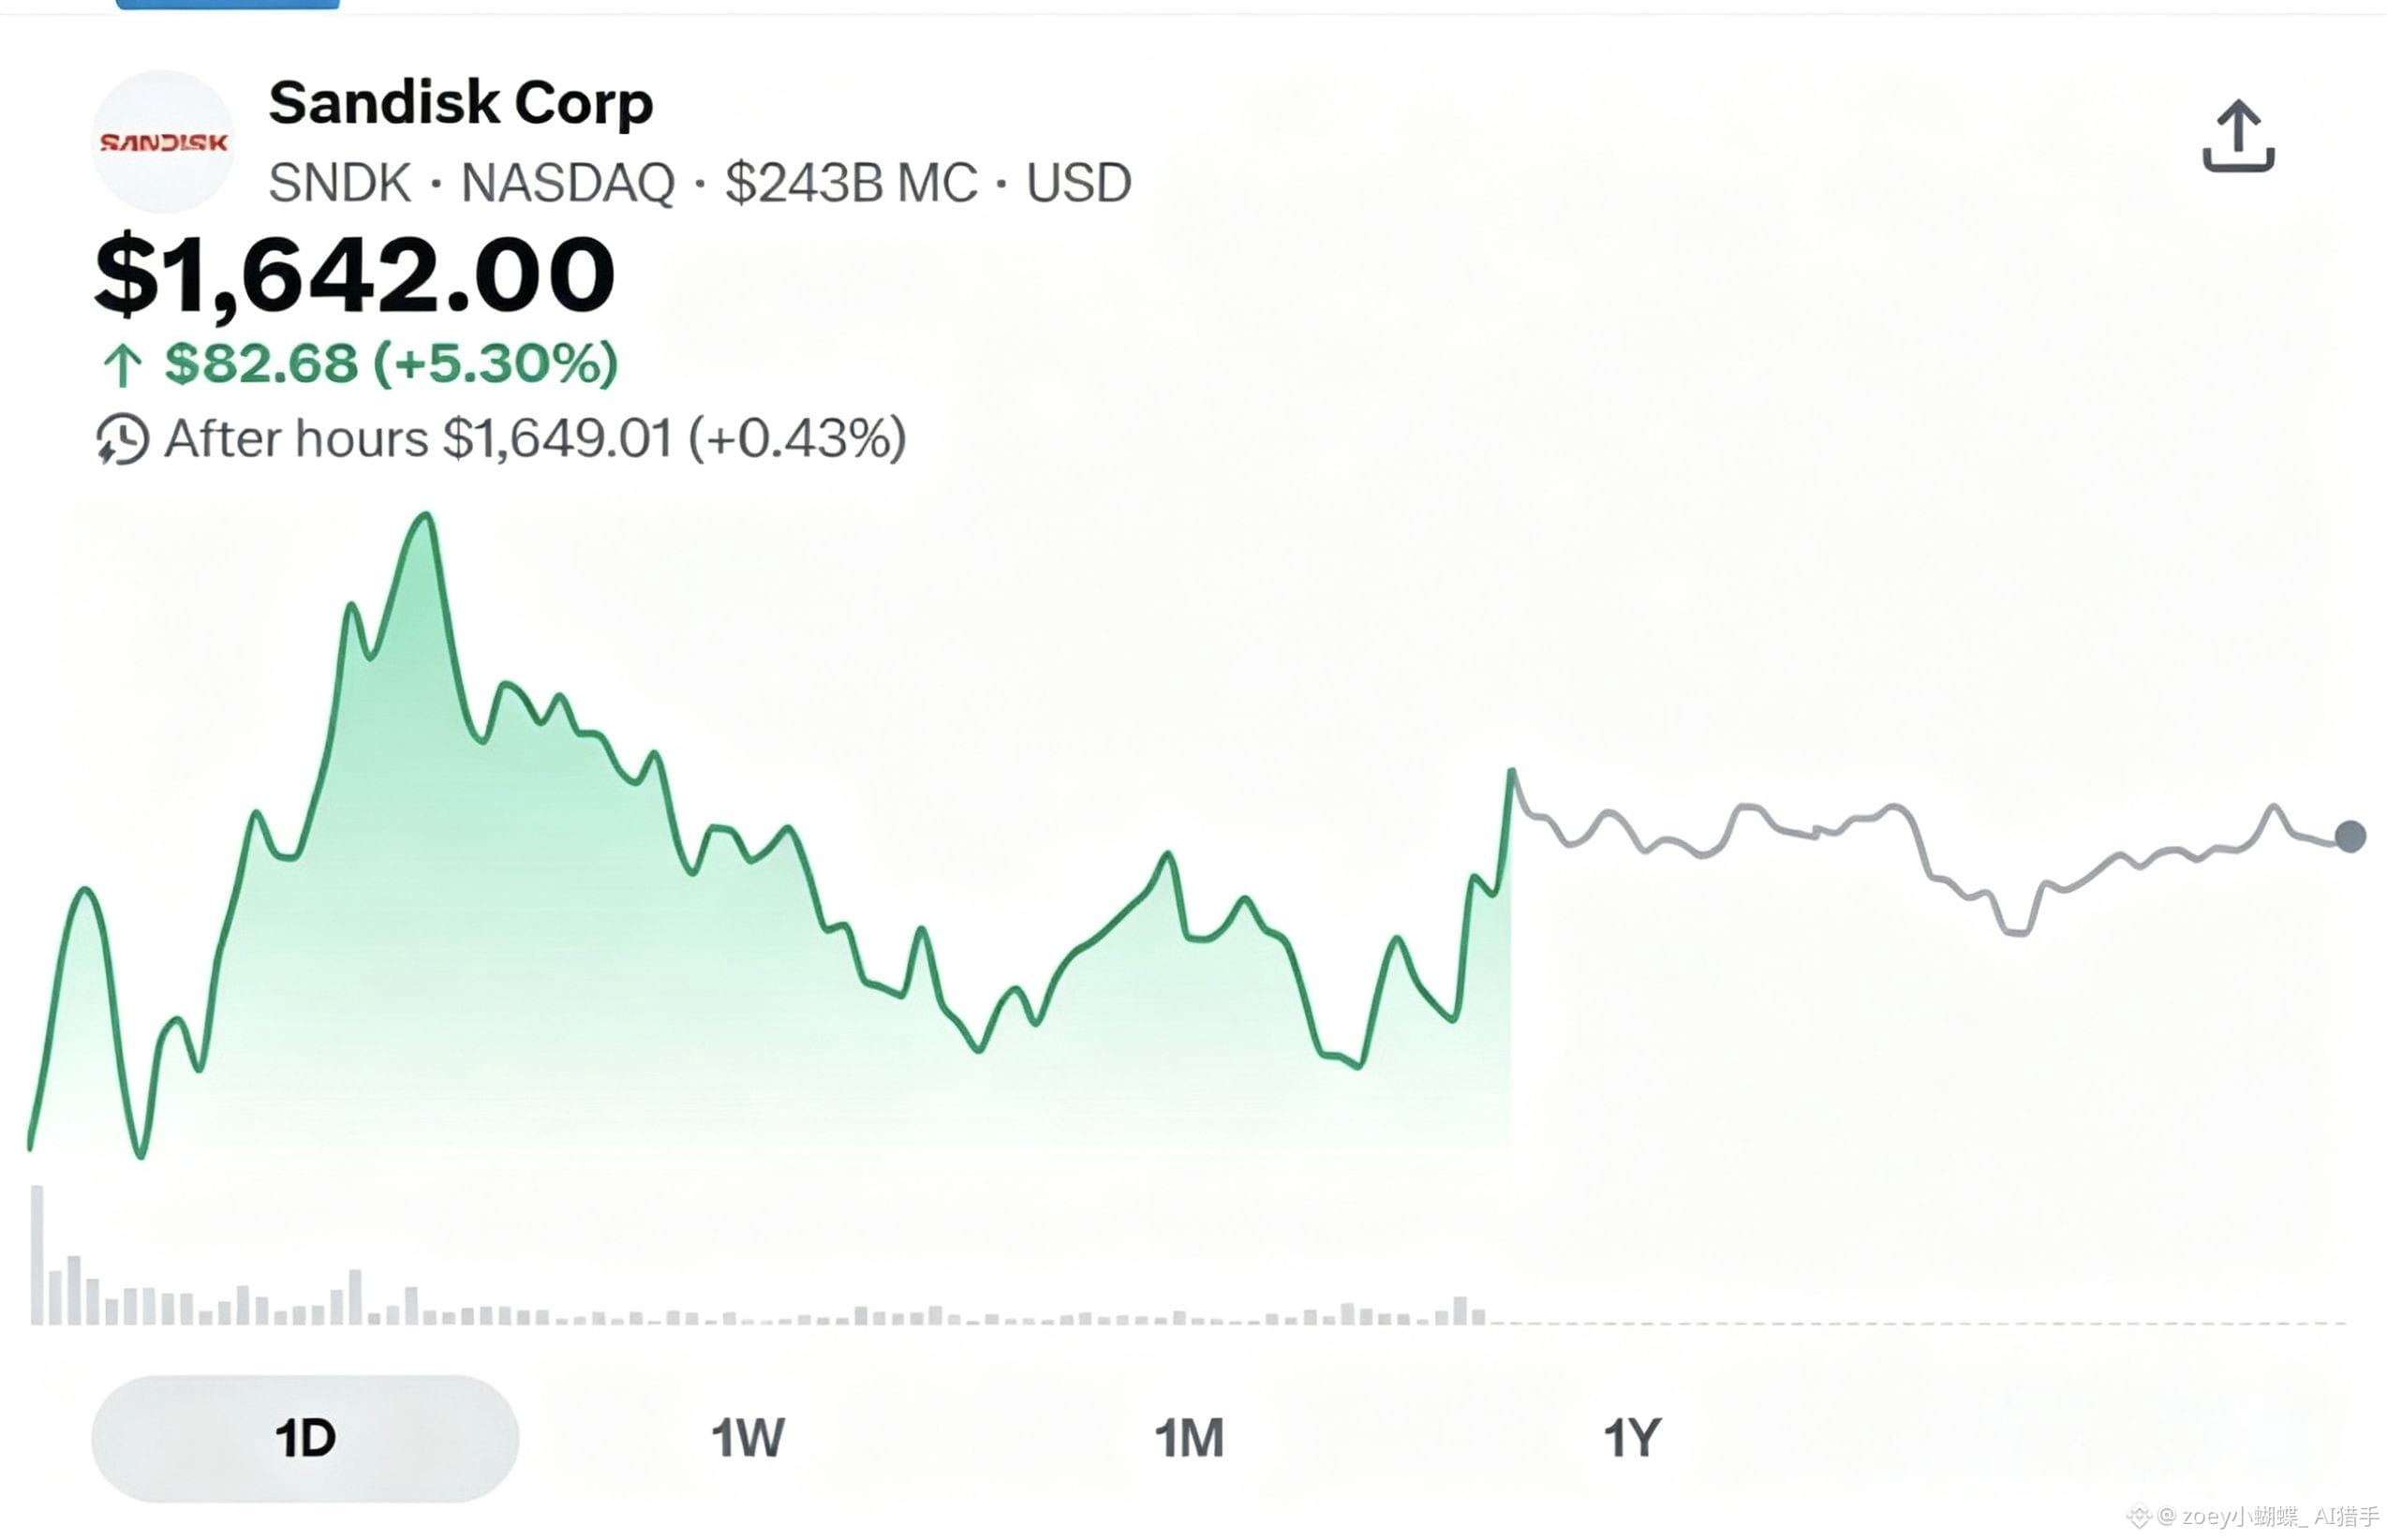
Last Friday, semiconductors took a nosedive, with SanDisk (SNDK) plummeting over 14% at one point. But on Monday, it rebounded 5.3%, closing at $1642, with a year-to-date gain of 591.72%. Mizuho raised its target price from $1825 to $2200, while Bank of America increased its forecast from $1500 to $2100, both maintaining a 'buy' rating.
What’s driving this surge? AI is reshaping the foundational logic of the storage industry.
SanDisk is one of the top five global NAND flash memory suppliers, offering enterprise SSDs, consumer SSDs, memory cards, and more. It spun off from Western Digital and went public in February 2025, focusing exclusively on NAND.
Historically, NAND has been a highly cyclical industry—crashing when supply exceeds demand and skyrocketing when demand outstrips supply. However, three structural changes are breaking this cycle:
First, the explosive growth in AI computational power is directly driving demand for enterprise SSDs. Mizuho predicts that TPU shipments will surge eightfold by 2028 compared to 2026, with Google renting out TPUs to AI companies like Anthropic, leading to a simultaneous spike in storage demand. The CEO has clearly stated, 'Data centers will become the largest market for NAND by 2026.'
Second, supply-side constraints are extreme. SanDisk is resisting the urge to expand production blindly, with new capacity expected to come online gradually until 2028. Goldman Sachs predicts a 4.6% NAND shortage in 2027, with storage prices likely to rise at least until the first half of 2027.
Third, long-term agreements are changing the pricing model. Customers are shifting from quarterly negotiations to multi-year contracts that include prepayments and supply commitments, reducing price volatility.
Performance validation:
In Q3 of FY2026, revenue surged 250% year-on-year, with gross margins soaring from 22.5% to 78.4%. Q4 gross margin guidance is as high as 67%, with expected earnings per share between $12 and $14. The company anticipates nearly 70% growth in data center bit demand by 2026, whereas just two quarters ago, this figure was still over 20%.
SanDisk is no longer a cyclical stock. It is a core component of AI infrastructure. While the market is still discussing GPUs, storage is becoming the next asset to be revalued.
#SNDK #闪迪 #NAND
US Stocks
$SNDK
SanDisk has skyrocketed nearly 600% in a year, with AI turning NAND into the 'new oil'
Last Friday, semiconductors took a nosedive, with SanDisk (SNDK) plummeting over 14% at one point. But on Monday, it rebounded 5.3%, closing at $1642, with a year-to-date gain of 591.72%. Mizuho raised its target price from $1825 to $2200, while Bank of America increased its forecast from $1500 to $2100, both maintaining a 'buy' rating.
What’s driving this surge? AI is reshaping the foundational logic of the storage industry.
SanDisk is one of the top five global NAND flash memory suppliers, offering enterprise SSDs, consumer SSDs, memory cards, and more. It spun off from Western Digital and went public in February 2025, focusing exclusively on NAND.
Historically, NAND has been a highly cyclical industry—crashing when supply exceeds demand and skyrocketing when demand outstrips supply. However, three structural changes are breaking this cycle:
First, the explosive growth in AI computational power is directly driving demand for enterprise SSDs. Mizuho predicts that TPU shipments will surge eightfold by 2028 compared to 2026, with Google renting out TPUs to AI companies like Anthropic, leading to a simultaneous spike in storage demand. The CEO has clearly stated, 'Data centers will become the largest market for NAND by 2026.'
Second, supply-side constraints are extreme. SanDisk is resisting the urge to expand production blindly, with new capacity expected to come online gradually until 2028. Goldman Sachs predicts a 4.6% NAND shortage in 2027, with storage prices likely to rise at least until the first half of 2027.
Third, long-term agreements are changing the pricing model. Customers are shifting from quarterly negotiations to multi-year contracts that include prepayments and supply commitments, reducing price volatility.
Performance validation:
In Q3 of FY2026, revenue surged 250% year-on-year, with gross margins soaring from 22.5% to 78.4%. Q4 gross margin guidance is as high as 67%, with expected earnings per share between $12 and $14. The company anticipates nearly 70% growth in data center bit demand by 2026, whereas just two quarters ago, this figure was still over 20%.
SanDisk is no longer a cyclical stock. It is a core component of AI infrastructure. While the market is still discussing GPUs, storage is becoming the next asset to be revalued.
#SNDK #闪迪 #NAND
$SNDK
SanDisk has skyrocketed nearly 600% in a year, with AI turning NAND into the 'new oil'
Last Friday, semiconductors took a nosedive, with SanDisk (SNDK) plummeting over 14% at one point. But on Monday, it rebounded 5.3%, closing at $1642, with a year-to-date gain of 591.72%. Mizuho raised its target price from $1825 to $2200, while Bank of America increased its forecast from $1500 to $2100, both maintaining a 'buy' rating.
What’s driving this surge? AI is reshaping the foundational logic of the storage industry.
SanDisk is one of the top five global NAND flash memory suppliers, offering enterprise SSDs, consumer SSDs, memory cards, and more. It spun off from Western Digital and went public in February 2025, focusing exclusively on NAND.
Historically, NAND has been a highly cyclical industry—crashing when supply exceeds demand and skyrocketing when demand outstrips supply. However, three structural changes are breaking this cycle:
First, the explosive growth in AI computational power is directly driving demand for enterprise SSDs. Mizuho predicts that TPU shipments will surge eightfold by 2028 compared to 2026, with Google renting out TPUs to AI companies like Anthropic, leading to a simultaneous spike in storage demand. The CEO has clearly stated, 'Data centers will become the largest market for NAND by 2026.'
Second, supply-side constraints are extreme. SanDisk is resisting the urge to expand production blindly, with new capacity expected to come online gradually until 2028. Goldman Sachs predicts a 4.6% NAND shortage in 2027, with storage prices likely to rise at least until the first half of 2027.
Third, long-term agreements are changing the pricing model. Customers are shifting from quarterly negotiations to multi-year contracts that include prepayments and supply commitments, reducing price volatility.
Performance validation:
In Q3 of FY2026, revenue surged 250% year-on-year, with gross margins soaring from 22.5% to 78.4%. Q4 gross margin guidance is as high as 67%, with expected earnings per share between $12 and $14. The company anticipates nearly 70% growth in data center bit demand by 2026, whereas just two quarters ago, this figure was still over 20%.
SanDisk is no longer a cyclical stock. It is a core component of AI infrastructure. While the market is still discussing GPUs, storage is becoming the next asset to be revalued.
#SNDK #闪迪 #NAND
1
1.4k

·
--
The SNDK tokenized stocks have recently faced significant pressure, with a drop of more than 12% over the past 24 hours. The decline is mainly driven by sell pressure from the storage sector in the Korea/Japan market and concerns over Q2 DRAM ASP, leaving prices under continued downside pressure in the near term.
That said, looking from a different angle, Evercore and Goldman Sachs have raised their target prices significantly to $3,100. The rationale is that long-term NAND supply agreements lock in future earnings visibility. This means there is a clear divergence between short-term sentiment on the spot side and the institutions’ medium- to long-term valuation based on fundamentals.
For holders of $SNDK on Backpack, the current price is $1,794.92 and the market cap is only $1.18 million—liquidity is still relatively thin, so volatility will be amplified. Whether you treat the pullback as a window to move toward institutional target prices or continue to follow the weakening storage cycle depends on which you trust more: sentiment or the supply-side narrative.
#代币化股票 #NAND #storage cycle
The SNDK tokenized stocks have recently faced significant pressure, with a drop of more than 12% over the past 24 hours. The decline is mainly driven by sell pressure from the storage sector in the Korea/Japan market and concerns over Q2 DRAM ASP, leaving prices under continued downside pressure in the near term.
That said, looking from a different angle, Evercore and Goldman Sachs have raised their target prices significantly to $3,100. The rationale is that long-term NAND supply agreements lock in future earnings visibility. This means there is a clear divergence between short-term sentiment on the spot side and the institutions’ medium- to long-term valuation based on fundamentals.
For holders of $SNDK on Backpack, the current price is $1,794.92 and the market cap is only $1.18 million—liquidity is still relatively thin, so volatility will be amplified. Whether you treat the pullback as a window to move toward institutional target prices or continue to follow the weakening storage cycle depends on which you trust more: sentiment or the supply-side narrative.
#代币化股票 #NAND #storage cycle
That said, looking from a different angle, Evercore and Goldman Sachs have raised their target prices significantly to $3,100. The rationale is that long-term NAND supply agreements lock in future earnings visibility. This means there is a clear divergence between short-term sentiment on the spot side and the institutions’ medium- to long-term valuation based on fundamentals.
For holders of $SNDK on Backpack, the current price is $1,794.92 and the market cap is only $1.18 million—liquidity is still relatively thin, so volatility will be amplified. Whether you treat the pullback as a window to move toward institutional target prices or continue to follow the weakening storage cycle depends on which you trust more: sentiment or the supply-side narrative.
#代币化股票 #NAND #storage cycle
12
·
--
$KIOXIA GOLDMAN SACHS RAISES TARGET TO 116,000 YEN ON AI STORAGE DEMAND 🚀
Target: 116,000 yen 🚀
NAND supply-demand tightness is exceeding market expectations, with the price uptrend expected to continue through mid-2027. Goldman Sachs raised operating profit forecasts by up to 29% for the next three fiscal years, and ASP growth is now projected at 38% in 2027, up from 27% previously.
Management is prioritizing price discipline over volume, signaling a structural shift in cycle behavior. The upcoming Q1 FY3/27 earnings on July 31 are expected to beat guidance by over 9%.
How long can this AI-driven supply squeeze last before capacity catches up?
Not financial advice. Always manage your risk.
#KIOXIA #NAND #PriceTarget #AIStorage
🎯
$KIOXIA GOLDMAN SACHS RAISES TARGET TO 116,000 YEN ON AI STORAGE DEMAND 🚀
Target: 116,000 yen 🚀
NAND supply-demand tightness is exceeding market expectations, with the price uptrend expected to continue through mid-2027. Goldman Sachs raised operating profit forecasts by up to 29% for the next three fiscal years, and ASP growth is now projected at 38% in 2027, up from 27% previously.
Management is prioritizing price discipline over volume, signaling a structural shift in cycle behavior. The upcoming Q1 FY3/27 earnings on July 31 are expected to beat guidance by over 9%.
How long can this AI-driven supply squeeze last before capacity catches up?
Not financial advice. Always manage your risk.
#KIOXIA #NAND #PriceTarget #AIStorage
🎯
Target: 116,000 yen 🚀
NAND supply-demand tightness is exceeding market expectations, with the price uptrend expected to continue through mid-2027. Goldman Sachs raised operating profit forecasts by up to 29% for the next three fiscal years, and ASP growth is now projected at 38% in 2027, up from 27% previously.
Management is prioritizing price discipline over volume, signaling a structural shift in cycle behavior. The upcoming Q1 FY3/27 earnings on July 31 are expected to beat guidance by over 9%.
How long can this AI-driven supply squeeze last before capacity catches up?
Not financial advice. Always manage your risk.
#KIOXIA #NAND #PriceTarget #AIStorage
🎯
128

$SKHYNIX $14B INSTITUTIONAL CAPEX — RETAIL FADED THE PULLBACK 🦈
While retail unloaded into a minor pullback, institutional capital committed 19.1T KRW (≈$14B) toward SK Hynix’s M17 NAND expansion. 💡 That is not a hedge — that is positioning for the next AI memory supercycle. Semiconductors are only as strong as the memory feeding them. 📊
The brief shakeout looks like liquidity harvesting, not a trend reversal. Smart money stacked infrastructure before the narrative turned mainstream, and the lower timeframe noise is precisely what gets shaken first. 🌊
💬 Do you trust the $14B footprint or are you waiting for confirmation after the retracement? 👇
⚠️ Not financial advice. Always manage your risk. 🛡️
🏷️ #SKHYNIX #NAND #AISupercycle #SmartMoney
🎯 🦈
$SKHYNIX $14B INSTITUTIONAL CAPEX — RETAIL FADED THE PULLBACK 🦈
While retail unloaded into a minor pullback, institutional capital committed 19.1T KRW (≈$14B) toward SK Hynix’s M17 NAND expansion. 💡 That is not a hedge — that is positioning for the next AI memory supercycle. Semiconductors are only as strong as the memory feeding them. 📊
The brief shakeout looks like liquidity harvesting, not a trend reversal. Smart money stacked infrastructure before the narrative turned mainstream, and the lower timeframe noise is precisely what gets shaken first. 🌊
💬 Do you trust the $14B footprint or are you waiting for confirmation after the retracement? 👇
⚠️ Not financial advice. Always manage your risk. 🛡️
🏷️ #SKHYNIX #NAND #AISupercycle #SmartMoney
🎯 🦈
While retail unloaded into a minor pullback, institutional capital committed 19.1T KRW (≈$14B) toward SK Hynix’s M17 NAND expansion. 💡 That is not a hedge — that is positioning for the next AI memory supercycle. Semiconductors are only as strong as the memory feeding them. 📊
The brief shakeout looks like liquidity harvesting, not a trend reversal. Smart money stacked infrastructure before the narrative turned mainstream, and the lower timeframe noise is precisely what gets shaken first. 🌊
💬 Do you trust the $14B footprint or are you waiting for confirmation after the retracement? 👇
⚠️ Not financial advice. Always manage your risk. 🛡️
🏷️ #SKHYNIX #NAND #AISupercycle #SmartMoney
🎯 🦈
56

·
--
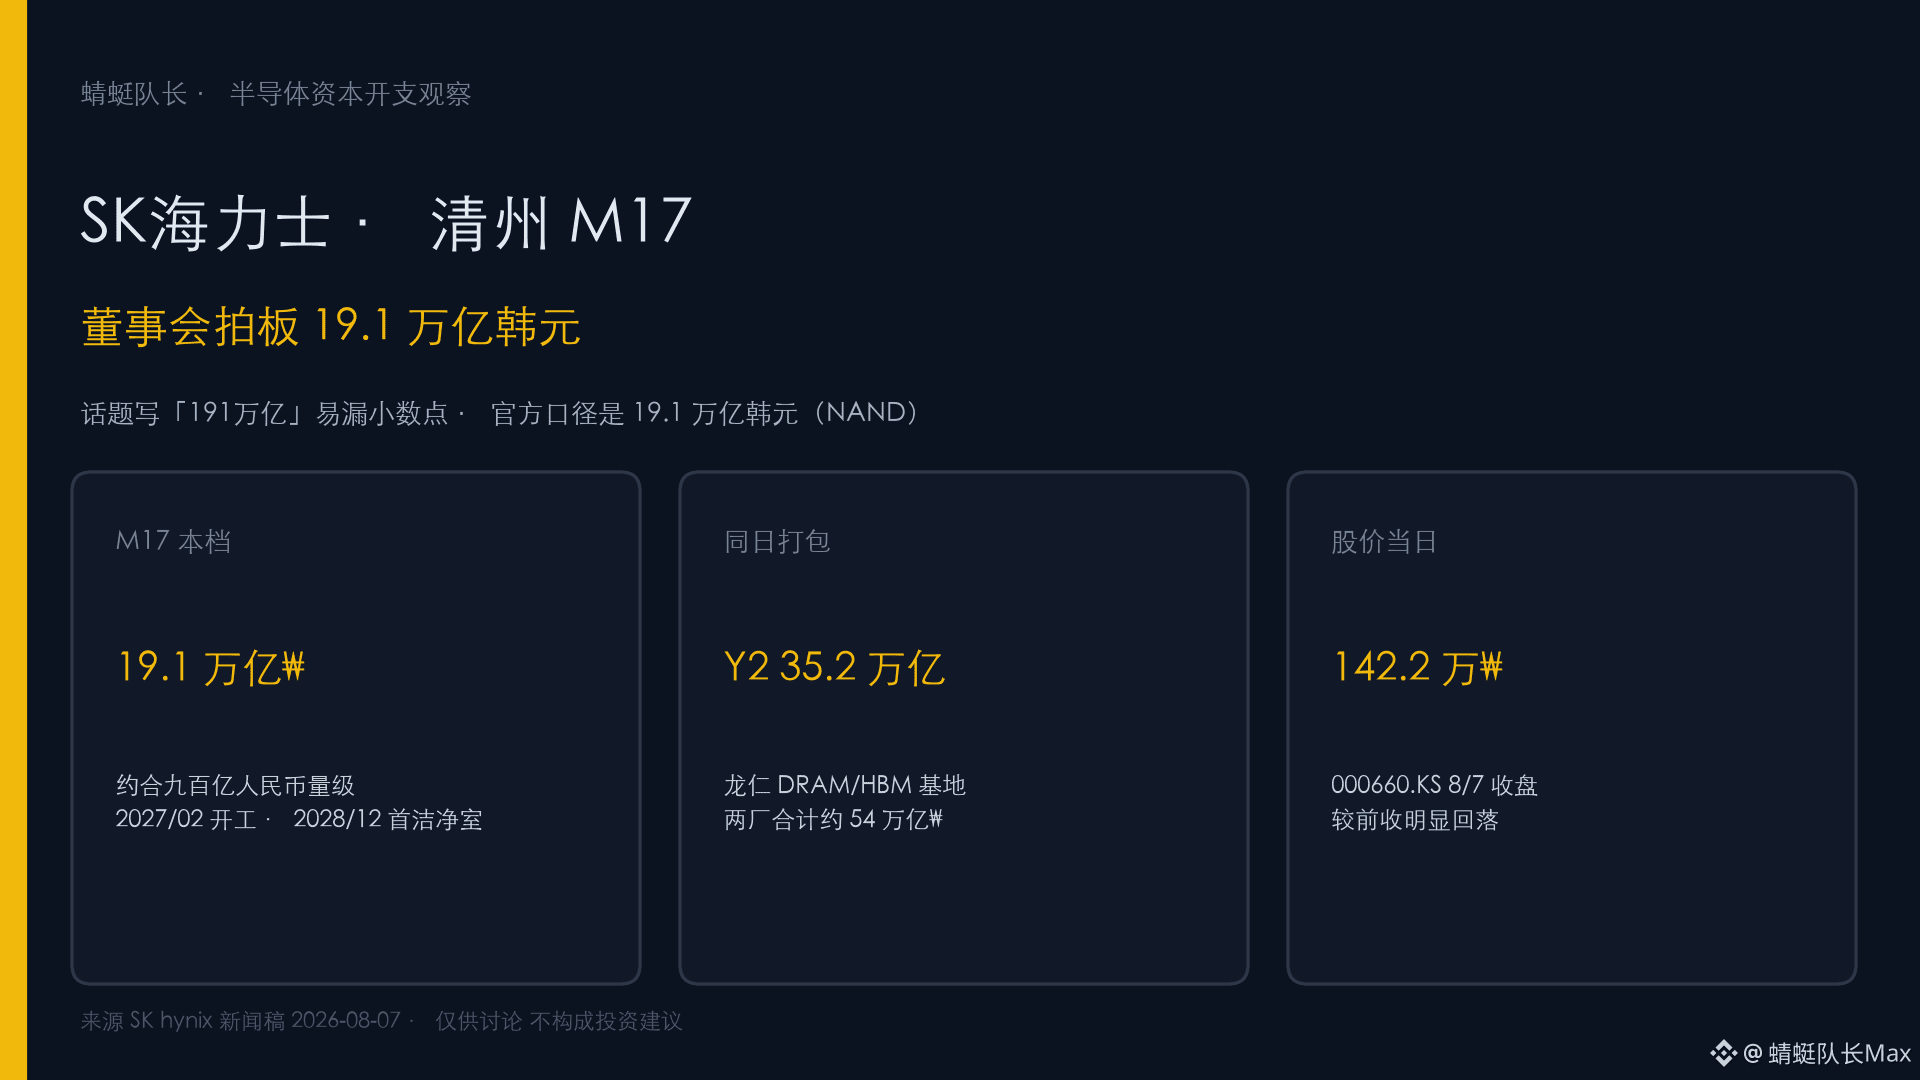
“Square Talk” topic: “₩191 trillion investment into M17.” The company’s board-of-directors statements in the press release say the board approved an investment of ₩19.1 trillion in the Cheongju M17 project. A decimal point difference means a tenfold difference in the amount.
Key figures are shown on the cover and in the picture accompanying the main text.
【What exactly did the board approve today?】
On August 7, 2026, SK hynix announced that its board approved investments in two new plants. Cheongju M17 is about ₩19.1 trillion, and Yongin Y2 is about ₩35.2 trillion; combined, the total is about ₩54 trillion.
M17 is for NAND flash memory and will sit next to the existing Cheongju facilities M11, M12, and M15. Total planned floor area is about 680,000 square meters. Construction is planned to start in February 2027; the first cleanroom is scheduled to be brought online in December 2028. The investment execution period runs until April 2031, with capital deployed in phases according to business progress.
Y2 is the second plant in the Yongin cluster, leaning toward DRAM and next-generation products, including an HBM direction. Construction is planned to start in July 2027, with the first cleanroom scheduled for June 2029. Today’s news is essentially a “two-plant package.” Even if the discussion focuses only on M17, Y2 still needs to be included in the same frame.
【How can this coexist with the earlier “100-trillion-won” plan?】
In the company’s medium- to long-term narrative, the overall plan for the Yongin cluster is about ₩600 trillion, and the expansion of the Cheongju production base is about ₩100 trillion. Earlier, public-facing remarks have also referenced an even larger future figure for Cheongju M17.
This new ₩19.1 trillion is the tranche of capital expenditure that the board has approved and is now being implemented. The envisioned total amount will not be fully spent under this single resolution. The facilities are built according to the main schedule, while cleanroom expansion and equipment installation will follow the pace of customer demand—this is how the company itself emphasizes capital efficiency.
【Why choose Cheongju for NAND?】
The public rationale is straightforward. In Cheongju, power supply, water availability, and existing NAND production lines are already in place, allowing for a faster expansion pace and enabling synergy with older fabs. AI services are driving demand for enterprise SSDs, and the company has also called out storage demand on the inference side—specifically KV cache. The Omdia figures are cited in the press release: the combined DRAM and NAND demand growth rate from last year to 2030 is about 19%. The company frames this wave as a structural change, not merely a cyclical shift. A “super-cycle framework” for a single-quarter outlook is not enough to explain its own narrative.
【How did the stock move the same day?】
In the Korean market, 000660.KS closed at ₩1.422 million on August 7, down from ₩1.495 million the previous day. On the day big-ticket capital expenditures are rolled out, does the market first price in the money being spent or the ownership being issued? In the short run, the two forces can clash. The U.S. ADR’s disclosed ticker code is SKHY, and it does not trade in the same time window as the Korean stock.
【How to read it (observation framework)】
First, separate the three layers of numbers. This board-approved tranche is ₩19.1 trillion (M17). The same-day packaged total is about ₩54 trillion (Y2 + M17). The longer-term overall planning figures for Cheongju/Yongin are on a larger scale.
Then focus on three time stamps. M17 construction starts in February 2027. The first cleanroom is in December 2028. Equipment and capacity ramp-up depend on the customer order schedule; you won’t see a one-time valuation set just from the start-construction announcement.
Reminder: Don’t treat the “₩191 trillion” shown in the topic title as the official amount of this tranche. Doing so would magnify capital expenditure expectations by an order of magnitude.
Which do you care about more: when M17’s NAND supply will truly start coming out, or whether the ₩54 trillion spending will first weigh on valuation?
Not investment advice.
Captain Dragonfly | A finance blogger who likes analyzing data and candlestick charts.
Welcome to follow, like, and save.
$SKHY #SK海力士 #M17 #NAND
“Square Talk” topic: “₩191 trillion investment into M17.” The company’s board-of-directors statements in the press release say the board approved an investment of ₩19.1 trillion in the Cheongju M17 project. A decimal point difference means a tenfold difference in the amount.
Key figures are shown on the cover and in the picture accompanying the main text.
【What exactly did the board approve today?】
On August 7, 2026, SK hynix announced that its board approved investments in two new plants. Cheongju M17 is about ₩19.1 trillion, and Yongin Y2 is about ₩35.2 trillion; combined, the total is about ₩54 trillion.
M17 is for NAND flash memory and will sit next to the existing Cheongju facilities M11, M12, and M15. Total planned floor area is about 680,000 square meters. Construction is planned to start in February 2027; the first cleanroom is scheduled to be brought online in December 2028. The investment execution period runs until April 2031, with capital deployed in phases according to business progress.
Y2 is the second plant in the Yongin cluster, leaning toward DRAM and next-generation products, including an HBM direction. Construction is planned to start in July 2027, with the first cleanroom scheduled for June 2029. Today’s news is essentially a “two-plant package.” Even if the discussion focuses only on M17, Y2 still needs to be included in the same frame.
【How can this coexist with the earlier “100-trillion-won” plan?】
In the company’s medium- to long-term narrative, the overall plan for the Yongin cluster is about ₩600 trillion, and the expansion of the Cheongju production base is about ₩100 trillion. Earlier, public-facing remarks have also referenced an even larger future figure for Cheongju M17.
This new ₩19.1 trillion is the tranche of capital expenditure that the board has approved and is now being implemented. The envisioned total amount will not be fully spent under this single resolution. The facilities are built according to the main schedule, while cleanroom expansion and equipment installation will follow the pace of customer demand—this is how the company itself emphasizes capital efficiency.
【Why choose Cheongju for NAND?】
The public rationale is straightforward. In Cheongju, power supply, water availability, and existing NAND production lines are already in place, allowing for a faster expansion pace and enabling synergy with older fabs. AI services are driving demand for enterprise SSDs, and the company has also called out storage demand on the inference side—specifically KV cache. The Omdia figures are cited in the press release: the combined DRAM and NAND demand growth rate from last year to 2030 is about 19%. The company frames this wave as a structural change, not merely a cyclical shift. A “super-cycle framework” for a single-quarter outlook is not enough to explain its own narrative.
【How did the stock move the same day?】
In the Korean market, 000660.KS closed at ₩1.422 million on August 7, down from ₩1.495 million the previous day. On the day big-ticket capital expenditures are rolled out, does the market first price in the money being spent or the ownership being issued? In the short run, the two forces can clash. The U.S. ADR’s disclosed ticker code is SKHY, and it does not trade in the same time window as the Korean stock.
【How to read it (observation framework)】
First, separate the three layers of numbers. This board-approved tranche is ₩19.1 trillion (M17). The same-day packaged total is about ₩54 trillion (Y2 + M17). The longer-term overall planning figures for Cheongju/Yongin are on a larger scale.
Then focus on three time stamps. M17 construction starts in February 2027. The first cleanroom is in December 2028. Equipment and capacity ramp-up depend on the customer order schedule; you won’t see a one-time valuation set just from the start-construction announcement.
Reminder: Don’t treat the “₩191 trillion” shown in the topic title as the official amount of this tranche. Doing so would magnify capital expenditure expectations by an order of magnitude.
Which do you care about more: when M17’s NAND supply will truly start coming out, or whether the ₩54 trillion spending will first weigh on valuation?
Not investment advice.
Captain Dragonfly | A finance blogger who likes analyzing data and candlestick charts.
Welcome to follow, like, and save.
$SKHY #SK海力士 #M17 #NAND
Key figures are shown on the cover and in the picture accompanying the main text.
【What exactly did the board approve today?】
On August 7, 2026, SK hynix announced that its board approved investments in two new plants. Cheongju M17 is about ₩19.1 trillion, and Yongin Y2 is about ₩35.2 trillion; combined, the total is about ₩54 trillion.
M17 is for NAND flash memory and will sit next to the existing Cheongju facilities M11, M12, and M15. Total planned floor area is about 680,000 square meters. Construction is planned to start in February 2027; the first cleanroom is scheduled to be brought online in December 2028. The investment execution period runs until April 2031, with capital deployed in phases according to business progress.
Y2 is the second plant in the Yongin cluster, leaning toward DRAM and next-generation products, including an HBM direction. Construction is planned to start in July 2027, with the first cleanroom scheduled for June 2029. Today’s news is essentially a “two-plant package.” Even if the discussion focuses only on M17, Y2 still needs to be included in the same frame.
【How can this coexist with the earlier “100-trillion-won” plan?】
In the company’s medium- to long-term narrative, the overall plan for the Yongin cluster is about ₩600 trillion, and the expansion of the Cheongju production base is about ₩100 trillion. Earlier, public-facing remarks have also referenced an even larger future figure for Cheongju M17.
This new ₩19.1 trillion is the tranche of capital expenditure that the board has approved and is now being implemented. The envisioned total amount will not be fully spent under this single resolution. The facilities are built according to the main schedule, while cleanroom expansion and equipment installation will follow the pace of customer demand—this is how the company itself emphasizes capital efficiency.
【Why choose Cheongju for NAND?】
The public rationale is straightforward. In Cheongju, power supply, water availability, and existing NAND production lines are already in place, allowing for a faster expansion pace and enabling synergy with older fabs. AI services are driving demand for enterprise SSDs, and the company has also called out storage demand on the inference side—specifically KV cache. The Omdia figures are cited in the press release: the combined DRAM and NAND demand growth rate from last year to 2030 is about 19%. The company frames this wave as a structural change, not merely a cyclical shift. A “super-cycle framework” for a single-quarter outlook is not enough to explain its own narrative.
【How did the stock move the same day?】
In the Korean market, 000660.KS closed at ₩1.422 million on August 7, down from ₩1.495 million the previous day. On the day big-ticket capital expenditures are rolled out, does the market first price in the money being spent or the ownership being issued? In the short run, the two forces can clash. The U.S. ADR’s disclosed ticker code is SKHY, and it does not trade in the same time window as the Korean stock.
【How to read it (observation framework)】
First, separate the three layers of numbers. This board-approved tranche is ₩19.1 trillion (M17). The same-day packaged total is about ₩54 trillion (Y2 + M17). The longer-term overall planning figures for Cheongju/Yongin are on a larger scale.
Then focus on three time stamps. M17 construction starts in February 2027. The first cleanroom is in December 2028. Equipment and capacity ramp-up depend on the customer order schedule; you won’t see a one-time valuation set just from the start-construction announcement.
Reminder: Don’t treat the “₩191 trillion” shown in the topic title as the official amount of this tranche. Doing so would magnify capital expenditure expectations by an order of magnitude.
Which do you care about more: when M17’s NAND supply will truly start coming out, or whether the ₩54 trillion spending will first weigh on valuation?
Not investment advice.
Captain Dragonfly | A finance blogger who likes analyzing data and candlestick charts.
Welcome to follow, like, and save.
$SKHY #SK海力士 #M17 #NAND
148

·
--
🚨 $NAND BEARISH RUMORS DEBUNKED — FUNDAMENTALS REMAIN SOLID 💥
The analyst addresses the negative noise around NAND with precision. SanDisk's LTA with Meta at a discount is a strategic move to secure volume, not a sign of weakness. Chinese CSPs have direct access to Yangtze Memory, so the "rejected eSSD" narrative is misplaced. 📊
Meanwhile, new cloud providers are absorbing QLC inventory, and Jukan reaffirms a bullish long-term view on storage. DRAM still has ~40% upside through 2027, with HBM supply tight. Negative headlines get exaggerated when sentiment is fragile, but the structural demand story hasn't changed. 💡
💬 Are you trusting the fundamentals here or waiting for one more liquidity flush lower before positioning? 👇
⚠️ Not financial advice. Always manage your risk. 🛡️
🏷️ #NAND #Storage #Bullish #Semiconductors #Crypto
🔥 💎
🚨 $NAND BEARISH RUMORS DEBUNKED — FUNDAMENTALS REMAIN SOLID 💥
The analyst addresses the negative noise around NAND with precision. SanDisk's LTA with Meta at a discount is a strategic move to secure volume, not a sign of weakness. Chinese CSPs have direct access to Yangtze Memory, so the "rejected eSSD" narrative is misplaced. 📊
Meanwhile, new cloud providers are absorbing QLC inventory, and Jukan reaffirms a bullish long-term view on storage. DRAM still has ~40% upside through 2027, with HBM supply tight. Negative headlines get exaggerated when sentiment is fragile, but the structural demand story hasn't changed. 💡
💬 Are you trusting the fundamentals here or waiting for one more liquidity flush lower before positioning? 👇
⚠️ Not financial advice. Always manage your risk. 🛡️
🏷️ #NAND #Storage #Bullish #Semiconductors #Crypto
🔥 💎
The analyst addresses the negative noise around NAND with precision. SanDisk's LTA with Meta at a discount is a strategic move to secure volume, not a sign of weakness. Chinese CSPs have direct access to Yangtze Memory, so the "rejected eSSD" narrative is misplaced. 📊
Meanwhile, new cloud providers are absorbing QLC inventory, and Jukan reaffirms a bullish long-term view on storage. DRAM still has ~40% upside through 2027, with HBM supply tight. Negative headlines get exaggerated when sentiment is fragile, but the structural demand story hasn't changed. 💡
💬 Are you trusting the fundamentals here or waiting for one more liquidity flush lower before positioning? 👇
⚠️ Not financial advice. Always manage your risk. 🛡️
🏷️ #NAND #Storage #Bullish #Semiconductors #Crypto
🔥 💎
145

·
--
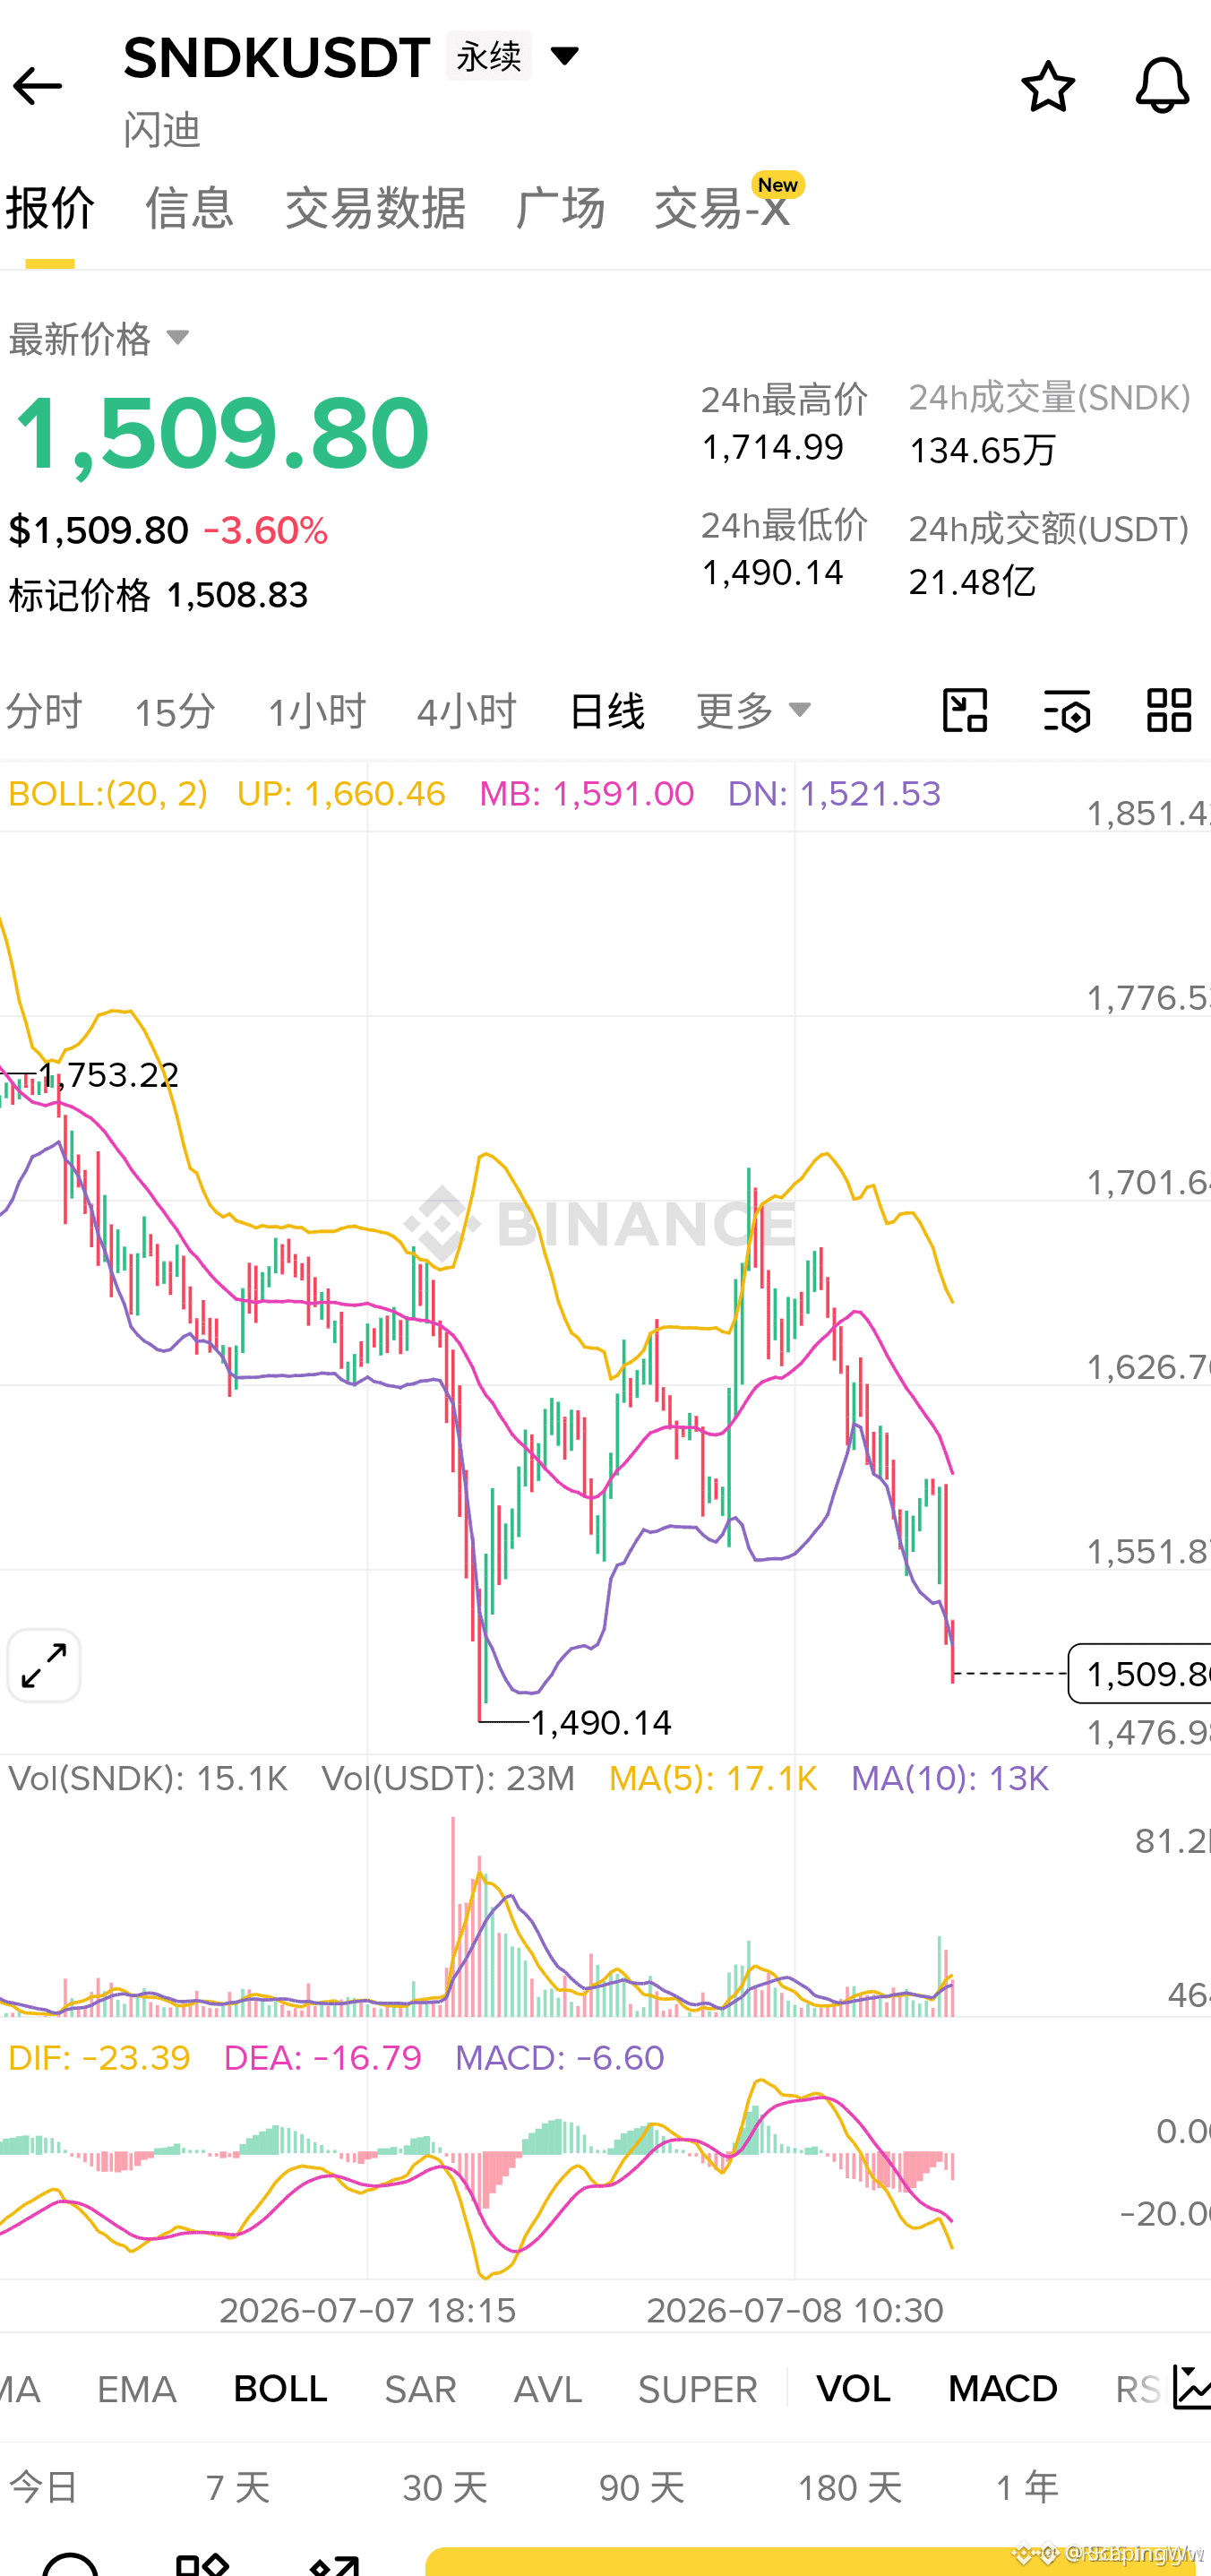
$SNDK SUPPLY GLUT LOOMS - INSTITUTIONS ARE LOADING PUTS 🔥
SK Hynix is dropping 321-layer QLC NAND this year, while Chinese fabs YMTC and ChangXin keep ramping capacity. That's a recipe for oversupply. Meanwhile, Micron can barely hold its ground — $SNDK doesn't have the same breathing room.
The Citi $2500 target feels like a narrative to lure retail while smart money quietly accumulates downside protection. The bid just isn't strong enough to absorb what's coming. Are you still holding or already hedging?
Not financial advice. Always manage your risk.
#SNDK #BearishSetup #SupplyGlut #NAND
🔥
$SNDK SUPPLY GLUT LOOMS - INSTITUTIONS ARE LOADING PUTS 🔥
SK Hynix is dropping 321-layer QLC NAND this year, while Chinese fabs YMTC and ChangXin keep ramping capacity. That's a recipe for oversupply. Meanwhile, Micron can barely hold its ground — $SNDK doesn't have the same breathing room.
The Citi $2500 target feels like a narrative to lure retail while smart money quietly accumulates downside protection. The bid just isn't strong enough to absorb what's coming. Are you still holding or already hedging?
Not financial advice. Always manage your risk.
#SNDK #BearishSetup #SupplyGlut #NAND
🔥
SK Hynix is dropping 321-layer QLC NAND this year, while Chinese fabs YMTC and ChangXin keep ramping capacity. That's a recipe for oversupply. Meanwhile, Micron can barely hold its ground — $SNDK doesn't have the same breathing room.
The Citi $2500 target feels like a narrative to lure retail while smart money quietly accumulates downside protection. The bid just isn't strong enough to absorb what's coming. Are you still holding or already hedging?
Not financial advice. Always manage your risk.
#SNDK #BearishSetup #SupplyGlut #NAND
🔥
240
·
--
💾 SanDisk (SNDK) down -5.1% on surging volume (1.68x). When a memory stock sells off on heavy volume while its peers bounce, something specific is going on.
📊 Technical Snapshot:
• Price: $1,214.83 | Change: -5.09%
• RSI: 40.8 (leaning bearish)
• Trend: Downtrend confirmed
• Volume: 21.1M shares (1.68x average — surging)
• Price below ALL moving averages (SMA5: $1,177, SMA20: $1,509, SMA50: $1,709)
💡 Why This Divergence:
SNDK is down -48% from its 3-month high ($2,335). That's a brutal drawdown. While SK Hynix bounced +30%, SNDK continues to bleed. This suggests the market is differentiating between HBM leaders (Hynix) and traditional NAND players (SanDisk).
📋 Key Levels:
• Support: $1,177 (SMA5 — current battle zone)
• Resistance: $2,050 (structural overhead)
• 3-Month Low: $1,016 (only 19% below — danger zone)
• 3-Month High: $2,335 (-48% from here)
🎯 The bearish trend is intact. Volume surging on a down day = institutional selling. I'd need to see $1,280 (previous close) reclaimed before considering any long setup.
🤔 SNDK down 5% while SK Hynix is up 30%. Is the market telling us NAND is dead and HBM is the future?
A) Contrarian buy — SNDK is oversold at -48%
B) Avoid — the NAND vs HBM divergence is real
C) Short it — the downtrend is your friend
#SanDisk #SNDK #Memory #NAND
⚠️ Disclaimer: This is not financial advice. Always do your own research. Stock markets carry risk. Never invest more than you can afford to lose.
💾 SanDisk (SNDK) down -5.1% on surging volume (1.68x). When a memory stock sells off on heavy volume while its peers bounce, something specific is going on.
📊 Technical Snapshot:
• Price: $1,214.83 | Change: -5.09%
• RSI: 40.8 (leaning bearish)
• Trend: Downtrend confirmed
• Volume: 21.1M shares (1.68x average — surging)
• Price below ALL moving averages (SMA5: $1,177, SMA20: $1,509, SMA50: $1,709)
💡 Why This Divergence:
SNDK is down -48% from its 3-month high ($2,335). That's a brutal drawdown. While SK Hynix bounced +30%, SNDK continues to bleed. This suggests the market is differentiating between HBM leaders (Hynix) and traditional NAND players (SanDisk).
📋 Key Levels:
• Support: $1,177 (SMA5 — current battle zone)
• Resistance: $2,050 (structural overhead)
• 3-Month Low: $1,016 (only 19% below — danger zone)
• 3-Month High: $2,335 (-48% from here)
🎯 The bearish trend is intact. Volume surging on a down day = institutional selling. I'd need to see $1,280 (previous close) reclaimed before considering any long setup.
🤔 SNDK down 5% while SK Hynix is up 30%. Is the market telling us NAND is dead and HBM is the future?
A) Contrarian buy — SNDK is oversold at -48%
B) Avoid — the NAND vs HBM divergence is real
C) Short it — the downtrend is your friend
#SanDisk #SNDK #Memory #NAND
⚠️ Disclaimer: This is not financial advice. Always do your own research. Stock markets carry risk. Never invest more than you can afford to lose.
📊 Technical Snapshot:
• Price: $1,214.83 | Change: -5.09%
• RSI: 40.8 (leaning bearish)
• Trend: Downtrend confirmed
• Volume: 21.1M shares (1.68x average — surging)
• Price below ALL moving averages (SMA5: $1,177, SMA20: $1,509, SMA50: $1,709)
💡 Why This Divergence:
SNDK is down -48% from its 3-month high ($2,335). That's a brutal drawdown. While SK Hynix bounced +30%, SNDK continues to bleed. This suggests the market is differentiating between HBM leaders (Hynix) and traditional NAND players (SanDisk).
📋 Key Levels:
• Support: $1,177 (SMA5 — current battle zone)
• Resistance: $2,050 (structural overhead)
• 3-Month Low: $1,016 (only 19% below — danger zone)
• 3-Month High: $2,335 (-48% from here)
🎯 The bearish trend is intact. Volume surging on a down day = institutional selling. I'd need to see $1,280 (previous close) reclaimed before considering any long setup.
🤔 SNDK down 5% while SK Hynix is up 30%. Is the market telling us NAND is dead and HBM is the future?
A) Contrarian buy — SNDK is oversold at -48%
B) Avoid — the NAND vs HBM divergence is real
C) Short it — the downtrend is your friend
#SanDisk #SNDK #Memory #NAND
⚠️ Disclaimer: This is not financial advice. Always do your own research. Stock markets carry risk. Never invest more than you can afford to lose.
19

·
--
Bullish
Verified
#sandiskextendsgainsto11%
🚨 SNDK SURGES 14% — NAND STORY IS CHANGING! 📈
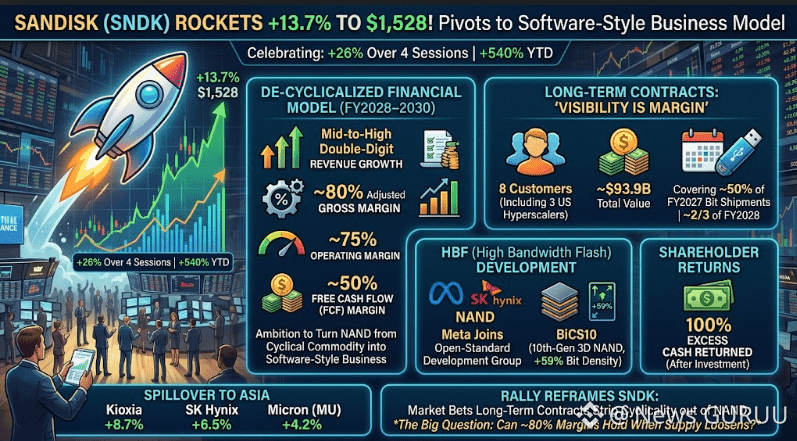
SanDisk ($SNDK) jumped 13.7% to $1,528 after unveiling an ambitious long-term model targeting strong revenue growth, ~80% adjusted gross margins and major FCF generation.
🤝 $93.9B in long-term contracts with 8 customers, including 3 U.S. hyperscalers, could give NAND earnings far more visibility. HBF development with Meta and SK Hynix adds another growth catalyst.
🎯 TRADING VIEW: BUY 📈
Momentum remains strongly bullish, but the key test is whether SanDisk can sustain those margins when NAND supply eventually loosens.
❓ Can SNDK maintain this momentum? "CLICK ON THE BELOW YELLOW COIN TAG TO GO TO DESIRED TRADING PAGE TO GET BENEFIT TRADE"$INTC $MU $SNDK
{future}(SNDKUSDT)
{future}(MUUSDT)
{future}(INTCUSDT)
#SNDK #nand
#sandiskextendsgainsto11%
🚨 SNDK SURGES 14% — NAND STORY IS CHANGING! 📈
SanDisk ($SNDK ) jumped 13.7% to $1,528 after unveiling an ambitious long-term model targeting strong revenue growth, ~80% adjusted gross margins and major FCF generation.
🤝 $93.9B in long-term contracts with 8 customers, including 3 U.S. hyperscalers, could give NAND earnings far more visibility. HBF development with Meta and SK Hynix adds another growth catalyst.
🎯 TRADING VIEW: BUY 📈
Momentum remains strongly bullish, but the key test is whether SanDisk can sustain those margins when NAND supply eventually loosens.
❓ Can SNDK maintain this momentum? "CLICK ON THE BELOW YELLOW COIN TAG TO GO TO DESIRED TRADING PAGE TO GET BENEFIT TRADE"$INTC $MU $SNDK
#SNDK #nand
🚨 SNDK SURGES 14% — NAND STORY IS CHANGING! 📈
SanDisk ($SNDK ) jumped 13.7% to $1,528 after unveiling an ambitious long-term model targeting strong revenue growth, ~80% adjusted gross margins and major FCF generation.
🤝 $93.9B in long-term contracts with 8 customers, including 3 U.S. hyperscalers, could give NAND earnings far more visibility. HBF development with Meta and SK Hynix adds another growth catalyst.
🎯 TRADING VIEW: BUY 📈
Momentum remains strongly bullish, but the key test is whether SanDisk can sustain those margins when NAND supply eventually loosens.
❓ Can SNDK maintain this momentum? "CLICK ON THE BELOW YELLOW COIN TAG TO GO TO DESIRED TRADING PAGE TO GET BENEFIT TRADE"$INTC $MU $SNDK
#SNDK #nand
1
1.9k

·
--
🔥 SNDK (SanDisk/Western Digital) storage chip sector keeps heating up!
With NAND Flash prices stabilizing and rebounding, and data center demand driving growth, the storage sector is entering a new round of a favorable business cycle. Under Western Digital’s dual-track layout of HDD + SSD, AI server storage demand has become a new growth engine.
Storage chips are the invisible beneficiaries of AI infrastructure—when computing power surges, data storage demand surges too.
What do you think about SNDK’s outlook going forward?👇
#SNDK #存储芯片 #NAND #AIinfrastructure
🔥 SNDK (SanDisk/Western Digital) storage chip sector keeps heating up!
With NAND Flash prices stabilizing and rebounding, and data center demand driving growth, the storage sector is entering a new round of a favorable business cycle. Under Western Digital’s dual-track layout of HDD + SSD, AI server storage demand has become a new growth engine.
Storage chips are the invisible beneficiaries of AI infrastructure—when computing power surges, data storage demand surges too.
What do you think about SNDK’s outlook going forward?👇
#SNDK #存储芯片 #NAND #AIinfrastructure
With NAND Flash prices stabilizing and rebounding, and data center demand driving growth, the storage sector is entering a new round of a favorable business cycle. Under Western Digital’s dual-track layout of HDD + SSD, AI server storage demand has become a new growth engine.
Storage chips are the invisible beneficiaries of AI infrastructure—when computing power surges, data storage demand surges too.
What do you think about SNDK’s outlook going forward?👇
#SNDK #存储芯片 #NAND #AIinfrastructure
356
·
--
💽 SanDisk down -3.68% today and 48.1% below its 3-month high. NAND flash is in a brutal correction — but every cycle has a bottom.
$1,212 with RSI at 41.6, leaning bearish. Price is below SMA5, SMA20, and SMA50. MACD negative with expanding histogram — sellers are still in control. Volume is slightly elevated (1.15x), suggesting active selling rather than passive drift.
📊 Key Logic:
The NAND cycle is notoriously cyclical — massive swings followed by sharp recoveries. With AI driving storage demand (training datasets, inference logs), the demand side is structural. The question is timing: when does supply rationalization kick in?
📍 Key Levels:
• Support: $1,016 (3-month low)
• Resistance: $1,280 (SMA5) / $2,050 (SMA50)
• Watch: Volume spike at lows could signal capitulation bottom
This is a patience trade. Set alerts at support, don't front-run the reversal.
💬 NAND cycle bottom: Q3 or Q4? Cast your vote 👇
#SNDK #NAND #DYOR
⚠️ Disclaimer: This is not financial advice. Always do your own research (DYOR) before making any investment decisions. Past performance does not guarantee future results. Trade responsibly.
💽 SanDisk down -3.68% today and 48.1% below its 3-month high. NAND flash is in a brutal correction — but every cycle has a bottom.
$1,212 with RSI at 41.6, leaning bearish. Price is below SMA5, SMA20, and SMA50. MACD negative with expanding histogram — sellers are still in control. Volume is slightly elevated (1.15x), suggesting active selling rather than passive drift.
📊 Key Logic:
The NAND cycle is notoriously cyclical — massive swings followed by sharp recoveries. With AI driving storage demand (training datasets, inference logs), the demand side is structural. The question is timing: when does supply rationalization kick in?
📍 Key Levels:
• Support: $1,016 (3-month low)
• Resistance: $1,280 (SMA5) / $2,050 (SMA50)
• Watch: Volume spike at lows could signal capitulation bottom
This is a patience trade. Set alerts at support, don't front-run the reversal.
💬 NAND cycle bottom: Q3 or Q4? Cast your vote 👇
#SNDK #NAND #DYOR
⚠️ Disclaimer: This is not financial advice. Always do your own research (DYOR) before making any investment decisions. Past performance does not guarantee future results. Trade responsibly.
$1,212 with RSI at 41.6, leaning bearish. Price is below SMA5, SMA20, and SMA50. MACD negative with expanding histogram — sellers are still in control. Volume is slightly elevated (1.15x), suggesting active selling rather than passive drift.
📊 Key Logic:
The NAND cycle is notoriously cyclical — massive swings followed by sharp recoveries. With AI driving storage demand (training datasets, inference logs), the demand side is structural. The question is timing: when does supply rationalization kick in?
📍 Key Levels:
• Support: $1,016 (3-month low)
• Resistance: $1,280 (SMA5) / $2,050 (SMA50)
• Watch: Volume spike at lows could signal capitulation bottom
This is a patience trade. Set alerts at support, don't front-run the reversal.
💬 NAND cycle bottom: Q3 or Q4? Cast your vote 👇
#SNDK #NAND #DYOR
⚠️ Disclaimer: This is not financial advice. Always do your own research (DYOR) before making any investment decisions. Past performance does not guarantee future results. Trade responsibly.
97

$BTC WATCH: YMTC NAND SUPPLY SHOCK COULD FLIP HARDWARE COSTS ⚡
YMTC’s Fab3 is moving from buildout to launch mode, and that changes the memory supply map. 📊 With 100k 12-inch wafers per month at full capacity, plus a 14% NAND share already, this is a future liquidity tap that could pressure hardware costs. ⚡
💡 For $BTC traders, the read-through is indirect but real: cheaper memory supports compute expansion, while Samsung/SK Hynix competition may squeeze margins across the tech stack. Are you trading this as a hardware cost tailwind or a sector margin warning? 👇
⚠️ Not financial advice. Always manage your risk. 🛡️
🏷️ #BTC #NAND #SupplyShock #Crypto #Hardware
🎯 🦈
$BTC WATCH: YMTC NAND SUPPLY SHOCK COULD FLIP HARDWARE COSTS ⚡
YMTC’s Fab3 is moving from buildout to launch mode, and that changes the memory supply map. 📊 With 100k 12-inch wafers per month at full capacity, plus a 14% NAND share already, this is a future liquidity tap that could pressure hardware costs. ⚡
💡 For $BTC traders, the read-through is indirect but real: cheaper memory supports compute expansion, while Samsung/SK Hynix competition may squeeze margins across the tech stack. Are you trading this as a hardware cost tailwind or a sector margin warning? 👇
⚠️ Not financial advice. Always manage your risk. 🛡️
🏷️ #BTC #NAND #SupplyShock #Crypto #Hardware
🎯 🦈
YMTC’s Fab3 is moving from buildout to launch mode, and that changes the memory supply map. 📊 With 100k 12-inch wafers per month at full capacity, plus a 14% NAND share already, this is a future liquidity tap that could pressure hardware costs. ⚡
💡 For $BTC traders, the read-through is indirect but real: cheaper memory supports compute expansion, while Samsung/SK Hynix competition may squeeze margins across the tech stack. Are you trading this as a hardware cost tailwind or a sector margin warning? 👇
⚠️ Not financial advice. Always manage your risk. 🛡️
🏷️ #BTC #NAND #SupplyShock #Crypto #Hardware
🎯 🦈
23
Log in to explore more content
Join global crypto users on Binance Square
⚡️ Get latest and useful information about crypto.
💬 Trusted by the world’s largest crypto exchange.
👍 Discover real insights from verified creators.
Email / Phone number
Trending Topics
1
#HYPEJumpsOver11%
5,358 views
279 Discussing
2
#ZcashDevelopersTargetNU7MainnetActivationNov5
0 views
2 Discussing
3
#BitcoinSpotETFsNetInflow$159M
1,707 views
73 Discussing
4
#HKMAPlansWholesaleCBDCByYearEnd
14,227 views
475 Discussing
5
#NEARSurges26%Past$3.45
11,757 views
118 Discussing
6
#BOJHikesRatesTo31YearHigh
31,955 views
754 Discussing
7
#EvernorthRaises$30MToBuyXRP
862 views
30 Discussing
8
#ChainlinkPowersBottomlinePaymentPlatform
31,924 views
719 Discussing
9
#DtcpayCompletes$25MSeriesA
959 views
27 Discussing
10
#InjectiveLaunchesINJOnSolana
8,499 views
211 Discussing