
蜻蜓队长Max
149 Posts

蜻蜓队长Max
Report
Block User
蜻蜓队长 · 扫描笔记| 股市 · Web3 · AI
一个喜欢分析数据与k线的财经博主。
欢迎关注,随时更新加密货币最新动态。
数据分享与k线分析仅供参考,不造成任何投资建议。
13 Following
14 Followers
23 Liked
Posts
All
Quotes
·
--
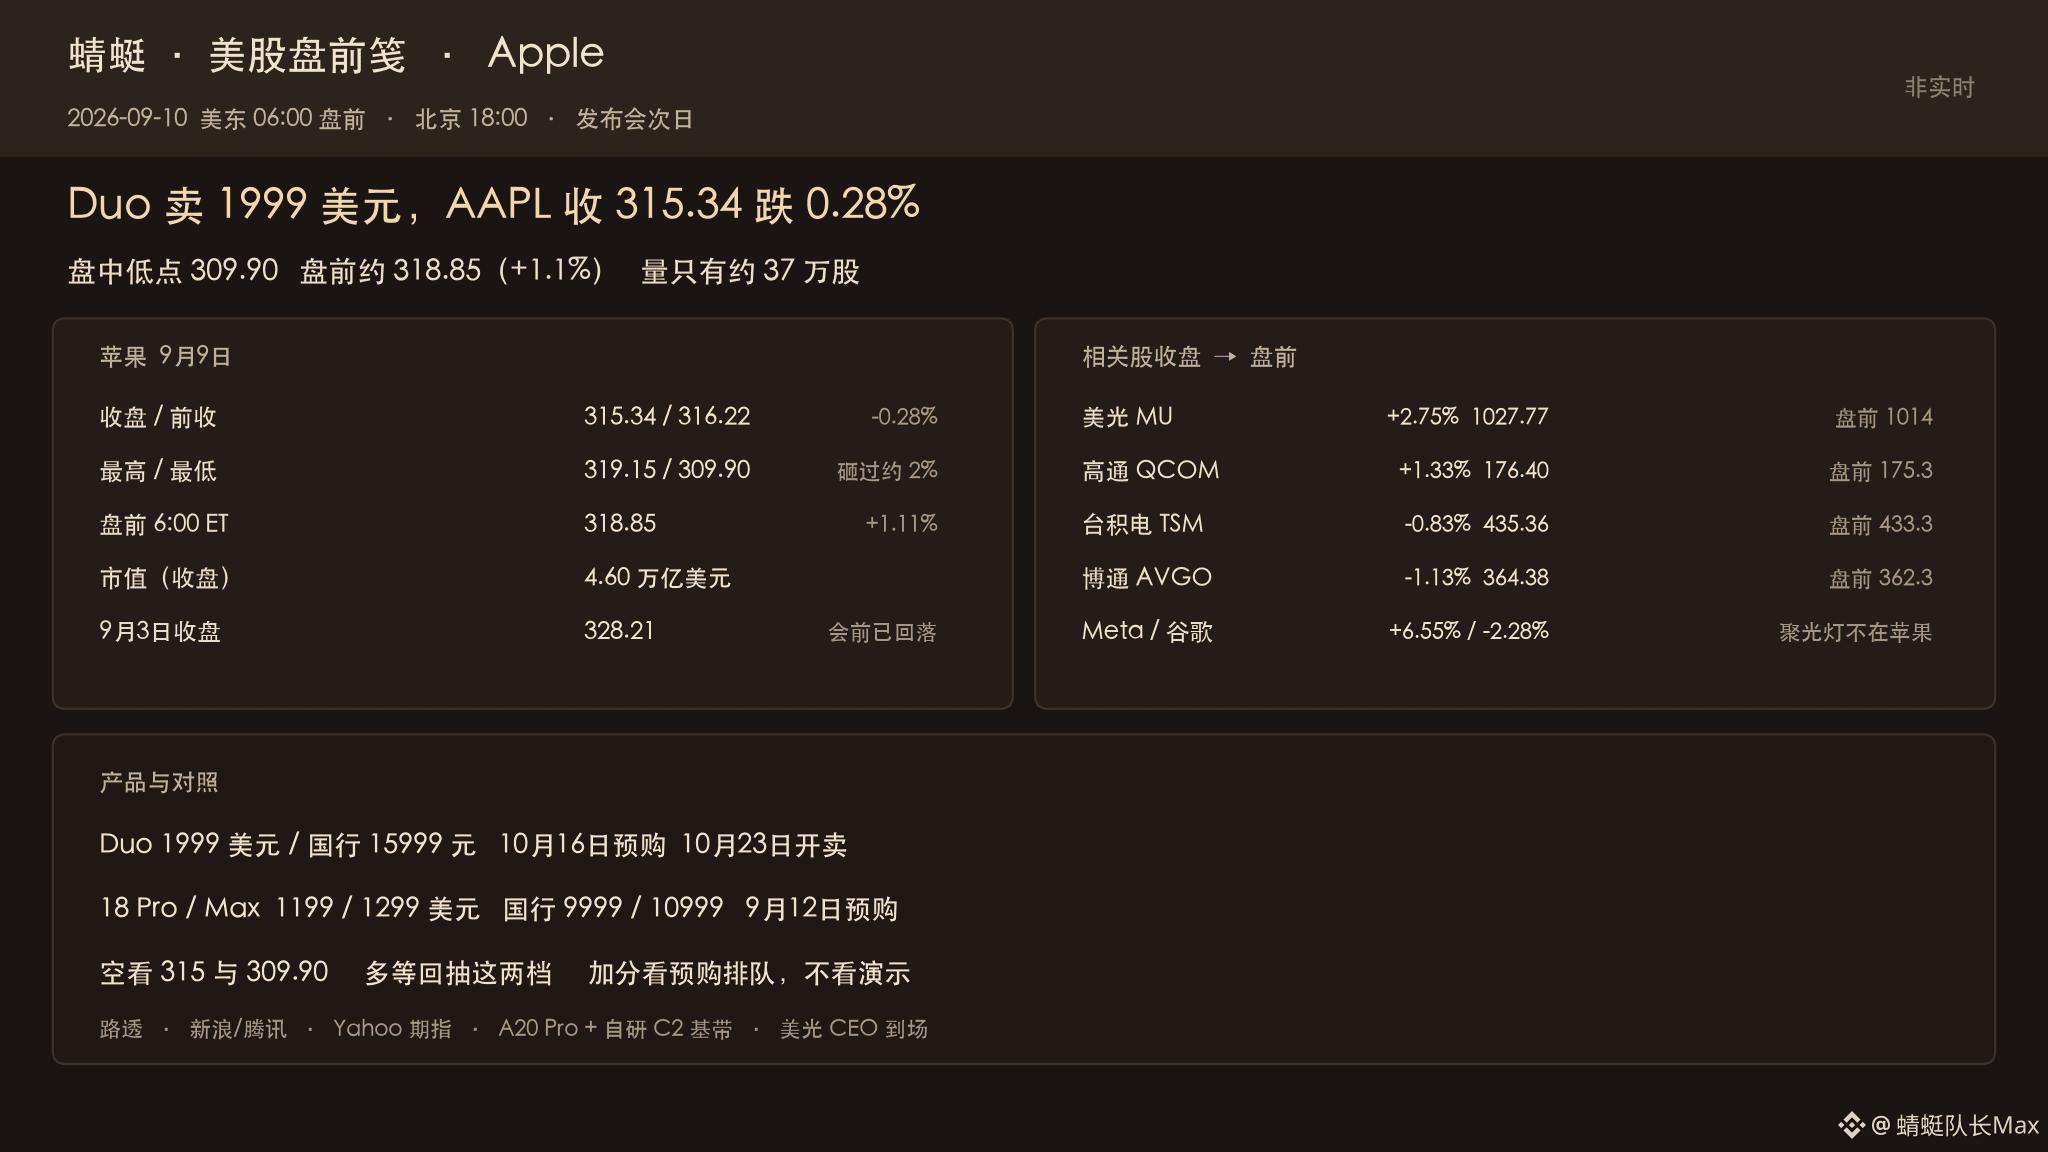
The first foldable-screen iPhone Duo is priced from $1,999. On the day of its release, Apple closed at $315.34, down 0.28%, and even got hit intraday to $309.90. In premarket trading, Sina quotes it at about $318.85, roughly 1.1% higher than the close. Is this a retracement after “good news fully played out,” or a re-pricing ahead of the pre-orders?
See the comparison table on the cover. Cutoff time: 6:00 p.m. on Sept 10, 2026 (U.S. Eastern ~6 a.m. premarket). The closing price is matched to Reuters. The premarket numbers come from Sina’s U.S. stocks section; volume was only about 370,000 shares, far thinner than the main shares outstanding of 656.4 million. The futures come from Yahoo.
【What was released】
Reuters reports that on Sept 9 Apple launched the Duo, passport-sized when folded, with a 7.6-inch internal display when unfolded, and a small screen on the front when folded. The newly appointed CEO Ternus hosted the event. This is the biggest flagship-form-factor change for iPhone since iPhone X. Duo runs A20 Pro, and also includes Apple’s custom C2 modem. Prices start at $1,999, and sales begin Oct 23. On China’s official website, the 256GB model costs 15,999 yuan, with pre-orders starting at 8:00 p.m. on Oct 16.
At the same time, iPhone 18 Pro and 18 Pro Max were released in the U.S., starting at $1,199 and $1,299 respectively—$100 more than each 17 Pro model. In China, the 256GB iPhone 18 Pro models are 9,999 yuan and 10,999 yuan respectively; pre-orders start Sept 12, with sales beginning Sept 18. The base iPhone 18 wasn’t released. Reuters writes that in the last fiscal year, iPhone revenue was $209.6 billion, just over half of total sales. Micron’s CEO attended the event, and memory shortages were put front and center.
【Apple sold the expectations first】
Sina and Tencent both show the close at 315.34, with the prior close at 316.22. On Yahoo’s daily chart that day, the high was 319.15 and the low was 309.90—about a 2% drop from the prior close at the low point. Shares outstanding are about 14.594 billion. Near the low, the market cap was roughly $90 billion less than at the prior close. Market cap at the close was about $4.60 trillion. On Sept 3, it was still at 328.21, and it had already come down before the event.
The premarket 318.85 essentially filled back the decline from the close and was about 0.8% higher than the prior close. Volume was too thin, so it can only reflect sentiment—not a conclusion about the open. S&P futures were about 7,651.5 and Nasdaq futures about 29,399. The 10-year U.S. Treasury yield closed yesterday at 4.837%. VIX was around 16.5. Tech stocks didn’t move in lockstep overnight. Google A fell 2.28% to 330.65. Amazon was down 1.78%. Nvidia down 0.91%. Microsoft down 0.47%. Meta rose 6.55%, stealing the spotlight from the “Magnificent Seven.”
【Related stocks didn’t rally because of Apple】
On the day of the event, the supply chain didn’t celebrate in unison. Micron closed at 1,027.77, up 2.75%. The market “paid” for the fact that the CEO attended. Qualcomm closed at 176.40, up 1.33%. The C2 modem is a mid-term story, and Qualcomm wasn’t hit that day. TSMC closed at 435.36, down 0.83%. Broadcom closed at 364.38, down 1.13%. Semiconductor ETFs were nearly flat. In premarket, Micron gave back to about 1,014; Qualcomm to about 175.3; TSMC to about 433.3. If Apple wants to rely on foldable screens, on-device AI, and more memory, then Micron is closer to this launch than Broadcom.
【The setup】
Bearish: Can Apple hold 315? If it loses 309.90, then the “pit” from the event day may not be fully over yet.
Bullish: With the current price hugging premarket 318, chasing the stock still squeezes you. First support looks at 315. Second support looks at 309.90. The real “bonus” will come when you see the queue time during the pre-orders on Sept 12 for the Pro and Oct 16 for the Duo. The price was lifted by $100. With the foldable screen starting at 1,999, whether the gross margin can hold will depend on shipments—not demos.
So will you wait for the pre-order schedule and then give Apple a boost, or do you think 318 already prices in the Duo? If the stock loses 315 at the open, do you treat it as “good news fully played out,” or as a premarket pullback on thin volume?
$AAPL $MU #苹果 #美股盘前 #折叠屏
Captain Dragonfly|A finance blogger who likes analyzing data and candlestick charts.
Not investment advice. The water level is just for reference—determine your position size yourself. Premarket volume was far thinner than the actual float; after the open, the numbers will change.
The first foldable-screen iPhone Duo is priced from $1,999. On the day of its release, Apple closed at $315.34, down 0.28%, and even got hit intraday to $309.90. In premarket trading, Sina quotes it at about $318.85, roughly 1.1% higher than the close. Is this a retracement after “good news fully played out,” or a re-pricing ahead of the pre-orders?
See the comparison table on the cover. Cutoff time: 6:00 p.m. on Sept 10, 2026 (U.S. Eastern ~6 a.m. premarket). The closing price is matched to Reuters. The premarket numbers come from Sina’s U.S. stocks section; volume was only about 370,000 shares, far thinner than the main shares outstanding of 656.4 million. The futures come from Yahoo.
【What was released】
Reuters reports that on Sept 9 Apple launched the Duo, passport-sized when folded, with a 7.6-inch internal display when unfolded, and a small screen on the front when folded. The newly appointed CEO Ternus hosted the event. This is the biggest flagship-form-factor change for iPhone since iPhone X. Duo runs A20 Pro, and also includes Apple’s custom C2 modem. Prices start at $1,999, and sales begin Oct 23. On China’s official website, the 256GB model costs 15,999 yuan, with pre-orders starting at 8:00 p.m. on Oct 16.
At the same time, iPhone 18 Pro and 18 Pro Max were released in the U.S., starting at $1,199 and $1,299 respectively—$100 more than each 17 Pro model. In China, the 256GB iPhone 18 Pro models are 9,999 yuan and 10,999 yuan respectively; pre-orders start Sept 12, with sales beginning Sept 18. The base iPhone 18 wasn’t released. Reuters writes that in the last fiscal year, iPhone revenue was $209.6 billion, just over half of total sales. Micron’s CEO attended the event, and memory shortages were put front and center.
【Apple sold the expectations first】
Sina and Tencent both show the close at 315.34, with the prior close at 316.22. On Yahoo’s daily chart that day, the high was 319.15 and the low was 309.90—about a 2% drop from the prior close at the low point. Shares outstanding are about 14.594 billion. Near the low, the market cap was roughly $90 billion less than at the prior close. Market cap at the close was about $4.60 trillion. On Sept 3, it was still at 328.21, and it had already come down before the event.
The premarket 318.85 essentially filled back the decline from the close and was about 0.8% higher than the prior close. Volume was too thin, so it can only reflect sentiment—not a conclusion about the open. S&P futures were about 7,651.5 and Nasdaq futures about 29,399. The 10-year U.S. Treasury yield closed yesterday at 4.837%. VIX was around 16.5. Tech stocks didn’t move in lockstep overnight. Google A fell 2.28% to 330.65. Amazon was down 1.78%. Nvidia down 0.91%. Microsoft down 0.47%. Meta rose 6.55%, stealing the spotlight from the “Magnificent Seven.”
【Related stocks didn’t rally because of Apple】
On the day of the event, the supply chain didn’t celebrate in unison. Micron closed at 1,027.77, up 2.75%. The market “paid” for the fact that the CEO attended. Qualcomm closed at 176.40, up 1.33%. The C2 modem is a mid-term story, and Qualcomm wasn’t hit that day. TSMC closed at 435.36, down 0.83%. Broadcom closed at 364.38, down 1.13%. Semiconductor ETFs were nearly flat. In premarket, Micron gave back to about 1,014; Qualcomm to about 175.3; TSMC to about 433.3. If Apple wants to rely on foldable screens, on-device AI, and more memory, then Micron is closer to this launch than Broadcom.
【The setup】
Bearish: Can Apple hold 315? If it loses 309.90, then the “pit” from the event day may not be fully over yet.
Bullish: With the current price hugging premarket 318, chasing the stock still squeezes you. First support looks at 315. Second support looks at 309.90. The real “bonus” will come when you see the queue time during the pre-orders on Sept 12 for the Pro and Oct 16 for the Duo. The price was lifted by $100. With the foldable screen starting at 1,999, whether the gross margin can hold will depend on shipments—not demos.
So will you wait for the pre-order schedule and then give Apple a boost, or do you think 318 already prices in the Duo? If the stock loses 315 at the open, do you treat it as “good news fully played out,” or as a premarket pullback on thin volume?
$AAPL $MU #苹果 #美股盘前 #折叠屏
Captain Dragonfly|A finance blogger who likes analyzing data and candlestick charts.
Not investment advice. The water level is just for reference—determine your position size yourself. Premarket volume was far thinner than the actual float; after the open, the numbers will change.
See the comparison table on the cover. Cutoff time: 6:00 p.m. on Sept 10, 2026 (U.S. Eastern ~6 a.m. premarket). The closing price is matched to Reuters. The premarket numbers come from Sina’s U.S. stocks section; volume was only about 370,000 shares, far thinner than the main shares outstanding of 656.4 million. The futures come from Yahoo.
【What was released】
Reuters reports that on Sept 9 Apple launched the Duo, passport-sized when folded, with a 7.6-inch internal display when unfolded, and a small screen on the front when folded. The newly appointed CEO Ternus hosted the event. This is the biggest flagship-form-factor change for iPhone since iPhone X. Duo runs A20 Pro, and also includes Apple’s custom C2 modem. Prices start at $1,999, and sales begin Oct 23. On China’s official website, the 256GB model costs 15,999 yuan, with pre-orders starting at 8:00 p.m. on Oct 16.
At the same time, iPhone 18 Pro and 18 Pro Max were released in the U.S., starting at $1,199 and $1,299 respectively—$100 more than each 17 Pro model. In China, the 256GB iPhone 18 Pro models are 9,999 yuan and 10,999 yuan respectively; pre-orders start Sept 12, with sales beginning Sept 18. The base iPhone 18 wasn’t released. Reuters writes that in the last fiscal year, iPhone revenue was $209.6 billion, just over half of total sales. Micron’s CEO attended the event, and memory shortages were put front and center.
【Apple sold the expectations first】
Sina and Tencent both show the close at 315.34, with the prior close at 316.22. On Yahoo’s daily chart that day, the high was 319.15 and the low was 309.90—about a 2% drop from the prior close at the low point. Shares outstanding are about 14.594 billion. Near the low, the market cap was roughly $90 billion less than at the prior close. Market cap at the close was about $4.60 trillion. On Sept 3, it was still at 328.21, and it had already come down before the event.
The premarket 318.85 essentially filled back the decline from the close and was about 0.8% higher than the prior close. Volume was too thin, so it can only reflect sentiment—not a conclusion about the open. S&P futures were about 7,651.5 and Nasdaq futures about 29,399. The 10-year U.S. Treasury yield closed yesterday at 4.837%. VIX was around 16.5. Tech stocks didn’t move in lockstep overnight. Google A fell 2.28% to 330.65. Amazon was down 1.78%. Nvidia down 0.91%. Microsoft down 0.47%. Meta rose 6.55%, stealing the spotlight from the “Magnificent Seven.”
【Related stocks didn’t rally because of Apple】
On the day of the event, the supply chain didn’t celebrate in unison. Micron closed at 1,027.77, up 2.75%. The market “paid” for the fact that the CEO attended. Qualcomm closed at 176.40, up 1.33%. The C2 modem is a mid-term story, and Qualcomm wasn’t hit that day. TSMC closed at 435.36, down 0.83%. Broadcom closed at 364.38, down 1.13%. Semiconductor ETFs were nearly flat. In premarket, Micron gave back to about 1,014; Qualcomm to about 175.3; TSMC to about 433.3. If Apple wants to rely on foldable screens, on-device AI, and more memory, then Micron is closer to this launch than Broadcom.
【The setup】
Bearish: Can Apple hold 315? If it loses 309.90, then the “pit” from the event day may not be fully over yet.
Bullish: With the current price hugging premarket 318, chasing the stock still squeezes you. First support looks at 315. Second support looks at 309.90. The real “bonus” will come when you see the queue time during the pre-orders on Sept 12 for the Pro and Oct 16 for the Duo. The price was lifted by $100. With the foldable screen starting at 1,999, whether the gross margin can hold will depend on shipments—not demos.
So will you wait for the pre-order schedule and then give Apple a boost, or do you think 318 already prices in the Duo? If the stock loses 315 at the open, do you treat it as “good news fully played out,” or as a premarket pullback on thin volume?
$AAPL $MU #苹果 #美股盘前 #折叠屏
Captain Dragonfly|A finance blogger who likes analyzing data and candlestick charts.
Not investment advice. The water level is just for reference—determine your position size yourself. Premarket volume was far thinner than the actual float; after the open, the numbers will change.
97
·
--
Weekend Clash: Tankers Swapped for War Premium, Brent Stuck Near 97. OKX Bitcoin around 79,435—still far from the 76,261 hit on September 1. Tanker headlines are ramping up, but crypto prices haven’t dropped another notch. Is this time crypto just dull, or are we saving the bill for Friday’s CPI?
See the comparison table on the cover. Cutoff: 10:25 on September 8, 2026. Spot data from OKX; oil and gold from Sina Futures and Yahoo daily lines. The U.S. military statement and the Iranian statement are written separately—I don’t treat a one-sided battle report as already verified.
【They Hit Tankers Over the Weekend】
Reuters wrote that the war, counting from February 28, has already lasted six months. On September 5, the U.S. Central Command said that after the Revolutionary Guards fired ballistic missiles at two U.S. vessels, the U.S. struck three tankers. Maritime intelligence firm named Downy, Stark I, and Kylo, with the area near the Strait of Hormuz, the Jask region, and the Gulf of Oman. Commander Cooper said: “You hit two of mine, and I’ll make you pay a higher economic cost with three of yours.”
The Revolutionary Guards later claimed they struck three tankers sailing unauthorized routes, plus another three ships linked to the United States, and said the missiles hit U.S. vessels. Reuters relayed the U.S. account—U.S. warships avoided the attack. What can be confirmed is that tankers are being used as a trade-off tool. Iranian officials also said that in the coming days they will draw new restricted zones in the Gulf and publish corridor maps. The maps haven’t come out yet.
【Fewer Ships—Oil Already Jumped Last Week】
Citing Reuters and Kpler: over the past 10 days, the Strait of Hormuz saw only about 10 commodity ships per day, the lowest since May. On Saturday, just 2 ships; on Sunday, 6 ships. After Wednesday, no very large tankers exited the strait. Before the war, about one-fifth of seaborne seaborne crude passed here. The U.S. Energy Information Administration estimated this year’s Q2 transit volume at 4.9 million barrels per day on average, versus 21.6 million barrels per day in Q4 2025 before the conflict.
Oil’s real jump happened last week. Yahoo WTI on August 28 closed at 83.40; on September 1 it jumped to 90.22; on September 4 it closed at 91.48. As of press cutoff, Sina reported 92.55. Brent on August 28 closed at 89.31; on September 1 it closed at 94.65; on September 4 it closed at 96.28; as of press cutoff, about 97.14. Weekend back-and-forth pinned the premium high without creating another gap like the September 1 break. New York gold around 4,474, nearly pinned to the previous close. The 10-year U.S. Treasury yield stayed at 4.784% on September 4.
【Crypto Is Following the Rate-Bill】
OKX’s trading path is clear. On September 1, Bitcoin’s low was 76,261, and that day oil re-established itself above 90. On September 3, the intraday high hit 82,285, and later it was smashed back to 78,650. On September 5—the day of the weekend mutual strikes—the daily chart only oscillated between 79,199 and 80,197. The low on the 6th was 78,682. As of press cutoff: 79,435, down about 0.7% over 24 hours. Ethereum around 2,504, nearly flat over 24 hours.
Crypto didn’t turn the weekend mutual strikes into a fresh round of crash. If oil moves into inflation expectations, then inflation expectations feed into the CPI on September 11, and then into the FOMC decision-making period from September 15 to 16. Bitcoin is still a high-volatility risk asset right now. If you only short based on tanker headlines, you’ll mix up the two books from September 5 and September 1.
【Comparison】
Short: wait for new “route corridor” nails to land. The first level looks at 78,682 breaking. The second level looks at 76,261. Abandon this pullback-shorts setup; first watch for 80,427 reclaim, then 82,285.
Long: current price is between 78,682 and 80,427—chasing longs is still crowded. First level: 78,682. Second level: 76,261. If Brent moves further away from 97 to the upside, acknowledge the oil first—then talk about crypto.
The next big nail is still the CPI on September 11. If the restricted-zone map lands first, oil will price first.
Will you wait for the map to come out before looking for a short, or do you think 79,400 has already run through the premium? If 78,682 is lost first, do you assume the rate-bill is back again—or do you treat this as only a second pullback of the tanker-news story?
$BTC $ETH #原油 #霍尔木兹 #crypto
Captain Dragonfly | A finance blogger who likes analyzing data and candlesticks.
Not investment advice. The “water level” is only for reference; position sizing is up to you. Battle reports should be based on statements from all sides; one-sided battle outcomes have not been independently verified.
Weekend Clash: Tankers Swapped for War Premium, Brent Stuck Near 97. OKX Bitcoin around 79,435—still far from the 76,261 hit on September 1. Tanker headlines are ramping up, but crypto prices haven’t dropped another notch. Is this time crypto just dull, or are we saving the bill for Friday’s CPI?
See the comparison table on the cover. Cutoff: 10:25 on September 8, 2026. Spot data from OKX; oil and gold from Sina Futures and Yahoo daily lines. The U.S. military statement and the Iranian statement are written separately—I don’t treat a one-sided battle report as already verified.
【They Hit Tankers Over the Weekend】
Reuters wrote that the war, counting from February 28, has already lasted six months. On September 5, the U.S. Central Command said that after the Revolutionary Guards fired ballistic missiles at two U.S. vessels, the U.S. struck three tankers. Maritime intelligence firm named Downy, Stark I, and Kylo, with the area near the Strait of Hormuz, the Jask region, and the Gulf of Oman. Commander Cooper said: “You hit two of mine, and I’ll make you pay a higher economic cost with three of yours.”
The Revolutionary Guards later claimed they struck three tankers sailing unauthorized routes, plus another three ships linked to the United States, and said the missiles hit U.S. vessels. Reuters relayed the U.S. account—U.S. warships avoided the attack. What can be confirmed is that tankers are being used as a trade-off tool. Iranian officials also said that in the coming days they will draw new restricted zones in the Gulf and publish corridor maps. The maps haven’t come out yet.
【Fewer Ships—Oil Already Jumped Last Week】
Citing Reuters and Kpler: over the past 10 days, the Strait of Hormuz saw only about 10 commodity ships per day, the lowest since May. On Saturday, just 2 ships; on Sunday, 6 ships. After Wednesday, no very large tankers exited the strait. Before the war, about one-fifth of seaborne seaborne crude passed here. The U.S. Energy Information Administration estimated this year’s Q2 transit volume at 4.9 million barrels per day on average, versus 21.6 million barrels per day in Q4 2025 before the conflict.
Oil’s real jump happened last week. Yahoo WTI on August 28 closed at 83.40; on September 1 it jumped to 90.22; on September 4 it closed at 91.48. As of press cutoff, Sina reported 92.55. Brent on August 28 closed at 89.31; on September 1 it closed at 94.65; on September 4 it closed at 96.28; as of press cutoff, about 97.14. Weekend back-and-forth pinned the premium high without creating another gap like the September 1 break. New York gold around 4,474, nearly pinned to the previous close. The 10-year U.S. Treasury yield stayed at 4.784% on September 4.
【Crypto Is Following the Rate-Bill】
OKX’s trading path is clear. On September 1, Bitcoin’s low was 76,261, and that day oil re-established itself above 90. On September 3, the intraday high hit 82,285, and later it was smashed back to 78,650. On September 5—the day of the weekend mutual strikes—the daily chart only oscillated between 79,199 and 80,197. The low on the 6th was 78,682. As of press cutoff: 79,435, down about 0.7% over 24 hours. Ethereum around 2,504, nearly flat over 24 hours.
Crypto didn’t turn the weekend mutual strikes into a fresh round of crash. If oil moves into inflation expectations, then inflation expectations feed into the CPI on September 11, and then into the FOMC decision-making period from September 15 to 16. Bitcoin is still a high-volatility risk asset right now. If you only short based on tanker headlines, you’ll mix up the two books from September 5 and September 1.
【Comparison】
Short: wait for new “route corridor” nails to land. The first level looks at 78,682 breaking. The second level looks at 76,261. Abandon this pullback-shorts setup; first watch for 80,427 reclaim, then 82,285.
Long: current price is between 78,682 and 80,427—chasing longs is still crowded. First level: 78,682. Second level: 76,261. If Brent moves further away from 97 to the upside, acknowledge the oil first—then talk about crypto.
The next big nail is still the CPI on September 11. If the restricted-zone map lands first, oil will price first.
Will you wait for the map to come out before looking for a short, or do you think 79,400 has already run through the premium? If 78,682 is lost first, do you assume the rate-bill is back again—or do you treat this as only a second pullback of the tanker-news story?
$BTC $ETH #原油 #霍尔木兹 #crypto
Captain Dragonfly | A finance blogger who likes analyzing data and candlesticks.
Not investment advice. The “water level” is only for reference; position sizing is up to you. Battle reports should be based on statements from all sides; one-sided battle outcomes have not been independently verified.
See the comparison table on the cover. Cutoff: 10:25 on September 8, 2026. Spot data from OKX; oil and gold from Sina Futures and Yahoo daily lines. The U.S. military statement and the Iranian statement are written separately—I don’t treat a one-sided battle report as already verified.
【They Hit Tankers Over the Weekend】
Reuters wrote that the war, counting from February 28, has already lasted six months. On September 5, the U.S. Central Command said that after the Revolutionary Guards fired ballistic missiles at two U.S. vessels, the U.S. struck three tankers. Maritime intelligence firm named Downy, Stark I, and Kylo, with the area near the Strait of Hormuz, the Jask region, and the Gulf of Oman. Commander Cooper said: “You hit two of mine, and I’ll make you pay a higher economic cost with three of yours.”
The Revolutionary Guards later claimed they struck three tankers sailing unauthorized routes, plus another three ships linked to the United States, and said the missiles hit U.S. vessels. Reuters relayed the U.S. account—U.S. warships avoided the attack. What can be confirmed is that tankers are being used as a trade-off tool. Iranian officials also said that in the coming days they will draw new restricted zones in the Gulf and publish corridor maps. The maps haven’t come out yet.
【Fewer Ships—Oil Already Jumped Last Week】
Citing Reuters and Kpler: over the past 10 days, the Strait of Hormuz saw only about 10 commodity ships per day, the lowest since May. On Saturday, just 2 ships; on Sunday, 6 ships. After Wednesday, no very large tankers exited the strait. Before the war, about one-fifth of seaborne seaborne crude passed here. The U.S. Energy Information Administration estimated this year’s Q2 transit volume at 4.9 million barrels per day on average, versus 21.6 million barrels per day in Q4 2025 before the conflict.
Oil’s real jump happened last week. Yahoo WTI on August 28 closed at 83.40; on September 1 it jumped to 90.22; on September 4 it closed at 91.48. As of press cutoff, Sina reported 92.55. Brent on August 28 closed at 89.31; on September 1 it closed at 94.65; on September 4 it closed at 96.28; as of press cutoff, about 97.14. Weekend back-and-forth pinned the premium high without creating another gap like the September 1 break. New York gold around 4,474, nearly pinned to the previous close. The 10-year U.S. Treasury yield stayed at 4.784% on September 4.
【Crypto Is Following the Rate-Bill】
OKX’s trading path is clear. On September 1, Bitcoin’s low was 76,261, and that day oil re-established itself above 90. On September 3, the intraday high hit 82,285, and later it was smashed back to 78,650. On September 5—the day of the weekend mutual strikes—the daily chart only oscillated between 79,199 and 80,197. The low on the 6th was 78,682. As of press cutoff: 79,435, down about 0.7% over 24 hours. Ethereum around 2,504, nearly flat over 24 hours.
Crypto didn’t turn the weekend mutual strikes into a fresh round of crash. If oil moves into inflation expectations, then inflation expectations feed into the CPI on September 11, and then into the FOMC decision-making period from September 15 to 16. Bitcoin is still a high-volatility risk asset right now. If you only short based on tanker headlines, you’ll mix up the two books from September 5 and September 1.
【Comparison】
Short: wait for new “route corridor” nails to land. The first level looks at 78,682 breaking. The second level looks at 76,261. Abandon this pullback-shorts setup; first watch for 80,427 reclaim, then 82,285.
Long: current price is between 78,682 and 80,427—chasing longs is still crowded. First level: 78,682. Second level: 76,261. If Brent moves further away from 97 to the upside, acknowledge the oil first—then talk about crypto.
The next big nail is still the CPI on September 11. If the restricted-zone map lands first, oil will price first.
Will you wait for the map to come out before looking for a short, or do you think 79,400 has already run through the premium? If 78,682 is lost first, do you assume the rate-bill is back again—or do you treat this as only a second pullback of the tanker-news story?
$BTC $ETH #原油 #霍尔木兹 #crypto
Captain Dragonfly | A finance blogger who likes analyzing data and candlesticks.
Not investment advice. The “water level” is only for reference; position sizing is up to you. Battle reports should be based on statements from all sides; one-sided battle outcomes have not been independently verified.

280
·
--
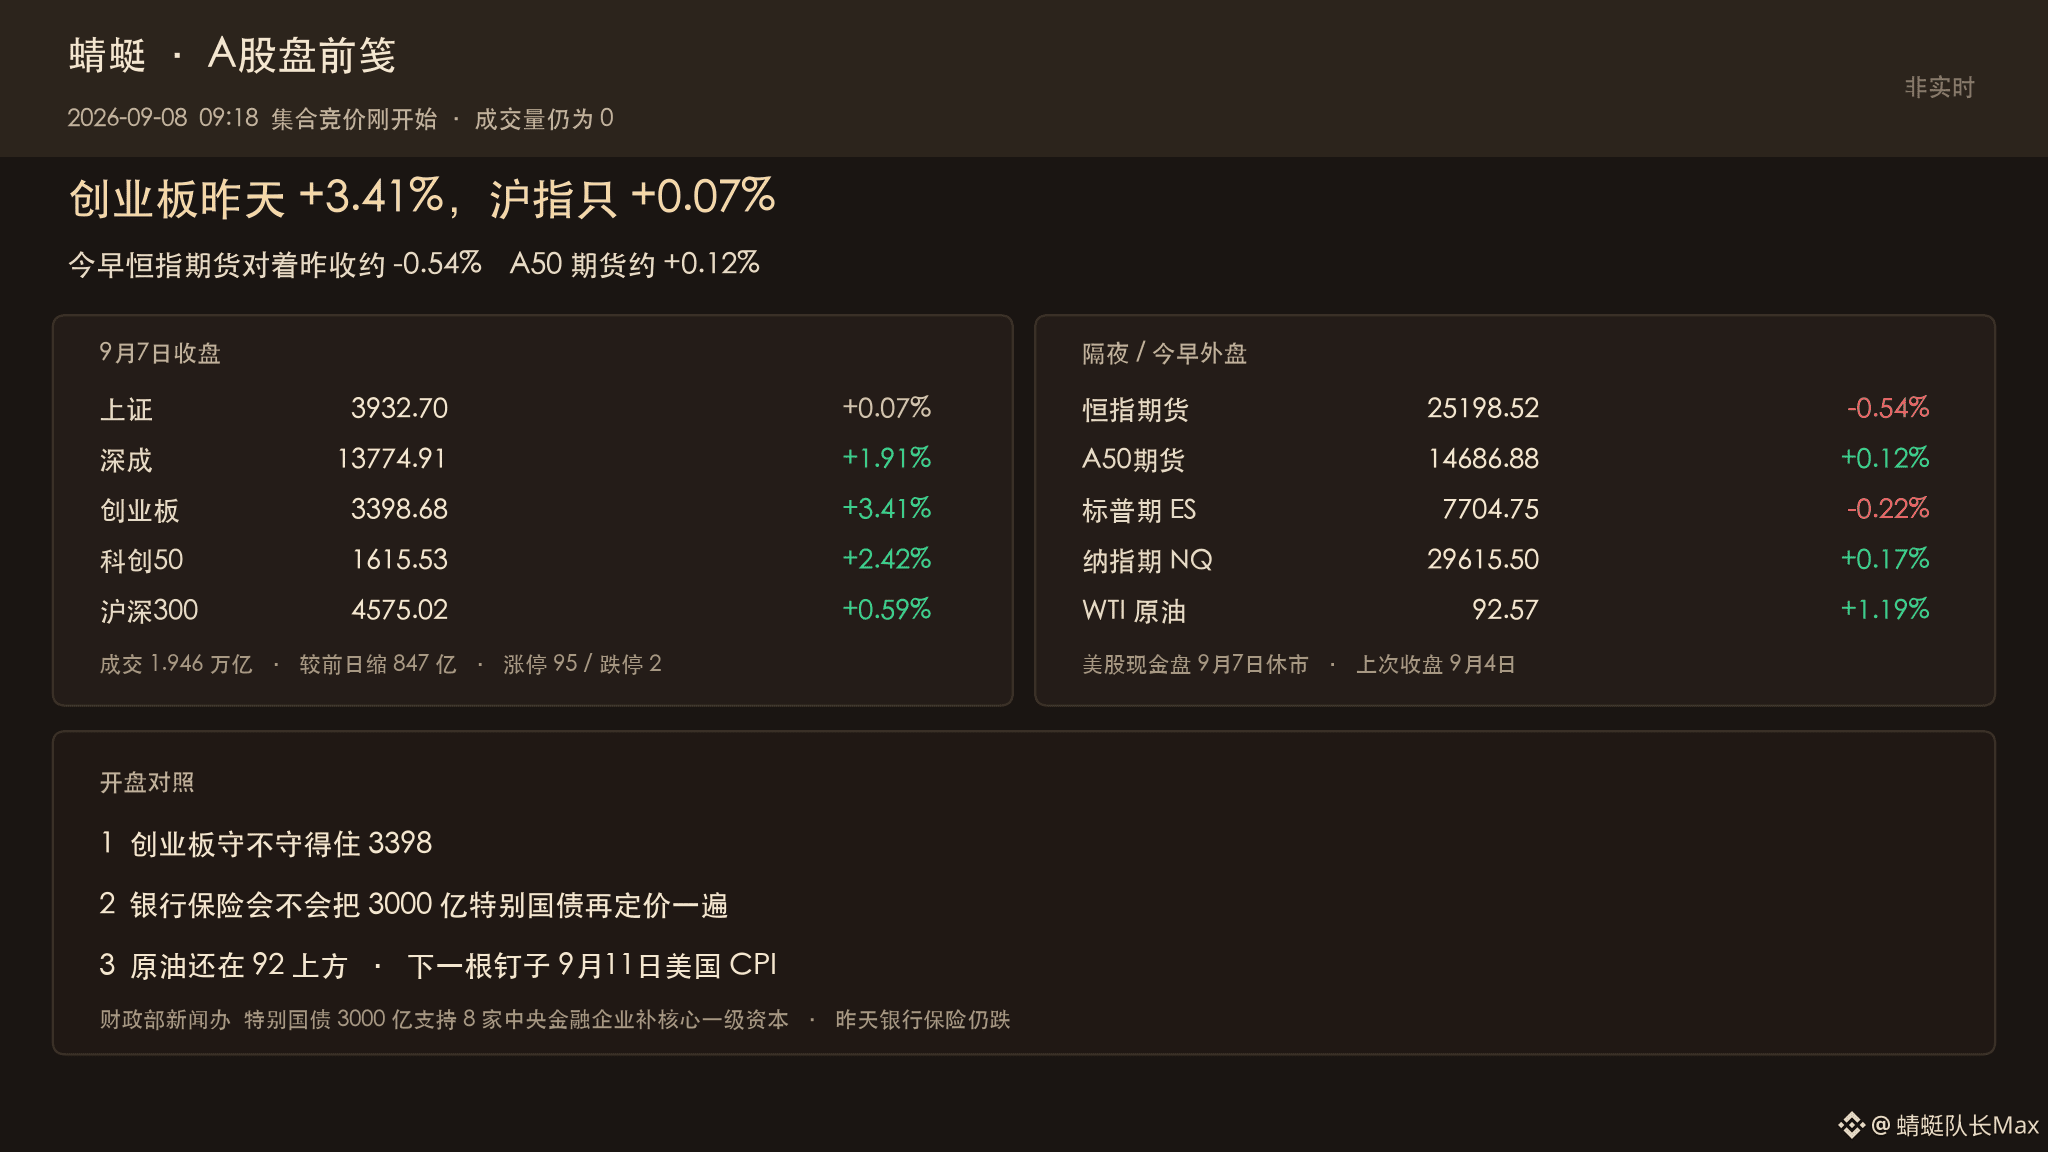
Yesterday, the ChiNext board closed up 3.41%, while the Shanghai Composite rose only 0.07%. With the U.S. stock market closed for Labor Day, this morning Hong Kong index futures opened about 0.54% lower than yesterday’s close. Is this the next round of “horse-trading for computing power,” or should we first read the face that Hong Kong futures are showing?
For the comparison table, see the cover. As of 9:18 on Sept 8, 2026. The A-share call auction just started. On Tencent’s quotes, turnover volume is still 0; the Shanghai Composite is only 0.02 points lower than yesterday’s close, hovering at 3932.68. The Shenzhen Component and ChiNext Index have not yet moved out of an effective call-auction window. Stock index futures will not open until 9:30. Overseas data comes from Sina Futures and Yahoo daily lines.
【They tore the style apart yesterday】
On Sept 7, all three major indexes finished green, but the money didn’t give the Shanghai Composite face. The Shanghai Composite closed at 3932.70, up 0.07%. The Shenzhen Component Index closed at 13774.91, up 1.91%. The ChiNext Index closed at 3398.68, up 3.41%. The STAR 50 closed at 1615.53, up 2.42%. The CSI 300 closed at 4575.02, up 0.59%. Transferred from The Paper to Wind: total turnover across both exchanges was 1.946 trillion yuan, down 84.7 billion yuan from the previous day’s 2.0307 trillion yuan. Sina’s market wrap said 95 stocks hit limit-up, 2 hit limit-down; 3167 stocks advanced, 2196 declined.
Leaders were optical modules, PCB, and semiconductors. Laggards were banks, insurance, and coal. The Shanghai Composite basically moved sideways, while the ChiNext board pulled away by 3 percentage points in a single day—this is the ledger you need to carry into this morning before the open.
【Overseas markets first gave a cold face】
In the U.S. cash market on Sept 7, with Labor Day observed, there was no new closing session. The last cash closing on Yahoo was stopped at Sept 4. S&P 500 closed at 7718.60. Nasdaq closed at 26506.99. Dow Jones closed at 53414.25. As of the time of this report, overnight S&P futures quoted 7704.75, about 0.22% lower versus the Sept 4 futures close of 7722. Nasdaq-100 futures stood at about 29615.50, actually higher by roughly 0.17%. The broad-market futures are soft, but tech futures are still green.
Hong Kong shares were already soft yesterday. The Hang Seng Index closed at 25413.12 on Sept 7, down about 0.93% from 25650.87 on Sept 4. At 9:18 this morning, Hang Seng futures on Sina quoted 25198.52, down about 0.54% versus yesterday’s close of 25336. FTSE China A50 futures quoted 14686.88, up about 0.12% versus yesterday’s close of 14669. A50 is barely red; Hong Kong futures are green first—don’t read these two lines as one sentence.
WTI crude oil quoted 92.57, up about 1.2% versus yesterday’s close of 91.48. Brent quoted 97.22, up slightly versus 97.00 yesterday. COMEX gold quoted 4476.89, almost in line with yesterday’s close of 4476.60. Sina’s USD/CNY was 6.7001; the timestamp stopped at 2:52 a.m. It’s used only for reference and not as an intraday FX rate.
【The 300 billion yuan wasn’t enough to hold back banks yesterday】
On Sept 7, the Information Office of the Ministry of Finance issued a release saying that in the near term, it will issue 300 billion yuan of special government bonds, to replenish core tier-1 capital for eight central financial enterprises. The list includes ICBC and ABC, as well as the Export-Import Bank of China and several insurance and reinsurance companies. Later, The Shanghai Securities News summed up the eight entities’ capital-increase plans to 360 billion yuan. The extra portion came from China Tobacco and its subsidiaries. The news had already spread over the weekend into Monday. Yesterday, banks and insurance were still falling. The injection is a story about mid-term capital, but the money went into computing-power hardware yesterday.
【Match up the pre-open】
The call-auction window runs until 9:25 for cleaner pricing. It’s still early to talk about the opening direction. The cleaner comparison is three points.
First, can the ChiNext board hold 3398? It closed here yesterday as well—the step you’re standing on for this jump. If it gets dropped at the open, it suggests that overnight Hong Kong index futures have already compressed the elasticity.
Second, will banks and insurance reprice the 300 billion yuan again? They have already fallen once yesterday. If they keep getting sold off today, it means the market continues to read the capital injection as dilution rather than leverage.
Third, crude oil is still above 92. Coal and petrochemicals have already stepped aside. If oil pushes higher again, cycle stocks and inflation expectations will start to chatter together.
The next big nail still comes on Sept 11: the U.S. CPI. There are also FOMC meetings on Sept 15–16. After Labor Day, U.S. cash markets won’t reopen until later tonight. A-shares should first finish their own morning.
At the open, will you chase yesterday’s optical module/semiconductor rally, or wait for banks and insurance to run through the capital-injection story again? If the ChiNext board opens and immediately gives up 3398, do you think overnight Hong Kong futures compressed the elasticity, or do you treat it as a pullback and buy?
#A股 #盘前 #ChiNext
Captain Dragonfly | A finance blogger who likes analyzing data and candlestick charts.
Not investment advice. Water levels are only for reference; position sizing is up to you. Before the call auction is complete, don’t treat index gains and losses as the conclusion for the open.
Yesterday, the ChiNext board closed up 3.41%, while the Shanghai Composite rose only 0.07%. With the U.S. stock market closed for Labor Day, this morning Hong Kong index futures opened about 0.54% lower than yesterday’s close. Is this the next round of “horse-trading for computing power,” or should we first read the face that Hong Kong futures are showing?
For the comparison table, see the cover. As of 9:18 on Sept 8, 2026. The A-share call auction just started. On Tencent’s quotes, turnover volume is still 0; the Shanghai Composite is only 0.02 points lower than yesterday’s close, hovering at 3932.68. The Shenzhen Component and ChiNext Index have not yet moved out of an effective call-auction window. Stock index futures will not open until 9:30. Overseas data comes from Sina Futures and Yahoo daily lines.
【They tore the style apart yesterday】
On Sept 7, all three major indexes finished green, but the money didn’t give the Shanghai Composite face. The Shanghai Composite closed at 3932.70, up 0.07%. The Shenzhen Component Index closed at 13774.91, up 1.91%. The ChiNext Index closed at 3398.68, up 3.41%. The STAR 50 closed at 1615.53, up 2.42%. The CSI 300 closed at 4575.02, up 0.59%. Transferred from The Paper to Wind: total turnover across both exchanges was 1.946 trillion yuan, down 84.7 billion yuan from the previous day’s 2.0307 trillion yuan. Sina’s market wrap said 95 stocks hit limit-up, 2 hit limit-down; 3167 stocks advanced, 2196 declined.
Leaders were optical modules, PCB, and semiconductors. Laggards were banks, insurance, and coal. The Shanghai Composite basically moved sideways, while the ChiNext board pulled away by 3 percentage points in a single day—this is the ledger you need to carry into this morning before the open.
【Overseas markets first gave a cold face】
In the U.S. cash market on Sept 7, with Labor Day observed, there was no new closing session. The last cash closing on Yahoo was stopped at Sept 4. S&P 500 closed at 7718.60. Nasdaq closed at 26506.99. Dow Jones closed at 53414.25. As of the time of this report, overnight S&P futures quoted 7704.75, about 0.22% lower versus the Sept 4 futures close of 7722. Nasdaq-100 futures stood at about 29615.50, actually higher by roughly 0.17%. The broad-market futures are soft, but tech futures are still green.
Hong Kong shares were already soft yesterday. The Hang Seng Index closed at 25413.12 on Sept 7, down about 0.93% from 25650.87 on Sept 4. At 9:18 this morning, Hang Seng futures on Sina quoted 25198.52, down about 0.54% versus yesterday’s close of 25336. FTSE China A50 futures quoted 14686.88, up about 0.12% versus yesterday’s close of 14669. A50 is barely red; Hong Kong futures are green first—don’t read these two lines as one sentence.
WTI crude oil quoted 92.57, up about 1.2% versus yesterday’s close of 91.48. Brent quoted 97.22, up slightly versus 97.00 yesterday. COMEX gold quoted 4476.89, almost in line with yesterday’s close of 4476.60. Sina’s USD/CNY was 6.7001; the timestamp stopped at 2:52 a.m. It’s used only for reference and not as an intraday FX rate.
【The 300 billion yuan wasn’t enough to hold back banks yesterday】
On Sept 7, the Information Office of the Ministry of Finance issued a release saying that in the near term, it will issue 300 billion yuan of special government bonds, to replenish core tier-1 capital for eight central financial enterprises. The list includes ICBC and ABC, as well as the Export-Import Bank of China and several insurance and reinsurance companies. Later, The Shanghai Securities News summed up the eight entities’ capital-increase plans to 360 billion yuan. The extra portion came from China Tobacco and its subsidiaries. The news had already spread over the weekend into Monday. Yesterday, banks and insurance were still falling. The injection is a story about mid-term capital, but the money went into computing-power hardware yesterday.
【Match up the pre-open】
The call-auction window runs until 9:25 for cleaner pricing. It’s still early to talk about the opening direction. The cleaner comparison is three points.
First, can the ChiNext board hold 3398? It closed here yesterday as well—the step you’re standing on for this jump. If it gets dropped at the open, it suggests that overnight Hong Kong index futures have already compressed the elasticity.
Second, will banks and insurance reprice the 300 billion yuan again? They have already fallen once yesterday. If they keep getting sold off today, it means the market continues to read the capital injection as dilution rather than leverage.
Third, crude oil is still above 92. Coal and petrochemicals have already stepped aside. If oil pushes higher again, cycle stocks and inflation expectations will start to chatter together.
The next big nail still comes on Sept 11: the U.S. CPI. There are also FOMC meetings on Sept 15–16. After Labor Day, U.S. cash markets won’t reopen until later tonight. A-shares should first finish their own morning.
At the open, will you chase yesterday’s optical module/semiconductor rally, or wait for banks and insurance to run through the capital-injection story again? If the ChiNext board opens and immediately gives up 3398, do you think overnight Hong Kong futures compressed the elasticity, or do you treat it as a pullback and buy?
#A股 #盘前 #ChiNext
Captain Dragonfly | A finance blogger who likes analyzing data and candlestick charts.
Not investment advice. Water levels are only for reference; position sizing is up to you. Before the call auction is complete, don’t treat index gains and losses as the conclusion for the open.
For the comparison table, see the cover. As of 9:18 on Sept 8, 2026. The A-share call auction just started. On Tencent’s quotes, turnover volume is still 0; the Shanghai Composite is only 0.02 points lower than yesterday’s close, hovering at 3932.68. The Shenzhen Component and ChiNext Index have not yet moved out of an effective call-auction window. Stock index futures will not open until 9:30. Overseas data comes from Sina Futures and Yahoo daily lines.
【They tore the style apart yesterday】
On Sept 7, all three major indexes finished green, but the money didn’t give the Shanghai Composite face. The Shanghai Composite closed at 3932.70, up 0.07%. The Shenzhen Component Index closed at 13774.91, up 1.91%. The ChiNext Index closed at 3398.68, up 3.41%. The STAR 50 closed at 1615.53, up 2.42%. The CSI 300 closed at 4575.02, up 0.59%. Transferred from The Paper to Wind: total turnover across both exchanges was 1.946 trillion yuan, down 84.7 billion yuan from the previous day’s 2.0307 trillion yuan. Sina’s market wrap said 95 stocks hit limit-up, 2 hit limit-down; 3167 stocks advanced, 2196 declined.
Leaders were optical modules, PCB, and semiconductors. Laggards were banks, insurance, and coal. The Shanghai Composite basically moved sideways, while the ChiNext board pulled away by 3 percentage points in a single day—this is the ledger you need to carry into this morning before the open.
【Overseas markets first gave a cold face】
In the U.S. cash market on Sept 7, with Labor Day observed, there was no new closing session. The last cash closing on Yahoo was stopped at Sept 4. S&P 500 closed at 7718.60. Nasdaq closed at 26506.99. Dow Jones closed at 53414.25. As of the time of this report, overnight S&P futures quoted 7704.75, about 0.22% lower versus the Sept 4 futures close of 7722. Nasdaq-100 futures stood at about 29615.50, actually higher by roughly 0.17%. The broad-market futures are soft, but tech futures are still green.
Hong Kong shares were already soft yesterday. The Hang Seng Index closed at 25413.12 on Sept 7, down about 0.93% from 25650.87 on Sept 4. At 9:18 this morning, Hang Seng futures on Sina quoted 25198.52, down about 0.54% versus yesterday’s close of 25336. FTSE China A50 futures quoted 14686.88, up about 0.12% versus yesterday’s close of 14669. A50 is barely red; Hong Kong futures are green first—don’t read these two lines as one sentence.
WTI crude oil quoted 92.57, up about 1.2% versus yesterday’s close of 91.48. Brent quoted 97.22, up slightly versus 97.00 yesterday. COMEX gold quoted 4476.89, almost in line with yesterday’s close of 4476.60. Sina’s USD/CNY was 6.7001; the timestamp stopped at 2:52 a.m. It’s used only for reference and not as an intraday FX rate.
【The 300 billion yuan wasn’t enough to hold back banks yesterday】
On Sept 7, the Information Office of the Ministry of Finance issued a release saying that in the near term, it will issue 300 billion yuan of special government bonds, to replenish core tier-1 capital for eight central financial enterprises. The list includes ICBC and ABC, as well as the Export-Import Bank of China and several insurance and reinsurance companies. Later, The Shanghai Securities News summed up the eight entities’ capital-increase plans to 360 billion yuan. The extra portion came from China Tobacco and its subsidiaries. The news had already spread over the weekend into Monday. Yesterday, banks and insurance were still falling. The injection is a story about mid-term capital, but the money went into computing-power hardware yesterday.
【Match up the pre-open】
The call-auction window runs until 9:25 for cleaner pricing. It’s still early to talk about the opening direction. The cleaner comparison is three points.
First, can the ChiNext board hold 3398? It closed here yesterday as well—the step you’re standing on for this jump. If it gets dropped at the open, it suggests that overnight Hong Kong index futures have already compressed the elasticity.
Second, will banks and insurance reprice the 300 billion yuan again? They have already fallen once yesterday. If they keep getting sold off today, it means the market continues to read the capital injection as dilution rather than leverage.
Third, crude oil is still above 92. Coal and petrochemicals have already stepped aside. If oil pushes higher again, cycle stocks and inflation expectations will start to chatter together.
The next big nail still comes on Sept 11: the U.S. CPI. There are also FOMC meetings on Sept 15–16. After Labor Day, U.S. cash markets won’t reopen until later tonight. A-shares should first finish their own morning.
At the open, will you chase yesterday’s optical module/semiconductor rally, or wait for banks and insurance to run through the capital-injection story again? If the ChiNext board opens and immediately gives up 3398, do you think overnight Hong Kong futures compressed the elasticity, or do you treat it as a pullback and buy?
#A股 #盘前 #ChiNext
Captain Dragonfly | A finance blogger who likes analyzing data and candlestick charts.
Not investment advice. Water levels are only for reference; position sizing is up to you. Before the call auction is complete, don’t treat index gains and losses as the conclusion for the open.
64
·
--
SOL spot price is about 105.65, exactly sitting on the Fib 0.236 of that swing from 100.19 to 107.34. Two days ago it got stuck at 103.9; now it has moved through. The 107.5 and 110.64 levels are still above. The engine’s main count still pushes an upward impulse wave, but the dashed line on the right is pinned to the old window from the Aug 22 set: 87 to 97. Tonight, if the 0.236 holds and then we surge to 107, should we still first admit that we can’t get through 107?
See the structure diagram in the cover. The blue line is the 4H swing; the recent portion is labeled A/1 to E/5. The dashed line on the right is the engine’s Fib. As of 2026-09-07 12:00 UTC, this 4H candle hasn’t closed yet. Spot data from OKX: SOL about 105.66, BTC about 79558. 24h high 107.17, low 103.79. I ran Frost and Prechter’s R1 R2 R3 over 300 4H candles. U.S. markets are closed for Labor Day today for the cash market; crypto is still jumping.
【The engine is nailed to the old window】
The main count is an upward impulse wave, score 11; R1, R2, R3 all pass. The motive wave: w1 is about 2.19, w3 about 26.11, w5 about 9.57; the third wave isn’t the shortest. The engine Fib uses the Aug 22 4:00 low 87.66 to the Aug 23 0:00 high 97.23. Within the same 4H candle there is both a high at 102.74 and a low at 87.66, so the window itself is noisy. 0.618 lands at 91.32. The old window’s 1.618 is at 103.14, and the current price is already standing above it. The alternative ABC score is only 2; confidence is in the middle. There are 43 swing points.
Use 91.32 to compare with that box in late August, not as the observation level for tonight. 4H noise is higher than the daily chart; wave counts are not unique.
【The near-term has already moved past 103.9】
On Sep 2 at 08:00, the low is 97.39. On Sep 3 at 16:00 it hit 105.93. The 4H during NFP crashed from 104.45 down to 100.19. On the chart, the near-term labels mark 100.32 as A/1, 105.0 as B/2, 97.39 as C/3, 105.93 as D/4, and 100.19 as E/5. Then on Sep 6 at 12:00 it struck 107.34 again; the label will lag one swing. On Aug 27 there’s also a higher swing high at 110.64. The Aug 30 high is 107.48. This move’s 107.34 is short by about 0.14 from 107.48, while 110.64 is even farther.
From 100.19 to 107.34, Fib 0.236 is exactly at 105.65. 0.382 is at 104.61, 0.5 at 103.77, and 0.618 at 102.92. Today’s 4:00 low is 103.79, almost right on 0.5. The rebound Fib from 107.34 down to 103.79: 0.5 is at 105.57, 0.618 at 105.98. The current price at 105.65 is squeezed between these two levels—and it’s also sitting right on the big jump’s 0.236.
That 103.9 from two days ago is the 0.236 of the move from 97.39 to 105.93. The 4H has already passed it. The next door changes to the range 107.34 to 107.48.
【Trade setup comparison】
Short: wait for a pullback. First level: look at 107.17 to 107.34, around the 4H high zone. Second level: look at 107.48. Third level: look at 110.64. If you give up the short and instead the 4H closes above 107.48, and then also closes above 110.64, don’t short again on this retracement cycle. For comparison targets: first look at 104.61, then 103.79; below that is 102.92 and 100.19.
Long: the current price is right on 0.236, cleaner by a lot than the 103.9 two days ago. It has already climbed above the old window’s 1.618. Chasing longs still feels crowded. First level: 103.79. Second level: 102.92. Third level: 100.19, the NFP 4H low. If the 4H closes below 97.39, then treat the near-term swing that started from 97.39 as broken; the next level must be counted separately. For the pullback, first look at 107.34, then 107.48; finally it will be 110.64.
At around 105.6, it’s a back-and-forth that hits both sides in a face-off. A cleaner approach is to pull back to 107.3–107.5 and then discuss shorts, or wait until 103.79, then move to 100.19, and then discuss longs. BTC is still chopping around 79,600 near 80,000; SOL has already worked through 103.9, so the “door” is now at 107.5.
The next nail is still CPI on Sep 11. Holiday-market liquidity is thin, so 4H wicks will look even messier.
Will you look for shorts on a pullback from 107.3 to 107.5, or wait until 103.79 to discuss longs? If the 4H closes below 100.19, you’d say the near-term wave structure is broken—do you accept that, or keep waiting for the old window’s five-wave setup?
$SOL $BTC #索拉纳 #波浪理论 #crypto
Captain Dragonfly|A finance blogger who likes analyzing data and candlesticks.
Not investment advice. The “water level” is only for reference; decide your own position size. 4H noise is higher than the daily chart; wave counts are not unique.
SOL spot price is about 105.65, exactly sitting on the Fib 0.236 of that swing from 100.19 to 107.34. Two days ago it got stuck at 103.9; now it has moved through. The 107.5 and 110.64 levels are still above. The engine’s main count still pushes an upward impulse wave, but the dashed line on the right is pinned to the old window from the Aug 22 set: 87 to 97. Tonight, if the 0.236 holds and then we surge to 107, should we still first admit that we can’t get through 107?
See the structure diagram in the cover. The blue line is the 4H swing; the recent portion is labeled A/1 to E/5. The dashed line on the right is the engine’s Fib. As of 2026-09-07 12:00 UTC, this 4H candle hasn’t closed yet. Spot data from OKX: SOL about 105.66, BTC about 79558. 24h high 107.17, low 103.79. I ran Frost and Prechter’s R1 R2 R3 over 300 4H candles. U.S. markets are closed for Labor Day today for the cash market; crypto is still jumping.
【The engine is nailed to the old window】
The main count is an upward impulse wave, score 11; R1, R2, R3 all pass. The motive wave: w1 is about 2.19, w3 about 26.11, w5 about 9.57; the third wave isn’t the shortest. The engine Fib uses the Aug 22 4:00 low 87.66 to the Aug 23 0:00 high 97.23. Within the same 4H candle there is both a high at 102.74 and a low at 87.66, so the window itself is noisy. 0.618 lands at 91.32. The old window’s 1.618 is at 103.14, and the current price is already standing above it. The alternative ABC score is only 2; confidence is in the middle. There are 43 swing points.
Use 91.32 to compare with that box in late August, not as the observation level for tonight. 4H noise is higher than the daily chart; wave counts are not unique.
【The near-term has already moved past 103.9】
On Sep 2 at 08:00, the low is 97.39. On Sep 3 at 16:00 it hit 105.93. The 4H during NFP crashed from 104.45 down to 100.19. On the chart, the near-term labels mark 100.32 as A/1, 105.0 as B/2, 97.39 as C/3, 105.93 as D/4, and 100.19 as E/5. Then on Sep 6 at 12:00 it struck 107.34 again; the label will lag one swing. On Aug 27 there’s also a higher swing high at 110.64. The Aug 30 high is 107.48. This move’s 107.34 is short by about 0.14 from 107.48, while 110.64 is even farther.
From 100.19 to 107.34, Fib 0.236 is exactly at 105.65. 0.382 is at 104.61, 0.5 at 103.77, and 0.618 at 102.92. Today’s 4:00 low is 103.79, almost right on 0.5. The rebound Fib from 107.34 down to 103.79: 0.5 is at 105.57, 0.618 at 105.98. The current price at 105.65 is squeezed between these two levels—and it’s also sitting right on the big jump’s 0.236.
That 103.9 from two days ago is the 0.236 of the move from 97.39 to 105.93. The 4H has already passed it. The next door changes to the range 107.34 to 107.48.
【Trade setup comparison】
Short: wait for a pullback. First level: look at 107.17 to 107.34, around the 4H high zone. Second level: look at 107.48. Third level: look at 110.64. If you give up the short and instead the 4H closes above 107.48, and then also closes above 110.64, don’t short again on this retracement cycle. For comparison targets: first look at 104.61, then 103.79; below that is 102.92 and 100.19.
Long: the current price is right on 0.236, cleaner by a lot than the 103.9 two days ago. It has already climbed above the old window’s 1.618. Chasing longs still feels crowded. First level: 103.79. Second level: 102.92. Third level: 100.19, the NFP 4H low. If the 4H closes below 97.39, then treat the near-term swing that started from 97.39 as broken; the next level must be counted separately. For the pullback, first look at 107.34, then 107.48; finally it will be 110.64.
At around 105.6, it’s a back-and-forth that hits both sides in a face-off. A cleaner approach is to pull back to 107.3–107.5 and then discuss shorts, or wait until 103.79, then move to 100.19, and then discuss longs. BTC is still chopping around 79,600 near 80,000; SOL has already worked through 103.9, so the “door” is now at 107.5.
The next nail is still CPI on Sep 11. Holiday-market liquidity is thin, so 4H wicks will look even messier.
Will you look for shorts on a pullback from 107.3 to 107.5, or wait until 103.79 to discuss longs? If the 4H closes below 100.19, you’d say the near-term wave structure is broken—do you accept that, or keep waiting for the old window’s five-wave setup?
$SOL $BTC #索拉纳 #波浪理论 #crypto
Captain Dragonfly|A finance blogger who likes analyzing data and candlesticks.
Not investment advice. The “water level” is only for reference; decide your own position size. 4H noise is higher than the daily chart; wave counts are not unique.
See the structure diagram in the cover. The blue line is the 4H swing; the recent portion is labeled A/1 to E/5. The dashed line on the right is the engine’s Fib. As of 2026-09-07 12:00 UTC, this 4H candle hasn’t closed yet. Spot data from OKX: SOL about 105.66, BTC about 79558. 24h high 107.17, low 103.79. I ran Frost and Prechter’s R1 R2 R3 over 300 4H candles. U.S. markets are closed for Labor Day today for the cash market; crypto is still jumping.
【The engine is nailed to the old window】
The main count is an upward impulse wave, score 11; R1, R2, R3 all pass. The motive wave: w1 is about 2.19, w3 about 26.11, w5 about 9.57; the third wave isn’t the shortest. The engine Fib uses the Aug 22 4:00 low 87.66 to the Aug 23 0:00 high 97.23. Within the same 4H candle there is both a high at 102.74 and a low at 87.66, so the window itself is noisy. 0.618 lands at 91.32. The old window’s 1.618 is at 103.14, and the current price is already standing above it. The alternative ABC score is only 2; confidence is in the middle. There are 43 swing points.
Use 91.32 to compare with that box in late August, not as the observation level for tonight. 4H noise is higher than the daily chart; wave counts are not unique.
【The near-term has already moved past 103.9】
On Sep 2 at 08:00, the low is 97.39. On Sep 3 at 16:00 it hit 105.93. The 4H during NFP crashed from 104.45 down to 100.19. On the chart, the near-term labels mark 100.32 as A/1, 105.0 as B/2, 97.39 as C/3, 105.93 as D/4, and 100.19 as E/5. Then on Sep 6 at 12:00 it struck 107.34 again; the label will lag one swing. On Aug 27 there’s also a higher swing high at 110.64. The Aug 30 high is 107.48. This move’s 107.34 is short by about 0.14 from 107.48, while 110.64 is even farther.
From 100.19 to 107.34, Fib 0.236 is exactly at 105.65. 0.382 is at 104.61, 0.5 at 103.77, and 0.618 at 102.92. Today’s 4:00 low is 103.79, almost right on 0.5. The rebound Fib from 107.34 down to 103.79: 0.5 is at 105.57, 0.618 at 105.98. The current price at 105.65 is squeezed between these two levels—and it’s also sitting right on the big jump’s 0.236.
That 103.9 from two days ago is the 0.236 of the move from 97.39 to 105.93. The 4H has already passed it. The next door changes to the range 107.34 to 107.48.
【Trade setup comparison】
Short: wait for a pullback. First level: look at 107.17 to 107.34, around the 4H high zone. Second level: look at 107.48. Third level: look at 110.64. If you give up the short and instead the 4H closes above 107.48, and then also closes above 110.64, don’t short again on this retracement cycle. For comparison targets: first look at 104.61, then 103.79; below that is 102.92 and 100.19.
Long: the current price is right on 0.236, cleaner by a lot than the 103.9 two days ago. It has already climbed above the old window’s 1.618. Chasing longs still feels crowded. First level: 103.79. Second level: 102.92. Third level: 100.19, the NFP 4H low. If the 4H closes below 97.39, then treat the near-term swing that started from 97.39 as broken; the next level must be counted separately. For the pullback, first look at 107.34, then 107.48; finally it will be 110.64.
At around 105.6, it’s a back-and-forth that hits both sides in a face-off. A cleaner approach is to pull back to 107.3–107.5 and then discuss shorts, or wait until 103.79, then move to 100.19, and then discuss longs. BTC is still chopping around 79,600 near 80,000; SOL has already worked through 103.9, so the “door” is now at 107.5.
The next nail is still CPI on Sep 11. Holiday-market liquidity is thin, so 4H wicks will look even messier.
Will you look for shorts on a pullback from 107.3 to 107.5, or wait until 103.79 to discuss longs? If the 4H closes below 100.19, you’d say the near-term wave structure is broken—do you accept that, or keep waiting for the old window’s five-wave setup?
$SOL $BTC #索拉纳 #波浪理论 #crypto
Captain Dragonfly|A finance blogger who likes analyzing data and candlesticks.
Not investment advice. The “water level” is only for reference; decide your own position size. 4H noise is higher than the daily chart; wave counts are not unique.

101
·
--
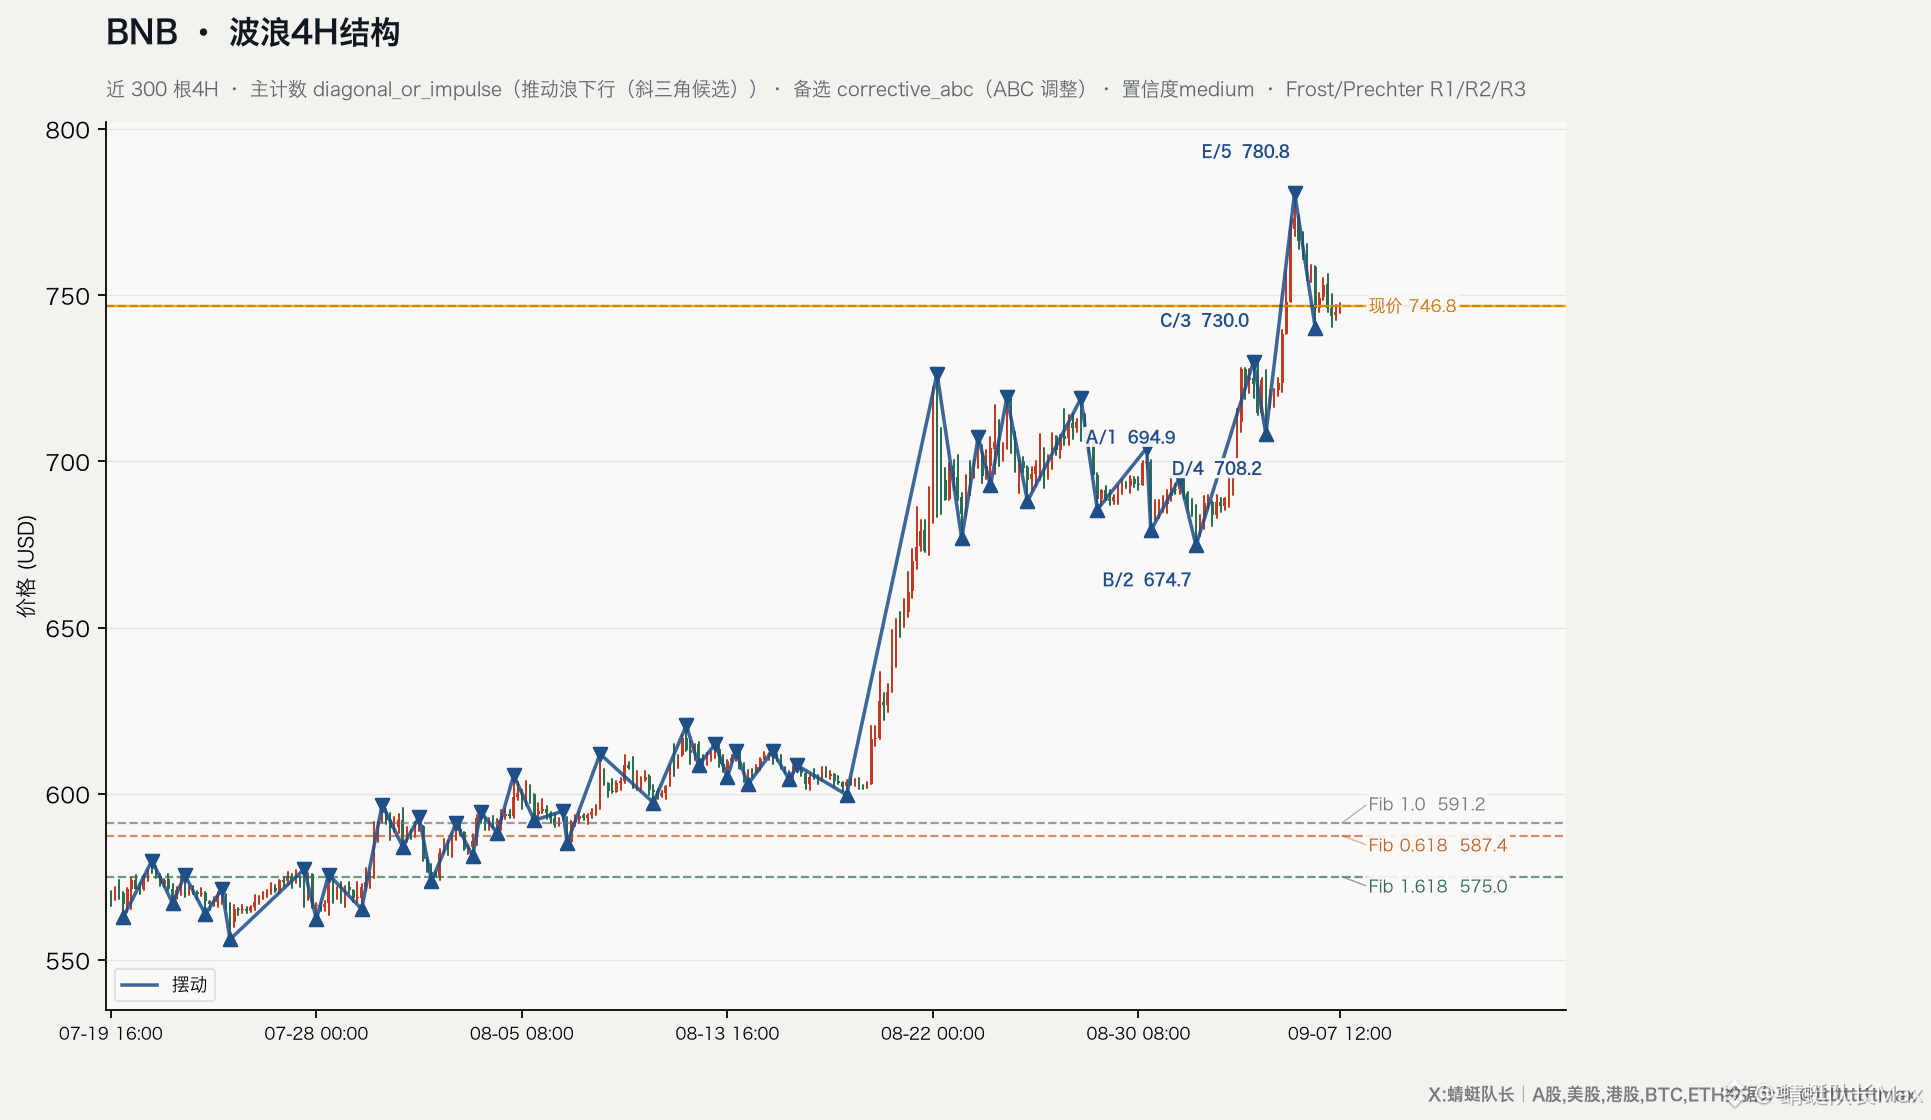
BNB’s current price is about 746.8. After pulling from 674.7 up to 780.8, the retracement low at 740.2 nearly hugged the Fib 0.382. The engine’s main count is still a pushing wave downward, but the window has stopped at 581 from early August. Tonight, if 0.382 holds, do we still acknowledge that jump to 780 as a correction first?
For the structure chart, see the cover. The blue line is the 4H swing; the recent labels are marked A/1 to E/5, and the dashed line on the right is the engine’s Fib. As of 12:00 UTC on September 7, 2026, this 4H candle hasn’t closed yet. Spot is from OKX: BNB around 746.8, BTC around 79547. The 24-hour high is 756.4, low is 740.2. I ran Frost and Prechter’s R1 R2 R3 over 300 4H candles. U.S. markets are closed today for Labor Day, and the cash market is off—crypto is still jumping.
【The engine is pinned to an old window】
The main count is pushing wave downward, and a slanted triangle candidate is marked. Score: 11. R1 and R2 passed, but R3 didn’t. The wave lengths are: w1 about 12.6, w3 about 19.3, w5 about 10.0—so the third wave isn’t the shortest. The fourth wave dropped into the first wave’s range, so it’s not a valid “standard pushing wave” count. The window is measured from the July 30 high of 596.7 down to the August 3 low of 581.2. Engine Fib 0.618 lands at 587.38. The alternative ABC scored only 2; confidence is medium. There are 51 swing points.
Current price at 746.8 is far above this set of old Fibs at 587.38. Use 587.38 to reference the box from early August, not as tonight’s observation level. 4H noise is higher than the daily chart, and the wave count isn’t unique.
【The near term has already taken another step】
Five days ago, this table was still asking whether 726.4 was finished. Later, 4H first moved above 730, and at 16:00 on Sept 5 it surged all the way to 780.8 in one go. On the chart, the near-term labels mark 694.9 as A/1, 674.7 as B/2, 730 as C/3, 708.2 as D/4, and 780.8 as E/5. Then at 12:00 on Sept 6 it printed 740.2 again; the label will lag by one swing. This 4H’s low at 740.4 was scanned again at 4:00 today, but it still isn’t enough to confirm 3 swings on both sides, so the engine hasn’t consolidated it into a new swing point.
From 674.7 to 780.8 is about 106 points. The Fib of this move: 0.236 at 755.8, 0.382 at 740.3, 0.5 at 727.8, 0.618 at 715.2. 740.2 is almost exactly on 0.382. The Fib of the rebound from 780.8 down to 740.2: 0.236 at 749.8, 0.382 at 755.7. The high at 756.4 hit 0.382 at 00:00 today, then it slipped back to 746.8. The pullback hasn’t stabilized above 749.8 yet.
The non-farm 4H low at 708.2 closed at 716.6. BNB didn’t smash through the box immediately the way Bitcoin did; the next day it kept pulling. The 0.5 of 708.2 to 780.8 is at 744.5, and the current price 746.8 is also near that level.
【Trade setups for comparison】
Short: wait for the pullback. First target zone: 755.7 to 756.4—today’s high is stacked right on the pullback’s 0.382. Second zone: 760.5. Third zone: 780.8. Abandon the short if the 4H closes above 780.8. For reference targets: first look at 740.2, then 727.8; below that are 715.2 and 708.2.
Long: current price has just moved away from 0.382; the position is a bit cleaner than being locked tightly to the mid-axis, so chasing longs is still crowded. First zone: 740.2. Second zone: 727.8. Third zone: 708.2, the non-farm 4H low. The 4H closed below 674.7, so the near-term jump from 674.7 is considered broken; the next stage needs a new count. For the pullback, first watch 756.4, then 760.5—only after that does 780.8 come into play.
Around 747, both sides get slapped. A cleaner approach is to pull back to 756 and then talk short, or wait until 740, then to 728, and then talk long. BTC is still churning around 79,600 near 80,000; BNB has already reclaimed that old high around 726. The door in front of us is now 780.
The next nail is still CPI on September 11. Holiday-session liquidity will be thin, and the 4H wicks will be even messier.
Will you look for a short on the pullback at 756, or wait until 740 to talk long? If 4H closes below 674.7, do you accept that the near-term wave is broken, or do you keep waiting for the same downward-wave setup from the old window?
$BNB $BTC #BNB #波浪理论 #加密
Captain Dragonfly|A finance blogger who likes analyzing data and candlesticks.
Not investment advice. Water level is only for reference—position sizing is up to you. 4H noise is higher than the daily chart, and the wave count isn’t unique.
BNB’s current price is about 746.8. After pulling from 674.7 up to 780.8, the retracement low at 740.2 nearly hugged the Fib 0.382. The engine’s main count is still a pushing wave downward, but the window has stopped at 581 from early August. Tonight, if 0.382 holds, do we still acknowledge that jump to 780 as a correction first?
For the structure chart, see the cover. The blue line is the 4H swing; the recent labels are marked A/1 to E/5, and the dashed line on the right is the engine’s Fib. As of 12:00 UTC on September 7, 2026, this 4H candle hasn’t closed yet. Spot is from OKX: BNB around 746.8, BTC around 79547. The 24-hour high is 756.4, low is 740.2. I ran Frost and Prechter’s R1 R2 R3 over 300 4H candles. U.S. markets are closed today for Labor Day, and the cash market is off—crypto is still jumping.
【The engine is pinned to an old window】
The main count is pushing wave downward, and a slanted triangle candidate is marked. Score: 11. R1 and R2 passed, but R3 didn’t. The wave lengths are: w1 about 12.6, w3 about 19.3, w5 about 10.0—so the third wave isn’t the shortest. The fourth wave dropped into the first wave’s range, so it’s not a valid “standard pushing wave” count. The window is measured from the July 30 high of 596.7 down to the August 3 low of 581.2. Engine Fib 0.618 lands at 587.38. The alternative ABC scored only 2; confidence is medium. There are 51 swing points.
Current price at 746.8 is far above this set of old Fibs at 587.38. Use 587.38 to reference the box from early August, not as tonight’s observation level. 4H noise is higher than the daily chart, and the wave count isn’t unique.
【The near term has already taken another step】
Five days ago, this table was still asking whether 726.4 was finished. Later, 4H first moved above 730, and at 16:00 on Sept 5 it surged all the way to 780.8 in one go. On the chart, the near-term labels mark 694.9 as A/1, 674.7 as B/2, 730 as C/3, 708.2 as D/4, and 780.8 as E/5. Then at 12:00 on Sept 6 it printed 740.2 again; the label will lag by one swing. This 4H’s low at 740.4 was scanned again at 4:00 today, but it still isn’t enough to confirm 3 swings on both sides, so the engine hasn’t consolidated it into a new swing point.
From 674.7 to 780.8 is about 106 points. The Fib of this move: 0.236 at 755.8, 0.382 at 740.3, 0.5 at 727.8, 0.618 at 715.2. 740.2 is almost exactly on 0.382. The Fib of the rebound from 780.8 down to 740.2: 0.236 at 749.8, 0.382 at 755.7. The high at 756.4 hit 0.382 at 00:00 today, then it slipped back to 746.8. The pullback hasn’t stabilized above 749.8 yet.
The non-farm 4H low at 708.2 closed at 716.6. BNB didn’t smash through the box immediately the way Bitcoin did; the next day it kept pulling. The 0.5 of 708.2 to 780.8 is at 744.5, and the current price 746.8 is also near that level.
【Trade setups for comparison】
Short: wait for the pullback. First target zone: 755.7 to 756.4—today’s high is stacked right on the pullback’s 0.382. Second zone: 760.5. Third zone: 780.8. Abandon the short if the 4H closes above 780.8. For reference targets: first look at 740.2, then 727.8; below that are 715.2 and 708.2.
Long: current price has just moved away from 0.382; the position is a bit cleaner than being locked tightly to the mid-axis, so chasing longs is still crowded. First zone: 740.2. Second zone: 727.8. Third zone: 708.2, the non-farm 4H low. The 4H closed below 674.7, so the near-term jump from 674.7 is considered broken; the next stage needs a new count. For the pullback, first watch 756.4, then 760.5—only after that does 780.8 come into play.
Around 747, both sides get slapped. A cleaner approach is to pull back to 756 and then talk short, or wait until 740, then to 728, and then talk long. BTC is still churning around 79,600 near 80,000; BNB has already reclaimed that old high around 726. The door in front of us is now 780.
The next nail is still CPI on September 11. Holiday-session liquidity will be thin, and the 4H wicks will be even messier.
Will you look for a short on the pullback at 756, or wait until 740 to talk long? If 4H closes below 674.7, do you accept that the near-term wave is broken, or do you keep waiting for the same downward-wave setup from the old window?
$BNB $BTC #BNB #波浪理论 #加密
Captain Dragonfly|A finance blogger who likes analyzing data and candlesticks.
Not investment advice. Water level is only for reference—position sizing is up to you. 4H noise is higher than the daily chart, and the wave count isn’t unique.
For the structure chart, see the cover. The blue line is the 4H swing; the recent labels are marked A/1 to E/5, and the dashed line on the right is the engine’s Fib. As of 12:00 UTC on September 7, 2026, this 4H candle hasn’t closed yet. Spot is from OKX: BNB around 746.8, BTC around 79547. The 24-hour high is 756.4, low is 740.2. I ran Frost and Prechter’s R1 R2 R3 over 300 4H candles. U.S. markets are closed today for Labor Day, and the cash market is off—crypto is still jumping.
【The engine is pinned to an old window】
The main count is pushing wave downward, and a slanted triangle candidate is marked. Score: 11. R1 and R2 passed, but R3 didn’t. The wave lengths are: w1 about 12.6, w3 about 19.3, w5 about 10.0—so the third wave isn’t the shortest. The fourth wave dropped into the first wave’s range, so it’s not a valid “standard pushing wave” count. The window is measured from the July 30 high of 596.7 down to the August 3 low of 581.2. Engine Fib 0.618 lands at 587.38. The alternative ABC scored only 2; confidence is medium. There are 51 swing points.
Current price at 746.8 is far above this set of old Fibs at 587.38. Use 587.38 to reference the box from early August, not as tonight’s observation level. 4H noise is higher than the daily chart, and the wave count isn’t unique.
【The near term has already taken another step】
Five days ago, this table was still asking whether 726.4 was finished. Later, 4H first moved above 730, and at 16:00 on Sept 5 it surged all the way to 780.8 in one go. On the chart, the near-term labels mark 694.9 as A/1, 674.7 as B/2, 730 as C/3, 708.2 as D/4, and 780.8 as E/5. Then at 12:00 on Sept 6 it printed 740.2 again; the label will lag by one swing. This 4H’s low at 740.4 was scanned again at 4:00 today, but it still isn’t enough to confirm 3 swings on both sides, so the engine hasn’t consolidated it into a new swing point.
From 674.7 to 780.8 is about 106 points. The Fib of this move: 0.236 at 755.8, 0.382 at 740.3, 0.5 at 727.8, 0.618 at 715.2. 740.2 is almost exactly on 0.382. The Fib of the rebound from 780.8 down to 740.2: 0.236 at 749.8, 0.382 at 755.7. The high at 756.4 hit 0.382 at 00:00 today, then it slipped back to 746.8. The pullback hasn’t stabilized above 749.8 yet.
The non-farm 4H low at 708.2 closed at 716.6. BNB didn’t smash through the box immediately the way Bitcoin did; the next day it kept pulling. The 0.5 of 708.2 to 780.8 is at 744.5, and the current price 746.8 is also near that level.
【Trade setups for comparison】
Short: wait for the pullback. First target zone: 755.7 to 756.4—today’s high is stacked right on the pullback’s 0.382. Second zone: 760.5. Third zone: 780.8. Abandon the short if the 4H closes above 780.8. For reference targets: first look at 740.2, then 727.8; below that are 715.2 and 708.2.
Long: current price has just moved away from 0.382; the position is a bit cleaner than being locked tightly to the mid-axis, so chasing longs is still crowded. First zone: 740.2. Second zone: 727.8. Third zone: 708.2, the non-farm 4H low. The 4H closed below 674.7, so the near-term jump from 674.7 is considered broken; the next stage needs a new count. For the pullback, first watch 756.4, then 760.5—only after that does 780.8 come into play.
Around 747, both sides get slapped. A cleaner approach is to pull back to 756 and then talk short, or wait until 740, then to 728, and then talk long. BTC is still churning around 79,600 near 80,000; BNB has already reclaimed that old high around 726. The door in front of us is now 780.
The next nail is still CPI on September 11. Holiday-session liquidity will be thin, and the 4H wicks will be even messier.
Will you look for a short on the pullback at 756, or wait until 740 to talk long? If 4H closes below 674.7, do you accept that the near-term wave is broken, or do you keep waiting for the same downward-wave setup from the old window?
$BNB $BTC #BNB #波浪理论 #加密
Captain Dragonfly|A finance blogger who likes analyzing data and candlesticks.
Not investment advice. Water level is only for reference—position sizing is up to you. 4H noise is higher than the daily chart, and the wave count isn’t unique.
95
·
--
ETH’s current price is around 2506, caught between the 2502 and 2507 Fib levels in the middle. At 0:00 today it touched 2536.5, but it still hasn’t broken above 2547. The engine’s main count is still pushing the upward wave, while the dashed line on the right is pinned to that old window from August at 1900. Tonight, first accept that 2547 won’t be crossed, or keep waiting for 2502 to hold before making another push?
See the cover for the structure chart. The blue line is the 4H swing; the recent section is labeled A/1 to E/5. The dashed line on the right is the engine Fib. As of 12:00 UTC on September 7, 2026, this 4H candle hasn’t closed yet. Spot is from OKX: ETH about 2506.5, BTC about 79620. The last 24 hours’ high is 2536.5 and the low is 2460. I ran Frost and Prechter’s R1 R2 R3 across 300 4H candles. U.S. markets are closed today for Labor Day, and crypto is still jumping.
【The engine is pinned to the old window】
The main count is pushing the trend wave upward, score 13; R1, R2, and R3 all pass. The long wave w1 is about 53.4, w3 about 72.7, w5 about 51.2; the third wave isn’t the shortest wave. The engine Fib uses the Aug 6 12:00 low of 1892 to the Aug 7 12:00 high of 1944. 0.618 lands at 1912. The alternative ABC count scores only 2—confidence is limited. There are 48 swing points.
The current price at 2506 is far above this set of old Fibs. Use 1912 only for comparison with that boxed area from early August; don’t treat it as tonight’s observation level. The 4H noise is higher than the daily timeframe, so the wave count isn’t unique.
【The near-term has already exited into a retracement】
On September 2 at 08:00, the low was 2357. On September 4 at 08:00, it hit 2547. That 4H candle during Non-Farm dumped from 2532 to 2431. On the chart, the near-term labels mark 2357 as A/1, 2547 as B/2, 2431 as C/3, 2524 as D/4, and 2460 as E/5. Then at 0:00 today it again printed 2536.5, so the label will lag by one swing. On Aug 27 there was another swing high at 2566.5, and this round didn’t touch back to the top or bottom.
From 2547 down to 2431, the retracement Fib has 0.618 at 2503 and 0.786 at 2522; 1.0 corresponds to 2547. 2536.5 already pushed past 0.786, roughly 10 points short of returning to 2547. The retracement climbed to the door and then turned back.
The big drop from 2357 to 2547 has a 0.236 at 2502. The near-term retracement from 2460 to 2536.5 has a 0.382 at 2507. The current price 2506 is sandwiched between these two levels. Today’s 4:00 low is 2475, which exactly tagged the 0.382 of the Non-Farm retracement—that level sits at 2475. Then it bought back 2502.
【Trade plan comparison】
Short: wait for a retracement. First target level: 2536.5 (today’s high). Second: 2547 (swing high before Non-Farm). Third: 2566.5 (the Aug 27 swing). Abandon the short if the 4H closes above 2547; if it closes above 2566.5 as well, don’t short again off this retracement. For the contrast targets: first look at 2502, then 2475, and only below that are 2460 and 2431.
Long: the current price is clinging to 2502 to 2507; it’s cleaner than the 2455 from two days ago, and it has already reclaimed the 0.5 of the big jump. Chasing a long still feels crowded. First target: 2475. Second: 2460. Third: 2431 (the Non-Farm 4H low), and it’s also close to the 0.618 of the big jump. If the 4H closes below 2357, then this jump from 2357 onward is considered broken; the next tier must be counted differently. For the retracement, look first at 2536.5, then 2547, and only last will 2566.5 come into play.
The 2502 area is easier to read than 2455. A cleaner approach is to retrace back into 2536 to 2547 and then discuss shorts, or wait until 2475 to go to 2431 and then discuss longs. BTC is still ranging around 79600 near 80000, and ETH has already bought back above 2500—2547 is still the same gate.
The next “nail” level is still CPI on September 11. Holiday-session liquidity is thin, so the 4H wicks will be even messier.
When it pulls back between 2536 and 2547, will you look for shorts, or will you wait until 2475 to talk longs? If the 4H closes below 2431, do you accept that the near-term wave structure is broken, or do you keep waiting for the old-window five-wave setup?
$ETH $BTC #以太坊 #波浪理论 #crypto
Captain Dragonfly|A finance blogger who likes analyzing data and candlesticks.
Not investment advice. Use these levels only for reference; position sizing is your own decision. 4H noise is higher than the daily timeframe, so the wave count isn’t unique.
ETH’s current price is around 2506, caught between the 2502 and 2507 Fib levels in the middle. At 0:00 today it touched 2536.5, but it still hasn’t broken above 2547. The engine’s main count is still pushing the upward wave, while the dashed line on the right is pinned to that old window from August at 1900. Tonight, first accept that 2547 won’t be crossed, or keep waiting for 2502 to hold before making another push?
See the cover for the structure chart. The blue line is the 4H swing; the recent section is labeled A/1 to E/5. The dashed line on the right is the engine Fib. As of 12:00 UTC on September 7, 2026, this 4H candle hasn’t closed yet. Spot is from OKX: ETH about 2506.5, BTC about 79620. The last 24 hours’ high is 2536.5 and the low is 2460. I ran Frost and Prechter’s R1 R2 R3 across 300 4H candles. U.S. markets are closed today for Labor Day, and crypto is still jumping.
【The engine is pinned to the old window】
The main count is pushing the trend wave upward, score 13; R1, R2, and R3 all pass. The long wave w1 is about 53.4, w3 about 72.7, w5 about 51.2; the third wave isn’t the shortest wave. The engine Fib uses the Aug 6 12:00 low of 1892 to the Aug 7 12:00 high of 1944. 0.618 lands at 1912. The alternative ABC count scores only 2—confidence is limited. There are 48 swing points.
The current price at 2506 is far above this set of old Fibs. Use 1912 only for comparison with that boxed area from early August; don’t treat it as tonight’s observation level. The 4H noise is higher than the daily timeframe, so the wave count isn’t unique.
【The near-term has already exited into a retracement】
On September 2 at 08:00, the low was 2357. On September 4 at 08:00, it hit 2547. That 4H candle during Non-Farm dumped from 2532 to 2431. On the chart, the near-term labels mark 2357 as A/1, 2547 as B/2, 2431 as C/3, 2524 as D/4, and 2460 as E/5. Then at 0:00 today it again printed 2536.5, so the label will lag by one swing. On Aug 27 there was another swing high at 2566.5, and this round didn’t touch back to the top or bottom.
From 2547 down to 2431, the retracement Fib has 0.618 at 2503 and 0.786 at 2522; 1.0 corresponds to 2547. 2536.5 already pushed past 0.786, roughly 10 points short of returning to 2547. The retracement climbed to the door and then turned back.
The big drop from 2357 to 2547 has a 0.236 at 2502. The near-term retracement from 2460 to 2536.5 has a 0.382 at 2507. The current price 2506 is sandwiched between these two levels. Today’s 4:00 low is 2475, which exactly tagged the 0.382 of the Non-Farm retracement—that level sits at 2475. Then it bought back 2502.
【Trade plan comparison】
Short: wait for a retracement. First target level: 2536.5 (today’s high). Second: 2547 (swing high before Non-Farm). Third: 2566.5 (the Aug 27 swing). Abandon the short if the 4H closes above 2547; if it closes above 2566.5 as well, don’t short again off this retracement. For the contrast targets: first look at 2502, then 2475, and only below that are 2460 and 2431.
Long: the current price is clinging to 2502 to 2507; it’s cleaner than the 2455 from two days ago, and it has already reclaimed the 0.5 of the big jump. Chasing a long still feels crowded. First target: 2475. Second: 2460. Third: 2431 (the Non-Farm 4H low), and it’s also close to the 0.618 of the big jump. If the 4H closes below 2357, then this jump from 2357 onward is considered broken; the next tier must be counted differently. For the retracement, look first at 2536.5, then 2547, and only last will 2566.5 come into play.
The 2502 area is easier to read than 2455. A cleaner approach is to retrace back into 2536 to 2547 and then discuss shorts, or wait until 2475 to go to 2431 and then discuss longs. BTC is still ranging around 79600 near 80000, and ETH has already bought back above 2500—2547 is still the same gate.
The next “nail” level is still CPI on September 11. Holiday-session liquidity is thin, so the 4H wicks will be even messier.
When it pulls back between 2536 and 2547, will you look for shorts, or will you wait until 2475 to talk longs? If the 4H closes below 2431, do you accept that the near-term wave structure is broken, or do you keep waiting for the old-window five-wave setup?
$ETH $BTC #以太坊 #波浪理论 #crypto
Captain Dragonfly|A finance blogger who likes analyzing data and candlesticks.
Not investment advice. Use these levels only for reference; position sizing is your own decision. 4H noise is higher than the daily timeframe, so the wave count isn’t unique.
See the cover for the structure chart. The blue line is the 4H swing; the recent section is labeled A/1 to E/5. The dashed line on the right is the engine Fib. As of 12:00 UTC on September 7, 2026, this 4H candle hasn’t closed yet. Spot is from OKX: ETH about 2506.5, BTC about 79620. The last 24 hours’ high is 2536.5 and the low is 2460. I ran Frost and Prechter’s R1 R2 R3 across 300 4H candles. U.S. markets are closed today for Labor Day, and crypto is still jumping.
【The engine is pinned to the old window】
The main count is pushing the trend wave upward, score 13; R1, R2, and R3 all pass. The long wave w1 is about 53.4, w3 about 72.7, w5 about 51.2; the third wave isn’t the shortest wave. The engine Fib uses the Aug 6 12:00 low of 1892 to the Aug 7 12:00 high of 1944. 0.618 lands at 1912. The alternative ABC count scores only 2—confidence is limited. There are 48 swing points.
The current price at 2506 is far above this set of old Fibs. Use 1912 only for comparison with that boxed area from early August; don’t treat it as tonight’s observation level. The 4H noise is higher than the daily timeframe, so the wave count isn’t unique.
【The near-term has already exited into a retracement】
On September 2 at 08:00, the low was 2357. On September 4 at 08:00, it hit 2547. That 4H candle during Non-Farm dumped from 2532 to 2431. On the chart, the near-term labels mark 2357 as A/1, 2547 as B/2, 2431 as C/3, 2524 as D/4, and 2460 as E/5. Then at 0:00 today it again printed 2536.5, so the label will lag by one swing. On Aug 27 there was another swing high at 2566.5, and this round didn’t touch back to the top or bottom.
From 2547 down to 2431, the retracement Fib has 0.618 at 2503 and 0.786 at 2522; 1.0 corresponds to 2547. 2536.5 already pushed past 0.786, roughly 10 points short of returning to 2547. The retracement climbed to the door and then turned back.
The big drop from 2357 to 2547 has a 0.236 at 2502. The near-term retracement from 2460 to 2536.5 has a 0.382 at 2507. The current price 2506 is sandwiched between these two levels. Today’s 4:00 low is 2475, which exactly tagged the 0.382 of the Non-Farm retracement—that level sits at 2475. Then it bought back 2502.
【Trade plan comparison】
Short: wait for a retracement. First target level: 2536.5 (today’s high). Second: 2547 (swing high before Non-Farm). Third: 2566.5 (the Aug 27 swing). Abandon the short if the 4H closes above 2547; if it closes above 2566.5 as well, don’t short again off this retracement. For the contrast targets: first look at 2502, then 2475, and only below that are 2460 and 2431.
Long: the current price is clinging to 2502 to 2507; it’s cleaner than the 2455 from two days ago, and it has already reclaimed the 0.5 of the big jump. Chasing a long still feels crowded. First target: 2475. Second: 2460. Third: 2431 (the Non-Farm 4H low), and it’s also close to the 0.618 of the big jump. If the 4H closes below 2357, then this jump from 2357 onward is considered broken; the next tier must be counted differently. For the retracement, look first at 2536.5, then 2547, and only last will 2566.5 come into play.
The 2502 area is easier to read than 2455. A cleaner approach is to retrace back into 2536 to 2547 and then discuss shorts, or wait until 2475 to go to 2431 and then discuss longs. BTC is still ranging around 79600 near 80000, and ETH has already bought back above 2500—2547 is still the same gate.
The next “nail” level is still CPI on September 11. Holiday-session liquidity is thin, so the 4H wicks will be even messier.
When it pulls back between 2536 and 2547, will you look for shorts, or will you wait until 2475 to talk longs? If the 4H closes below 2431, do you accept that the near-term wave structure is broken, or do you keep waiting for the old-window five-wave setup?
$ETH $BTC #以太坊 #波浪理论 #crypto
Captain Dragonfly|A finance blogger who likes analyzing data and candlesticks.
Not investment advice. Use these levels only for reference; position sizing is your own decision. 4H noise is higher than the daily timeframe, so the wave count isn’t unique.

132
·
--
BTC current price is about 79,610, right sitting on the Fib 0.5 of the leg from 78,650 to 80,555. The engine’s main count is still pushing the wave upward, but the dashed line on the right is still pinned to the old window around 64,000. If 0.5 holds tonight, do we first recognize the near-term wave as just grinding forward—or do we acknowledge the near-term move is the one to watch?
See the cover for the structure chart. The blue line is the 4H swing; the near-term labels mark A/1 to E/5, and the dashed line on the right is the engine’s Fib. As of 12:00 UTC on September 7, 2026, this 4H candle has not closed yet. The current price is from OKX, about 79,610. The 24-hour high is 80,555 and the low is 79,000. I ran Frost and Prechter’s R1 R2 R3 across 300 4H candles.
Today the U.S. market is closed for Labor Day, the cash market is off, and crypto is still bouncing.
【The engine is pinned to the old window】
The main count is pushing the wave upward, score 13; R1, R2, and R3 all pass. Wave length w1 is about 1531, w3 about 2243, w5 about 1146—so the third wave is not the shortest wave. The engine’s Fib is taken from the low at 12:00 on Aug 5, 63,881 to the high at 20:00 on Aug 5, 65,027. 0.618 lands at 64,318. The alternative ABC has a score of only 2. Confidence is mid. There are 48 swing points.
The current price 79,610 is far above this set of old Fibs. 64,318 is for comparison with that box at the beginning of August, not for tonight’s observation level. The 4H noise is higher than the daily chart, so the wave count isn’t unique.
【The near-term has already played out a rebound】
The low at 08:00 on Sep 2 was 76,261. On Sep 3 at 20:00 it hit 82,285. That 4H candle from Nonfarm dropped from 81,346 down to 78,650. On the chart, the near-term labels set 76,261 as A/1, 82,285 as B/2, 78,650 as C/3, 80,198 as D/4, and 79,199 as E/5. Then on Sep 6 at 20:00 it struck 80,555 again; the label will lag by one swing. 79,000 came from the 4:00 candle today—there still aren’t enough than 3 candles on both sides for confirmation, so the engine hasn’t collected it into swing points.
On the rebound from 82,285 down to 78,650, Fib 0.5 is at 80,468 and 0.618 at 80,896. 80,555 is almost sitting on 0.5; it didn’t tag 0.618, and it also didn’t tag the big jump’s 0.236— that level is at 80,863. The rebound turned back halfway.
From 78,650 up to 80,555, Fib 0.5 lands exactly at 79,603. The current price 79,610 is sitting on it. 0.618 is at 79,378. Today’s 08:00 low at 79,280 has already swept through it. 0.786 is at 79,058. The low at 79,000 from the 4:00 candle today stabbed up from below once, and the close returned to 79,401. The big jump’s 0.5 at 79,273 was also swept through.
【Trade scenarios for comparison】
Short: wait for the pullback. First target around 80,040—this corresponds to the 0.382 from 82,285 to 78,650 and is also near a round-number level. Second target at 80,555, which was yesterday’s high. Third target around 80,860 to 80,900—this is where the big jump’s 0.236 overlaps with the 0.618 of the Nonfarm retracement. Abandon the idea of shorting and instead look for a 4H close above 82,285. For the comparison targets: first look at 79,378, then 79,000; below that are 78,650 and 76,261.
Long: the current price is pressed against 0.5, so the positioning is crowded. First target 79,378 to 79,280. Second target 79,000. Third target 78,650—this is the Nonfarm 4H low and also close to the big jump’s 0.618. If the 4H closes below 76,261, then the near-term leg from 76,261 up is considered broken; the next leg will need a different count. For the rebound: look first at 80,040, then 80,555, and only then does 82,285 come into play.
Around 79,600, you can get slapped from both sides. A cleaner approach is to short after a pullback to 80,040, or wait until 79,000 and then talk about longs again at 78,650.
The next “nail” is still September 11 CPI. Holiday trading has thin liquidity, so the 4H wicks will look even messier.
Will you look for a short on the pullback to 80,040, or wait until 79,000 to talk about longs? If the 4H closes below 78,650, do you accept that the near-term wave is broken—or do you continue to wait for the old-window five-wave scenario?
$BTC #比特币 #波浪理论 #crypto
Dragonfly Captain|A finance blogger who likes analyzing data and candlesticks.
Not investment advice. Levels are for reference only; position sizing is your own decision. 4H noise is higher than the daily chart, and the wave count isn’t unique.
BTC current price is about 79,610, right sitting on the Fib 0.5 of the leg from 78,650 to 80,555. The engine’s main count is still pushing the wave upward, but the dashed line on the right is still pinned to the old window around 64,000. If 0.5 holds tonight, do we first recognize the near-term wave as just grinding forward—or do we acknowledge the near-term move is the one to watch?
See the cover for the structure chart. The blue line is the 4H swing; the near-term labels mark A/1 to E/5, and the dashed line on the right is the engine’s Fib. As of 12:00 UTC on September 7, 2026, this 4H candle has not closed yet. The current price is from OKX, about 79,610. The 24-hour high is 80,555 and the low is 79,000. I ran Frost and Prechter’s R1 R2 R3 across 300 4H candles.
Today the U.S. market is closed for Labor Day, the cash market is off, and crypto is still bouncing.
【The engine is pinned to the old window】
The main count is pushing the wave upward, score 13; R1, R2, and R3 all pass. Wave length w1 is about 1531, w3 about 2243, w5 about 1146—so the third wave is not the shortest wave. The engine’s Fib is taken from the low at 12:00 on Aug 5, 63,881 to the high at 20:00 on Aug 5, 65,027. 0.618 lands at 64,318. The alternative ABC has a score of only 2. Confidence is mid. There are 48 swing points.
The current price 79,610 is far above this set of old Fibs. 64,318 is for comparison with that box at the beginning of August, not for tonight’s observation level. The 4H noise is higher than the daily chart, so the wave count isn’t unique.
【The near-term has already played out a rebound】
The low at 08:00 on Sep 2 was 76,261. On Sep 3 at 20:00 it hit 82,285. That 4H candle from Nonfarm dropped from 81,346 down to 78,650. On the chart, the near-term labels set 76,261 as A/1, 82,285 as B/2, 78,650 as C/3, 80,198 as D/4, and 79,199 as E/5. Then on Sep 6 at 20:00 it struck 80,555 again; the label will lag by one swing. 79,000 came from the 4:00 candle today—there still aren’t enough than 3 candles on both sides for confirmation, so the engine hasn’t collected it into swing points.
On the rebound from 82,285 down to 78,650, Fib 0.5 is at 80,468 and 0.618 at 80,896. 80,555 is almost sitting on 0.5; it didn’t tag 0.618, and it also didn’t tag the big jump’s 0.236— that level is at 80,863. The rebound turned back halfway.
From 78,650 up to 80,555, Fib 0.5 lands exactly at 79,603. The current price 79,610 is sitting on it. 0.618 is at 79,378. Today’s 08:00 low at 79,280 has already swept through it. 0.786 is at 79,058. The low at 79,000 from the 4:00 candle today stabbed up from below once, and the close returned to 79,401. The big jump’s 0.5 at 79,273 was also swept through.
【Trade scenarios for comparison】
Short: wait for the pullback. First target around 80,040—this corresponds to the 0.382 from 82,285 to 78,650 and is also near a round-number level. Second target at 80,555, which was yesterday’s high. Third target around 80,860 to 80,900—this is where the big jump’s 0.236 overlaps with the 0.618 of the Nonfarm retracement. Abandon the idea of shorting and instead look for a 4H close above 82,285. For the comparison targets: first look at 79,378, then 79,000; below that are 78,650 and 76,261.
Long: the current price is pressed against 0.5, so the positioning is crowded. First target 79,378 to 79,280. Second target 79,000. Third target 78,650—this is the Nonfarm 4H low and also close to the big jump’s 0.618. If the 4H closes below 76,261, then the near-term leg from 76,261 up is considered broken; the next leg will need a different count. For the rebound: look first at 80,040, then 80,555, and only then does 82,285 come into play.
Around 79,600, you can get slapped from both sides. A cleaner approach is to short after a pullback to 80,040, or wait until 79,000 and then talk about longs again at 78,650.
The next “nail” is still September 11 CPI. Holiday trading has thin liquidity, so the 4H wicks will look even messier.
Will you look for a short on the pullback to 80,040, or wait until 79,000 to talk about longs? If the 4H closes below 78,650, do you accept that the near-term wave is broken—or do you continue to wait for the old-window five-wave scenario?
$BTC #比特币 #波浪理论 #crypto
Dragonfly Captain|A finance blogger who likes analyzing data and candlesticks.
Not investment advice. Levels are for reference only; position sizing is your own decision. 4H noise is higher than the daily chart, and the wave count isn’t unique.
See the cover for the structure chart. The blue line is the 4H swing; the near-term labels mark A/1 to E/5, and the dashed line on the right is the engine’s Fib. As of 12:00 UTC on September 7, 2026, this 4H candle has not closed yet. The current price is from OKX, about 79,610. The 24-hour high is 80,555 and the low is 79,000. I ran Frost and Prechter’s R1 R2 R3 across 300 4H candles.
Today the U.S. market is closed for Labor Day, the cash market is off, and crypto is still bouncing.
【The engine is pinned to the old window】
The main count is pushing the wave upward, score 13; R1, R2, and R3 all pass. Wave length w1 is about 1531, w3 about 2243, w5 about 1146—so the third wave is not the shortest wave. The engine’s Fib is taken from the low at 12:00 on Aug 5, 63,881 to the high at 20:00 on Aug 5, 65,027. 0.618 lands at 64,318. The alternative ABC has a score of only 2. Confidence is mid. There are 48 swing points.
The current price 79,610 is far above this set of old Fibs. 64,318 is for comparison with that box at the beginning of August, not for tonight’s observation level. The 4H noise is higher than the daily chart, so the wave count isn’t unique.
【The near-term has already played out a rebound】
The low at 08:00 on Sep 2 was 76,261. On Sep 3 at 20:00 it hit 82,285. That 4H candle from Nonfarm dropped from 81,346 down to 78,650. On the chart, the near-term labels set 76,261 as A/1, 82,285 as B/2, 78,650 as C/3, 80,198 as D/4, and 79,199 as E/5. Then on Sep 6 at 20:00 it struck 80,555 again; the label will lag by one swing. 79,000 came from the 4:00 candle today—there still aren’t enough than 3 candles on both sides for confirmation, so the engine hasn’t collected it into swing points.
On the rebound from 82,285 down to 78,650, Fib 0.5 is at 80,468 and 0.618 at 80,896. 80,555 is almost sitting on 0.5; it didn’t tag 0.618, and it also didn’t tag the big jump’s 0.236— that level is at 80,863. The rebound turned back halfway.
From 78,650 up to 80,555, Fib 0.5 lands exactly at 79,603. The current price 79,610 is sitting on it. 0.618 is at 79,378. Today’s 08:00 low at 79,280 has already swept through it. 0.786 is at 79,058. The low at 79,000 from the 4:00 candle today stabbed up from below once, and the close returned to 79,401. The big jump’s 0.5 at 79,273 was also swept through.
【Trade scenarios for comparison】
Short: wait for the pullback. First target around 80,040—this corresponds to the 0.382 from 82,285 to 78,650 and is also near a round-number level. Second target at 80,555, which was yesterday’s high. Third target around 80,860 to 80,900—this is where the big jump’s 0.236 overlaps with the 0.618 of the Nonfarm retracement. Abandon the idea of shorting and instead look for a 4H close above 82,285. For the comparison targets: first look at 79,378, then 79,000; below that are 78,650 and 76,261.
Long: the current price is pressed against 0.5, so the positioning is crowded. First target 79,378 to 79,280. Second target 79,000. Third target 78,650—this is the Nonfarm 4H low and also close to the big jump’s 0.618. If the 4H closes below 76,261, then the near-term leg from 76,261 up is considered broken; the next leg will need a different count. For the rebound: look first at 80,040, then 80,555, and only then does 82,285 come into play.
Around 79,600, you can get slapped from both sides. A cleaner approach is to short after a pullback to 80,040, or wait until 79,000 and then talk about longs again at 78,650.
The next “nail” is still September 11 CPI. Holiday trading has thin liquidity, so the 4H wicks will look even messier.
Will you look for a short on the pullback to 80,040, or wait until 79,000 to talk about longs? If the 4H closes below 78,650, do you accept that the near-term wave is broken—or do you continue to wait for the old-window five-wave scenario?
$BTC #比特币 #波浪理论 #crypto
Dragonfly Captain|A finance blogger who likes analyzing data and candlesticks.
Not investment advice. Levels are for reference only; position sizing is your own decision. 4H noise is higher than the daily chart, and the wave count isn’t unique.

101
·
--
US stocks are closed today. The New York Stock Exchange and Nasdaq are closed for Labor Day. There is no pre-market in the cash market. On Friday, semiconductors ran ahead of discretionary. When the market opens on Tuesday, who will you watch first?
For comparison, see the cover. I ran through a single page of the US stock pre-market section in the warehouse, and the script was marked as pre-market according to the New York Eastern time clock. But in the row for individual stocks and ETFs, everything showed Friday’s regular-session gains and losses. The futures daily chart has a different candle as well—a holiday candle dated September 7. The current price comes from Yahoo Finance. When I wrote this, it was 20:50 Beijing time on September 7, 2026, which corresponds to 8:50 a.m. Eastern time.
【No opening today】
Both Yahoo Finance and the NYSE holiday calendar list September 7 as a market holiday. The bond market is also closed. Chicago Mercantile Exchange index futures opened on Sunday night; on Labor Day, matching stops at 12:00 p.m. Central time and resumes at 5:00 p.m. for Tuesday’s trading day. We’re still in this holiday session right now—matching can probably continue for a few more hours.
【What’s left split from Friday】
The S&P 500 closed at 7,718.60, down 0.38%. The Nasdaq Composite closed at 26,506.99, down 0.29%. The Dow closed at 53,414.25, down 0.51%. The volatility index was 15.25, up 4.96%. The 10-year U.S. Treasury yield was 4.78%. The S&P ETF (SPY) closed at 770.19, down 0.39%. The Nasdaq 100 ETF closed at 718.96, up 0.18%. The indices don’t look too scary, but the sectors are already splitting into two paths.
The Semiconductor ETF closed at 567.01, up 2.61%. The Technology ETF was up 0.70%. The Discretionary Consumption ETF closed at 114.91, down 1.33%. Healthcare was down 1.04%, Energy down 0.87%, and Financials down 0.79%. Of the 9 names in the watchlist, 4 were up and 5 were down. The stronger side was AMD up 4.69% to 477.57, Meta up 1.00%, and Nvidia up 0.84%. The weaker side was Tesla down 5.92% to 354.08, Apple down 2.51%, and Microsoft down 2.04%.
That Tesla move lines up with publicly reported news. On Thursday’s Cybercab event in Austin, there was no livestream and Musk didn’t attend. RBC’s note didn’t clarify pricing, production capacity timing, or regulatory matters. On the same day, the U.S. National Highway Traffic Safety Administration opened an audit inquiry into Cybercab’s self-certification. On Friday, CNBC reported a drop of about 6%. On Thursday, it had risen about 5.4%. The consumer sector was dragged back by that. On the semiconductor side, I don’t have a standalone company announcement I can tie to it, so I’ll treat it as Friday’s closing breadth—not as an intraday story I actually saw.
【Holiday futures are still settling near Friday】
The script shows ES down 0.42% on an overnight basis. That’s the Friday settlement at 7,722 versus Thursday at 7,754.75. Today’s holiday candle opened at 7,715.50, with a high of 7,728.50 and a low of 7,703.50; the current price is still hugging 7,722. NQ’s Friday settlement was 29,565.25. Today opened at 29,535.25, with a high of 29,683.50 and a low of 29,530.50; the current price is still 29,565. The cash index has no trades today. Don’t mix up Friday’s stock gains and losses with the holiday futures snapshot from this morning.
【This week’s calendar】
The cash market resumes on Tuesday, September 8. On Thursday, the U.S. Bureau of Labor Statistics will release August PPI. Oracle and Adobe will report earnings after the close. The news from Oracle says its earnings will be after the close on September 10. On Friday, August CPI—at 8:30 a.m. Eastern. After that come the interest-rate decisions from September 15 to 16, with a dot plot. After last week’s hot jobs data, the implied probability of a September rate hike in the futures market fell back to around 60%. CPI is still the judge.
【How to use it】
Liquidity is thin in the holiday session. ES is still attached to Friday’s settlement, which suggests that the weekend didn’t fully finish trading the split between semiconductors and discretionary. On Tuesday, first see whether the Semiconductor ETF can hold near Friday’s 567. Is anyone buying back into Discretionary Consumption around 114.91? Tesla at 354.00 needs to be checked first whether that Thursday rebound is still there. Rate-hike pricing has to wait until Friday’s inflation prints.
When Tuesday opens, will you follow semiconductors continuing from Friday, or wait for discretionary to fill the gap back in?
$SPY $QQQ #美股盘前 #Labor Day
Captain of the Dragonfly Team|A finance blogger who likes analyzing data and candlestick charts.
The cash market snapshot is Friday’s close; the futures snapshot is from the holiday session. This does not constitute investment advice.
US stocks are closed today. The New York Stock Exchange and Nasdaq are closed for Labor Day. There is no pre-market in the cash market. On Friday, semiconductors ran ahead of discretionary. When the market opens on Tuesday, who will you watch first?
For comparison, see the cover. I ran through a single page of the US stock pre-market section in the warehouse, and the script was marked as pre-market according to the New York Eastern time clock. But in the row for individual stocks and ETFs, everything showed Friday’s regular-session gains and losses. The futures daily chart has a different candle as well—a holiday candle dated September 7. The current price comes from Yahoo Finance. When I wrote this, it was 20:50 Beijing time on September 7, 2026, which corresponds to 8:50 a.m. Eastern time.
【No opening today】
Both Yahoo Finance and the NYSE holiday calendar list September 7 as a market holiday. The bond market is also closed. Chicago Mercantile Exchange index futures opened on Sunday night; on Labor Day, matching stops at 12:00 p.m. Central time and resumes at 5:00 p.m. for Tuesday’s trading day. We’re still in this holiday session right now—matching can probably continue for a few more hours.
【What’s left split from Friday】
The S&P 500 closed at 7,718.60, down 0.38%. The Nasdaq Composite closed at 26,506.99, down 0.29%. The Dow closed at 53,414.25, down 0.51%. The volatility index was 15.25, up 4.96%. The 10-year U.S. Treasury yield was 4.78%. The S&P ETF (SPY) closed at 770.19, down 0.39%. The Nasdaq 100 ETF closed at 718.96, up 0.18%. The indices don’t look too scary, but the sectors are already splitting into two paths.
The Semiconductor ETF closed at 567.01, up 2.61%. The Technology ETF was up 0.70%. The Discretionary Consumption ETF closed at 114.91, down 1.33%. Healthcare was down 1.04%, Energy down 0.87%, and Financials down 0.79%. Of the 9 names in the watchlist, 4 were up and 5 were down. The stronger side was AMD up 4.69% to 477.57, Meta up 1.00%, and Nvidia up 0.84%. The weaker side was Tesla down 5.92% to 354.08, Apple down 2.51%, and Microsoft down 2.04%.
That Tesla move lines up with publicly reported news. On Thursday’s Cybercab event in Austin, there was no livestream and Musk didn’t attend. RBC’s note didn’t clarify pricing, production capacity timing, or regulatory matters. On the same day, the U.S. National Highway Traffic Safety Administration opened an audit inquiry into Cybercab’s self-certification. On Friday, CNBC reported a drop of about 6%. On Thursday, it had risen about 5.4%. The consumer sector was dragged back by that. On the semiconductor side, I don’t have a standalone company announcement I can tie to it, so I’ll treat it as Friday’s closing breadth—not as an intraday story I actually saw.
【Holiday futures are still settling near Friday】
The script shows ES down 0.42% on an overnight basis. That’s the Friday settlement at 7,722 versus Thursday at 7,754.75. Today’s holiday candle opened at 7,715.50, with a high of 7,728.50 and a low of 7,703.50; the current price is still hugging 7,722. NQ’s Friday settlement was 29,565.25. Today opened at 29,535.25, with a high of 29,683.50 and a low of 29,530.50; the current price is still 29,565. The cash index has no trades today. Don’t mix up Friday’s stock gains and losses with the holiday futures snapshot from this morning.
【This week’s calendar】
The cash market resumes on Tuesday, September 8. On Thursday, the U.S. Bureau of Labor Statistics will release August PPI. Oracle and Adobe will report earnings after the close. The news from Oracle says its earnings will be after the close on September 10. On Friday, August CPI—at 8:30 a.m. Eastern. After that come the interest-rate decisions from September 15 to 16, with a dot plot. After last week’s hot jobs data, the implied probability of a September rate hike in the futures market fell back to around 60%. CPI is still the judge.
【How to use it】
Liquidity is thin in the holiday session. ES is still attached to Friday’s settlement, which suggests that the weekend didn’t fully finish trading the split between semiconductors and discretionary. On Tuesday, first see whether the Semiconductor ETF can hold near Friday’s 567. Is anyone buying back into Discretionary Consumption around 114.91? Tesla at 354.00 needs to be checked first whether that Thursday rebound is still there. Rate-hike pricing has to wait until Friday’s inflation prints.
When Tuesday opens, will you follow semiconductors continuing from Friday, or wait for discretionary to fill the gap back in?
$SPY $QQQ #美股盘前 #Labor Day
Captain of the Dragonfly Team|A finance blogger who likes analyzing data and candlestick charts.
The cash market snapshot is Friday’s close; the futures snapshot is from the holiday session. This does not constitute investment advice.
For comparison, see the cover. I ran through a single page of the US stock pre-market section in the warehouse, and the script was marked as pre-market according to the New York Eastern time clock. But in the row for individual stocks and ETFs, everything showed Friday’s regular-session gains and losses. The futures daily chart has a different candle as well—a holiday candle dated September 7. The current price comes from Yahoo Finance. When I wrote this, it was 20:50 Beijing time on September 7, 2026, which corresponds to 8:50 a.m. Eastern time.
【No opening today】
Both Yahoo Finance and the NYSE holiday calendar list September 7 as a market holiday. The bond market is also closed. Chicago Mercantile Exchange index futures opened on Sunday night; on Labor Day, matching stops at 12:00 p.m. Central time and resumes at 5:00 p.m. for Tuesday’s trading day. We’re still in this holiday session right now—matching can probably continue for a few more hours.
【What’s left split from Friday】
The S&P 500 closed at 7,718.60, down 0.38%. The Nasdaq Composite closed at 26,506.99, down 0.29%. The Dow closed at 53,414.25, down 0.51%. The volatility index was 15.25, up 4.96%. The 10-year U.S. Treasury yield was 4.78%. The S&P ETF (SPY) closed at 770.19, down 0.39%. The Nasdaq 100 ETF closed at 718.96, up 0.18%. The indices don’t look too scary, but the sectors are already splitting into two paths.
The Semiconductor ETF closed at 567.01, up 2.61%. The Technology ETF was up 0.70%. The Discretionary Consumption ETF closed at 114.91, down 1.33%. Healthcare was down 1.04%, Energy down 0.87%, and Financials down 0.79%. Of the 9 names in the watchlist, 4 were up and 5 were down. The stronger side was AMD up 4.69% to 477.57, Meta up 1.00%, and Nvidia up 0.84%. The weaker side was Tesla down 5.92% to 354.08, Apple down 2.51%, and Microsoft down 2.04%.
That Tesla move lines up with publicly reported news. On Thursday’s Cybercab event in Austin, there was no livestream and Musk didn’t attend. RBC’s note didn’t clarify pricing, production capacity timing, or regulatory matters. On the same day, the U.S. National Highway Traffic Safety Administration opened an audit inquiry into Cybercab’s self-certification. On Friday, CNBC reported a drop of about 6%. On Thursday, it had risen about 5.4%. The consumer sector was dragged back by that. On the semiconductor side, I don’t have a standalone company announcement I can tie to it, so I’ll treat it as Friday’s closing breadth—not as an intraday story I actually saw.
【Holiday futures are still settling near Friday】
The script shows ES down 0.42% on an overnight basis. That’s the Friday settlement at 7,722 versus Thursday at 7,754.75. Today’s holiday candle opened at 7,715.50, with a high of 7,728.50 and a low of 7,703.50; the current price is still hugging 7,722. NQ’s Friday settlement was 29,565.25. Today opened at 29,535.25, with a high of 29,683.50 and a low of 29,530.50; the current price is still 29,565. The cash index has no trades today. Don’t mix up Friday’s stock gains and losses with the holiday futures snapshot from this morning.
【This week’s calendar】
The cash market resumes on Tuesday, September 8. On Thursday, the U.S. Bureau of Labor Statistics will release August PPI. Oracle and Adobe will report earnings after the close. The news from Oracle says its earnings will be after the close on September 10. On Friday, August CPI—at 8:30 a.m. Eastern. After that come the interest-rate decisions from September 15 to 16, with a dot plot. After last week’s hot jobs data, the implied probability of a September rate hike in the futures market fell back to around 60%. CPI is still the judge.
【How to use it】
Liquidity is thin in the holiday session. ES is still attached to Friday’s settlement, which suggests that the weekend didn’t fully finish trading the split between semiconductors and discretionary. On Tuesday, first see whether the Semiconductor ETF can hold near Friday’s 567. Is anyone buying back into Discretionary Consumption around 114.91? Tesla at 354.00 needs to be checked first whether that Thursday rebound is still there. Rate-hike pricing has to wait until Friday’s inflation prints.
When Tuesday opens, will you follow semiconductors continuing from Friday, or wait for discretionary to fill the gap back in?
$SPY $QQQ #美股盘前 #Labor Day
Captain of the Dragonfly Team|A finance blogger who likes analyzing data and candlestick charts.
The cash market snapshot is Friday’s close; the futures snapshot is from the holiday session. This does not constitute investment advice.

1
158
·
--
Over the weekend, the Ministry of Finance put 300 billion yuan of special treasury bonds on the table, and ICBC and ABC together plan to raise no more than 260 billion yuan. When the market opens on Monday, will this money first lift the banks, or will it keep getting buried by selling in tech stocks?
See the process chart on the cover. I cross-checked Xinhua Finance's Friday market wrap, CCTV News's bank announcements, the People's Daily article on the special treasury bonds, and pre-market quotes from East Money and Sina. The PBOC's official announcement page could not be opened directly that day, so I used Xinhua's relay for the buyout reverse repo. The draft was written around 2026-09-07 09:10 Beijing time, before A-shares had even entered call auction.
【What was left from last Friday】
Xinhua Finance recorded a high-open, low-close session. The Shanghai Composite closed at 3930.12, down 0.30%, with turnover of about 938.3 billion yuan. The Shenzhen Component closed at 13516.97, down 0.79%. The ChiNext Index closed at 3286.55, down 0.78%. The STAR Market Composite closed at 1865.37, down 2.16%. East Money's pre-market board still showed the STAR 50 at 1577.36 and the CSI 300 at 4548.05, matching Friday's close. Combined turnover across the two markets was about 2.03 trillion yuan.
On the board, pork, seed stocks, liquor, and media were still rising. Computing power, semiconductors, and liquid cooling were sold off in the afternoon. East Money's limit-up pool recorded 39 names. The highest was Longban Media, with 5 straight limit-up days. The market's height is still there, but the money-making effect has already shrunk to the application and consumption segments.
Shanghai Securities News wrote today that weekly turnover has fallen from the earlier peak of 3.5 trillion yuan back to the 2 trillion yuan center. Soochow Securities attributed the shrinkage to the fading of the broad AI theme, and also noted that with Mid-Autumn Festival and National Day back-to-back, there are only about 14 trading days left in the pre-holiday window.
【Two official items over the weekend】
People's Daily ran the story today. The Ministry of Finance will soon issue 300 billion yuan of special treasury bonds to support eight central financial institutions in replenishing core Tier-1 capital. In the September 6 announcement, ABC plans to raise no more than 160 billion yuan, of which the Ministry of Finance will subscribe 130 billion yuan. ICBC plans to raise no more than 100 billion yuan, of which the Ministry of Finance will subscribe 70 billion yuan. The remaining portion will mainly be subscribed by China Tobacco General Corporation and its subsidiaries. The subscribers are listed in the targeted share issuance plan, which still needs review and registration.
On the same day, China Exim Bank, Sinosure, China Life, Taiping, PICC, and China Re were also on the capital increase list. The money goes into capital, used to support lending and solvency, and it will not turn into market turnover in the first minute after the open.
On the central bank side, Xinhua reported the September 4 announcement. Today it will conduct 500 billion yuan of 89-day buyout reverse repos. The same maturity amount expires this month as well, so this is a rollover in the same amount. In the previous two months, it had added 200 billion yuan. Liquidity has not hit the brakes hard, but there was also no extra step on the accelerator.
【The overnight session gives no direction】
Friday's U.S. nonfarm data was relatively hot. The Dow closed at 53414.25, down 0.51%. The S&P 500 closed at 7718.60, down 0.38%. The Nasdaq closed at 26506.99, down 0.29%. The Philadelphia Semiconductor Index instead rose 3.37%. The U.S. market is closed today for Labor Day, so A-shares have no new U.S. intraday reference for the open.
The Singapore A50 continuous contract, as of 09:10, was reported by East Money at 14712, up 0.4%, about 59 points higher. Sina's FTSE China A50 futures were also at 14712 at the same time. A half-percent premium is not enough to determine the opening direction on its own. The Hang Seng Index pre-market was still at 25650.87, and Hong Kong stocks had not really opened either.
【How I am reading it】
Monday looks more like a re-pricing of sentiment. The A50 is only up half a percent, and U.S. markets are still closed. At the open, the first thing to watch is whether banks and insurers are buying into the announcements, and whether tech continues to be sold off after Friday's unfinished distribution. The Shanghai Composite is hovering around 3930, and today the first question is whether it can hold Friday's closing area. If it cannot, then the so-called "bottom support" discussed in the Shanghai Securities News will need another test.
The limit-up height is still at the Longban Media level. For high-position continuation, watch whether it can hold at the open. If it can hold, application-related names may still breathe a little. If it cannot, short-term sentiment will cool first.
At the open, will you first watch whether ICBC and ABC get buyers, or whether tech stocks keep being used for distribution?
#A股 #盘前 #banking
Dragonfly Captain | A financial blogger who likes analyzing data and candlestick charts.
Not investment advice. Index levels are subject to exchange data, and policies are subject to the original announcement text.
Over the weekend, the Ministry of Finance put 300 billion yuan of special treasury bonds on the table, and ICBC and ABC together plan to raise no more than 260 billion yuan. When the market opens on Monday, will this money first lift the banks, or will it keep getting buried by selling in tech stocks?
See the process chart on the cover. I cross-checked Xinhua Finance's Friday market wrap, CCTV News's bank announcements, the People's Daily article on the special treasury bonds, and pre-market quotes from East Money and Sina. The PBOC's official announcement page could not be opened directly that day, so I used Xinhua's relay for the buyout reverse repo. The draft was written around 2026-09-07 09:10 Beijing time, before A-shares had even entered call auction.
【What was left from last Friday】
Xinhua Finance recorded a high-open, low-close session. The Shanghai Composite closed at 3930.12, down 0.30%, with turnover of about 938.3 billion yuan. The Shenzhen Component closed at 13516.97, down 0.79%. The ChiNext Index closed at 3286.55, down 0.78%. The STAR Market Composite closed at 1865.37, down 2.16%. East Money's pre-market board still showed the STAR 50 at 1577.36 and the CSI 300 at 4548.05, matching Friday's close. Combined turnover across the two markets was about 2.03 trillion yuan.
On the board, pork, seed stocks, liquor, and media were still rising. Computing power, semiconductors, and liquid cooling were sold off in the afternoon. East Money's limit-up pool recorded 39 names. The highest was Longban Media, with 5 straight limit-up days. The market's height is still there, but the money-making effect has already shrunk to the application and consumption segments.
Shanghai Securities News wrote today that weekly turnover has fallen from the earlier peak of 3.5 trillion yuan back to the 2 trillion yuan center. Soochow Securities attributed the shrinkage to the fading of the broad AI theme, and also noted that with Mid-Autumn Festival and National Day back-to-back, there are only about 14 trading days left in the pre-holiday window.
【Two official items over the weekend】
People's Daily ran the story today. The Ministry of Finance will soon issue 300 billion yuan of special treasury bonds to support eight central financial institutions in replenishing core Tier-1 capital. In the September 6 announcement, ABC plans to raise no more than 160 billion yuan, of which the Ministry of Finance will subscribe 130 billion yuan. ICBC plans to raise no more than 100 billion yuan, of which the Ministry of Finance will subscribe 70 billion yuan. The remaining portion will mainly be subscribed by China Tobacco General Corporation and its subsidiaries. The subscribers are listed in the targeted share issuance plan, which still needs review and registration.
On the same day, China Exim Bank, Sinosure, China Life, Taiping, PICC, and China Re were also on the capital increase list. The money goes into capital, used to support lending and solvency, and it will not turn into market turnover in the first minute after the open.
On the central bank side, Xinhua reported the September 4 announcement. Today it will conduct 500 billion yuan of 89-day buyout reverse repos. The same maturity amount expires this month as well, so this is a rollover in the same amount. In the previous two months, it had added 200 billion yuan. Liquidity has not hit the brakes hard, but there was also no extra step on the accelerator.
【The overnight session gives no direction】
Friday's U.S. nonfarm data was relatively hot. The Dow closed at 53414.25, down 0.51%. The S&P 500 closed at 7718.60, down 0.38%. The Nasdaq closed at 26506.99, down 0.29%. The Philadelphia Semiconductor Index instead rose 3.37%. The U.S. market is closed today for Labor Day, so A-shares have no new U.S. intraday reference for the open.
The Singapore A50 continuous contract, as of 09:10, was reported by East Money at 14712, up 0.4%, about 59 points higher. Sina's FTSE China A50 futures were also at 14712 at the same time. A half-percent premium is not enough to determine the opening direction on its own. The Hang Seng Index pre-market was still at 25650.87, and Hong Kong stocks had not really opened either.
【How I am reading it】
Monday looks more like a re-pricing of sentiment. The A50 is only up half a percent, and U.S. markets are still closed. At the open, the first thing to watch is whether banks and insurers are buying into the announcements, and whether tech continues to be sold off after Friday's unfinished distribution. The Shanghai Composite is hovering around 3930, and today the first question is whether it can hold Friday's closing area. If it cannot, then the so-called "bottom support" discussed in the Shanghai Securities News will need another test.
The limit-up height is still at the Longban Media level. For high-position continuation, watch whether it can hold at the open. If it can hold, application-related names may still breathe a little. If it cannot, short-term sentiment will cool first.
At the open, will you first watch whether ICBC and ABC get buyers, or whether tech stocks keep being used for distribution?
#A股 #盘前 #banking
Dragonfly Captain | A financial blogger who likes analyzing data and candlestick charts.
Not investment advice. Index levels are subject to exchange data, and policies are subject to the original announcement text.
See the process chart on the cover. I cross-checked Xinhua Finance's Friday market wrap, CCTV News's bank announcements, the People's Daily article on the special treasury bonds, and pre-market quotes from East Money and Sina. The PBOC's official announcement page could not be opened directly that day, so I used Xinhua's relay for the buyout reverse repo. The draft was written around 2026-09-07 09:10 Beijing time, before A-shares had even entered call auction.
【What was left from last Friday】
Xinhua Finance recorded a high-open, low-close session. The Shanghai Composite closed at 3930.12, down 0.30%, with turnover of about 938.3 billion yuan. The Shenzhen Component closed at 13516.97, down 0.79%. The ChiNext Index closed at 3286.55, down 0.78%. The STAR Market Composite closed at 1865.37, down 2.16%. East Money's pre-market board still showed the STAR 50 at 1577.36 and the CSI 300 at 4548.05, matching Friday's close. Combined turnover across the two markets was about 2.03 trillion yuan.
On the board, pork, seed stocks, liquor, and media were still rising. Computing power, semiconductors, and liquid cooling were sold off in the afternoon. East Money's limit-up pool recorded 39 names. The highest was Longban Media, with 5 straight limit-up days. The market's height is still there, but the money-making effect has already shrunk to the application and consumption segments.
Shanghai Securities News wrote today that weekly turnover has fallen from the earlier peak of 3.5 trillion yuan back to the 2 trillion yuan center. Soochow Securities attributed the shrinkage to the fading of the broad AI theme, and also noted that with Mid-Autumn Festival and National Day back-to-back, there are only about 14 trading days left in the pre-holiday window.
【Two official items over the weekend】
People's Daily ran the story today. The Ministry of Finance will soon issue 300 billion yuan of special treasury bonds to support eight central financial institutions in replenishing core Tier-1 capital. In the September 6 announcement, ABC plans to raise no more than 160 billion yuan, of which the Ministry of Finance will subscribe 130 billion yuan. ICBC plans to raise no more than 100 billion yuan, of which the Ministry of Finance will subscribe 70 billion yuan. The remaining portion will mainly be subscribed by China Tobacco General Corporation and its subsidiaries. The subscribers are listed in the targeted share issuance plan, which still needs review and registration.
On the same day, China Exim Bank, Sinosure, China Life, Taiping, PICC, and China Re were also on the capital increase list. The money goes into capital, used to support lending and solvency, and it will not turn into market turnover in the first minute after the open.
On the central bank side, Xinhua reported the September 4 announcement. Today it will conduct 500 billion yuan of 89-day buyout reverse repos. The same maturity amount expires this month as well, so this is a rollover in the same amount. In the previous two months, it had added 200 billion yuan. Liquidity has not hit the brakes hard, but there was also no extra step on the accelerator.
【The overnight session gives no direction】
Friday's U.S. nonfarm data was relatively hot. The Dow closed at 53414.25, down 0.51%. The S&P 500 closed at 7718.60, down 0.38%. The Nasdaq closed at 26506.99, down 0.29%. The Philadelphia Semiconductor Index instead rose 3.37%. The U.S. market is closed today for Labor Day, so A-shares have no new U.S. intraday reference for the open.
The Singapore A50 continuous contract, as of 09:10, was reported by East Money at 14712, up 0.4%, about 59 points higher. Sina's FTSE China A50 futures were also at 14712 at the same time. A half-percent premium is not enough to determine the opening direction on its own. The Hang Seng Index pre-market was still at 25650.87, and Hong Kong stocks had not really opened either.
【How I am reading it】
Monday looks more like a re-pricing of sentiment. The A50 is only up half a percent, and U.S. markets are still closed. At the open, the first thing to watch is whether banks and insurers are buying into the announcements, and whether tech continues to be sold off after Friday's unfinished distribution. The Shanghai Composite is hovering around 3930, and today the first question is whether it can hold Friday's closing area. If it cannot, then the so-called "bottom support" discussed in the Shanghai Securities News will need another test.
The limit-up height is still at the Longban Media level. For high-position continuation, watch whether it can hold at the open. If it can hold, application-related names may still breathe a little. If it cannot, short-term sentiment will cool first.
At the open, will you first watch whether ICBC and ABC get buyers, or whether tech stocks keep being used for distribution?
#A股 #盘前 #banking
Dragonfly Captain | A financial blogger who likes analyzing data and candlestick charts.
Not investment advice. Index levels are subject to exchange data, and policies are subject to the original announcement text.
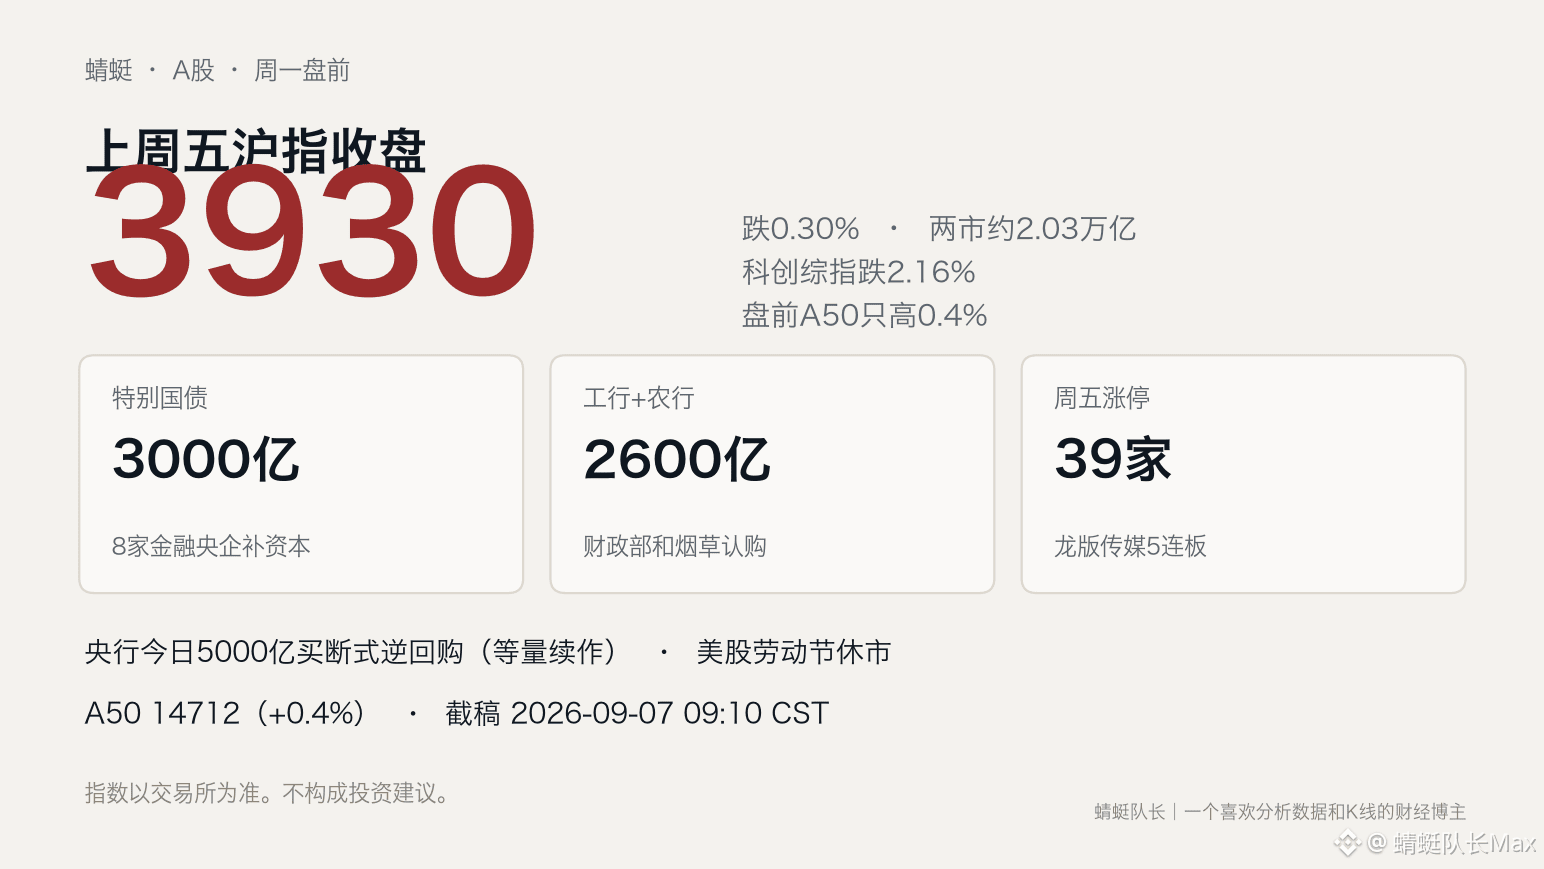
218
·
--
Verified
There are still ten days until the September rate decision. Futures pushed the odds of a 25-basis-point hike back up from about 50% after Waller’s speech to about 60%. Employment is already running hot; the inflation report still hasn’t arrived. Will there actually be a hike in September?
See the cover for the process chart. I cross-checked the Fed’s official statement, the Bureau of Labor Statistics’ July CPI, August nonfarm payrolls, and several reports citing CME FedWatch. The CME tool page was blocked by anti-scraping measures, so the probability here is based on those reports, not on futures prices I calculated myself. Spot prices are from OKX, and the article was written around 11:00 a.m. Beijing time on September 6, 2026. BTC was about 79,880, and ETH about 2,501.
【Where the committee stands now】
The federal funds target range is still 3.50% to 3.75%. The July 29 vote was 9 to 3. Hammack, Kashkari, and Logan dissented, all calling for an immediate 25-basis-point hike. The statement said inflation remains somewhat elevated relative to the 2% target, and it also noted supply shocks from Middle East conflict. The September 15–16 meeting will come with the Summary of Economic Projections and the dot plot; beyond whether to hike or not, it will also reshape expectations for the path ahead.
【Jobs pushed the odds higher】
August nonfarm payrolls added 162,000 jobs, versus consensus of about 56,000. The unemployment rate stayed at 4.1%, average hourly earnings rose 0.3% month over month and 3.1% year over year. July was revised from a loss of 23,000 to a gain of about 21,000. Employment moved into overheated territory, but unemployment and wages did not surge together.
On September 3, Waller told a Reuters event that his vote would hinge on August inflation. If inflation kept cooling, he leaned toward holding. If inflation came in hot again, he would consider a hike. That night, the implied probability of a September hike in futures fell from about 63% to about 50%. After the payroll report, CoinDesk cited FedWatch as putting the odds of a 25-basis-point hike at about 60.3%, versus 39.7% for no change. Gate quoted a later version on September 5 at about 59.4% versus 40.6%. Newsquawk said money markets had reached as high as 65%. The exact figures differ a few points from outlet to outlet, but the direction is the same: jobs alone pushed the market back from a coin flip to around 60%.
【Inflation still hasn’t spoken】
The Bureau of Labor Statistics has set August CPI for 8:30 a.m. Eastern time on September 11. The July data are already out: 0.1% month over month, 3.4% year over year for headline CPI; core CPI rose 0.2% month over month and 2.5% year over year. June had actually fallen 0.4% month over month. Waller said he sees three months of improvement in core inflation, but not victory yet.
Newsquawk’s consensus for August is 0.4% headline CPI and 0.2% core again. PPI is due on September 10, with consensus at 0.3% month over month. If core CPI stays at 0.2%, Waller’s line that he can wait if inflation keeps cooling still holds. If core rises to 0.3% or higher, the three dissenters from July may find company. Waller did not give a precise threshold, so the market will have to find one itself.
【My read】
A September hike is a live option. Futures imply about 60%; that is not fully priced in. Jobs have raised the bar, but not enough to settle the case on their own. Waller is leaving judgment to CPI. Even if the Fed holds, the dot plot could still turn the future path more hawkish.
Three scenarios. If core stays at 0.2%, holding still makes sense and the probability should drift back down from 60%. If core is 0.3% or higher, a 25-basis-point hike moves from a 60% probability to firmer pricing. If the headline is 0.4% but driven by energy while core stays steady, Waller can still wait. Crypto is especially sensitive to this kind of repricing. On the night of the payroll report, BTC lost 80,000, then recovered to around 79,880 by Sunday; 80,000 is still being contested.
Do you think a 0.2% core CPI on September 11 will be enough to hold off a hike, or has the labor market already run hot enough that the committee won’t wait for inflation?
$BTC $ETH #美联储 #加息 #加密
Dragonfly Captain | A financial blogger who likes analyzing data and candlestick charts.
Not investment advice. The probability comes from futures reporting and will be repriced when CPI arrives.
There are still ten days until the September rate decision. Futures pushed the odds of a 25-basis-point hike back up from about 50% after Waller’s speech to about 60%. Employment is already running hot; the inflation report still hasn’t arrived. Will there actually be a hike in September?
See the cover for the process chart. I cross-checked the Fed’s official statement, the Bureau of Labor Statistics’ July CPI, August nonfarm payrolls, and several reports citing CME FedWatch. The CME tool page was blocked by anti-scraping measures, so the probability here is based on those reports, not on futures prices I calculated myself. Spot prices are from OKX, and the article was written around 11:00 a.m. Beijing time on September 6, 2026. BTC was about 79,880, and ETH about 2,501.
【Where the committee stands now】
The federal funds target range is still 3.50% to 3.75%. The July 29 vote was 9 to 3. Hammack, Kashkari, and Logan dissented, all calling for an immediate 25-basis-point hike. The statement said inflation remains somewhat elevated relative to the 2% target, and it also noted supply shocks from Middle East conflict. The September 15–16 meeting will come with the Summary of Economic Projections and the dot plot; beyond whether to hike or not, it will also reshape expectations for the path ahead.
【Jobs pushed the odds higher】
August nonfarm payrolls added 162,000 jobs, versus consensus of about 56,000. The unemployment rate stayed at 4.1%, average hourly earnings rose 0.3% month over month and 3.1% year over year. July was revised from a loss of 23,000 to a gain of about 21,000. Employment moved into overheated territory, but unemployment and wages did not surge together.
On September 3, Waller told a Reuters event that his vote would hinge on August inflation. If inflation kept cooling, he leaned toward holding. If inflation came in hot again, he would consider a hike. That night, the implied probability of a September hike in futures fell from about 63% to about 50%. After the payroll report, CoinDesk cited FedWatch as putting the odds of a 25-basis-point hike at about 60.3%, versus 39.7% for no change. Gate quoted a later version on September 5 at about 59.4% versus 40.6%. Newsquawk said money markets had reached as high as 65%. The exact figures differ a few points from outlet to outlet, but the direction is the same: jobs alone pushed the market back from a coin flip to around 60%.
【Inflation still hasn’t spoken】
The Bureau of Labor Statistics has set August CPI for 8:30 a.m. Eastern time on September 11. The July data are already out: 0.1% month over month, 3.4% year over year for headline CPI; core CPI rose 0.2% month over month and 2.5% year over year. June had actually fallen 0.4% month over month. Waller said he sees three months of improvement in core inflation, but not victory yet.
Newsquawk’s consensus for August is 0.4% headline CPI and 0.2% core again. PPI is due on September 10, with consensus at 0.3% month over month. If core CPI stays at 0.2%, Waller’s line that he can wait if inflation keeps cooling still holds. If core rises to 0.3% or higher, the three dissenters from July may find company. Waller did not give a precise threshold, so the market will have to find one itself.
【My read】
A September hike is a live option. Futures imply about 60%; that is not fully priced in. Jobs have raised the bar, but not enough to settle the case on their own. Waller is leaving judgment to CPI. Even if the Fed holds, the dot plot could still turn the future path more hawkish.
Three scenarios. If core stays at 0.2%, holding still makes sense and the probability should drift back down from 60%. If core is 0.3% or higher, a 25-basis-point hike moves from a 60% probability to firmer pricing. If the headline is 0.4% but driven by energy while core stays steady, Waller can still wait. Crypto is especially sensitive to this kind of repricing. On the night of the payroll report, BTC lost 80,000, then recovered to around 79,880 by Sunday; 80,000 is still being contested.
Do you think a 0.2% core CPI on September 11 will be enough to hold off a hike, or has the labor market already run hot enough that the committee won’t wait for inflation?
$BTC $ETH #美联储 #加息 #加密
Dragonfly Captain | A financial blogger who likes analyzing data and candlestick charts.
Not investment advice. The probability comes from futures reporting and will be repriced when CPI arrives.
See the cover for the process chart. I cross-checked the Fed’s official statement, the Bureau of Labor Statistics’ July CPI, August nonfarm payrolls, and several reports citing CME FedWatch. The CME tool page was blocked by anti-scraping measures, so the probability here is based on those reports, not on futures prices I calculated myself. Spot prices are from OKX, and the article was written around 11:00 a.m. Beijing time on September 6, 2026. BTC was about 79,880, and ETH about 2,501.
【Where the committee stands now】
The federal funds target range is still 3.50% to 3.75%. The July 29 vote was 9 to 3. Hammack, Kashkari, and Logan dissented, all calling for an immediate 25-basis-point hike. The statement said inflation remains somewhat elevated relative to the 2% target, and it also noted supply shocks from Middle East conflict. The September 15–16 meeting will come with the Summary of Economic Projections and the dot plot; beyond whether to hike or not, it will also reshape expectations for the path ahead.
【Jobs pushed the odds higher】
August nonfarm payrolls added 162,000 jobs, versus consensus of about 56,000. The unemployment rate stayed at 4.1%, average hourly earnings rose 0.3% month over month and 3.1% year over year. July was revised from a loss of 23,000 to a gain of about 21,000. Employment moved into overheated territory, but unemployment and wages did not surge together.
On September 3, Waller told a Reuters event that his vote would hinge on August inflation. If inflation kept cooling, he leaned toward holding. If inflation came in hot again, he would consider a hike. That night, the implied probability of a September hike in futures fell from about 63% to about 50%. After the payroll report, CoinDesk cited FedWatch as putting the odds of a 25-basis-point hike at about 60.3%, versus 39.7% for no change. Gate quoted a later version on September 5 at about 59.4% versus 40.6%. Newsquawk said money markets had reached as high as 65%. The exact figures differ a few points from outlet to outlet, but the direction is the same: jobs alone pushed the market back from a coin flip to around 60%.
【Inflation still hasn’t spoken】
The Bureau of Labor Statistics has set August CPI for 8:30 a.m. Eastern time on September 11. The July data are already out: 0.1% month over month, 3.4% year over year for headline CPI; core CPI rose 0.2% month over month and 2.5% year over year. June had actually fallen 0.4% month over month. Waller said he sees three months of improvement in core inflation, but not victory yet.
Newsquawk’s consensus for August is 0.4% headline CPI and 0.2% core again. PPI is due on September 10, with consensus at 0.3% month over month. If core CPI stays at 0.2%, Waller’s line that he can wait if inflation keeps cooling still holds. If core rises to 0.3% or higher, the three dissenters from July may find company. Waller did not give a precise threshold, so the market will have to find one itself.
【My read】
A September hike is a live option. Futures imply about 60%; that is not fully priced in. Jobs have raised the bar, but not enough to settle the case on their own. Waller is leaving judgment to CPI. Even if the Fed holds, the dot plot could still turn the future path more hawkish.
Three scenarios. If core stays at 0.2%, holding still makes sense and the probability should drift back down from 60%. If core is 0.3% or higher, a 25-basis-point hike moves from a 60% probability to firmer pricing. If the headline is 0.4% but driven by energy while core stays steady, Waller can still wait. Crypto is especially sensitive to this kind of repricing. On the night of the payroll report, BTC lost 80,000, then recovered to around 79,880 by Sunday; 80,000 is still being contested.
Do you think a 0.2% core CPI on September 11 will be enough to hold off a hike, or has the labor market already run hot enough that the committee won’t wait for inflation?
$BTC $ETH #美联储 #加息 #加密
Dragonfly Captain | A financial blogger who likes analyzing data and candlestick charts.
Not investment advice. The probability comes from futures reporting and will be repriced when CPI arrives.
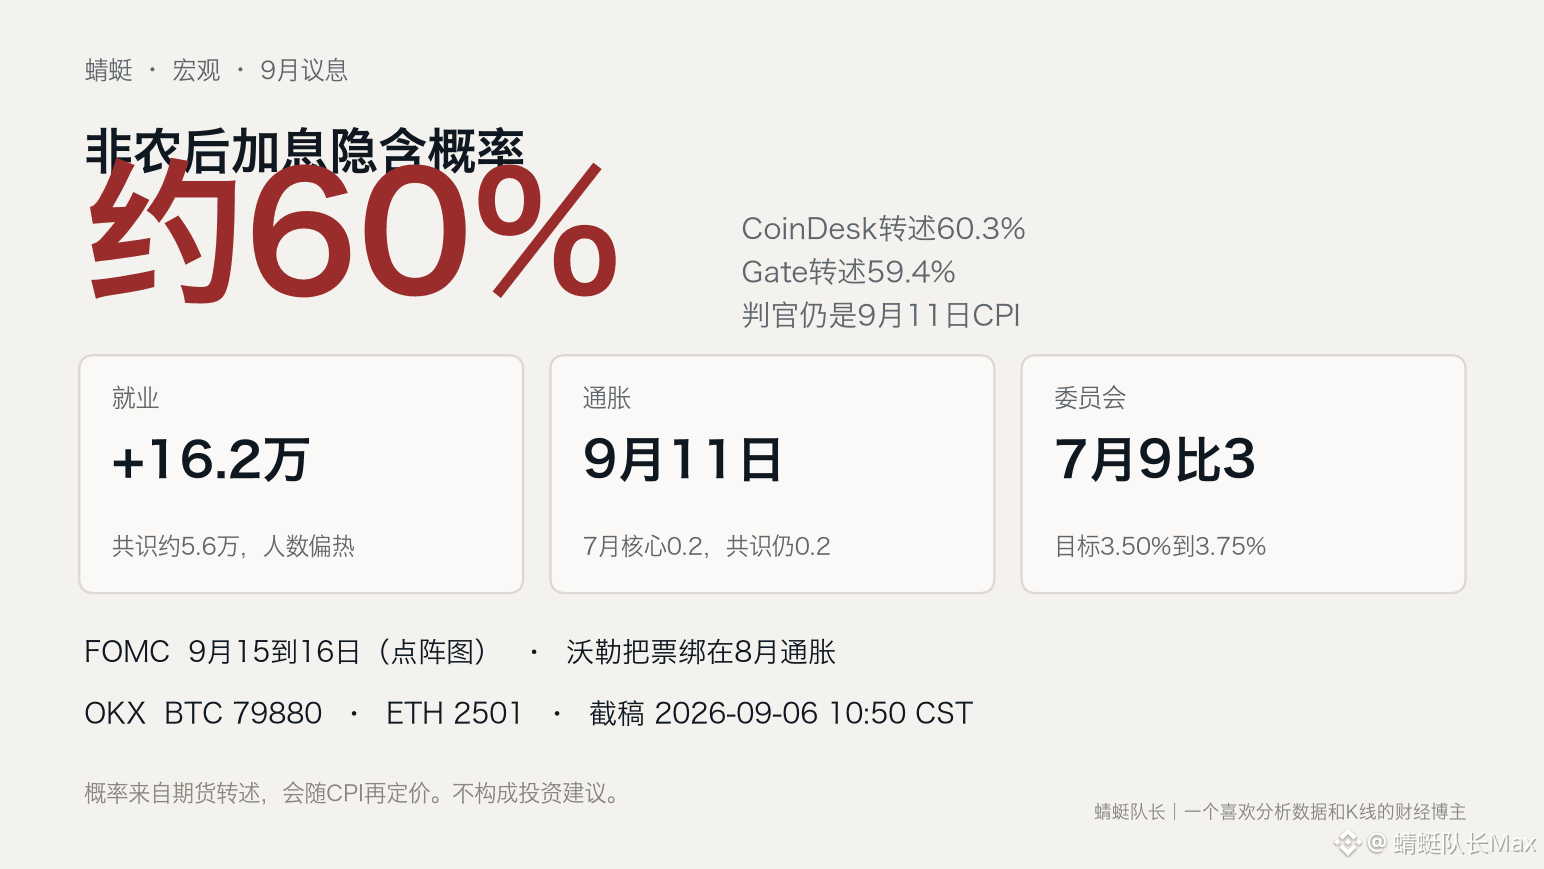
622
·
--
SOL is currently around 103.2, sitting right on the Fib 0.5 retracement of the nonfarm move. The engine’s primary count still points to an impulsive advance, but it is anchored to the old 87 to 97 window from August 22. Tonight, should we still treat it as a fifth-wave extension, or first trade it as a near-term retracement?
See the cover for the structure chart. On the 4H chart, as of 2026-09-05 12:00 UTC, price is 103.26. Spot data is from OKX, and I ran Frost and Prechter’s R1 R2 R3 over 300 4H candles. This 12:00 candle is still forming, so the numbers may move before the close.
【The engine is anchored to the old window】
The main count is an impulsive uptrend, score 11, with R1 R2 R3 all passing. Wave lengths are roughly w1 2.19, w3 26.11, w5 9.57, so the third wave is not the shortest. That third-wave segment corresponds to the surge in mid-August from around 76. The engine’s Fib is based on the 4H low of 87.66 on August 22 and the high of 97.23 on August 23. In that same 4H candle there is both a high at 102.74 and a low at 87.66, so the window itself is noisy. The 0.618 level is 91.32. The alternative ABC score is only 2.
Current price 103.2 is well above this retracement set, almost exactly at the 1.618 extension of the old window, at 103.14. That is a coincidence. Use 91.32 as a reference against the old box, not as tonight’s main level. Confidence: medium. Swing points: 43. 4H noise is higher than daily, so wave counting is not unique.
【The near-term move that is actually unfolding】
The September 2 8:00 low was 97.39. After Waller turned dovish, price reached 105.93 on September 3 at 16:00. That move was about 8.5 dollars. On the chart, the near-term labels mark 105.93 as E/5 and 97.39 as D/4. The engine’s passing score is for the August 22 set, so the two date ranges should be read separately. There is also a higher swing high at 110.64 on August 27, and this rally did not revisit it.
The nonfarm 4H candle dropped from 104.45 to 100.19 and closed at 101.44. The 100.19 low is nearly on this move’s Fib 0.618, with the exact level at 100.65. After that, several 4H candles chopped between 101 and 102, and by 12:00 this candle had reached as high as 103.33. BTC is still stuck between 79450 and 79875, while SOL has already reclaimed the 0.5 retracement first.
Using 97.39 to 105.93 for the near-term Fib, 0.236 is 103.91, 0.382 is 102.67, 0.5 is 101.66, 0.618 is 100.65, and 0.786 is 99.22. Current price 103.2 has just moved away from 0.5, and the next resistance is 103.91.
For the rebound from 105.93 down to 100.19, 0.382 is 102.38, 0.5 is 103.06, and 0.618 is 103.74. Current price is sitting right on the 0.5. Above that, 0.618 and the near-term 0.236 cluster between 103.7 and 103.9.
【Trade comparison】
Short: wait for a pullback. The first area to watch is 103.7 to 103.9, where the nonfarm 0.618 aligns with the near-term 0.236. The second area is 105.93. Abandon the short if the 4H closes above 105.93; above that, 107.48 and 110.64 come into play. For downside targets, first look at 102.67, then 101.66, then 100.19, 99.22, and 97.39.
Long: wait for a lower low. Current price has just bounced off 0.5, so chasing longs is crowded. The first area to watch is 100.19, the nonfarm 4H low and also near 0.618. The second area is 99.22. The third is 97.39, the start of this move. If the 4H closes below 97.39, this near-term impulsive leg is invalid, and the next count needs to be redrawn. On the rebound, first watch 103.9, then 105.93, and only after that 107.48 and 110.64.
The 103 area cuts both ways. The cleaner approach is to wait for a pullback to 103.9 before considering a short, or wait for 100.19 and then 97.39 before considering a long.
The next major marker is still CPI on September 11. After nonfarm, SOL reclaimed the 0.5 retracement before BTC did, but the 4H has not yet proven it can get through 103.9.
Would you wait to short on a 103.9 pullback, or wait for 100.19 before talking about a long? If the 4H closes below 97.39, do you treat the near-term wave as broken, or keep waiting for the old-window five-wave setup?
$SOL $BTC #索拉纳 #波浪理论 #crypto
Dragonfly Captain | A finance blogger who likes analyzing data and candlesticks.
Not investment advice. These levels are for reference only; position sizing is your own decision. 4H noise is higher than daily, so wave counting is not unique.
SOL is currently around 103.2, sitting right on the Fib 0.5 retracement of the nonfarm move. The engine’s primary count still points to an impulsive advance, but it is anchored to the old 87 to 97 window from August 22. Tonight, should we still treat it as a fifth-wave extension, or first trade it as a near-term retracement?
See the cover for the structure chart. On the 4H chart, as of 2026-09-05 12:00 UTC, price is 103.26. Spot data is from OKX, and I ran Frost and Prechter’s R1 R2 R3 over 300 4H candles. This 12:00 candle is still forming, so the numbers may move before the close.
【The engine is anchored to the old window】
The main count is an impulsive uptrend, score 11, with R1 R2 R3 all passing. Wave lengths are roughly w1 2.19, w3 26.11, w5 9.57, so the third wave is not the shortest. That third-wave segment corresponds to the surge in mid-August from around 76. The engine’s Fib is based on the 4H low of 87.66 on August 22 and the high of 97.23 on August 23. In that same 4H candle there is both a high at 102.74 and a low at 87.66, so the window itself is noisy. The 0.618 level is 91.32. The alternative ABC score is only 2.
Current price 103.2 is well above this retracement set, almost exactly at the 1.618 extension of the old window, at 103.14. That is a coincidence. Use 91.32 as a reference against the old box, not as tonight’s main level. Confidence: medium. Swing points: 43. 4H noise is higher than daily, so wave counting is not unique.
【The near-term move that is actually unfolding】
The September 2 8:00 low was 97.39. After Waller turned dovish, price reached 105.93 on September 3 at 16:00. That move was about 8.5 dollars. On the chart, the near-term labels mark 105.93 as E/5 and 97.39 as D/4. The engine’s passing score is for the August 22 set, so the two date ranges should be read separately. There is also a higher swing high at 110.64 on August 27, and this rally did not revisit it.
The nonfarm 4H candle dropped from 104.45 to 100.19 and closed at 101.44. The 100.19 low is nearly on this move’s Fib 0.618, with the exact level at 100.65. After that, several 4H candles chopped between 101 and 102, and by 12:00 this candle had reached as high as 103.33. BTC is still stuck between 79450 and 79875, while SOL has already reclaimed the 0.5 retracement first.
Using 97.39 to 105.93 for the near-term Fib, 0.236 is 103.91, 0.382 is 102.67, 0.5 is 101.66, 0.618 is 100.65, and 0.786 is 99.22. Current price 103.2 has just moved away from 0.5, and the next resistance is 103.91.
For the rebound from 105.93 down to 100.19, 0.382 is 102.38, 0.5 is 103.06, and 0.618 is 103.74. Current price is sitting right on the 0.5. Above that, 0.618 and the near-term 0.236 cluster between 103.7 and 103.9.
【Trade comparison】
Short: wait for a pullback. The first area to watch is 103.7 to 103.9, where the nonfarm 0.618 aligns with the near-term 0.236. The second area is 105.93. Abandon the short if the 4H closes above 105.93; above that, 107.48 and 110.64 come into play. For downside targets, first look at 102.67, then 101.66, then 100.19, 99.22, and 97.39.
Long: wait for a lower low. Current price has just bounced off 0.5, so chasing longs is crowded. The first area to watch is 100.19, the nonfarm 4H low and also near 0.618. The second area is 99.22. The third is 97.39, the start of this move. If the 4H closes below 97.39, this near-term impulsive leg is invalid, and the next count needs to be redrawn. On the rebound, first watch 103.9, then 105.93, and only after that 107.48 and 110.64.
The 103 area cuts both ways. The cleaner approach is to wait for a pullback to 103.9 before considering a short, or wait for 100.19 and then 97.39 before considering a long.
The next major marker is still CPI on September 11. After nonfarm, SOL reclaimed the 0.5 retracement before BTC did, but the 4H has not yet proven it can get through 103.9.
Would you wait to short on a 103.9 pullback, or wait for 100.19 before talking about a long? If the 4H closes below 97.39, do you treat the near-term wave as broken, or keep waiting for the old-window five-wave setup?
$SOL $BTC #索拉纳 #波浪理论 #crypto
Dragonfly Captain | A finance blogger who likes analyzing data and candlesticks.
Not investment advice. These levels are for reference only; position sizing is your own decision. 4H noise is higher than daily, so wave counting is not unique.
See the cover for the structure chart. On the 4H chart, as of 2026-09-05 12:00 UTC, price is 103.26. Spot data is from OKX, and I ran Frost and Prechter’s R1 R2 R3 over 300 4H candles. This 12:00 candle is still forming, so the numbers may move before the close.
【The engine is anchored to the old window】
The main count is an impulsive uptrend, score 11, with R1 R2 R3 all passing. Wave lengths are roughly w1 2.19, w3 26.11, w5 9.57, so the third wave is not the shortest. That third-wave segment corresponds to the surge in mid-August from around 76. The engine’s Fib is based on the 4H low of 87.66 on August 22 and the high of 97.23 on August 23. In that same 4H candle there is both a high at 102.74 and a low at 87.66, so the window itself is noisy. The 0.618 level is 91.32. The alternative ABC score is only 2.
Current price 103.2 is well above this retracement set, almost exactly at the 1.618 extension of the old window, at 103.14. That is a coincidence. Use 91.32 as a reference against the old box, not as tonight’s main level. Confidence: medium. Swing points: 43. 4H noise is higher than daily, so wave counting is not unique.
【The near-term move that is actually unfolding】
The September 2 8:00 low was 97.39. After Waller turned dovish, price reached 105.93 on September 3 at 16:00. That move was about 8.5 dollars. On the chart, the near-term labels mark 105.93 as E/5 and 97.39 as D/4. The engine’s passing score is for the August 22 set, so the two date ranges should be read separately. There is also a higher swing high at 110.64 on August 27, and this rally did not revisit it.
The nonfarm 4H candle dropped from 104.45 to 100.19 and closed at 101.44. The 100.19 low is nearly on this move’s Fib 0.618, with the exact level at 100.65. After that, several 4H candles chopped between 101 and 102, and by 12:00 this candle had reached as high as 103.33. BTC is still stuck between 79450 and 79875, while SOL has already reclaimed the 0.5 retracement first.
Using 97.39 to 105.93 for the near-term Fib, 0.236 is 103.91, 0.382 is 102.67, 0.5 is 101.66, 0.618 is 100.65, and 0.786 is 99.22. Current price 103.2 has just moved away from 0.5, and the next resistance is 103.91.
For the rebound from 105.93 down to 100.19, 0.382 is 102.38, 0.5 is 103.06, and 0.618 is 103.74. Current price is sitting right on the 0.5. Above that, 0.618 and the near-term 0.236 cluster between 103.7 and 103.9.
【Trade comparison】
Short: wait for a pullback. The first area to watch is 103.7 to 103.9, where the nonfarm 0.618 aligns with the near-term 0.236. The second area is 105.93. Abandon the short if the 4H closes above 105.93; above that, 107.48 and 110.64 come into play. For downside targets, first look at 102.67, then 101.66, then 100.19, 99.22, and 97.39.
Long: wait for a lower low. Current price has just bounced off 0.5, so chasing longs is crowded. The first area to watch is 100.19, the nonfarm 4H low and also near 0.618. The second area is 99.22. The third is 97.39, the start of this move. If the 4H closes below 97.39, this near-term impulsive leg is invalid, and the next count needs to be redrawn. On the rebound, first watch 103.9, then 105.93, and only after that 107.48 and 110.64.
The 103 area cuts both ways. The cleaner approach is to wait for a pullback to 103.9 before considering a short, or wait for 100.19 and then 97.39 before considering a long.
The next major marker is still CPI on September 11. After nonfarm, SOL reclaimed the 0.5 retracement before BTC did, but the 4H has not yet proven it can get through 103.9.
Would you wait to short on a 103.9 pullback, or wait for 100.19 before talking about a long? If the 4H closes below 97.39, do you treat the near-term wave as broken, or keep waiting for the old-window five-wave setup?
$SOL $BTC #索拉纳 #波浪理论 #crypto
Dragonfly Captain | A finance blogger who likes analyzing data and candlesticks.
Not investment advice. These levels are for reference only; position sizing is your own decision. 4H noise is higher than daily, so wave counting is not unique.

182
·
--
ETH is currently around 2455, right on the Fib 0.5 of the 2356 to 2547 move. The engine’s primary count still sees an upward impulse, but it is pinned to the old 1944 window from August. For tonight, should we still assume wave five is unfinished, or first trade the near-term pullback?
See the cover for the structure chart. As of 2026-09-05 12:00 UTC on 4H, the price is 2455.3. Spot data comes from OKX, and I ran Frost and Prechter’s R1 R2 R3 on 300 four-hour candles. This 12:00 candle has just opened, so the numbers will change before it closes.
[The engine is pinned to the old window]
The primary count is an upward impulse, score 13, with R1 R2 R3 all passing. Wave lengths: w1 about 53.4, w3 about 72.7, w5 about 51.2, so the third wave is not the shortest wave. The engine’s Fib is based on the August 6 12:00 low at 1892 and the August 7 12:00 high at 1944. The 0.618 level is at 1912. The alternative ABC count scores only 2.
Current price at 2455 is far above this old Fib set. The 1912 level is only for comparison with the old box, not for tonight’s watch level. Confidence is moderate. Swing points: 47. 4H noise is higher than daily, so wave counting is not unique.
[The near-term move that is playing out]
September 2 08:00 low: 2357. After Waller turned dovish, September 4 08:00 reached 2547. This move is about 190 points. On the chart, the near-term labels mark 2547 as E/5 and 2357 as D/4. The engine score that passed is for the August 6 set, so the two date ranges must be read separately. There was also a higher swing high at 2566 on August 27, and this leg did not retest it.
The Nonfarm Payrolls 4H candle dumped from 2532 to 2431 and closed at 2452. 2431 is almost exactly the Fib 0.618 of this leg, with the precise level at 2429. After that, five 4H candles compressed between 2443 and 2464, without reclaiming 2475.
Near-term Fib from 2357 to 2547: 0.236 at 2502, 0.382 at 2474, 0.5 at 2452, 0.618 at 2429, 0.786 at 2397. Current price 2455 is right on 0.5, and also near the 0.236 retracement of the NFP move, which is 2458.
For the bounce from 2547 down to 2431, Fib levels are 0.382 at 2475, 0.5 at 2489, and 0.618 at 2503. Current price is still below 0.382, so the rebound is still weak. BTC is similarly stuck between 79450 and 79875, and neither leg has reclaimed the round-number breakout.
[Trade comparison]
Short: wait for a pullback. First level to watch is 2474 to 2475, where 0.382 overlaps with the NFP retracement 0.382. Second level is 2502, where 0.236 overlaps with the NFP retracement 0.618. Give up on the short if 4H closes above 2547; only then does 2566 come into play. For downside targets, first look at 2431, then 2397, and only after that 2357.
Long: wait for a low. Current price is sitting on 0.5, so only hold if it stays above and then talk about a rebound to 2475; chasing long here is crowded. First level is 2431, the NFP 4H low and also near 0.618. Second level is 2397. Third is 2357, the start of this leg. If 4H closes below 2357, then this near-term impulse leg is broken and a new count is needed. For rebounds, first look at 2475, then 2502, and only then 2547 and 2566.
At 2455, this area is awkward from both sides. A cleaner approach is to wait for a pullback to 2475 before shorting, or wait for 2431 and then 2357 before considering a long.
The next key date is still CPI on September 11. After NFP, ETH has not reclaimed 2547; 4H has only been grinding between 2443 and 2464.
Would you short at the 2475 pullback, or wait for 2431 before going long? If 4H closes below 2357, do you consider the near-term wave broken, or continue waiting on the old five-wave window?
$ETH $BTC #以太坊 #波浪理论 #crypto
Dragonfly Captain | A finance blogger who likes analyzing data and candlesticks.
Not investment advice. Levels are for reference only; position sizing is your own decision. 4H noise is higher than daily, so wave counting is not unique.
ETH is currently around 2455, right on the Fib 0.5 of the 2356 to 2547 move. The engine’s primary count still sees an upward impulse, but it is pinned to the old 1944 window from August. For tonight, should we still assume wave five is unfinished, or first trade the near-term pullback?
See the cover for the structure chart. As of 2026-09-05 12:00 UTC on 4H, the price is 2455.3. Spot data comes from OKX, and I ran Frost and Prechter’s R1 R2 R3 on 300 four-hour candles. This 12:00 candle has just opened, so the numbers will change before it closes.
[The engine is pinned to the old window]
The primary count is an upward impulse, score 13, with R1 R2 R3 all passing. Wave lengths: w1 about 53.4, w3 about 72.7, w5 about 51.2, so the third wave is not the shortest wave. The engine’s Fib is based on the August 6 12:00 low at 1892 and the August 7 12:00 high at 1944. The 0.618 level is at 1912. The alternative ABC count scores only 2.
Current price at 2455 is far above this old Fib set. The 1912 level is only for comparison with the old box, not for tonight’s watch level. Confidence is moderate. Swing points: 47. 4H noise is higher than daily, so wave counting is not unique.
[The near-term move that is playing out]
September 2 08:00 low: 2357. After Waller turned dovish, September 4 08:00 reached 2547. This move is about 190 points. On the chart, the near-term labels mark 2547 as E/5 and 2357 as D/4. The engine score that passed is for the August 6 set, so the two date ranges must be read separately. There was also a higher swing high at 2566 on August 27, and this leg did not retest it.
The Nonfarm Payrolls 4H candle dumped from 2532 to 2431 and closed at 2452. 2431 is almost exactly the Fib 0.618 of this leg, with the precise level at 2429. After that, five 4H candles compressed between 2443 and 2464, without reclaiming 2475.
Near-term Fib from 2357 to 2547: 0.236 at 2502, 0.382 at 2474, 0.5 at 2452, 0.618 at 2429, 0.786 at 2397. Current price 2455 is right on 0.5, and also near the 0.236 retracement of the NFP move, which is 2458.
For the bounce from 2547 down to 2431, Fib levels are 0.382 at 2475, 0.5 at 2489, and 0.618 at 2503. Current price is still below 0.382, so the rebound is still weak. BTC is similarly stuck between 79450 and 79875, and neither leg has reclaimed the round-number breakout.
[Trade comparison]
Short: wait for a pullback. First level to watch is 2474 to 2475, where 0.382 overlaps with the NFP retracement 0.382. Second level is 2502, where 0.236 overlaps with the NFP retracement 0.618. Give up on the short if 4H closes above 2547; only then does 2566 come into play. For downside targets, first look at 2431, then 2397, and only after that 2357.
Long: wait for a low. Current price is sitting on 0.5, so only hold if it stays above and then talk about a rebound to 2475; chasing long here is crowded. First level is 2431, the NFP 4H low and also near 0.618. Second level is 2397. Third is 2357, the start of this leg. If 4H closes below 2357, then this near-term impulse leg is broken and a new count is needed. For rebounds, first look at 2475, then 2502, and only then 2547 and 2566.
At 2455, this area is awkward from both sides. A cleaner approach is to wait for a pullback to 2475 before shorting, or wait for 2431 and then 2357 before considering a long.
The next key date is still CPI on September 11. After NFP, ETH has not reclaimed 2547; 4H has only been grinding between 2443 and 2464.
Would you short at the 2475 pullback, or wait for 2431 before going long? If 4H closes below 2357, do you consider the near-term wave broken, or continue waiting on the old five-wave window?
$ETH $BTC #以太坊 #波浪理论 #crypto
Dragonfly Captain | A finance blogger who likes analyzing data and candlesticks.
Not investment advice. Levels are for reference only; position sizing is your own decision. 4H noise is higher than daily, so wave counting is not unique.
See the cover for the structure chart. As of 2026-09-05 12:00 UTC on 4H, the price is 2455.3. Spot data comes from OKX, and I ran Frost and Prechter’s R1 R2 R3 on 300 four-hour candles. This 12:00 candle has just opened, so the numbers will change before it closes.
[The engine is pinned to the old window]
The primary count is an upward impulse, score 13, with R1 R2 R3 all passing. Wave lengths: w1 about 53.4, w3 about 72.7, w5 about 51.2, so the third wave is not the shortest wave. The engine’s Fib is based on the August 6 12:00 low at 1892 and the August 7 12:00 high at 1944. The 0.618 level is at 1912. The alternative ABC count scores only 2.
Current price at 2455 is far above this old Fib set. The 1912 level is only for comparison with the old box, not for tonight’s watch level. Confidence is moderate. Swing points: 47. 4H noise is higher than daily, so wave counting is not unique.
[The near-term move that is playing out]
September 2 08:00 low: 2357. After Waller turned dovish, September 4 08:00 reached 2547. This move is about 190 points. On the chart, the near-term labels mark 2547 as E/5 and 2357 as D/4. The engine score that passed is for the August 6 set, so the two date ranges must be read separately. There was also a higher swing high at 2566 on August 27, and this leg did not retest it.
The Nonfarm Payrolls 4H candle dumped from 2532 to 2431 and closed at 2452. 2431 is almost exactly the Fib 0.618 of this leg, with the precise level at 2429. After that, five 4H candles compressed between 2443 and 2464, without reclaiming 2475.
Near-term Fib from 2357 to 2547: 0.236 at 2502, 0.382 at 2474, 0.5 at 2452, 0.618 at 2429, 0.786 at 2397. Current price 2455 is right on 0.5, and also near the 0.236 retracement of the NFP move, which is 2458.
For the bounce from 2547 down to 2431, Fib levels are 0.382 at 2475, 0.5 at 2489, and 0.618 at 2503. Current price is still below 0.382, so the rebound is still weak. BTC is similarly stuck between 79450 and 79875, and neither leg has reclaimed the round-number breakout.
[Trade comparison]
Short: wait for a pullback. First level to watch is 2474 to 2475, where 0.382 overlaps with the NFP retracement 0.382. Second level is 2502, where 0.236 overlaps with the NFP retracement 0.618. Give up on the short if 4H closes above 2547; only then does 2566 come into play. For downside targets, first look at 2431, then 2397, and only after that 2357.
Long: wait for a low. Current price is sitting on 0.5, so only hold if it stays above and then talk about a rebound to 2475; chasing long here is crowded. First level is 2431, the NFP 4H low and also near 0.618. Second level is 2397. Third is 2357, the start of this leg. If 4H closes below 2357, then this near-term impulse leg is broken and a new count is needed. For rebounds, first look at 2475, then 2502, and only then 2547 and 2566.
At 2455, this area is awkward from both sides. A cleaner approach is to wait for a pullback to 2475 before shorting, or wait for 2431 and then 2357 before considering a long.
The next key date is still CPI on September 11. After NFP, ETH has not reclaimed 2547; 4H has only been grinding between 2443 and 2464.
Would you short at the 2475 pullback, or wait for 2431 before going long? If 4H closes below 2357, do you consider the near-term wave broken, or continue waiting on the old five-wave window?
$ETH $BTC #以太坊 #波浪理论 #crypto
Dragonfly Captain | A finance blogger who likes analyzing data and candlesticks.
Not investment advice. Levels are for reference only; position sizing is your own decision. 4H noise is higher than daily, so wave counting is not unique.

166
·
--
BTC is currently around 79,667, stuck just below the Fib 0.382 of the 76,261 to 82,285 move. The engine’s primary count still favors an impulsive wave to the upside, but it is anchored to that old 65k window. For tonight, should we still assume the fifth wave has not finished, or should we first trade the near-term pullback?
See the cover for the structure chart. As of 2026-09-05 12:00 UTC on the 4H chart, the current price is 79,663. Spot data comes from OKX, and I ran 300 4H candles using Frost and Prechter’s R1, R2, and R3. The 12:00 candle has just opened; the numbers will move before it closes.
【The engine is anchored to the old window】
The main count is an impulsive wave up, with a score of 13, and it passes R1, R2, and R3. Wave lengths are roughly w1 1,531, w3 2,243, and w5 1,146, so the third wave is not the shortest. The engine’s Fib is taken from the August 5 12:00 low at 63,881 to the August 5 20:00 high at 65,027. The 0.618 level sits at 64,318. The alternative ABC count only scores 2.
Current price 79,667 is far above this old Fib set. 64,318 is only for comparison with the old range, not for tonight’s watch level. Confidence: medium. Swing points: 46. 4H noise is higher than on the daily chart, so wave counting is not unique.
【The near-term move in play】
September 2 08:00 low at 76,261. After Waller turned dovish, price hit 82,285 on September 3 at 20:00. This move is about 6,030 points. The near-term labels on the chart mark 82,285 as E/5 and 76,261 as D/4. The engine score passing refers to the August 5 set; the two date ranges need to be read separately.
The nonfarm payrolls 4H candle dropped from 81,346 to 78,650 and closed at 79,428. 78,650 is almost exactly the Fib 0.618 of that move; the precise level is 78,562. After that, six 4H candles compressed between 79,450 and 79,875 without reclaiming 80,000.
Near-term Fib calculated from 76,261 to 82,285: 0.236 at 80,863, 0.382 at 79,984, 0.5 at 79,273, 0.618 at 78,562, and 0.786 at 77,550. Current price 79,667 sits just below 0.382, and also near the nonfarm retracement 0.236, which is at 79,508.
For the rebound from 82,285 down to 78,650, Fib 0.382 is at 80,039, 0.5 at 80,468, and 0.618 at 80,896. Price is still below 0.382, so the rebound remains weak for now.
【Trade reference】
Short, wait for a pullback. The first zone is 79,980 to 80,040, where 0.382 overlaps with the round number. The second zone is 80,860 to 80,900, where 0.236 overlaps with the nonfarm retracement 0.618. Abandon the short idea if a 4H candle closes above 82,285; that would be a new high and the first short setup should be closed. Initial downside targets: 79,273, then 78,650, and only after that 77,550 and 76,261.
Long, wait for a low. Going long here is crowded. The first zone is 78,650, the nonfarm 4H low and also near 0.618. The second zone is 77,550. The third zone is 76,261, the start of this move. If a 4H candle closes below 76,261, then this near-term impulsive leg is considered broken and a new count is needed. On the rebound, first watch 80,000, then 80,860, and only then 82,285.
The 79,600 area is a lose-lose zone from both sides. A cleaner approach is to wait for a rebound to 80,000 and then look short, or wait for 78,650 or even 76,261 and then look long.
The next major marker is still CPI on September 11. After nonfarm, BTC has not reclaimed 80,000; the 4H has only been grinding between 79,450 and 79,875.
Would you short on a pullback to 80,000, or wait for 78,650 to consider longs? If the 4H closes below 76,261, do you treat the near-term wave as broken, or keep waiting for the old-window five-wave count?
$BTC #比特币 #波浪理论 #crypto
Dragonfly Captain | A finance blogger who enjoys analyzing data and candlestick charts.
Not investment advice. Levels are for reference only; position sizing is up to you. 4H noise is higher than the daily chart, so wave counting is not unique.
BTC is currently around 79,667, stuck just below the Fib 0.382 of the 76,261 to 82,285 move. The engine’s primary count still favors an impulsive wave to the upside, but it is anchored to that old 65k window. For tonight, should we still assume the fifth wave has not finished, or should we first trade the near-term pullback?
See the cover for the structure chart. As of 2026-09-05 12:00 UTC on the 4H chart, the current price is 79,663. Spot data comes from OKX, and I ran 300 4H candles using Frost and Prechter’s R1, R2, and R3. The 12:00 candle has just opened; the numbers will move before it closes.
【The engine is anchored to the old window】
The main count is an impulsive wave up, with a score of 13, and it passes R1, R2, and R3. Wave lengths are roughly w1 1,531, w3 2,243, and w5 1,146, so the third wave is not the shortest. The engine’s Fib is taken from the August 5 12:00 low at 63,881 to the August 5 20:00 high at 65,027. The 0.618 level sits at 64,318. The alternative ABC count only scores 2.
Current price 79,667 is far above this old Fib set. 64,318 is only for comparison with the old range, not for tonight’s watch level. Confidence: medium. Swing points: 46. 4H noise is higher than on the daily chart, so wave counting is not unique.
【The near-term move in play】
September 2 08:00 low at 76,261. After Waller turned dovish, price hit 82,285 on September 3 at 20:00. This move is about 6,030 points. The near-term labels on the chart mark 82,285 as E/5 and 76,261 as D/4. The engine score passing refers to the August 5 set; the two date ranges need to be read separately.
The nonfarm payrolls 4H candle dropped from 81,346 to 78,650 and closed at 79,428. 78,650 is almost exactly the Fib 0.618 of that move; the precise level is 78,562. After that, six 4H candles compressed between 79,450 and 79,875 without reclaiming 80,000.
Near-term Fib calculated from 76,261 to 82,285: 0.236 at 80,863, 0.382 at 79,984, 0.5 at 79,273, 0.618 at 78,562, and 0.786 at 77,550. Current price 79,667 sits just below 0.382, and also near the nonfarm retracement 0.236, which is at 79,508.
For the rebound from 82,285 down to 78,650, Fib 0.382 is at 80,039, 0.5 at 80,468, and 0.618 at 80,896. Price is still below 0.382, so the rebound remains weak for now.
【Trade reference】
Short, wait for a pullback. The first zone is 79,980 to 80,040, where 0.382 overlaps with the round number. The second zone is 80,860 to 80,900, where 0.236 overlaps with the nonfarm retracement 0.618. Abandon the short idea if a 4H candle closes above 82,285; that would be a new high and the first short setup should be closed. Initial downside targets: 79,273, then 78,650, and only after that 77,550 and 76,261.
Long, wait for a low. Going long here is crowded. The first zone is 78,650, the nonfarm 4H low and also near 0.618. The second zone is 77,550. The third zone is 76,261, the start of this move. If a 4H candle closes below 76,261, then this near-term impulsive leg is considered broken and a new count is needed. On the rebound, first watch 80,000, then 80,860, and only then 82,285.
The 79,600 area is a lose-lose zone from both sides. A cleaner approach is to wait for a rebound to 80,000 and then look short, or wait for 78,650 or even 76,261 and then look long.
The next major marker is still CPI on September 11. After nonfarm, BTC has not reclaimed 80,000; the 4H has only been grinding between 79,450 and 79,875.
Would you short on a pullback to 80,000, or wait for 78,650 to consider longs? If the 4H closes below 76,261, do you treat the near-term wave as broken, or keep waiting for the old-window five-wave count?
$BTC #比特币 #波浪理论 #crypto
Dragonfly Captain | A finance blogger who enjoys analyzing data and candlestick charts.
Not investment advice. Levels are for reference only; position sizing is up to you. 4H noise is higher than the daily chart, so wave counting is not unique.
See the cover for the structure chart. As of 2026-09-05 12:00 UTC on the 4H chart, the current price is 79,663. Spot data comes from OKX, and I ran 300 4H candles using Frost and Prechter’s R1, R2, and R3. The 12:00 candle has just opened; the numbers will move before it closes.
【The engine is anchored to the old window】
The main count is an impulsive wave up, with a score of 13, and it passes R1, R2, and R3. Wave lengths are roughly w1 1,531, w3 2,243, and w5 1,146, so the third wave is not the shortest. The engine’s Fib is taken from the August 5 12:00 low at 63,881 to the August 5 20:00 high at 65,027. The 0.618 level sits at 64,318. The alternative ABC count only scores 2.
Current price 79,667 is far above this old Fib set. 64,318 is only for comparison with the old range, not for tonight’s watch level. Confidence: medium. Swing points: 46. 4H noise is higher than on the daily chart, so wave counting is not unique.
【The near-term move in play】
September 2 08:00 low at 76,261. After Waller turned dovish, price hit 82,285 on September 3 at 20:00. This move is about 6,030 points. The near-term labels on the chart mark 82,285 as E/5 and 76,261 as D/4. The engine score passing refers to the August 5 set; the two date ranges need to be read separately.
The nonfarm payrolls 4H candle dropped from 81,346 to 78,650 and closed at 79,428. 78,650 is almost exactly the Fib 0.618 of that move; the precise level is 78,562. After that, six 4H candles compressed between 79,450 and 79,875 without reclaiming 80,000.
Near-term Fib calculated from 76,261 to 82,285: 0.236 at 80,863, 0.382 at 79,984, 0.5 at 79,273, 0.618 at 78,562, and 0.786 at 77,550. Current price 79,667 sits just below 0.382, and also near the nonfarm retracement 0.236, which is at 79,508.
For the rebound from 82,285 down to 78,650, Fib 0.382 is at 80,039, 0.5 at 80,468, and 0.618 at 80,896. Price is still below 0.382, so the rebound remains weak for now.
【Trade reference】
Short, wait for a pullback. The first zone is 79,980 to 80,040, where 0.382 overlaps with the round number. The second zone is 80,860 to 80,900, where 0.236 overlaps with the nonfarm retracement 0.618. Abandon the short idea if a 4H candle closes above 82,285; that would be a new high and the first short setup should be closed. Initial downside targets: 79,273, then 78,650, and only after that 77,550 and 76,261.
Long, wait for a low. Going long here is crowded. The first zone is 78,650, the nonfarm 4H low and also near 0.618. The second zone is 77,550. The third zone is 76,261, the start of this move. If a 4H candle closes below 76,261, then this near-term impulsive leg is considered broken and a new count is needed. On the rebound, first watch 80,000, then 80,860, and only then 82,285.
The 79,600 area is a lose-lose zone from both sides. A cleaner approach is to wait for a rebound to 80,000 and then look short, or wait for 78,650 or even 76,261 and then look long.
The next major marker is still CPI on September 11. After nonfarm, BTC has not reclaimed 80,000; the 4H has only been grinding between 79,450 and 79,875.
Would you short on a pullback to 80,000, or wait for 78,650 to consider longs? If the 4H closes below 76,261, do you treat the near-term wave as broken, or keep waiting for the old-window five-wave count?
$BTC #比特币 #波浪理论 #crypto
Dragonfly Captain | A finance blogger who enjoys analyzing data and candlestick charts.
Not investment advice. Levels are for reference only; position sizing is up to you. 4H noise is higher than the daily chart, so wave counting is not unique.

139
·
--
ZEC on OKX just hit 1050.48, and the current price is still around 1005. BTC is still hovering below 80000. Are privacy coins continuing to set ten-year highs, or is the squeeze not over yet?
See the cover for the liquidity map. Spot data comes from OKX, and the article was written around 16:00 Beijing time on September 5, 2026. Market cap, ranking, and the 2016 high come from CoinGecko. ZCSH’s listing date and assets under management come from Grayscale’s product page. Friday’s short-liquidation figures are quoted by Decrypt from CoinGlass.
【First, let’s make the new high clear】
Yesterday on the 4-hour chart, it first reached 1029.99. The 1000 round-number level was crossed for the first time in ten years. In the early hours of today, the next push took the high to 1050.48, which is also the highest on OKX in the past 90 days, and a new high since this move began climbing from around 368 at the end of June.
Media like to call it an all-time high. CoinGecko records 3191.93 on October 28, 2016 as the ATH. The float on the first listing day was extremely thin, so that sky-high print is still above us; today we’re still about two-thirds below it. The numbers are fighting each other. The circulating market cap is about 17 billion dollars, ranking 11th, already above the roughly 13.3 billion dollar range of Dogecoin. Over the past 30 days, CoinGecko shows a gain of about 98%, and over the past year about 2324%.
【Where is the money coming from】
On August 25, Grayscale converted its original Zcash Trust into an exchange-traded product, ticker ZCSH, and it started trading on NYSE Arca. The listing date on the official product page is exactly that day. As of the September 3 data point, assets under management were about 415 million dollars. For the first time, brokerage accounts can access ZEC through a stock trading channel without managing private keys themselves.
On listing day, spot did not immediately go wild. That day on OKX, it dropped as low as 752 and closed at 770. The ETF first provided access, not instant inflows of real money. Over the following week, it climbed back above 850, and then after Waller turned dovish on September 3, it broke through 1000 in one go.
Friday’s stronger-than-expected nonfarm payrolls took BTC below 80000. ZEC, by contrast, printed a new high at 1029 that day, and then pushed up to 1050. Decrypt, citing CoinGlass, said that the move through 1000 liquidated about 34.5 million dollars in short positions, while total market liquidations were about 36.6 million dollars. Short covering turns into spot buy orders, which explains why the move accelerated once the round number was broken.
Zcash uses zero-knowledge proofs to hide transfer amounts and addresses. Its maximum supply is 21 million, using the same cap structure as Bitcoin. Monero is currently around 529, with a market cap of about 10 billion dollars, ranking behind it. This round’s privacy narrative first rewarded the one that could get an ETF.
【How to read the chart】
The daily RSI14 is about 72.9, still in overbought territory, though down from the 78 mentioned in the media on Friday. The 20-day moving average is about 781, and the 50-day moving average about 611; the short-term average is above the long-term average. The trend is still intact, but the short-term positioning is crowded.
From the 30-day low of 466 to 1050, the Fib retracement levels are 912 at 0.236, 827 at 0.382, and 758 at 0.5. The 758 area also lines up with the listing-day low around 752. Decrypt also gave 892 and 808 as reference levels, which do not fully overlap with our swing range, so I’ll stick to the three levels calculated here.
The current price is hugging 1000. This round-number level is now the first stepping stone. If it holds, 1050 is the first resistance; above that, there is no spot-price ceiling from the past decade, only price discovery. If it fails, watch 912 first, then 827, and only then 752.
【How to use this tonight】
This move has gone this far because access, short squeeze, and the privacy narrative all stacked together. ZCSH provided the doorway, 34.5 million in short liquidations provided the fuel, and breaking through 1000 provided the sentiment. If any one of those cools off, 1050 can quickly turn into a long wick.
After payrolls, BTC is digesting rate-hike probabilities, while ZEC has not given all of it back. How long can this divergence last? The next key pin is still the CPI on September 11. If CPI comes in hot again, risk assets will likely give back more. If ZEC loses 1000 first, it will shift from leader to laggard.
Will you treat 1000 as the new floor, or 1050 as the first wick after a ten-year high?
$ZEC $BTC #隐私币 #比特币 #crypto
Dragonfly Captain | A finance blogger who likes analyzing data and candlesticks.
Not investment advice. The liquidity map is for reference only; position sizing is up to you. The chart reflects a Beijing-time snapshot from the afternoon of September 5.
ZEC on OKX just hit 1050.48, and the current price is still around 1005. BTC is still hovering below 80000. Are privacy coins continuing to set ten-year highs, or is the squeeze not over yet?
See the cover for the liquidity map. Spot data comes from OKX, and the article was written around 16:00 Beijing time on September 5, 2026. Market cap, ranking, and the 2016 high come from CoinGecko. ZCSH’s listing date and assets under management come from Grayscale’s product page. Friday’s short-liquidation figures are quoted by Decrypt from CoinGlass.
【First, let’s make the new high clear】
Yesterday on the 4-hour chart, it first reached 1029.99. The 1000 round-number level was crossed for the first time in ten years. In the early hours of today, the next push took the high to 1050.48, which is also the highest on OKX in the past 90 days, and a new high since this move began climbing from around 368 at the end of June.
Media like to call it an all-time high. CoinGecko records 3191.93 on October 28, 2016 as the ATH. The float on the first listing day was extremely thin, so that sky-high print is still above us; today we’re still about two-thirds below it. The numbers are fighting each other. The circulating market cap is about 17 billion dollars, ranking 11th, already above the roughly 13.3 billion dollar range of Dogecoin. Over the past 30 days, CoinGecko shows a gain of about 98%, and over the past year about 2324%.
【Where is the money coming from】
On August 25, Grayscale converted its original Zcash Trust into an exchange-traded product, ticker ZCSH, and it started trading on NYSE Arca. The listing date on the official product page is exactly that day. As of the September 3 data point, assets under management were about 415 million dollars. For the first time, brokerage accounts can access ZEC through a stock trading channel without managing private keys themselves.
On listing day, spot did not immediately go wild. That day on OKX, it dropped as low as 752 and closed at 770. The ETF first provided access, not instant inflows of real money. Over the following week, it climbed back above 850, and then after Waller turned dovish on September 3, it broke through 1000 in one go.
Friday’s stronger-than-expected nonfarm payrolls took BTC below 80000. ZEC, by contrast, printed a new high at 1029 that day, and then pushed up to 1050. Decrypt, citing CoinGlass, said that the move through 1000 liquidated about 34.5 million dollars in short positions, while total market liquidations were about 36.6 million dollars. Short covering turns into spot buy orders, which explains why the move accelerated once the round number was broken.
Zcash uses zero-knowledge proofs to hide transfer amounts and addresses. Its maximum supply is 21 million, using the same cap structure as Bitcoin. Monero is currently around 529, with a market cap of about 10 billion dollars, ranking behind it. This round’s privacy narrative first rewarded the one that could get an ETF.
【How to read the chart】
The daily RSI14 is about 72.9, still in overbought territory, though down from the 78 mentioned in the media on Friday. The 20-day moving average is about 781, and the 50-day moving average about 611; the short-term average is above the long-term average. The trend is still intact, but the short-term positioning is crowded.
From the 30-day low of 466 to 1050, the Fib retracement levels are 912 at 0.236, 827 at 0.382, and 758 at 0.5. The 758 area also lines up with the listing-day low around 752. Decrypt also gave 892 and 808 as reference levels, which do not fully overlap with our swing range, so I’ll stick to the three levels calculated here.
The current price is hugging 1000. This round-number level is now the first stepping stone. If it holds, 1050 is the first resistance; above that, there is no spot-price ceiling from the past decade, only price discovery. If it fails, watch 912 first, then 827, and only then 752.
【How to use this tonight】
This move has gone this far because access, short squeeze, and the privacy narrative all stacked together. ZCSH provided the doorway, 34.5 million in short liquidations provided the fuel, and breaking through 1000 provided the sentiment. If any one of those cools off, 1050 can quickly turn into a long wick.
After payrolls, BTC is digesting rate-hike probabilities, while ZEC has not given all of it back. How long can this divergence last? The next key pin is still the CPI on September 11. If CPI comes in hot again, risk assets will likely give back more. If ZEC loses 1000 first, it will shift from leader to laggard.
Will you treat 1000 as the new floor, or 1050 as the first wick after a ten-year high?
$ZEC $BTC #隐私币 #比特币 #crypto
Dragonfly Captain | A finance blogger who likes analyzing data and candlesticks.
Not investment advice. The liquidity map is for reference only; position sizing is up to you. The chart reflects a Beijing-time snapshot from the afternoon of September 5.
See the cover for the liquidity map. Spot data comes from OKX, and the article was written around 16:00 Beijing time on September 5, 2026. Market cap, ranking, and the 2016 high come from CoinGecko. ZCSH’s listing date and assets under management come from Grayscale’s product page. Friday’s short-liquidation figures are quoted by Decrypt from CoinGlass.
【First, let’s make the new high clear】
Yesterday on the 4-hour chart, it first reached 1029.99. The 1000 round-number level was crossed for the first time in ten years. In the early hours of today, the next push took the high to 1050.48, which is also the highest on OKX in the past 90 days, and a new high since this move began climbing from around 368 at the end of June.
Media like to call it an all-time high. CoinGecko records 3191.93 on October 28, 2016 as the ATH. The float on the first listing day was extremely thin, so that sky-high print is still above us; today we’re still about two-thirds below it. The numbers are fighting each other. The circulating market cap is about 17 billion dollars, ranking 11th, already above the roughly 13.3 billion dollar range of Dogecoin. Over the past 30 days, CoinGecko shows a gain of about 98%, and over the past year about 2324%.
【Where is the money coming from】
On August 25, Grayscale converted its original Zcash Trust into an exchange-traded product, ticker ZCSH, and it started trading on NYSE Arca. The listing date on the official product page is exactly that day. As of the September 3 data point, assets under management were about 415 million dollars. For the first time, brokerage accounts can access ZEC through a stock trading channel without managing private keys themselves.
On listing day, spot did not immediately go wild. That day on OKX, it dropped as low as 752 and closed at 770. The ETF first provided access, not instant inflows of real money. Over the following week, it climbed back above 850, and then after Waller turned dovish on September 3, it broke through 1000 in one go.
Friday’s stronger-than-expected nonfarm payrolls took BTC below 80000. ZEC, by contrast, printed a new high at 1029 that day, and then pushed up to 1050. Decrypt, citing CoinGlass, said that the move through 1000 liquidated about 34.5 million dollars in short positions, while total market liquidations were about 36.6 million dollars. Short covering turns into spot buy orders, which explains why the move accelerated once the round number was broken.
Zcash uses zero-knowledge proofs to hide transfer amounts and addresses. Its maximum supply is 21 million, using the same cap structure as Bitcoin. Monero is currently around 529, with a market cap of about 10 billion dollars, ranking behind it. This round’s privacy narrative first rewarded the one that could get an ETF.
【How to read the chart】
The daily RSI14 is about 72.9, still in overbought territory, though down from the 78 mentioned in the media on Friday. The 20-day moving average is about 781, and the 50-day moving average about 611; the short-term average is above the long-term average. The trend is still intact, but the short-term positioning is crowded.
From the 30-day low of 466 to 1050, the Fib retracement levels are 912 at 0.236, 827 at 0.382, and 758 at 0.5. The 758 area also lines up with the listing-day low around 752. Decrypt also gave 892 and 808 as reference levels, which do not fully overlap with our swing range, so I’ll stick to the three levels calculated here.
The current price is hugging 1000. This round-number level is now the first stepping stone. If it holds, 1050 is the first resistance; above that, there is no spot-price ceiling from the past decade, only price discovery. If it fails, watch 912 first, then 827, and only then 752.
【How to use this tonight】
This move has gone this far because access, short squeeze, and the privacy narrative all stacked together. ZCSH provided the doorway, 34.5 million in short liquidations provided the fuel, and breaking through 1000 provided the sentiment. If any one of those cools off, 1050 can quickly turn into a long wick.
After payrolls, BTC is digesting rate-hike probabilities, while ZEC has not given all of it back. How long can this divergence last? The next key pin is still the CPI on September 11. If CPI comes in hot again, risk assets will likely give back more. If ZEC loses 1000 first, it will shift from leader to laggard.
Will you treat 1000 as the new floor, or 1050 as the first wick after a ten-year high?
$ZEC $BTC #隐私币 #比特币 #crypto
Dragonfly Captain | A finance blogger who likes analyzing data and candlesticks.
Not investment advice. The liquidity map is for reference only; position sizing is up to you. The chart reflects a Beijing-time snapshot from the afternoon of September 5.

166
·
--
The nonfarm payrolls data broke through 80,000. OKX is now around 79,425, and the first hour’s bearish candle has already run about 2,000 points. Do you chase this bearish candle, or wait for a pullback before acting?
See the liquidity map on the cover. Spot prices are from OKX, and this was drafted around 22:00 Beijing time on September 4, 2026. The 24-hour high was 82,285 and the low was 78,703. The 15-minute candle on nonfarm payrolls dumped from 81,346 to 79,172, then dropped further to 78,990. August nonfarm payrolls added 162,000 jobs, versus market consensus of about 56,000. The number landed in the somewhat hot zone. 80,000, which was the first support marked in the morning, has become tonight’s first resistance.
【Where the current price is pinned】
Around 79,400, price is pressed against the 0.786 Fib retracement of the 78,450 to 82,300 rebound, with the exact level at 79,274. This is the lower-middle part of the big bearish candle. Short sellers on the pullback and dip buyers are crowded into the same zone.
【Shorts: wait for the pullback】
The first tier is 79,920 to 80,000. This is the 0.618 retracement of the same rebound, layered on top of a round number. After 80,000 was lost, this has become the first resistance.
The second tier is 80,375 and 80,830, the 0.5 and 0.382 levels respectively. If price pulls back here, the hot nonfarm narrative has not yet been disproved.
If the 1-hour candle closes above 80,830, near the pre-nonfarm high of 81,346, the first wave of shorts should step aside. In terms of targets, look first to 78,450, and below that to Waller’s 77,100 from that night.
【Longs: wait for a lower low】
Going long at the current price is crowded. The first tier is 78,990, the post-nonfarm 15-minute low. Only if that holds can you talk about a rebound back to 80,000.
The second tier is 78,700, right near the 24-hour low of 78,703. The third tier is 78,450, which is the structural low from the previous 12 hours. A break below it would open up 77,100.
For the rebound, first watch 79,920 and 80,000. 80,000 is now resistance. If the 1-hour candle closes below 78,450, the long setup against that reference fails, and the next target is directly 77,100.
【How to use tonight’s move】
The first hour has already priced in part of the hot data. Chasing shorts at 79,400 means some of the room is already gone. The cleaner approach is to wait for a pullback to 80,000 before considering shorts, or wait for 78,990 to 78,450 before considering longs. In between, both sides can get whipsawed.
The next real catalyst is still CPI on September 11. Tonight’s move is just repricing the odds of a rate cut. Waller tied the September decision to whether inflation keeps cooling; this jobs report is enough to raise the bar, but not enough to decide CPI for us.
Would you look to short on a pullback to 80,000, or wait for 78,450 before considering longs?
$BTC #比特币 #非农 #crypto
Dragonfly Captain | A finance blogger who likes analyzing data and candlesticks.
Not investment advice. Liquidity levels are for comparison only; position sizing is up to you. The market snapshot is about 90 minutes after the data release.
The nonfarm payrolls data broke through 80,000. OKX is now around 79,425, and the first hour’s bearish candle has already run about 2,000 points. Do you chase this bearish candle, or wait for a pullback before acting?
See the liquidity map on the cover. Spot prices are from OKX, and this was drafted around 22:00 Beijing time on September 4, 2026. The 24-hour high was 82,285 and the low was 78,703. The 15-minute candle on nonfarm payrolls dumped from 81,346 to 79,172, then dropped further to 78,990. August nonfarm payrolls added 162,000 jobs, versus market consensus of about 56,000. The number landed in the somewhat hot zone. 80,000, which was the first support marked in the morning, has become tonight’s first resistance.
【Where the current price is pinned】
Around 79,400, price is pressed against the 0.786 Fib retracement of the 78,450 to 82,300 rebound, with the exact level at 79,274. This is the lower-middle part of the big bearish candle. Short sellers on the pullback and dip buyers are crowded into the same zone.
【Shorts: wait for the pullback】
The first tier is 79,920 to 80,000. This is the 0.618 retracement of the same rebound, layered on top of a round number. After 80,000 was lost, this has become the first resistance.
The second tier is 80,375 and 80,830, the 0.5 and 0.382 levels respectively. If price pulls back here, the hot nonfarm narrative has not yet been disproved.
If the 1-hour candle closes above 80,830, near the pre-nonfarm high of 81,346, the first wave of shorts should step aside. In terms of targets, look first to 78,450, and below that to Waller’s 77,100 from that night.
【Longs: wait for a lower low】
Going long at the current price is crowded. The first tier is 78,990, the post-nonfarm 15-minute low. Only if that holds can you talk about a rebound back to 80,000.
The second tier is 78,700, right near the 24-hour low of 78,703. The third tier is 78,450, which is the structural low from the previous 12 hours. A break below it would open up 77,100.
For the rebound, first watch 79,920 and 80,000. 80,000 is now resistance. If the 1-hour candle closes below 78,450, the long setup against that reference fails, and the next target is directly 77,100.
【How to use tonight’s move】
The first hour has already priced in part of the hot data. Chasing shorts at 79,400 means some of the room is already gone. The cleaner approach is to wait for a pullback to 80,000 before considering shorts, or wait for 78,990 to 78,450 before considering longs. In between, both sides can get whipsawed.
The next real catalyst is still CPI on September 11. Tonight’s move is just repricing the odds of a rate cut. Waller tied the September decision to whether inflation keeps cooling; this jobs report is enough to raise the bar, but not enough to decide CPI for us.
Would you look to short on a pullback to 80,000, or wait for 78,450 before considering longs?
$BTC #比特币 #非农 #crypto
Dragonfly Captain | A finance blogger who likes analyzing data and candlesticks.
Not investment advice. Liquidity levels are for comparison only; position sizing is up to you. The market snapshot is about 90 minutes after the data release.
See the liquidity map on the cover. Spot prices are from OKX, and this was drafted around 22:00 Beijing time on September 4, 2026. The 24-hour high was 82,285 and the low was 78,703. The 15-minute candle on nonfarm payrolls dumped from 81,346 to 79,172, then dropped further to 78,990. August nonfarm payrolls added 162,000 jobs, versus market consensus of about 56,000. The number landed in the somewhat hot zone. 80,000, which was the first support marked in the morning, has become tonight’s first resistance.
【Where the current price is pinned】
Around 79,400, price is pressed against the 0.786 Fib retracement of the 78,450 to 82,300 rebound, with the exact level at 79,274. This is the lower-middle part of the big bearish candle. Short sellers on the pullback and dip buyers are crowded into the same zone.
【Shorts: wait for the pullback】
The first tier is 79,920 to 80,000. This is the 0.618 retracement of the same rebound, layered on top of a round number. After 80,000 was lost, this has become the first resistance.
The second tier is 80,375 and 80,830, the 0.5 and 0.382 levels respectively. If price pulls back here, the hot nonfarm narrative has not yet been disproved.
If the 1-hour candle closes above 80,830, near the pre-nonfarm high of 81,346, the first wave of shorts should step aside. In terms of targets, look first to 78,450, and below that to Waller’s 77,100 from that night.
【Longs: wait for a lower low】
Going long at the current price is crowded. The first tier is 78,990, the post-nonfarm 15-minute low. Only if that holds can you talk about a rebound back to 80,000.
The second tier is 78,700, right near the 24-hour low of 78,703. The third tier is 78,450, which is the structural low from the previous 12 hours. A break below it would open up 77,100.
For the rebound, first watch 79,920 and 80,000. 80,000 is now resistance. If the 1-hour candle closes below 78,450, the long setup against that reference fails, and the next target is directly 77,100.
【How to use tonight’s move】
The first hour has already priced in part of the hot data. Chasing shorts at 79,400 means some of the room is already gone. The cleaner approach is to wait for a pullback to 80,000 before considering shorts, or wait for 78,990 to 78,450 before considering longs. In between, both sides can get whipsawed.
The next real catalyst is still CPI on September 11. Tonight’s move is just repricing the odds of a rate cut. Waller tied the September decision to whether inflation keeps cooling; this jobs report is enough to raise the bar, but not enough to decide CPI for us.
Would you look to short on a pullback to 80,000, or wait for 78,450 before considering longs?
$BTC #比特币 #非农 #crypto
Dragonfly Captain | A finance blogger who likes analyzing data and candlesticks.
Not investment advice. Liquidity levels are for comparison only; position sizing is up to you. The market snapshot is about 90 minutes after the data release.
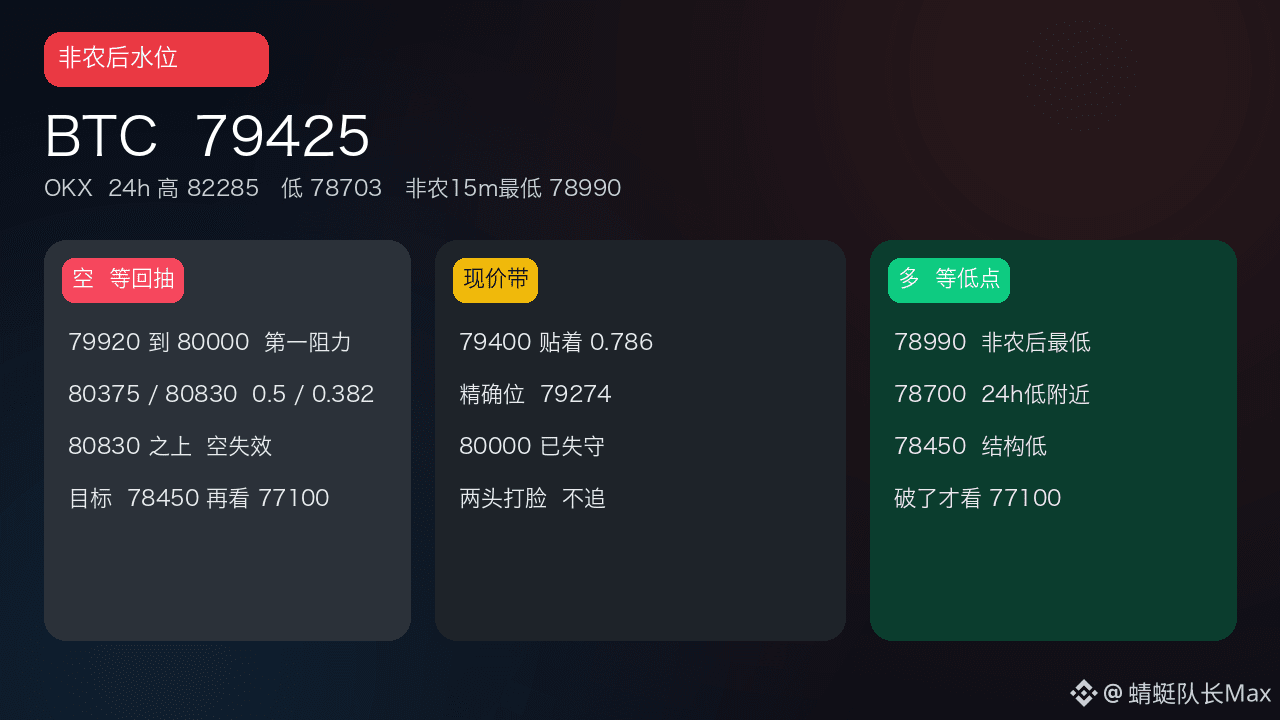
77
·
--
August nonfarm payrolls rose by 162,000, while the market consensus was about 56,000. The unemployment rate remained at 4.1%, and average hourly earnings rose 0.3% month over month, in line with expectations. The job gain falls into the mildly hot range I wrote about this morning; the unemployment rate and wages did not both surge. BTC is now around 79,860, and the 80,000 first support level I marked this morning has already been broken.
See the cover for comparison. Labor Statistics Bureau figures are quoted from Trading Economics’ real-time excerpt of BLS data. Spot prices are from OKX, and the article was written around 2026-09-04 20:40. The U.S. dollar index is about 99.35, the 10-year Treasury yield is about 4.80%, and the 2-year yield is about 4.42%.
【First, split the three columns】
Jobs are hot. 162,000 is about 100,000 above Reuters’ survey estimate of 56,000. Private-sector payrolls added 127,000, while government payrolls added 35,000. In July, local education had fallen by 50,000; this month, education jobs rebounded, explaining part of the recovery. Even if you strip out the government component, private payroll growth of 127,000 is still far above ADP’s 38,000.
July nonfarm payrolls were revised from a loss of 23,000 to a gain of about 21,000. Put those two numbers together, and the summer narrative of “continuous job losses” has been rewritten. Information is shedding jobs, while restaurants and local government education are adding them.
The unemployment rate was in line. It stayed at 4.1%. In the household survey, employment rose by about 569,000, the labor force increased by about 683,000, and the participation rate moved back up from 61.4% to 61.6%. July’s 4.1% had the feel of people leaving the labor market. This month, people came back, and the unemployment rate still held steady, which is healthier than last month. U-6 fell from 7.9% to 7.7%.
Wages did not accelerate further. Monthly growth was 0.3%, matching expectations, after July was revised from 0.1% to 0.2%. Year over year, wages rose 3.1%, slowing from July’s 3.2%. Average hourly earnings reached $37.75. The workweek was 34.4 hours, up from 34.3 previously. Waller’s inflation-sensitive “blade” was not sharpened by wages alone tonight.
【How the financial market reprices】
This is a combination that brings back rate-hike odds. The recession narrative does not fit tonight. Jobs are hot, so the dollar and short-term yields moved up first. The 2-year yield rose about 7 basis points, faster than the 10-year’s roughly 3 basis points. The curve is being pressured shorter as hike pricing returns. The dollar index gained about 0.45%. Crypto has no yield, so it is especially sensitive to this kind of repricing.
Among the three scenarios I laid out this morning, the hot trigger was payroll growth above 100,000. 162,000 hit that mark. The unemployment rate did not fall to 4.0%, and wages did not rise to 0.4%, so none of the three columns blew out together. The market’s first reaction will be to pull back on the idea implied by Waller that they can wait one more meeting. The full vote still depends on CPI on September 11. Waller tied the September decision to whether inflation continues cooling. This jobs report is enough to raise the bar, but not enough to replace CPI as the deciding factor.
U.S. stocks will have to yield to rates in the near term. Large-cap growth stocks are more sensitive to the 2-year yield. Gold and Bitcoin are both likely to absorb the dollar rebound tonight. Don’t mistake the first-minute wick for the trend.
【How to use the crypto chart】
On OKX, BTC is about 79,860, with a 24-hour high of 82,285 and a low of about 78,235. Last night it rallied from roughly 77,101 to 82,300, and a large part of that move was Waller pricing. With hot data out, 80,000 was lost, and the logic checks out. The next reference zone remains around 78,450, and only below that do the earlier lows come into play. ETH is around 2,454, with an intraday high of 2,547.
80,000 needs to be treated as resistance again; it can no longer be considered a confirmed floor. If the data are as expected, the range from 80,000 to 82,300 is still a consolidation box. Now that the lower edge has broken, the upper edge at 82,300 is further away. If CPI is also hot, hike odds will shift back from 50/50, and crypto may need to give back another leg. If CPI stays cool, tonight’s jobs report can be treated as a one-off shock, and 80,000 may still be bought back.
The July revision plus the rebound in education gives the Fed room to say this is a statistical rebound. Whether demand is overheating again will be judged separately by that 127,000 private-sector gain. Hawks will use it as ammunition. Both sides will cite the same table.
Tonight, will you wait for 80,000 to be reclaimed first, or treat 78,450 as the next level to watch? Jobs are hot and wages did not spike; which column do you think will make it into the September policy statement?
$BTC $ETH #非农 #美联储 #Bitcoin
Dragonfly Captain | A financial blogger who enjoys analyzing data and candlestick charts.
Not investment advice. Figures are based on the original BLS text, and the market snapshot is from about 10 minutes after the data release.
August nonfarm payrolls rose by 162,000, while the market consensus was about 56,000. The unemployment rate remained at 4.1%, and average hourly earnings rose 0.3% month over month, in line with expectations. The job gain falls into the mildly hot range I wrote about this morning; the unemployment rate and wages did not both surge. BTC is now around 79,860, and the 80,000 first support level I marked this morning has already been broken.
See the cover for comparison. Labor Statistics Bureau figures are quoted from Trading Economics’ real-time excerpt of BLS data. Spot prices are from OKX, and the article was written around 2026-09-04 20:40. The U.S. dollar index is about 99.35, the 10-year Treasury yield is about 4.80%, and the 2-year yield is about 4.42%.
【First, split the three columns】
Jobs are hot. 162,000 is about 100,000 above Reuters’ survey estimate of 56,000. Private-sector payrolls added 127,000, while government payrolls added 35,000. In July, local education had fallen by 50,000; this month, education jobs rebounded, explaining part of the recovery. Even if you strip out the government component, private payroll growth of 127,000 is still far above ADP’s 38,000.
July nonfarm payrolls were revised from a loss of 23,000 to a gain of about 21,000. Put those two numbers together, and the summer narrative of “continuous job losses” has been rewritten. Information is shedding jobs, while restaurants and local government education are adding them.
The unemployment rate was in line. It stayed at 4.1%. In the household survey, employment rose by about 569,000, the labor force increased by about 683,000, and the participation rate moved back up from 61.4% to 61.6%. July’s 4.1% had the feel of people leaving the labor market. This month, people came back, and the unemployment rate still held steady, which is healthier than last month. U-6 fell from 7.9% to 7.7%.
Wages did not accelerate further. Monthly growth was 0.3%, matching expectations, after July was revised from 0.1% to 0.2%. Year over year, wages rose 3.1%, slowing from July’s 3.2%. Average hourly earnings reached $37.75. The workweek was 34.4 hours, up from 34.3 previously. Waller’s inflation-sensitive “blade” was not sharpened by wages alone tonight.
【How the financial market reprices】
This is a combination that brings back rate-hike odds. The recession narrative does not fit tonight. Jobs are hot, so the dollar and short-term yields moved up first. The 2-year yield rose about 7 basis points, faster than the 10-year’s roughly 3 basis points. The curve is being pressured shorter as hike pricing returns. The dollar index gained about 0.45%. Crypto has no yield, so it is especially sensitive to this kind of repricing.
Among the three scenarios I laid out this morning, the hot trigger was payroll growth above 100,000. 162,000 hit that mark. The unemployment rate did not fall to 4.0%, and wages did not rise to 0.4%, so none of the three columns blew out together. The market’s first reaction will be to pull back on the idea implied by Waller that they can wait one more meeting. The full vote still depends on CPI on September 11. Waller tied the September decision to whether inflation continues cooling. This jobs report is enough to raise the bar, but not enough to replace CPI as the deciding factor.
U.S. stocks will have to yield to rates in the near term. Large-cap growth stocks are more sensitive to the 2-year yield. Gold and Bitcoin are both likely to absorb the dollar rebound tonight. Don’t mistake the first-minute wick for the trend.
【How to use the crypto chart】
On OKX, BTC is about 79,860, with a 24-hour high of 82,285 and a low of about 78,235. Last night it rallied from roughly 77,101 to 82,300, and a large part of that move was Waller pricing. With hot data out, 80,000 was lost, and the logic checks out. The next reference zone remains around 78,450, and only below that do the earlier lows come into play. ETH is around 2,454, with an intraday high of 2,547.
80,000 needs to be treated as resistance again; it can no longer be considered a confirmed floor. If the data are as expected, the range from 80,000 to 82,300 is still a consolidation box. Now that the lower edge has broken, the upper edge at 82,300 is further away. If CPI is also hot, hike odds will shift back from 50/50, and crypto may need to give back another leg. If CPI stays cool, tonight’s jobs report can be treated as a one-off shock, and 80,000 may still be bought back.
The July revision plus the rebound in education gives the Fed room to say this is a statistical rebound. Whether demand is overheating again will be judged separately by that 127,000 private-sector gain. Hawks will use it as ammunition. Both sides will cite the same table.
Tonight, will you wait for 80,000 to be reclaimed first, or treat 78,450 as the next level to watch? Jobs are hot and wages did not spike; which column do you think will make it into the September policy statement?
$BTC $ETH #非农 #美联储 #Bitcoin
Dragonfly Captain | A financial blogger who enjoys analyzing data and candlestick charts.
Not investment advice. Figures are based on the original BLS text, and the market snapshot is from about 10 minutes after the data release.
See the cover for comparison. Labor Statistics Bureau figures are quoted from Trading Economics’ real-time excerpt of BLS data. Spot prices are from OKX, and the article was written around 2026-09-04 20:40. The U.S. dollar index is about 99.35, the 10-year Treasury yield is about 4.80%, and the 2-year yield is about 4.42%.
【First, split the three columns】
Jobs are hot. 162,000 is about 100,000 above Reuters’ survey estimate of 56,000. Private-sector payrolls added 127,000, while government payrolls added 35,000. In July, local education had fallen by 50,000; this month, education jobs rebounded, explaining part of the recovery. Even if you strip out the government component, private payroll growth of 127,000 is still far above ADP’s 38,000.
July nonfarm payrolls were revised from a loss of 23,000 to a gain of about 21,000. Put those two numbers together, and the summer narrative of “continuous job losses” has been rewritten. Information is shedding jobs, while restaurants and local government education are adding them.
The unemployment rate was in line. It stayed at 4.1%. In the household survey, employment rose by about 569,000, the labor force increased by about 683,000, and the participation rate moved back up from 61.4% to 61.6%. July’s 4.1% had the feel of people leaving the labor market. This month, people came back, and the unemployment rate still held steady, which is healthier than last month. U-6 fell from 7.9% to 7.7%.
Wages did not accelerate further. Monthly growth was 0.3%, matching expectations, after July was revised from 0.1% to 0.2%. Year over year, wages rose 3.1%, slowing from July’s 3.2%. Average hourly earnings reached $37.75. The workweek was 34.4 hours, up from 34.3 previously. Waller’s inflation-sensitive “blade” was not sharpened by wages alone tonight.
【How the financial market reprices】
This is a combination that brings back rate-hike odds. The recession narrative does not fit tonight. Jobs are hot, so the dollar and short-term yields moved up first. The 2-year yield rose about 7 basis points, faster than the 10-year’s roughly 3 basis points. The curve is being pressured shorter as hike pricing returns. The dollar index gained about 0.45%. Crypto has no yield, so it is especially sensitive to this kind of repricing.
Among the three scenarios I laid out this morning, the hot trigger was payroll growth above 100,000. 162,000 hit that mark. The unemployment rate did not fall to 4.0%, and wages did not rise to 0.4%, so none of the three columns blew out together. The market’s first reaction will be to pull back on the idea implied by Waller that they can wait one more meeting. The full vote still depends on CPI on September 11. Waller tied the September decision to whether inflation continues cooling. This jobs report is enough to raise the bar, but not enough to replace CPI as the deciding factor.
U.S. stocks will have to yield to rates in the near term. Large-cap growth stocks are more sensitive to the 2-year yield. Gold and Bitcoin are both likely to absorb the dollar rebound tonight. Don’t mistake the first-minute wick for the trend.
【How to use the crypto chart】
On OKX, BTC is about 79,860, with a 24-hour high of 82,285 and a low of about 78,235. Last night it rallied from roughly 77,101 to 82,300, and a large part of that move was Waller pricing. With hot data out, 80,000 was lost, and the logic checks out. The next reference zone remains around 78,450, and only below that do the earlier lows come into play. ETH is around 2,454, with an intraday high of 2,547.
80,000 needs to be treated as resistance again; it can no longer be considered a confirmed floor. If the data are as expected, the range from 80,000 to 82,300 is still a consolidation box. Now that the lower edge has broken, the upper edge at 82,300 is further away. If CPI is also hot, hike odds will shift back from 50/50, and crypto may need to give back another leg. If CPI stays cool, tonight’s jobs report can be treated as a one-off shock, and 80,000 may still be bought back.
The July revision plus the rebound in education gives the Fed room to say this is a statistical rebound. Whether demand is overheating again will be judged separately by that 127,000 private-sector gain. Hawks will use it as ammunition. Both sides will cite the same table.
Tonight, will you wait for 80,000 to be reclaimed first, or treat 78,450 as the next level to watch? Jobs are hot and wages did not spike; which column do you think will make it into the September policy statement?
$BTC $ETH #非农 #美联储 #Bitcoin
Dragonfly Captain | A financial blogger who enjoys analyzing data and candlestick charts.
Not investment advice. Figures are based on the original BLS text, and the market snapshot is from about 10 minutes after the data release.
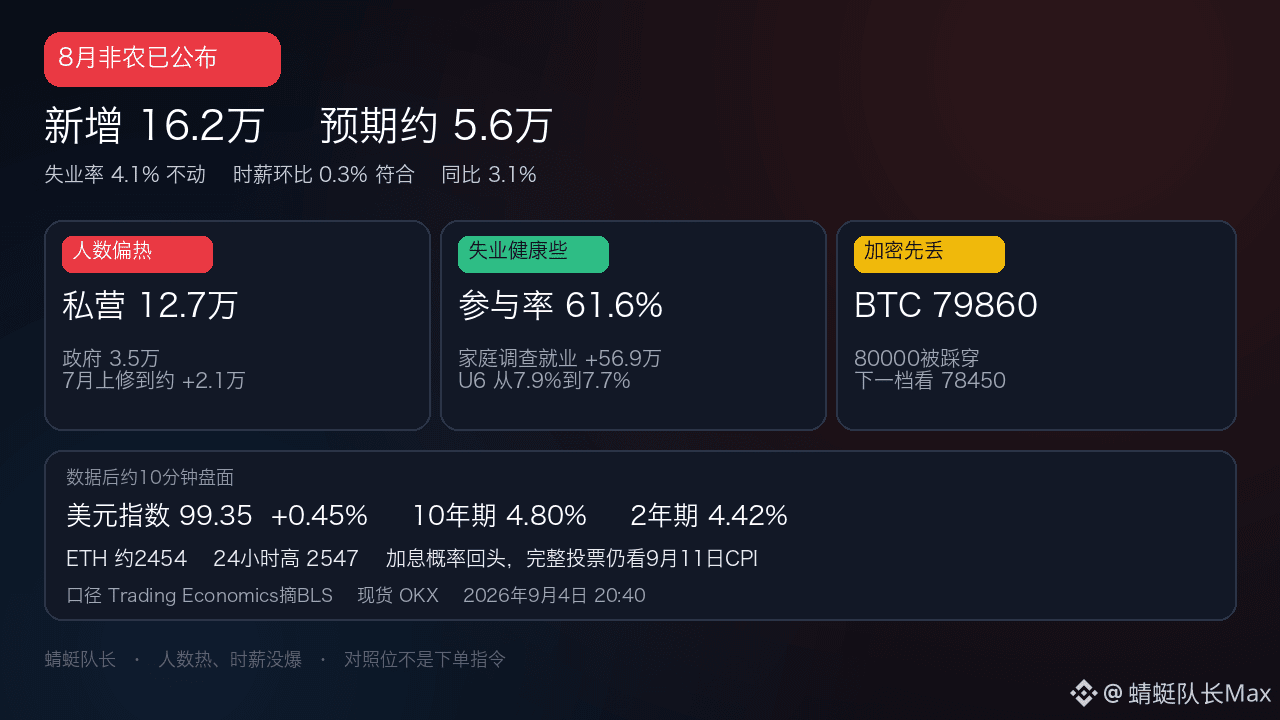
237
·
--
On Thursday, Tesla rose $376.37, up about 5.4% following Austin’s Cybercab closed-door event. The 52-week high is still at $498.83. In the same day, Nvidia’s market cap was about $5.55 trillion, while Tesla’s was about $1.2 trillion to $1.5 trillion. In the AI wave, who will touch $10 trillion first—the math can be done right now.
For comparison, see the cover. The stock price uses Yahoo daily data with the Sept. 3 closing price. Operational figures come from Tesla’s 2026 Q2 shareholder letter and its 10-Q. The progress on the robotaxi crosses what the company disclosed, CNBC reported, and Texas DMV records.
【Fill the gap on the chart first】
This rebound started from the July 29 low of 297.38. Before the July 22 earnings report, it closed at 374.01; the next day it was smashed to 319.69, with 116 million shares traded. After that, it climbed back up along the moving averages. The 20-day moving average is 347.16, the 50-day moving average is 358.37—price has already regained them. The 200-day moving average is still at 399.83; the long-term “big” moving average has not been reclaimed yet.
From 297.38 to Thursday’s high of 384.04, the pullback reference levels are 363.59, 350.94, 340.71, and 330.48. Thursday’s low was 365.82, hugging the first tier. To strengthen, first watch for the close holding above 384. Only then does the market get to the 200-day moving average around 400, and then the range from early July—420 to 433. Invalidation happens if the close falls back into the 351 to 341 band.
The first closing of the year was around 438, and it’s down about 14% from then. The market is re-pricing mass-produced cars without a steering wheel, but it hasn’t swapped the entire valuation logic into a Robotaxi company.
【Cars are being sold, but profits are eaten by infrastructure】
In Q2, revenue was $28.24 billion, up 26% year over year. Automobiles were $20.52 billion, energy $3.14 billion, and services/other $4.58 billion. Deliveries were 480.1 thousand vehicles, up 25% year over year and a Q2 record. Over the past 12 months, revenue crossed $100 billion for the first time. Cash and short-term investments were $43.5 billion.
Same statement. Operating profit was $398 million, down 57% year over year, with the operating margin shrinking to just 1.4%. Operating expenses were $4.35 billion, up 47%. Capex was $5.79 billion, up 142%. Free cash flow was negative $1.1 billion. Of GAAP net income of $1.11 billion, about $1.0 billion came from unrealized gains on SpaceX equity. After that is deducted, profit is heading downhill.
FSD subscriptions are currently the segment that most resembles software. Active users are 1.48 million, up 56% year over year. North America new-car attach rates are above 55%. It still requires a driver to watch the steering wheel.
【Robotaxi is already on the road, but the scale is still a fraction】
The company says Robotaxi is operating in the U.S. across seven major metro areas. Austin expanded the no-operator supervised coverage area. In July, it opened no-operator operations in Miami, Orlando, and Tampa. The Bay Area is still running with safety drivers. Cybercab is now in production at the Texas factory; on paper, annual capacity exceeds 125,000 units. Starting in July, employees can test-ride inside the facility.
Cumulative paid Robotaxi miles were about 2.4 million as of the end of June. In the same materials, FSD miles with human monitoring totaled about 12 billion. Texas DMV registrations that can perform autonomous driving operations are about 420 vehicles, including about 45 Cybercabs. Using the tracking definition cited by CNBC—across the U.S., registrations for no-operator supervised driving are just over 200. Waymo is running about 4,000 vehicles across roughly 14 cities.
The Sept. 3 event was closed-door and not livestreamed. The stock first jumped 5.4%—as the two-seat, no-steering-wheel cars finally appeared on the street. Morgan Stanley’s near-term checks are more stringent. In several Texas cities, can paid robotaxis expand quickly to the 25-to-50 vehicle range? The production capacity figure is already written as 125,000, but vehicles actually able to run on the road are still in the low double digits to low three digits. Musk said on the call that injuring someone becomes a global headline and regulation would tighten immediately.
As for Optimus, Fremont has dismantled the Model S and Model X production lines and is installing a next-generation robotics production line. The first batch is for training data collection; it is not being sold to customers. The Texas factory facilities are still under construction.
【$10 trillion—the default first seat isn’t here】
In the 10-Q, as of June 30, about 3.949 billion shares of common stock had been issued, with quarterly weighted average shares of about 3.237 billion. Multiply issued shares by $376.37 gives a market cap of about $1.49 trillion. Using basic weighted average gives about $1.22 trillion. To reach $10 trillion, the stock price would need to be around $2,500—about 7x.
Nvidia closed at $228.45 on Thursday. Based on diluted shares outstanding of about 24.285 billion shares in Q2, its market cap is about $5.55 trillion. It would need roughly another 1.8x to reach $10 trillion. In the same quarter, Nvidia revenue was $96.2 billion and operating profit was $63.7 billion. Tesla revenue was $28.2 billion and operating profit was $0.4 billion. The profit difference is two orders of magnitude.
Musk frames $10 trillion more as an Optimus revenue vision, and he has also said that about 80% of Tesla’s future value will come from robots. The Q2 materials make it clear: the first batch of Optimus is not delivered to customers. Robotaxi can help explain why 297 can rebound to 376—but it can’t explain $10 trillion. To change that judgment, you need to see three things at the same time. Paid robotaxis must grow from hundreds to tens of thousands. Optimus must start replacing measurable labor hours inside the factory. Operating margin must rise from 1.4% back to a level that supports software-like valuation. Right now, none of the three is in place.
Will you chase the robotaxi narrative above 384, or wait until 351 to 341 to talk? For the $10 trillion hat, would you rather assign it first to Nvidia, or keep betting on Tesla doubling and then doubling again?
$TSLA $NVDA #特斯拉 #无人驾驶 #US stocks
Captain Dragonfly|A finance blogger who likes analyzing data and candlestick charts.
Not investment advice. Price levels use the Sept. 3 closing snapshot; the U.S. stock market Friday has not opened yet.
On Thursday, Tesla rose $376.37, up about 5.4% following Austin’s Cybercab closed-door event. The 52-week high is still at $498.83. In the same day, Nvidia’s market cap was about $5.55 trillion, while Tesla’s was about $1.2 trillion to $1.5 trillion. In the AI wave, who will touch $10 trillion first—the math can be done right now.
For comparison, see the cover. The stock price uses Yahoo daily data with the Sept. 3 closing price. Operational figures come from Tesla’s 2026 Q2 shareholder letter and its 10-Q. The progress on the robotaxi crosses what the company disclosed, CNBC reported, and Texas DMV records.
【Fill the gap on the chart first】
This rebound started from the July 29 low of 297.38. Before the July 22 earnings report, it closed at 374.01; the next day it was smashed to 319.69, with 116 million shares traded. After that, it climbed back up along the moving averages. The 20-day moving average is 347.16, the 50-day moving average is 358.37—price has already regained them. The 200-day moving average is still at 399.83; the long-term “big” moving average has not been reclaimed yet.
From 297.38 to Thursday’s high of 384.04, the pullback reference levels are 363.59, 350.94, 340.71, and 330.48. Thursday’s low was 365.82, hugging the first tier. To strengthen, first watch for the close holding above 384. Only then does the market get to the 200-day moving average around 400, and then the range from early July—420 to 433. Invalidation happens if the close falls back into the 351 to 341 band.
The first closing of the year was around 438, and it’s down about 14% from then. The market is re-pricing mass-produced cars without a steering wheel, but it hasn’t swapped the entire valuation logic into a Robotaxi company.
【Cars are being sold, but profits are eaten by infrastructure】
In Q2, revenue was $28.24 billion, up 26% year over year. Automobiles were $20.52 billion, energy $3.14 billion, and services/other $4.58 billion. Deliveries were 480.1 thousand vehicles, up 25% year over year and a Q2 record. Over the past 12 months, revenue crossed $100 billion for the first time. Cash and short-term investments were $43.5 billion.
Same statement. Operating profit was $398 million, down 57% year over year, with the operating margin shrinking to just 1.4%. Operating expenses were $4.35 billion, up 47%. Capex was $5.79 billion, up 142%. Free cash flow was negative $1.1 billion. Of GAAP net income of $1.11 billion, about $1.0 billion came from unrealized gains on SpaceX equity. After that is deducted, profit is heading downhill.
FSD subscriptions are currently the segment that most resembles software. Active users are 1.48 million, up 56% year over year. North America new-car attach rates are above 55%. It still requires a driver to watch the steering wheel.
【Robotaxi is already on the road, but the scale is still a fraction】
The company says Robotaxi is operating in the U.S. across seven major metro areas. Austin expanded the no-operator supervised coverage area. In July, it opened no-operator operations in Miami, Orlando, and Tampa. The Bay Area is still running with safety drivers. Cybercab is now in production at the Texas factory; on paper, annual capacity exceeds 125,000 units. Starting in July, employees can test-ride inside the facility.
Cumulative paid Robotaxi miles were about 2.4 million as of the end of June. In the same materials, FSD miles with human monitoring totaled about 12 billion. Texas DMV registrations that can perform autonomous driving operations are about 420 vehicles, including about 45 Cybercabs. Using the tracking definition cited by CNBC—across the U.S., registrations for no-operator supervised driving are just over 200. Waymo is running about 4,000 vehicles across roughly 14 cities.
The Sept. 3 event was closed-door and not livestreamed. The stock first jumped 5.4%—as the two-seat, no-steering-wheel cars finally appeared on the street. Morgan Stanley’s near-term checks are more stringent. In several Texas cities, can paid robotaxis expand quickly to the 25-to-50 vehicle range? The production capacity figure is already written as 125,000, but vehicles actually able to run on the road are still in the low double digits to low three digits. Musk said on the call that injuring someone becomes a global headline and regulation would tighten immediately.
As for Optimus, Fremont has dismantled the Model S and Model X production lines and is installing a next-generation robotics production line. The first batch is for training data collection; it is not being sold to customers. The Texas factory facilities are still under construction.
【$10 trillion—the default first seat isn’t here】
In the 10-Q, as of June 30, about 3.949 billion shares of common stock had been issued, with quarterly weighted average shares of about 3.237 billion. Multiply issued shares by $376.37 gives a market cap of about $1.49 trillion. Using basic weighted average gives about $1.22 trillion. To reach $10 trillion, the stock price would need to be around $2,500—about 7x.
Nvidia closed at $228.45 on Thursday. Based on diluted shares outstanding of about 24.285 billion shares in Q2, its market cap is about $5.55 trillion. It would need roughly another 1.8x to reach $10 trillion. In the same quarter, Nvidia revenue was $96.2 billion and operating profit was $63.7 billion. Tesla revenue was $28.2 billion and operating profit was $0.4 billion. The profit difference is two orders of magnitude.
Musk frames $10 trillion more as an Optimus revenue vision, and he has also said that about 80% of Tesla’s future value will come from robots. The Q2 materials make it clear: the first batch of Optimus is not delivered to customers. Robotaxi can help explain why 297 can rebound to 376—but it can’t explain $10 trillion. To change that judgment, you need to see three things at the same time. Paid robotaxis must grow from hundreds to tens of thousands. Optimus must start replacing measurable labor hours inside the factory. Operating margin must rise from 1.4% back to a level that supports software-like valuation. Right now, none of the three is in place.
Will you chase the robotaxi narrative above 384, or wait until 351 to 341 to talk? For the $10 trillion hat, would you rather assign it first to Nvidia, or keep betting on Tesla doubling and then doubling again?
$TSLA $NVDA #特斯拉 #无人驾驶 #US stocks
Captain Dragonfly|A finance blogger who likes analyzing data and candlestick charts.
Not investment advice. Price levels use the Sept. 3 closing snapshot; the U.S. stock market Friday has not opened yet.
For comparison, see the cover. The stock price uses Yahoo daily data with the Sept. 3 closing price. Operational figures come from Tesla’s 2026 Q2 shareholder letter and its 10-Q. The progress on the robotaxi crosses what the company disclosed, CNBC reported, and Texas DMV records.
【Fill the gap on the chart first】
This rebound started from the July 29 low of 297.38. Before the July 22 earnings report, it closed at 374.01; the next day it was smashed to 319.69, with 116 million shares traded. After that, it climbed back up along the moving averages. The 20-day moving average is 347.16, the 50-day moving average is 358.37—price has already regained them. The 200-day moving average is still at 399.83; the long-term “big” moving average has not been reclaimed yet.
From 297.38 to Thursday’s high of 384.04, the pullback reference levels are 363.59, 350.94, 340.71, and 330.48. Thursday’s low was 365.82, hugging the first tier. To strengthen, first watch for the close holding above 384. Only then does the market get to the 200-day moving average around 400, and then the range from early July—420 to 433. Invalidation happens if the close falls back into the 351 to 341 band.
The first closing of the year was around 438, and it’s down about 14% from then. The market is re-pricing mass-produced cars without a steering wheel, but it hasn’t swapped the entire valuation logic into a Robotaxi company.
【Cars are being sold, but profits are eaten by infrastructure】
In Q2, revenue was $28.24 billion, up 26% year over year. Automobiles were $20.52 billion, energy $3.14 billion, and services/other $4.58 billion. Deliveries were 480.1 thousand vehicles, up 25% year over year and a Q2 record. Over the past 12 months, revenue crossed $100 billion for the first time. Cash and short-term investments were $43.5 billion.
Same statement. Operating profit was $398 million, down 57% year over year, with the operating margin shrinking to just 1.4%. Operating expenses were $4.35 billion, up 47%. Capex was $5.79 billion, up 142%. Free cash flow was negative $1.1 billion. Of GAAP net income of $1.11 billion, about $1.0 billion came from unrealized gains on SpaceX equity. After that is deducted, profit is heading downhill.
FSD subscriptions are currently the segment that most resembles software. Active users are 1.48 million, up 56% year over year. North America new-car attach rates are above 55%. It still requires a driver to watch the steering wheel.
【Robotaxi is already on the road, but the scale is still a fraction】
The company says Robotaxi is operating in the U.S. across seven major metro areas. Austin expanded the no-operator supervised coverage area. In July, it opened no-operator operations in Miami, Orlando, and Tampa. The Bay Area is still running with safety drivers. Cybercab is now in production at the Texas factory; on paper, annual capacity exceeds 125,000 units. Starting in July, employees can test-ride inside the facility.
Cumulative paid Robotaxi miles were about 2.4 million as of the end of June. In the same materials, FSD miles with human monitoring totaled about 12 billion. Texas DMV registrations that can perform autonomous driving operations are about 420 vehicles, including about 45 Cybercabs. Using the tracking definition cited by CNBC—across the U.S., registrations for no-operator supervised driving are just over 200. Waymo is running about 4,000 vehicles across roughly 14 cities.
The Sept. 3 event was closed-door and not livestreamed. The stock first jumped 5.4%—as the two-seat, no-steering-wheel cars finally appeared on the street. Morgan Stanley’s near-term checks are more stringent. In several Texas cities, can paid robotaxis expand quickly to the 25-to-50 vehicle range? The production capacity figure is already written as 125,000, but vehicles actually able to run on the road are still in the low double digits to low three digits. Musk said on the call that injuring someone becomes a global headline and regulation would tighten immediately.
As for Optimus, Fremont has dismantled the Model S and Model X production lines and is installing a next-generation robotics production line. The first batch is for training data collection; it is not being sold to customers. The Texas factory facilities are still under construction.
【$10 trillion—the default first seat isn’t here】
In the 10-Q, as of June 30, about 3.949 billion shares of common stock had been issued, with quarterly weighted average shares of about 3.237 billion. Multiply issued shares by $376.37 gives a market cap of about $1.49 trillion. Using basic weighted average gives about $1.22 trillion. To reach $10 trillion, the stock price would need to be around $2,500—about 7x.
Nvidia closed at $228.45 on Thursday. Based on diluted shares outstanding of about 24.285 billion shares in Q2, its market cap is about $5.55 trillion. It would need roughly another 1.8x to reach $10 trillion. In the same quarter, Nvidia revenue was $96.2 billion and operating profit was $63.7 billion. Tesla revenue was $28.2 billion and operating profit was $0.4 billion. The profit difference is two orders of magnitude.
Musk frames $10 trillion more as an Optimus revenue vision, and he has also said that about 80% of Tesla’s future value will come from robots. The Q2 materials make it clear: the first batch of Optimus is not delivered to customers. Robotaxi can help explain why 297 can rebound to 376—but it can’t explain $10 trillion. To change that judgment, you need to see three things at the same time. Paid robotaxis must grow from hundreds to tens of thousands. Optimus must start replacing measurable labor hours inside the factory. Operating margin must rise from 1.4% back to a level that supports software-like valuation. Right now, none of the three is in place.
Will you chase the robotaxi narrative above 384, or wait until 351 to 341 to talk? For the $10 trillion hat, would you rather assign it first to Nvidia, or keep betting on Tesla doubling and then doubling again?
$TSLA $NVDA #特斯拉 #无人驾驶 #US stocks
Captain Dragonfly|A finance blogger who likes analyzing data and candlestick charts.
Not investment advice. Price levels use the Sept. 3 closing snapshot; the U.S. stock market Friday has not opened yet.

194
·
--
The consideration written down by Jensen Huang himself is $12.9303 billion. The 8-K breaks the structure into paying shareholders about $11.9 billion, plus up to 1 billion shares of equity to retain talent. On Thursday, Nvidia closed at $228.45, up 1.8%. For a company of about $5.55 trillion, can this money change the trend?
For reference, see the cover. The agreement date is September 2; Jensen Huang’s blog post and the 8-K were filed on September 3. The current price uses Yahoo’s daily line Thursday close. The financial figures use Nvidia’s FY2027 Q2 earnings release, with the quarter ended July 26.
【First, let’s work out the transaction math】
This is signed but not yet delivered. The official guidance is to complete it in the first half of 2027, and it still needs to clear regulatory review. Today, Nvidia did not include Hugging Face in the filings.
For the consideration of $1.293 billion, relative to Thursday’s closing market cap, that’s about 0.23%. I calculated market cap by taking the diluted shares for the quarter (2.4285 billion shares) multiplied by $228.45. In the same quarter, revenue was $96.22 billion, free cash flow $21.34 billion, cash and cash equivalents $22.24 billion, and marketable debt securities $34.14 billion. Remaining share repurchase authorization is about $99 billion; in Q2 alone, Nvidia returned about $26 billion to shareholders.
Looking at cash flow, this amount is roughly equal to about half a quarter’s free cash flow. Looking at market cap, it can barely make a ripple. If the stock only jumps because of the acquisition headline, it looks more like sentiment than discounted value.
【What you’re buying is the distribution layer, not one-quarter profit】
Huang wrote it very clearly. On Hugging Face there are more than 18 million developers, researchers, and creators; more than 3 million models, 500,000 datasets, and 1 million applications; and more than 200,000 companies use it. Nvidia itself is already one of the largest open-source model and data contributors on the platform, having released more than 500 models and more than 250 publicly available datasets.
He also wrote firm commitments. The platform will remain open to the entire ecosystem. Developers choose their own models, frameworks, clouds, and inference services themselves, and they also choose their own computing platform. Using Hugging Face doesn’t require binding to Nvidia’s compute. The 8-K puts this sentence into the regulatory filing, and it also states that Nvidia will continue to support other chip vendors.
That’s the logic the stock should follow. Large customers are making their own chips. Open-source models pull developers out of closed interfaces. Whoever controls the model marketplace is closer to the next order. CNBC ranked this deal second in Nvidia’s acquisition history; previously, Groq’s asset transaction was about $20 billion. The software layer fills the community and distribution gaps that Groq didn’t cover.
The media previously estimated a multiple based on about $150 million in annual revenue, but the company hasn’t disclosed that revenue officially. The “86x sales” algorithm can only be used as a supporting clue—it can’t serve as a pricing anchor.
【Regulation and neutrality—those are the two “feet” that truly move the stock price】
The 8-K adds a segment on risks. Some people are lobbying to restrict open-source models. Many popular open-source models originated in China and then, after reaching the U.S. and the rest of the world, were downloaded, rewritten, and fine-tuned. Any rules that restrict how derivative models from a particular region are handled could materially affect the Hugging Face platform—and would also hit Nvidia’s own business.
The other foot is neutrality. The platform is valuable because it can still, now, send models to Nvidia, AMD, and others at the same time. After the acquisition, if developers feel the marketplace becomes “locked,” network effects may fracture first—and what you bought for $1.29 billion would be a hollow shell.
So my view on the stock price is quite narrow. This deal shows Nvidia is willing to spend spare change to lock in the open-source distribution layer. It doesn’t explain how much $228 is worth. The 1.8% on Thursday digested part of the headline. What comes next is whether the Q3 guidance of $108 billion can hold up, and whether regulatory scrutiny will delay closing from the first half of 2027 to later.
【How to use the water level】
On the daily chart, from the earnings report close on August 26 at 209.66, the price surged the next day to 230.47. On September 3, the intraday high was 230.40, the low 224.75, and it closed at 228.45. The 20-day moving average is 219.76, the 50-day is 209.87, and the 200-day is 196.46. The 52-week high of 236.54 appeared on May 14.
For a pullback to watch, I mark levels based on the retracement from the high right after receiving the earnings report. 0.236 is about 225.56, close to Thursday’s low at 224.75. 0.382 is about 222.52. 0.5 is about 220.07, right around the 20-day moving average. 0.618 is about 217.61; on August 28 and September 1, price already paused in this area.
For a strength scenario to watch, first see whether the close can hold above 230.40 to 230.47. Only then does it make room for the 52-week high at 236.54. For an invalidation scenario, if the close falls back below the earnings-report gap’s lower edge at 209.66 and also breaks below the 50-day moving average at 209.87, that would indicate the market no longer treats the acquisition as a positive factor, and instead starts discounting growth and regulation.
These are reference levels, not trading instructions. Tonight Beijing time at 20:30 there is the U.S. Non-Farm Payrolls; the U.S. market on Friday will reprice rates first. Nvidia—being a high-weight stock—will likely see opening changes in response to rates more easily than Hugging Face’s headline.
Would you add to positions above 228 because the model marketplace is being bought, or would you wait to discuss it again when it pulls back to 225–220? If regulators delay closing past the first half of 2027, can you still hold this price?
$NVDA $QQQ #英伟达 #美股 #artificial intelligence
Dragonfly Captain|A finance blogger who likes analyzing data and candlestick charts.
Not investment advice. Trading should follow the 8-K. Entry/exit levels are based on the September 3 closing snapshot; the U.S. market on Friday has not opened yet.
The consideration written down by Jensen Huang himself is $12.9303 billion. The 8-K breaks the structure into paying shareholders about $11.9 billion, plus up to 1 billion shares of equity to retain talent. On Thursday, Nvidia closed at $228.45, up 1.8%. For a company of about $5.55 trillion, can this money change the trend?
For reference, see the cover. The agreement date is September 2; Jensen Huang’s blog post and the 8-K were filed on September 3. The current price uses Yahoo’s daily line Thursday close. The financial figures use Nvidia’s FY2027 Q2 earnings release, with the quarter ended July 26.
【First, let’s work out the transaction math】
This is signed but not yet delivered. The official guidance is to complete it in the first half of 2027, and it still needs to clear regulatory review. Today, Nvidia did not include Hugging Face in the filings.
For the consideration of $1.293 billion, relative to Thursday’s closing market cap, that’s about 0.23%. I calculated market cap by taking the diluted shares for the quarter (2.4285 billion shares) multiplied by $228.45. In the same quarter, revenue was $96.22 billion, free cash flow $21.34 billion, cash and cash equivalents $22.24 billion, and marketable debt securities $34.14 billion. Remaining share repurchase authorization is about $99 billion; in Q2 alone, Nvidia returned about $26 billion to shareholders.
Looking at cash flow, this amount is roughly equal to about half a quarter’s free cash flow. Looking at market cap, it can barely make a ripple. If the stock only jumps because of the acquisition headline, it looks more like sentiment than discounted value.
【What you’re buying is the distribution layer, not one-quarter profit】
Huang wrote it very clearly. On Hugging Face there are more than 18 million developers, researchers, and creators; more than 3 million models, 500,000 datasets, and 1 million applications; and more than 200,000 companies use it. Nvidia itself is already one of the largest open-source model and data contributors on the platform, having released more than 500 models and more than 250 publicly available datasets.
He also wrote firm commitments. The platform will remain open to the entire ecosystem. Developers choose their own models, frameworks, clouds, and inference services themselves, and they also choose their own computing platform. Using Hugging Face doesn’t require binding to Nvidia’s compute. The 8-K puts this sentence into the regulatory filing, and it also states that Nvidia will continue to support other chip vendors.
That’s the logic the stock should follow. Large customers are making their own chips. Open-source models pull developers out of closed interfaces. Whoever controls the model marketplace is closer to the next order. CNBC ranked this deal second in Nvidia’s acquisition history; previously, Groq’s asset transaction was about $20 billion. The software layer fills the community and distribution gaps that Groq didn’t cover.
The media previously estimated a multiple based on about $150 million in annual revenue, but the company hasn’t disclosed that revenue officially. The “86x sales” algorithm can only be used as a supporting clue—it can’t serve as a pricing anchor.
【Regulation and neutrality—those are the two “feet” that truly move the stock price】
The 8-K adds a segment on risks. Some people are lobbying to restrict open-source models. Many popular open-source models originated in China and then, after reaching the U.S. and the rest of the world, were downloaded, rewritten, and fine-tuned. Any rules that restrict how derivative models from a particular region are handled could materially affect the Hugging Face platform—and would also hit Nvidia’s own business.
The other foot is neutrality. The platform is valuable because it can still, now, send models to Nvidia, AMD, and others at the same time. After the acquisition, if developers feel the marketplace becomes “locked,” network effects may fracture first—and what you bought for $1.29 billion would be a hollow shell.
So my view on the stock price is quite narrow. This deal shows Nvidia is willing to spend spare change to lock in the open-source distribution layer. It doesn’t explain how much $228 is worth. The 1.8% on Thursday digested part of the headline. What comes next is whether the Q3 guidance of $108 billion can hold up, and whether regulatory scrutiny will delay closing from the first half of 2027 to later.
【How to use the water level】
On the daily chart, from the earnings report close on August 26 at 209.66, the price surged the next day to 230.47. On September 3, the intraday high was 230.40, the low 224.75, and it closed at 228.45. The 20-day moving average is 219.76, the 50-day is 209.87, and the 200-day is 196.46. The 52-week high of 236.54 appeared on May 14.
For a pullback to watch, I mark levels based on the retracement from the high right after receiving the earnings report. 0.236 is about 225.56, close to Thursday’s low at 224.75. 0.382 is about 222.52. 0.5 is about 220.07, right around the 20-day moving average. 0.618 is about 217.61; on August 28 and September 1, price already paused in this area.
For a strength scenario to watch, first see whether the close can hold above 230.40 to 230.47. Only then does it make room for the 52-week high at 236.54. For an invalidation scenario, if the close falls back below the earnings-report gap’s lower edge at 209.66 and also breaks below the 50-day moving average at 209.87, that would indicate the market no longer treats the acquisition as a positive factor, and instead starts discounting growth and regulation.
These are reference levels, not trading instructions. Tonight Beijing time at 20:30 there is the U.S. Non-Farm Payrolls; the U.S. market on Friday will reprice rates first. Nvidia—being a high-weight stock—will likely see opening changes in response to rates more easily than Hugging Face’s headline.
Would you add to positions above 228 because the model marketplace is being bought, or would you wait to discuss it again when it pulls back to 225–220? If regulators delay closing past the first half of 2027, can you still hold this price?
$NVDA $QQQ #英伟达 #美股 #artificial intelligence
Dragonfly Captain|A finance blogger who likes analyzing data and candlestick charts.
Not investment advice. Trading should follow the 8-K. Entry/exit levels are based on the September 3 closing snapshot; the U.S. market on Friday has not opened yet.
For reference, see the cover. The agreement date is September 2; Jensen Huang’s blog post and the 8-K were filed on September 3. The current price uses Yahoo’s daily line Thursday close. The financial figures use Nvidia’s FY2027 Q2 earnings release, with the quarter ended July 26.
【First, let’s work out the transaction math】
This is signed but not yet delivered. The official guidance is to complete it in the first half of 2027, and it still needs to clear regulatory review. Today, Nvidia did not include Hugging Face in the filings.
For the consideration of $1.293 billion, relative to Thursday’s closing market cap, that’s about 0.23%. I calculated market cap by taking the diluted shares for the quarter (2.4285 billion shares) multiplied by $228.45. In the same quarter, revenue was $96.22 billion, free cash flow $21.34 billion, cash and cash equivalents $22.24 billion, and marketable debt securities $34.14 billion. Remaining share repurchase authorization is about $99 billion; in Q2 alone, Nvidia returned about $26 billion to shareholders.
Looking at cash flow, this amount is roughly equal to about half a quarter’s free cash flow. Looking at market cap, it can barely make a ripple. If the stock only jumps because of the acquisition headline, it looks more like sentiment than discounted value.
【What you’re buying is the distribution layer, not one-quarter profit】
Huang wrote it very clearly. On Hugging Face there are more than 18 million developers, researchers, and creators; more than 3 million models, 500,000 datasets, and 1 million applications; and more than 200,000 companies use it. Nvidia itself is already one of the largest open-source model and data contributors on the platform, having released more than 500 models and more than 250 publicly available datasets.
He also wrote firm commitments. The platform will remain open to the entire ecosystem. Developers choose their own models, frameworks, clouds, and inference services themselves, and they also choose their own computing platform. Using Hugging Face doesn’t require binding to Nvidia’s compute. The 8-K puts this sentence into the regulatory filing, and it also states that Nvidia will continue to support other chip vendors.
That’s the logic the stock should follow. Large customers are making their own chips. Open-source models pull developers out of closed interfaces. Whoever controls the model marketplace is closer to the next order. CNBC ranked this deal second in Nvidia’s acquisition history; previously, Groq’s asset transaction was about $20 billion. The software layer fills the community and distribution gaps that Groq didn’t cover.
The media previously estimated a multiple based on about $150 million in annual revenue, but the company hasn’t disclosed that revenue officially. The “86x sales” algorithm can only be used as a supporting clue—it can’t serve as a pricing anchor.
【Regulation and neutrality—those are the two “feet” that truly move the stock price】
The 8-K adds a segment on risks. Some people are lobbying to restrict open-source models. Many popular open-source models originated in China and then, after reaching the U.S. and the rest of the world, were downloaded, rewritten, and fine-tuned. Any rules that restrict how derivative models from a particular region are handled could materially affect the Hugging Face platform—and would also hit Nvidia’s own business.
The other foot is neutrality. The platform is valuable because it can still, now, send models to Nvidia, AMD, and others at the same time. After the acquisition, if developers feel the marketplace becomes “locked,” network effects may fracture first—and what you bought for $1.29 billion would be a hollow shell.
So my view on the stock price is quite narrow. This deal shows Nvidia is willing to spend spare change to lock in the open-source distribution layer. It doesn’t explain how much $228 is worth. The 1.8% on Thursday digested part of the headline. What comes next is whether the Q3 guidance of $108 billion can hold up, and whether regulatory scrutiny will delay closing from the first half of 2027 to later.
【How to use the water level】
On the daily chart, from the earnings report close on August 26 at 209.66, the price surged the next day to 230.47. On September 3, the intraday high was 230.40, the low 224.75, and it closed at 228.45. The 20-day moving average is 219.76, the 50-day is 209.87, and the 200-day is 196.46. The 52-week high of 236.54 appeared on May 14.
For a pullback to watch, I mark levels based on the retracement from the high right after receiving the earnings report. 0.236 is about 225.56, close to Thursday’s low at 224.75. 0.382 is about 222.52. 0.5 is about 220.07, right around the 20-day moving average. 0.618 is about 217.61; on August 28 and September 1, price already paused in this area.
For a strength scenario to watch, first see whether the close can hold above 230.40 to 230.47. Only then does it make room for the 52-week high at 236.54. For an invalidation scenario, if the close falls back below the earnings-report gap’s lower edge at 209.66 and also breaks below the 50-day moving average at 209.87, that would indicate the market no longer treats the acquisition as a positive factor, and instead starts discounting growth and regulation.
These are reference levels, not trading instructions. Tonight Beijing time at 20:30 there is the U.S. Non-Farm Payrolls; the U.S. market on Friday will reprice rates first. Nvidia—being a high-weight stock—will likely see opening changes in response to rates more easily than Hugging Face’s headline.
Would you add to positions above 228 because the model marketplace is being bought, or would you wait to discuss it again when it pulls back to 225–220? If regulators delay closing past the first half of 2027, can you still hold this price?
$NVDA $QQQ #英伟达 #美股 #artificial intelligence
Dragonfly Captain|A finance blogger who likes analyzing data and candlestick charts.
Not investment advice. Trading should follow the 8-K. Entry/exit levels are based on the September 3 closing snapshot; the U.S. market on Friday has not opened yet.

240
·
--
The squares tend to mix up RWA and stablecoins into one big pot. As of September 3, RWA.xyz shows that the portion that can be transferred out of the platform and between wallets is only $38.76 billion. Stablecoins, by themselves, still total $303.2 billion; by default, this isn’t included in that figure. In the token you hold in your wallet, what do you actually have—an allocation of Treasury bills, gold bars, or just an accounting entry that can’t be taken off the platform?
See the cover for a direct comparison. I wrote the Treasury, credit, commodities, and stocks pages using the September 4 table. The methodology comes from RWA.xyz, and the definitions come from its own documentation.
【First, break the names apart】
RWA is an abbreviation for Real World Assets. Existing assets off-chain—Treasury bills, private credit, gold bars, listed stocks, and real estate—are put into a legal entity, then minted as tokens on-chain. What you typically receive is a claim right to the issuing entity or fund units. Whether the vault actually holds the instrument, and whether redemption can be credited to you, matters more than what the token name suggests.
Stablecoins solve how to record dollars on-chain. RWA solves how to move yield and ownership evidence onto the chain. They can work together, but the legal risks fall on different parties.
【Don’t mix up the two ledgers】
RWA.xyz splits tokenized assets into two categories. Distributed refers to products that can be withdrawn to off-platform wallets and transferred between wallets; whitelist products are included too. Represented refers to cases that can’t be taken off the platform, or can’t be transferred around—on-chain mainly acts as a ledger. By default, look at the first bucket: $38.76 billion. The second bucket is $377.7 billion; institutional internal accounting will be included there as well.
Some people report the pie as much bigger; the numbers usually switch to the second bucket, or they add stablecoins back in. There are about 3.3 million holding addresses. The counted assets number 3,414 items. Chain distribution is no longer just Ethereum. Ethereum is about $17.5 billion, BNB Chain about $5.7 billion, and Solana about $4.1 billion.
【The truly “thick” pieces on-chain】
The U.S. Treasury fund is about $15.92 billion, with an annualized yield of around 3.40% over the past 7 days, and about 67,100 holding addresses. The top four platforms are Securitize, Circle, Ondo, and Franklin Templeton.
Credit is about $7.80 billion, corresponding to corporate bonds and private credit-type non-sovereign debt. Commodities are about $4.91 billion: Tether Gold about $2.67 billion, Paxos Gold about $1.88 billion. Tokenized stocks are about $2.77 billion; yet the monthly transfer volume reaches $21.7 billion—turnover is lively compared to the outstanding stock. Real estate is only about $226 million; the story is thicker than the ledger.
【BlackRock’s example is the best for quick clarification】
BUIDL stands for BlackRock U.S. Dollar Institutional Digital Liquidity Fund. Launched on March 20, 2024, RWA.xyz records it at about $2.73 billion, with a net asset value of $1, and an annualized yield of about 3.44% over the past 7 days. It has only 106 holding addresses. The subscription threshold is 5 million units of USDC, aimed at U.S. eligible purchasers; it uses daily subscriptions and redemptions. Custody is at BNY Mellon in New York, and the transfer agent is Securitize.
Having shares on-chain doesn’t mean everyone can buy them. On BNB Chain, this line is about $136 million. Most of the overall pie still sits on Solana, Ethereum, and Avalanche. When you see BlackRock’s tokenization on the square, first ask whether you meet the threshold—then ask which legal channel the redemption uses.
【How to read it—don’t let the narrative drag you along】
Ask four questions first. What exactly is the underlying asset? Can the token be withdrawn from the platform? Who do you redeem with, and how long does it take to arrive? Are you a qualified investor, or did you just pick up a wrapped ticket in the secondary market?
At some point, something will get stuck: the issuer, the custodian bank, the transfer agent, or the compliance whitelist. Even if the token is still in your wallet, the money may not come back. Tokenized stocks can be traded quickly, but that doesn’t automatically mean you have the same one share in a broker account. Treasury allocations may look stable, but the thresholds and whitelists keep most people out of the primary market.
Do you care more about the $38.7 billion you can transfer out, or the $377.7 billion that can’t leave the platform? Of Treasuries, gold, and tokenized stocks—what do you think is truly “on-chain”?
$ETH $BNB #RWA #代币化 #美债
Captain Dragonfly|A finance blogger who likes analyzing data and candlestick charts.
Not investment advice. Figures are subject to the original text on RWA.xyz. The writing uses the snapshots from September 3 to 4.
The squares tend to mix up RWA and stablecoins into one big pot. As of September 3, RWA.xyz shows that the portion that can be transferred out of the platform and between wallets is only $38.76 billion. Stablecoins, by themselves, still total $303.2 billion; by default, this isn’t included in that figure. In the token you hold in your wallet, what do you actually have—an allocation of Treasury bills, gold bars, or just an accounting entry that can’t be taken off the platform?
See the cover for a direct comparison. I wrote the Treasury, credit, commodities, and stocks pages using the September 4 table. The methodology comes from RWA.xyz, and the definitions come from its own documentation.
【First, break the names apart】
RWA is an abbreviation for Real World Assets. Existing assets off-chain—Treasury bills, private credit, gold bars, listed stocks, and real estate—are put into a legal entity, then minted as tokens on-chain. What you typically receive is a claim right to the issuing entity or fund units. Whether the vault actually holds the instrument, and whether redemption can be credited to you, matters more than what the token name suggests.
Stablecoins solve how to record dollars on-chain. RWA solves how to move yield and ownership evidence onto the chain. They can work together, but the legal risks fall on different parties.
【Don’t mix up the two ledgers】
RWA.xyz splits tokenized assets into two categories. Distributed refers to products that can be withdrawn to off-platform wallets and transferred between wallets; whitelist products are included too. Represented refers to cases that can’t be taken off the platform, or can’t be transferred around—on-chain mainly acts as a ledger. By default, look at the first bucket: $38.76 billion. The second bucket is $377.7 billion; institutional internal accounting will be included there as well.
Some people report the pie as much bigger; the numbers usually switch to the second bucket, or they add stablecoins back in. There are about 3.3 million holding addresses. The counted assets number 3,414 items. Chain distribution is no longer just Ethereum. Ethereum is about $17.5 billion, BNB Chain about $5.7 billion, and Solana about $4.1 billion.
【The truly “thick” pieces on-chain】
The U.S. Treasury fund is about $15.92 billion, with an annualized yield of around 3.40% over the past 7 days, and about 67,100 holding addresses. The top four platforms are Securitize, Circle, Ondo, and Franklin Templeton.
Credit is about $7.80 billion, corresponding to corporate bonds and private credit-type non-sovereign debt. Commodities are about $4.91 billion: Tether Gold about $2.67 billion, Paxos Gold about $1.88 billion. Tokenized stocks are about $2.77 billion; yet the monthly transfer volume reaches $21.7 billion—turnover is lively compared to the outstanding stock. Real estate is only about $226 million; the story is thicker than the ledger.
【BlackRock’s example is the best for quick clarification】
BUIDL stands for BlackRock U.S. Dollar Institutional Digital Liquidity Fund. Launched on March 20, 2024, RWA.xyz records it at about $2.73 billion, with a net asset value of $1, and an annualized yield of about 3.44% over the past 7 days. It has only 106 holding addresses. The subscription threshold is 5 million units of USDC, aimed at U.S. eligible purchasers; it uses daily subscriptions and redemptions. Custody is at BNY Mellon in New York, and the transfer agent is Securitize.
Having shares on-chain doesn’t mean everyone can buy them. On BNB Chain, this line is about $136 million. Most of the overall pie still sits on Solana, Ethereum, and Avalanche. When you see BlackRock’s tokenization on the square, first ask whether you meet the threshold—then ask which legal channel the redemption uses.
【How to read it—don’t let the narrative drag you along】
Ask four questions first. What exactly is the underlying asset? Can the token be withdrawn from the platform? Who do you redeem with, and how long does it take to arrive? Are you a qualified investor, or did you just pick up a wrapped ticket in the secondary market?
At some point, something will get stuck: the issuer, the custodian bank, the transfer agent, or the compliance whitelist. Even if the token is still in your wallet, the money may not come back. Tokenized stocks can be traded quickly, but that doesn’t automatically mean you have the same one share in a broker account. Treasury allocations may look stable, but the thresholds and whitelists keep most people out of the primary market.
Do you care more about the $38.7 billion you can transfer out, or the $377.7 billion that can’t leave the platform? Of Treasuries, gold, and tokenized stocks—what do you think is truly “on-chain”?
$ETH $BNB #RWA #代币化 #美债
Captain Dragonfly|A finance blogger who likes analyzing data and candlestick charts.
Not investment advice. Figures are subject to the original text on RWA.xyz. The writing uses the snapshots from September 3 to 4.
See the cover for a direct comparison. I wrote the Treasury, credit, commodities, and stocks pages using the September 4 table. The methodology comes from RWA.xyz, and the definitions come from its own documentation.
【First, break the names apart】
RWA is an abbreviation for Real World Assets. Existing assets off-chain—Treasury bills, private credit, gold bars, listed stocks, and real estate—are put into a legal entity, then minted as tokens on-chain. What you typically receive is a claim right to the issuing entity or fund units. Whether the vault actually holds the instrument, and whether redemption can be credited to you, matters more than what the token name suggests.
Stablecoins solve how to record dollars on-chain. RWA solves how to move yield and ownership evidence onto the chain. They can work together, but the legal risks fall on different parties.
【Don’t mix up the two ledgers】
RWA.xyz splits tokenized assets into two categories. Distributed refers to products that can be withdrawn to off-platform wallets and transferred between wallets; whitelist products are included too. Represented refers to cases that can’t be taken off the platform, or can’t be transferred around—on-chain mainly acts as a ledger. By default, look at the first bucket: $38.76 billion. The second bucket is $377.7 billion; institutional internal accounting will be included there as well.
Some people report the pie as much bigger; the numbers usually switch to the second bucket, or they add stablecoins back in. There are about 3.3 million holding addresses. The counted assets number 3,414 items. Chain distribution is no longer just Ethereum. Ethereum is about $17.5 billion, BNB Chain about $5.7 billion, and Solana about $4.1 billion.
【The truly “thick” pieces on-chain】
The U.S. Treasury fund is about $15.92 billion, with an annualized yield of around 3.40% over the past 7 days, and about 67,100 holding addresses. The top four platforms are Securitize, Circle, Ondo, and Franklin Templeton.
Credit is about $7.80 billion, corresponding to corporate bonds and private credit-type non-sovereign debt. Commodities are about $4.91 billion: Tether Gold about $2.67 billion, Paxos Gold about $1.88 billion. Tokenized stocks are about $2.77 billion; yet the monthly transfer volume reaches $21.7 billion—turnover is lively compared to the outstanding stock. Real estate is only about $226 million; the story is thicker than the ledger.
【BlackRock’s example is the best for quick clarification】
BUIDL stands for BlackRock U.S. Dollar Institutional Digital Liquidity Fund. Launched on March 20, 2024, RWA.xyz records it at about $2.73 billion, with a net asset value of $1, and an annualized yield of about 3.44% over the past 7 days. It has only 106 holding addresses. The subscription threshold is 5 million units of USDC, aimed at U.S. eligible purchasers; it uses daily subscriptions and redemptions. Custody is at BNY Mellon in New York, and the transfer agent is Securitize.
Having shares on-chain doesn’t mean everyone can buy them. On BNB Chain, this line is about $136 million. Most of the overall pie still sits on Solana, Ethereum, and Avalanche. When you see BlackRock’s tokenization on the square, first ask whether you meet the threshold—then ask which legal channel the redemption uses.
【How to read it—don’t let the narrative drag you along】
Ask four questions first. What exactly is the underlying asset? Can the token be withdrawn from the platform? Who do you redeem with, and how long does it take to arrive? Are you a qualified investor, or did you just pick up a wrapped ticket in the secondary market?
At some point, something will get stuck: the issuer, the custodian bank, the transfer agent, or the compliance whitelist. Even if the token is still in your wallet, the money may not come back. Tokenized stocks can be traded quickly, but that doesn’t automatically mean you have the same one share in a broker account. Treasury allocations may look stable, but the thresholds and whitelists keep most people out of the primary market.
Do you care more about the $38.7 billion you can transfer out, or the $377.7 billion that can’t leave the platform? Of Treasuries, gold, and tokenized stocks—what do you think is truly “on-chain”?
$ETH $BNB #RWA #代币化 #美债
Captain Dragonfly|A finance blogger who likes analyzing data and candlestick charts.
Not investment advice. Figures are subject to the original text on RWA.xyz. The writing uses the snapshots from September 3 to 4.
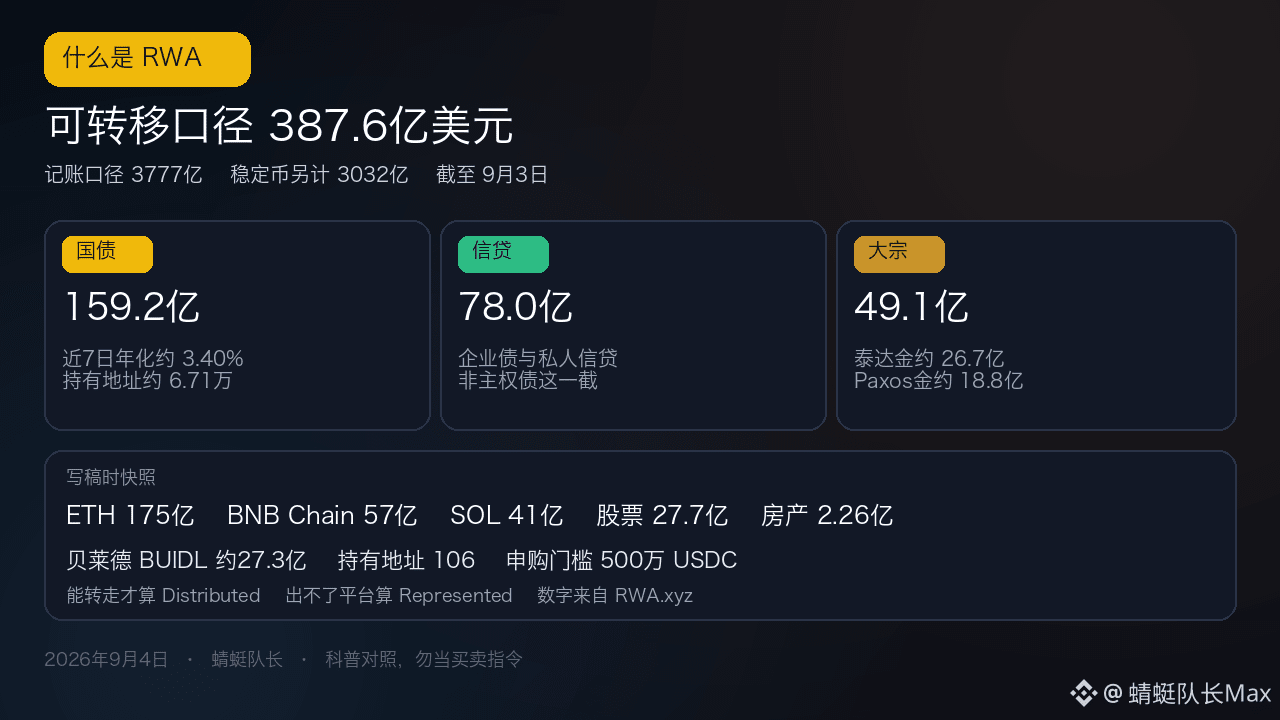
173
·
--
Tonight at 20:30 Beijing time, the U.S. will release August nonfarm payrolls. The market consensus is roughly 530K to 580K, while the July prior figure was a decrease of 230K. BTC is currently at 80,816, still holding above the 80,000 level that was reclaimed last night. Tonight, the crypto market will first reprice the rate-hike odds based on the employment report. Employment numbers are only the entry point for the repricing.
See the cover for comparison. The time is the Bureau of Labor Statistics’ regular window—8:30 a.m. in U.S. Eastern Time. My figures for the “numbers” are based on Newsquawk, Reuters surveys, and Trading Economics; spot data comes from Binance Vision. The article is written at around 10:20 on September 4, 2026.
【First, lay out the consensus clearly】
The consensus used by Newsquawk is a new payroll increase of 580K. Reuters and Trading Economics are closer to 560K. CNBC’s repost of Dow Jones has the official nonfarm forecast at 530K. Both also look to keep the unemployment rate at 4.1% unchanged. Average hourly earnings month over month are expected to be 0.3%; July was only 0.1%. Private-sector nonfarm is about 450K to 500K. Weekly hours are expected at 34.4 hours, versus the prior 34.3.
July came in unexpectedly lower by 230K, when expectations were around 800K. The 3-month average is only about 200K, and the 6-month average about 440K. The labor market has already stepped back from the kind of expansion it had been showing year after year in the tens of thousands.
Leading indicators look on the cool side. ADP’s August private increase was 380K, weaker than expectations around 470K to 480K, and also the slowest since January. Initial jobless claims rose to 207K in the survey week. Challenger announced August layoffs of about 529K, higher than July’s 334K. The employment component in the ISM services sector is still contracting. Barclays also reminds that temporary protected status expires at the end of July; August nonfarm could mechanically subtract roughly 250K workers. That’s a statistical count being reduced—the demand story should be viewed separately.
【My benchmark expectation】
I’m thinking in terms of a mild rebound that stays close to the consensus. The increase lands near 500K, and the unemployment rate remains at 4.1%. The logic is pretty narrow. July was negative growth already, and the market is waiting for education jobs to revert. ADP at 380K suggests the private sector isn’t that hot. Temporary protected status might also pull things down another notch. Pantheon has a model seeing 1.25M, which is a hot-data minority view—I don’t treat that as my main scenario.
The more striking line item is wages. Waller tied his September decision to whether inflation keeps cooling. If employment is a bit weaker, he may not change his tone. If hourly earnings print 0.3% and oil prices are still high, the rationale for rate hikes won’t automatically disappear.
Waller has said that, on average, employment through July is about 60K per month, with unemployment at 4.1%. In Reuters’ CME FedWatch, the probability of a rate hike fell from 63.2% on Wednesday to about 50.4%. Tonight’s table changes which side of this “coin” is more likely—first.
【Three scenarios—how crypto might respond】
First scenario: in line with expectations. Payrolls are up roughly 300K to 800K, and unemployment stays at 4.1%. Rate-hike odds are likely to remain around a 50/50 split. Attention will shift quickly to CPI on September 11. BTC will likely digest last night’s move in the range of 80,000 to 82,300. There will probably be a first burst of volatility, but the direction doesn’t necessarily become a new trend.
Second scenario: on the hot side. Payrolls rise to above 1 million, or the unemployment rate falls to 4.0%, or hourly earnings MoM rises to 0.4%. Rate-hike expectations get pulled back; the dollar and short-end U.S. Treasury yields rise first. Crypto has no interest—so it’s most sensitive to this kind of repricing. The segment that lifted BTC from 77,101 to 82,300 last night is largely pricing in what Waller said. When hot data hits, 80,000 will likely face pressure first, and only then will the market rotate down toward the 78,450 area, around last night’s 12-hour low.
Third scenario: on the cool side. Payrolls come in near zero or record another negative number, and unemployment rises to 4.3%. Rate-hike odds will drop first, and crypto may also surge one more time. After that, there’s a second leg. Continued employment contraction can bring back “hard landing” trading; risk assets may not be able to hold on to the first upswing gains. In the FOMC June dot plot, the unemployment rate was seen at 4.3% this year. Once that number is realized, the narrative shifts from “we can wait for another meeting” to “growth is also a problem.”
One more twist: weak headcount but strong wages. Waller emphasized prices in Jackson Hole, putting the focus on inflation. This combination makes it hard for rate-hike expectations to fade in one direction; crypto is more likely to get whipsawed back and forth. Also watch revisions: May and June were already revised down—if tonight again revises July lower, the weight of weak data will be even heavier.
【How to use this for crypto traders】
BTC is at 80,816, about +4.33% over the past 24 hours. The high is still 82,300. ETH is around 2,503, about +4.74%. Price has already pulled forward a chunk of the idea of “we can wait for another meeting.” If it matches expectations, the clash will be between exiting on the spot and short-covering. In a hot scenario, first watch whether 80,000 can close and hold. In a cool scenario, first watch how much the rate-hike probability drops, then whether anyone starts shouting “recession.”
The options market is already leaving room for volatility. For Morgan Stanley’s comparison on S&P 500, today’s front-month at-the-money options implied volatility is about 1.1%. Crypto is usually noisier than equities; the first-minute wick shouldn’t be treated as the conclusion.
At 20:30 tonight, what are you more afraid of: hot data driving 80,000 back down, or cool data first lifting prices and then smashing them lower? For hourly earnings and unemployment, which line item are you watching?
$BTC $ETH #非农 #美联储 #bitcoin
Captain Dragonfly|A finance blogger who likes analyzing data and K-line charts.
Not investment advice. The scenarios are hypothetical; the numbers follow the original text from the Bureau of Labor Statistics.
Tonight at 20:30 Beijing time, the U.S. will release August nonfarm payrolls. The market consensus is roughly 530K to 580K, while the July prior figure was a decrease of 230K. BTC is currently at 80,816, still holding above the 80,000 level that was reclaimed last night. Tonight, the crypto market will first reprice the rate-hike odds based on the employment report. Employment numbers are only the entry point for the repricing.
See the cover for comparison. The time is the Bureau of Labor Statistics’ regular window—8:30 a.m. in U.S. Eastern Time. My figures for the “numbers” are based on Newsquawk, Reuters surveys, and Trading Economics; spot data comes from Binance Vision. The article is written at around 10:20 on September 4, 2026.
【First, lay out the consensus clearly】
The consensus used by Newsquawk is a new payroll increase of 580K. Reuters and Trading Economics are closer to 560K. CNBC’s repost of Dow Jones has the official nonfarm forecast at 530K. Both also look to keep the unemployment rate at 4.1% unchanged. Average hourly earnings month over month are expected to be 0.3%; July was only 0.1%. Private-sector nonfarm is about 450K to 500K. Weekly hours are expected at 34.4 hours, versus the prior 34.3.
July came in unexpectedly lower by 230K, when expectations were around 800K. The 3-month average is only about 200K, and the 6-month average about 440K. The labor market has already stepped back from the kind of expansion it had been showing year after year in the tens of thousands.
Leading indicators look on the cool side. ADP’s August private increase was 380K, weaker than expectations around 470K to 480K, and also the slowest since January. Initial jobless claims rose to 207K in the survey week. Challenger announced August layoffs of about 529K, higher than July’s 334K. The employment component in the ISM services sector is still contracting. Barclays also reminds that temporary protected status expires at the end of July; August nonfarm could mechanically subtract roughly 250K workers. That’s a statistical count being reduced—the demand story should be viewed separately.
【My benchmark expectation】
I’m thinking in terms of a mild rebound that stays close to the consensus. The increase lands near 500K, and the unemployment rate remains at 4.1%. The logic is pretty narrow. July was negative growth already, and the market is waiting for education jobs to revert. ADP at 380K suggests the private sector isn’t that hot. Temporary protected status might also pull things down another notch. Pantheon has a model seeing 1.25M, which is a hot-data minority view—I don’t treat that as my main scenario.
The more striking line item is wages. Waller tied his September decision to whether inflation keeps cooling. If employment is a bit weaker, he may not change his tone. If hourly earnings print 0.3% and oil prices are still high, the rationale for rate hikes won’t automatically disappear.
Waller has said that, on average, employment through July is about 60K per month, with unemployment at 4.1%. In Reuters’ CME FedWatch, the probability of a rate hike fell from 63.2% on Wednesday to about 50.4%. Tonight’s table changes which side of this “coin” is more likely—first.
【Three scenarios—how crypto might respond】
First scenario: in line with expectations. Payrolls are up roughly 300K to 800K, and unemployment stays at 4.1%. Rate-hike odds are likely to remain around a 50/50 split. Attention will shift quickly to CPI on September 11. BTC will likely digest last night’s move in the range of 80,000 to 82,300. There will probably be a first burst of volatility, but the direction doesn’t necessarily become a new trend.
Second scenario: on the hot side. Payrolls rise to above 1 million, or the unemployment rate falls to 4.0%, or hourly earnings MoM rises to 0.4%. Rate-hike expectations get pulled back; the dollar and short-end U.S. Treasury yields rise first. Crypto has no interest—so it’s most sensitive to this kind of repricing. The segment that lifted BTC from 77,101 to 82,300 last night is largely pricing in what Waller said. When hot data hits, 80,000 will likely face pressure first, and only then will the market rotate down toward the 78,450 area, around last night’s 12-hour low.
Third scenario: on the cool side. Payrolls come in near zero or record another negative number, and unemployment rises to 4.3%. Rate-hike odds will drop first, and crypto may also surge one more time. After that, there’s a second leg. Continued employment contraction can bring back “hard landing” trading; risk assets may not be able to hold on to the first upswing gains. In the FOMC June dot plot, the unemployment rate was seen at 4.3% this year. Once that number is realized, the narrative shifts from “we can wait for another meeting” to “growth is also a problem.”
One more twist: weak headcount but strong wages. Waller emphasized prices in Jackson Hole, putting the focus on inflation. This combination makes it hard for rate-hike expectations to fade in one direction; crypto is more likely to get whipsawed back and forth. Also watch revisions: May and June were already revised down—if tonight again revises July lower, the weight of weak data will be even heavier.
【How to use this for crypto traders】
BTC is at 80,816, about +4.33% over the past 24 hours. The high is still 82,300. ETH is around 2,503, about +4.74%. Price has already pulled forward a chunk of the idea of “we can wait for another meeting.” If it matches expectations, the clash will be between exiting on the spot and short-covering. In a hot scenario, first watch whether 80,000 can close and hold. In a cool scenario, first watch how much the rate-hike probability drops, then whether anyone starts shouting “recession.”
The options market is already leaving room for volatility. For Morgan Stanley’s comparison on S&P 500, today’s front-month at-the-money options implied volatility is about 1.1%. Crypto is usually noisier than equities; the first-minute wick shouldn’t be treated as the conclusion.
At 20:30 tonight, what are you more afraid of: hot data driving 80,000 back down, or cool data first lifting prices and then smashing them lower? For hourly earnings and unemployment, which line item are you watching?
$BTC $ETH #非农 #美联储 #bitcoin
Captain Dragonfly|A finance blogger who likes analyzing data and K-line charts.
Not investment advice. The scenarios are hypothetical; the numbers follow the original text from the Bureau of Labor Statistics.
See the cover for comparison. The time is the Bureau of Labor Statistics’ regular window—8:30 a.m. in U.S. Eastern Time. My figures for the “numbers” are based on Newsquawk, Reuters surveys, and Trading Economics; spot data comes from Binance Vision. The article is written at around 10:20 on September 4, 2026.
【First, lay out the consensus clearly】
The consensus used by Newsquawk is a new payroll increase of 580K. Reuters and Trading Economics are closer to 560K. CNBC’s repost of Dow Jones has the official nonfarm forecast at 530K. Both also look to keep the unemployment rate at 4.1% unchanged. Average hourly earnings month over month are expected to be 0.3%; July was only 0.1%. Private-sector nonfarm is about 450K to 500K. Weekly hours are expected at 34.4 hours, versus the prior 34.3.
July came in unexpectedly lower by 230K, when expectations were around 800K. The 3-month average is only about 200K, and the 6-month average about 440K. The labor market has already stepped back from the kind of expansion it had been showing year after year in the tens of thousands.
Leading indicators look on the cool side. ADP’s August private increase was 380K, weaker than expectations around 470K to 480K, and also the slowest since January. Initial jobless claims rose to 207K in the survey week. Challenger announced August layoffs of about 529K, higher than July’s 334K. The employment component in the ISM services sector is still contracting. Barclays also reminds that temporary protected status expires at the end of July; August nonfarm could mechanically subtract roughly 250K workers. That’s a statistical count being reduced—the demand story should be viewed separately.
【My benchmark expectation】
I’m thinking in terms of a mild rebound that stays close to the consensus. The increase lands near 500K, and the unemployment rate remains at 4.1%. The logic is pretty narrow. July was negative growth already, and the market is waiting for education jobs to revert. ADP at 380K suggests the private sector isn’t that hot. Temporary protected status might also pull things down another notch. Pantheon has a model seeing 1.25M, which is a hot-data minority view—I don’t treat that as my main scenario.
The more striking line item is wages. Waller tied his September decision to whether inflation keeps cooling. If employment is a bit weaker, he may not change his tone. If hourly earnings print 0.3% and oil prices are still high, the rationale for rate hikes won’t automatically disappear.
Waller has said that, on average, employment through July is about 60K per month, with unemployment at 4.1%. In Reuters’ CME FedWatch, the probability of a rate hike fell from 63.2% on Wednesday to about 50.4%. Tonight’s table changes which side of this “coin” is more likely—first.
【Three scenarios—how crypto might respond】
First scenario: in line with expectations. Payrolls are up roughly 300K to 800K, and unemployment stays at 4.1%. Rate-hike odds are likely to remain around a 50/50 split. Attention will shift quickly to CPI on September 11. BTC will likely digest last night’s move in the range of 80,000 to 82,300. There will probably be a first burst of volatility, but the direction doesn’t necessarily become a new trend.
Second scenario: on the hot side. Payrolls rise to above 1 million, or the unemployment rate falls to 4.0%, or hourly earnings MoM rises to 0.4%. Rate-hike expectations get pulled back; the dollar and short-end U.S. Treasury yields rise first. Crypto has no interest—so it’s most sensitive to this kind of repricing. The segment that lifted BTC from 77,101 to 82,300 last night is largely pricing in what Waller said. When hot data hits, 80,000 will likely face pressure first, and only then will the market rotate down toward the 78,450 area, around last night’s 12-hour low.
Third scenario: on the cool side. Payrolls come in near zero or record another negative number, and unemployment rises to 4.3%. Rate-hike odds will drop first, and crypto may also surge one more time. After that, there’s a second leg. Continued employment contraction can bring back “hard landing” trading; risk assets may not be able to hold on to the first upswing gains. In the FOMC June dot plot, the unemployment rate was seen at 4.3% this year. Once that number is realized, the narrative shifts from “we can wait for another meeting” to “growth is also a problem.”
One more twist: weak headcount but strong wages. Waller emphasized prices in Jackson Hole, putting the focus on inflation. This combination makes it hard for rate-hike expectations to fade in one direction; crypto is more likely to get whipsawed back and forth. Also watch revisions: May and June were already revised down—if tonight again revises July lower, the weight of weak data will be even heavier.
【How to use this for crypto traders】
BTC is at 80,816, about +4.33% over the past 24 hours. The high is still 82,300. ETH is around 2,503, about +4.74%. Price has already pulled forward a chunk of the idea of “we can wait for another meeting.” If it matches expectations, the clash will be between exiting on the spot and short-covering. In a hot scenario, first watch whether 80,000 can close and hold. In a cool scenario, first watch how much the rate-hike probability drops, then whether anyone starts shouting “recession.”
The options market is already leaving room for volatility. For Morgan Stanley’s comparison on S&P 500, today’s front-month at-the-money options implied volatility is about 1.1%. Crypto is usually noisier than equities; the first-minute wick shouldn’t be treated as the conclusion.
At 20:30 tonight, what are you more afraid of: hot data driving 80,000 back down, or cool data first lifting prices and then smashing them lower? For hourly earnings and unemployment, which line item are you watching?
$BTC $ETH #非农 #美联储 #bitcoin
Captain Dragonfly|A finance blogger who likes analyzing data and K-line charts.
Not investment advice. The scenarios are hypothetical; the numbers follow the original text from the Bureau of Labor Statistics.
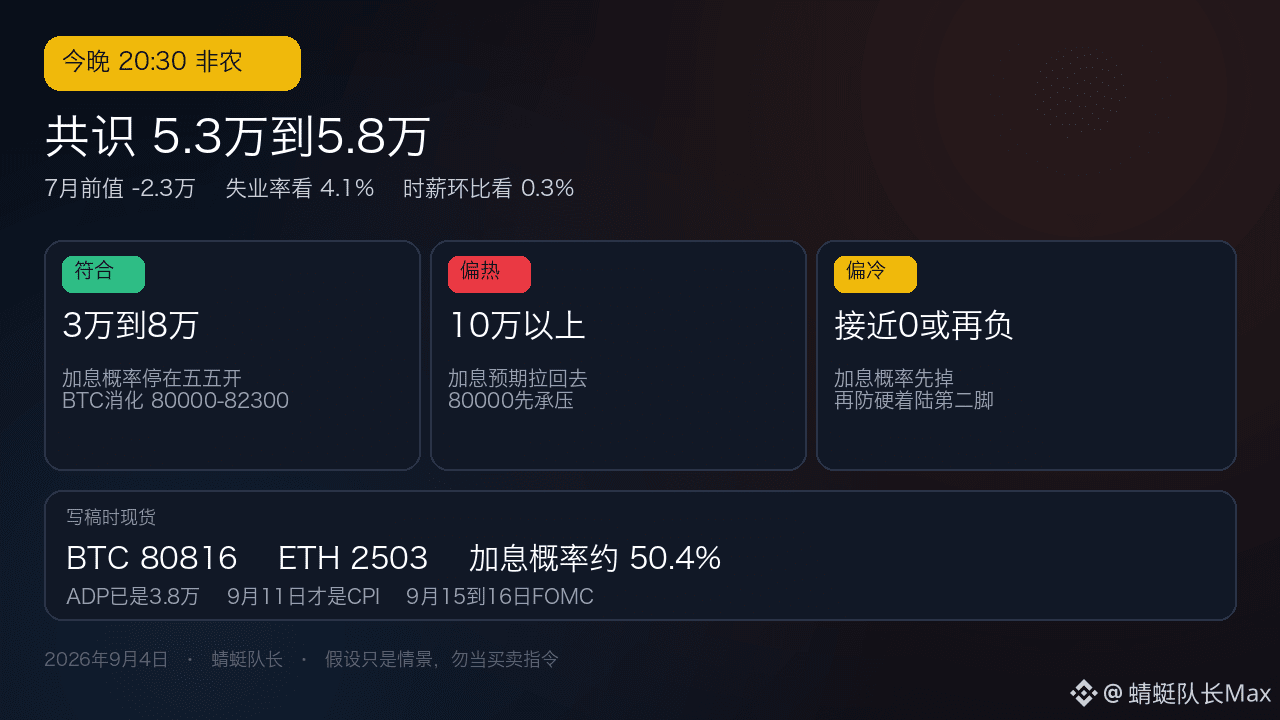
143
Log in to explore more content
Join global crypto users on Binance Square
⚡️ Get latest and useful information about crypto.
💬 Trusted by the world’s largest crypto exchange.
👍 Discover real insights from verified creators.
Email / Phone number
Trending Topics
BitcoinReboundsTo$79K
14,216 views
135 Discussing
🚨 $BTC is pushing higher.
Bitcoin is trading around $78,804, up roughly 1.9%, after reclaiming the $78K area. The next level to watch is the intraday high near $78,905.
A clean break above that level could open the way toward $79K–$80K. If BTC gets rejected, support sits around $78,300, then $77,975.
Bulls have momentum, but BTC needs to hold above $78K.
#Bitcoin #BTC #CryptoTrading #CryptoMarket #CryptoAnalysis
PulseON
·15 Likes
·14.1k views
SouthKoreaCryptoTaxDelayPetitionTops50000
784 views
48 Discussing
SolanaTransactionV1GoesLiveOnMainnet
508 views
31 Discussing