
#iost
iost
1.2M views
6,788 Discussing
Hot
Latest

·
--
$IOST AN ALTCOIN WORTH WATCHING?
📊 Sometimes the most interesting market opportunities begin with changes in volume and momentum.
👀 $IOST is worth monitoring for:
Volume expansion
Price structure
Buyer interest
Broader market direction
🔥 A confirmed trend change would make the chart more interesting.
Patience and confirmation are key.
What's your view on IOST?
#IOST #BinanceSquare
$IOST AN ALTCOIN WORTH WATCHING?
📊 Sometimes the most interesting market opportunities begin with changes in volume and momentum.
👀 $IOST is worth monitoring for:
Volume expansion
Price structure
Buyer interest
Broader market direction
🔥 A confirmed trend change would make the chart more interesting.
Patience and confirmation are key.
What's your view on IOST?
#IOST #BinanceSquare
📊 Sometimes the most interesting market opportunities begin with changes in volume and momentum.
👀 $IOST is worth monitoring for:
Volume expansion
Price structure
Buyer interest
Broader market direction
🔥 A confirmed trend change would make the chart more interesting.
Patience and confirmation are key.
What's your view on IOST?
#IOST #BinanceSquare

274

📉 MY IOST/USDT TRADE IS IN LOSS – NEED YOUR ADVICE!
I bought IOST/USDT, but unfortunately, the price keeps falling and my investment is now in loss.
I'm still watching the market and trying to make the right decision.
I want to hear from experienced traders in the Binance community.
💬 What would you do in my position?
Hold and wait for a recovery?
Sell and accept the loss?
Wait for confirmation before making another move?
Your advice and market analysis would be appreciated!
#IOST #cryptotrading #BinanceSquare #TradingCommunity
{spot}(IOSTUSDT)
📉 MY IOST/USDT TRADE IS IN LOSS – NEED YOUR ADVICE!
I bought IOST/USDT, but unfortunately, the price keeps falling and my investment is now in loss.
I'm still watching the market and trying to make the right decision.
I want to hear from experienced traders in the Binance community.
💬 What would you do in my position?
Hold and wait for a recovery?
Sell and accept the loss?
Wait for confirmation before making another move?
Your advice and market analysis would be appreciated!
#IOST #cryptotrading #BinanceSquare #TradingCommunity
I bought IOST/USDT, but unfortunately, the price keeps falling and my investment is now in loss.
I'm still watching the market and trying to make the right decision.
I want to hear from experienced traders in the Binance community.
💬 What would you do in my position?
Hold and wait for a recovery?
Sell and accept the loss?
Wait for confirmation before making another move?
Your advice and market analysis would be appreciated!
#IOST #cryptotrading #BinanceSquare #TradingCommunity

重生之我是天才交易圆:
我的成本从0.00075降到了0.000709🤑
3
2
537

·
--
🚨 Attention, traders! Bounce opportunity or bear trap in $IOST ?
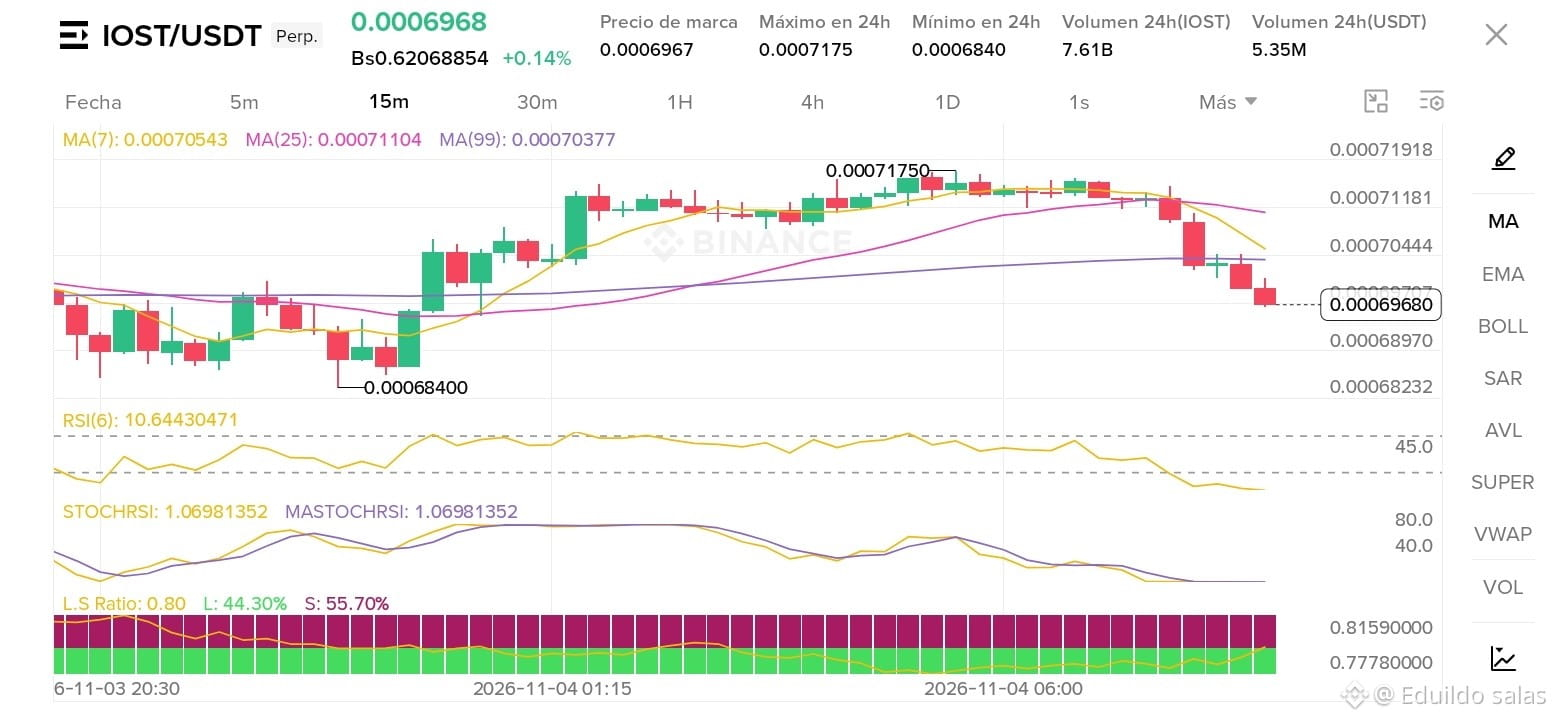
Let’s analyze what’s happening right now on the $IOST /USDT (Perp) chart on the 15-minute timeframe:
Current price: $0.0006968 USDT, showing a slight change of +0.14%.
24h range: High of $0.0007175 and low of $0.0006840.
Key Indicators:
RSI(6) at extreme levels: It’s at an ultra-low reading of 10.64, indicating a massive oversold condition. Are we nearing a bottom for an imminent technical bounce?
StochRSI: Also compressed in the lower zone (1.06), reinforcing short-term selling pressure while warning of a possible trend reversal if buying volume comes in.
Moving Averages (MA): The price recently broke below the moving averages (MA(7) at $0.000705, MA(25) at $0.000711, and MA(99) at $0.000703), showing a recent bearish crossover, with the bears temporarily in control.
Long/Short Ratio: Currently at 0.80, with 55.70% of positions Short versus 44.30% Long. Watch out for a possible short squeeze if the price holds at current support and sellers get trapped!
📊 24h Volume: Solid activity, with 7.61B IOST (5.35M USDT) traded, showing that the market is liquid and rapid moves could happen at any moment.
Are you accumulating in this oversold zone, or would you rather wait for confirmation above the 7-period moving average? Let me know what you think in the comments! 👇
#IOST #BinanceSquare #binancepick #EarningsSeason #BinanceIncidentReport
🚨 Attention, traders! Bounce opportunity or bear trap in $IOST ?
Let’s analyze what’s happening right now on the $IOST /USDT (Perp) chart on the 15-minute timeframe:
Current price: $0.0006968 USDT, showing a slight change of +0.14%.
24h range: High of $0.0007175 and low of $0.0006840.
Key Indicators:
RSI(6) at extreme levels: It’s at an ultra-low reading of 10.64, indicating a massive oversold condition. Are we nearing a bottom for an imminent technical bounce?
StochRSI: Also compressed in the lower zone (1.06), reinforcing short-term selling pressure while warning of a possible trend reversal if buying volume comes in.
Moving Averages (MA): The price recently broke below the moving averages (MA(7) at $0.000705, MA(25) at $0.000711, and MA(99) at $0.000703), showing a recent bearish crossover, with the bears temporarily in control.
Long/Short Ratio: Currently at 0.80, with 55.70% of positions Short versus 44.30% Long. Watch out for a possible short squeeze if the price holds at current support and sellers get trapped!
📊 24h Volume: Solid activity, with 7.61B IOST (5.35M USDT) traded, showing that the market is liquid and rapid moves could happen at any moment.
Are you accumulating in this oversold zone, or would you rather wait for confirmation above the 7-period moving average? Let me know what you think in the comments! 👇
#IOST #BinanceSquare #binancepick #EarningsSeason #BinanceIncidentReport
Let’s analyze what’s happening right now on the $IOST /USDT (Perp) chart on the 15-minute timeframe:
Current price: $0.0006968 USDT, showing a slight change of +0.14%.
24h range: High of $0.0007175 and low of $0.0006840.
Key Indicators:
RSI(6) at extreme levels: It’s at an ultra-low reading of 10.64, indicating a massive oversold condition. Are we nearing a bottom for an imminent technical bounce?
StochRSI: Also compressed in the lower zone (1.06), reinforcing short-term selling pressure while warning of a possible trend reversal if buying volume comes in.
Moving Averages (MA): The price recently broke below the moving averages (MA(7) at $0.000705, MA(25) at $0.000711, and MA(99) at $0.000703), showing a recent bearish crossover, with the bears temporarily in control.
Long/Short Ratio: Currently at 0.80, with 55.70% of positions Short versus 44.30% Long. Watch out for a possible short squeeze if the price holds at current support and sellers get trapped!
📊 24h Volume: Solid activity, with 7.61B IOST (5.35M USDT) traded, showing that the market is liquid and rapid moves could happen at any moment.
Are you accumulating in this oversold zone, or would you rather wait for confirmation above the 7-period moving average? Let me know what you think in the comments! 👇
#IOST #BinanceSquare #binancepick #EarningsSeason #BinanceIncidentReport
101
·
--
🚨 Attention, traders! What’s happening with $IOST /USDT on the 15m timeframe? 📉📈
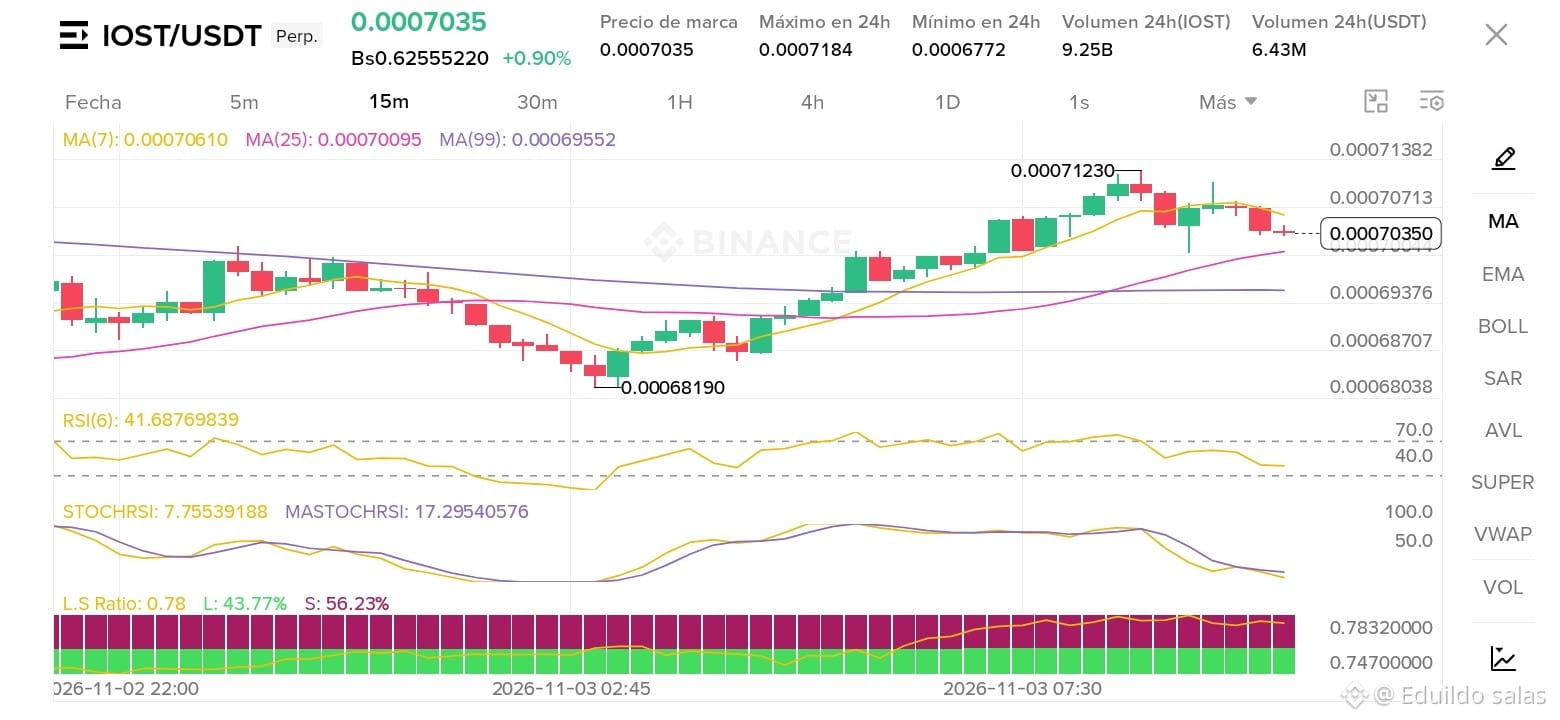
The IOST/USDT Perp pair is showing an interesting move after hitting a low of 0.00068190 and seeking a bullish push up to 0.0007184. The price is currently trading at 0.0007035 (+0.90%), in a key zone of indecision.
📊 Quick technical analysis:
Current price: 0.0007035 USDT
24h range: High of 0.0007184 | Low of 0.0006772
24h volume: Solid activity, with 9.25B IOST (equivalent to 6.43M USDT).
Moving Averages (MA): The MA lines show a recent crossover, with the price hovering around the intermediate average and testing dynamic support after being rejected in the upper zone.
RSI (6): At 41.68, tilting toward the neutral-to-bearish zone, indicating that immediate selling pressure has prevailed since the latest peak.
StochRSI: At very low levels (7.75), suggesting a possible oversold zone and opening the door to an imminent technical rebound if buyers step in strongly.
Long/Short Ratio: Currently at 0.78 (L: 43.77% vs S: 56.23%), reflecting a slight bearish dominance in short-term market sentiment.
💡 What can we expect? If current support holds and the StochRSI crosses upward from this compression zone, we could see another test of resistance at 0.000712 - 0.000718. Keep a close eye on volume and the reaction over the next few candles!
Are you accumulating or waiting for confirmation? Let me know in the comments! 👇💬
#IOST #BinanceSquare #BinancePick #EarningsSeason #Nasdaq100EntersCorrection
🚨 Attention, traders! What’s happening with $IOST /USDT on the 15m timeframe? 📉📈
The IOST/USDT Perp pair is showing an interesting move after hitting a low of 0.00068190 and seeking a bullish push up to 0.0007184. The price is currently trading at 0.0007035 (+0.90%), in a key zone of indecision.
📊 Quick technical analysis:
Current price: 0.0007035 USDT
24h range: High of 0.0007184 | Low of 0.0006772
24h volume: Solid activity, with 9.25B IOST (equivalent to 6.43M USDT).
Moving Averages (MA): The MA lines show a recent crossover, with the price hovering around the intermediate average and testing dynamic support after being rejected in the upper zone.
RSI (6): At 41.68, tilting toward the neutral-to-bearish zone, indicating that immediate selling pressure has prevailed since the latest peak.
StochRSI: At very low levels (7.75), suggesting a possible oversold zone and opening the door to an imminent technical rebound if buyers step in strongly.
Long/Short Ratio: Currently at 0.78 (L: 43.77% vs S: 56.23%), reflecting a slight bearish dominance in short-term market sentiment.
💡 What can we expect? If current support holds and the StochRSI crosses upward from this compression zone, we could see another test of resistance at 0.000712 - 0.000718. Keep a close eye on volume and the reaction over the next few candles!
Are you accumulating or waiting for confirmation? Let me know in the comments! 👇💬
#IOST #BinanceSquare #BinancePick #EarningsSeason #Nasdaq100EntersCorrection
The IOST/USDT Perp pair is showing an interesting move after hitting a low of 0.00068190 and seeking a bullish push up to 0.0007184. The price is currently trading at 0.0007035 (+0.90%), in a key zone of indecision.
📊 Quick technical analysis:
Current price: 0.0007035 USDT
24h range: High of 0.0007184 | Low of 0.0006772
24h volume: Solid activity, with 9.25B IOST (equivalent to 6.43M USDT).
Moving Averages (MA): The MA lines show a recent crossover, with the price hovering around the intermediate average and testing dynamic support after being rejected in the upper zone.
RSI (6): At 41.68, tilting toward the neutral-to-bearish zone, indicating that immediate selling pressure has prevailed since the latest peak.
StochRSI: At very low levels (7.75), suggesting a possible oversold zone and opening the door to an imminent technical rebound if buyers step in strongly.
Long/Short Ratio: Currently at 0.78 (L: 43.77% vs S: 56.23%), reflecting a slight bearish dominance in short-term market sentiment.
💡 What can we expect? If current support holds and the StochRSI crosses upward from this compression zone, we could see another test of resistance at 0.000712 - 0.000718. Keep a close eye on volume and the reaction over the next few candles!
Are you accumulating or waiting for confirmation? Let me know in the comments! 👇💬
#IOST #BinanceSquare #BinancePick #EarningsSeason #Nasdaq100EntersCorrection
177
·
--
🚨 Attention traders! Bounce opportunity or bear trap in $IOST /USDT?
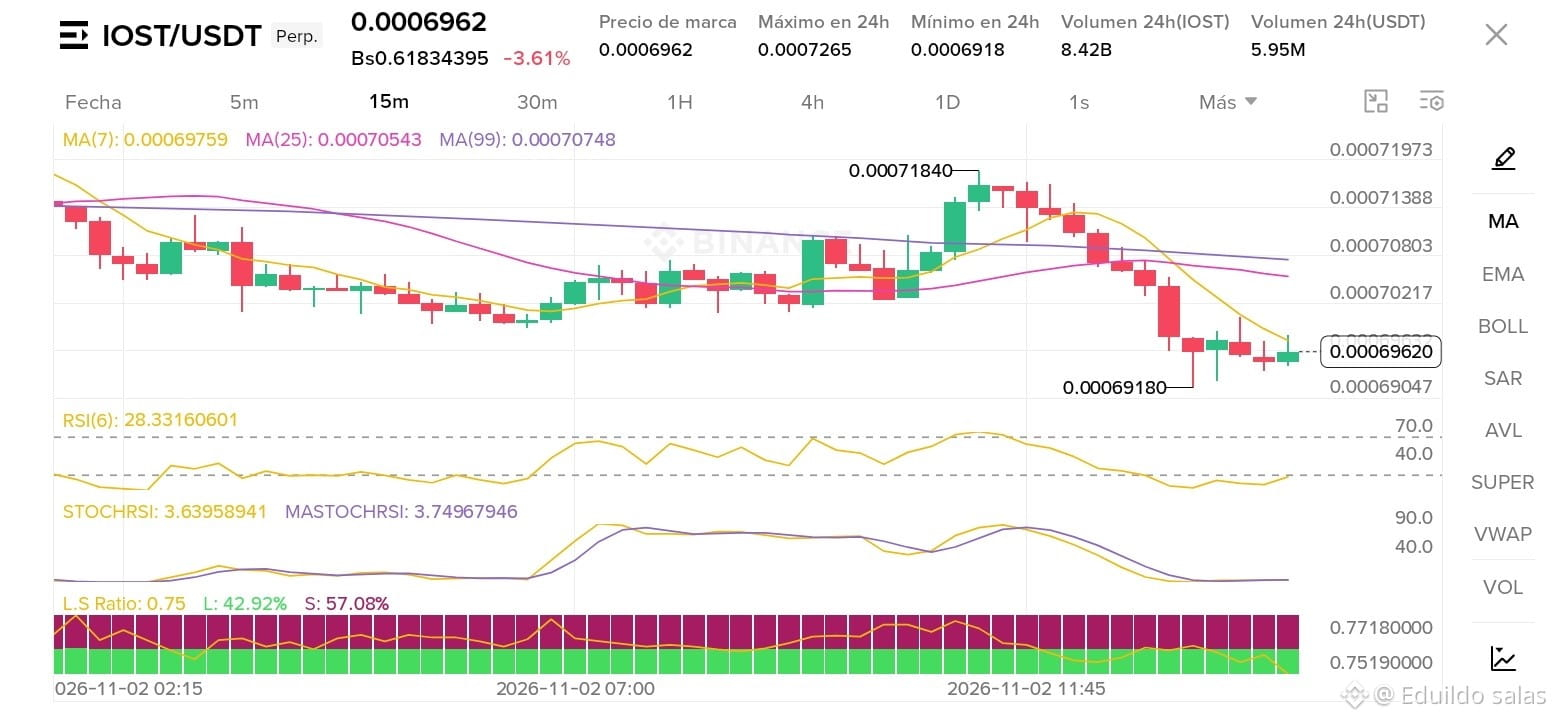
Let's analyze the 1D chart (lower timeframe of 15m/recent candles) for this Perpetual pair:
Current price: 0.0006962 USDT (down -3.61%).
24h range: High of 0.0007265 and a recent low touching 0.0006918 USDT.
Key Indicators:
RSI(6): At 28.33, indicating that the price has clearly entered oversold territory.
StochRSI: Extremely low (3.63), suggesting selling pressure may be easing and a bullish crossover or short-term technical bounce may be imminent.
Volume: Robust 24h volume of 8.42B IOST (5.95M USDT), showing high market activity.
Long/Short Sentiment: The L/S ratio is 0.75, with 57.08% of positions short, which could trigger a juicy short squeeze if buyers defend the current support at 0.0006918.
Are you accumulating in this oversold zone, or would you rather wait for confirmation? I'll be reading your thoughts in the comments! 👇💬
#IOST #BinanceSquare #BinanceWithdrawalScamWarning #goodbye
🚨 Attention traders! Bounce opportunity or bear trap in $IOST /USDT?
Let's analyze the 1D chart (lower timeframe of 15m/recent candles) for this Perpetual pair:
Current price: 0.0006962 USDT (down -3.61%).
24h range: High of 0.0007265 and a recent low touching 0.0006918 USDT.
Key Indicators:
RSI(6): At 28.33, indicating that the price has clearly entered oversold territory.
StochRSI: Extremely low (3.63), suggesting selling pressure may be easing and a bullish crossover or short-term technical bounce may be imminent.
Volume: Robust 24h volume of 8.42B IOST (5.95M USDT), showing high market activity.
Long/Short Sentiment: The L/S ratio is 0.75, with 57.08% of positions short, which could trigger a juicy short squeeze if buyers defend the current support at 0.0006918.
Are you accumulating in this oversold zone, or would you rather wait for confirmation? I'll be reading your thoughts in the comments! 👇💬
#IOST #BinanceSquare #BinanceWithdrawalScamWarning #goodbye
Let's analyze the 1D chart (lower timeframe of 15m/recent candles) for this Perpetual pair:
Current price: 0.0006962 USDT (down -3.61%).
24h range: High of 0.0007265 and a recent low touching 0.0006918 USDT.
Key Indicators:
RSI(6): At 28.33, indicating that the price has clearly entered oversold territory.
StochRSI: Extremely low (3.63), suggesting selling pressure may be easing and a bullish crossover or short-term technical bounce may be imminent.
Volume: Robust 24h volume of 8.42B IOST (5.95M USDT), showing high market activity.
Long/Short Sentiment: The L/S ratio is 0.75, with 57.08% of positions short, which could trigger a juicy short squeeze if buyers defend the current support at 0.0006918.
Are you accumulating in this oversold zone, or would you rather wait for confirmation? I'll be reading your thoughts in the comments! 👇💬
#IOST #BinanceSquare #BinanceWithdrawalScamWarning #goodbye
247
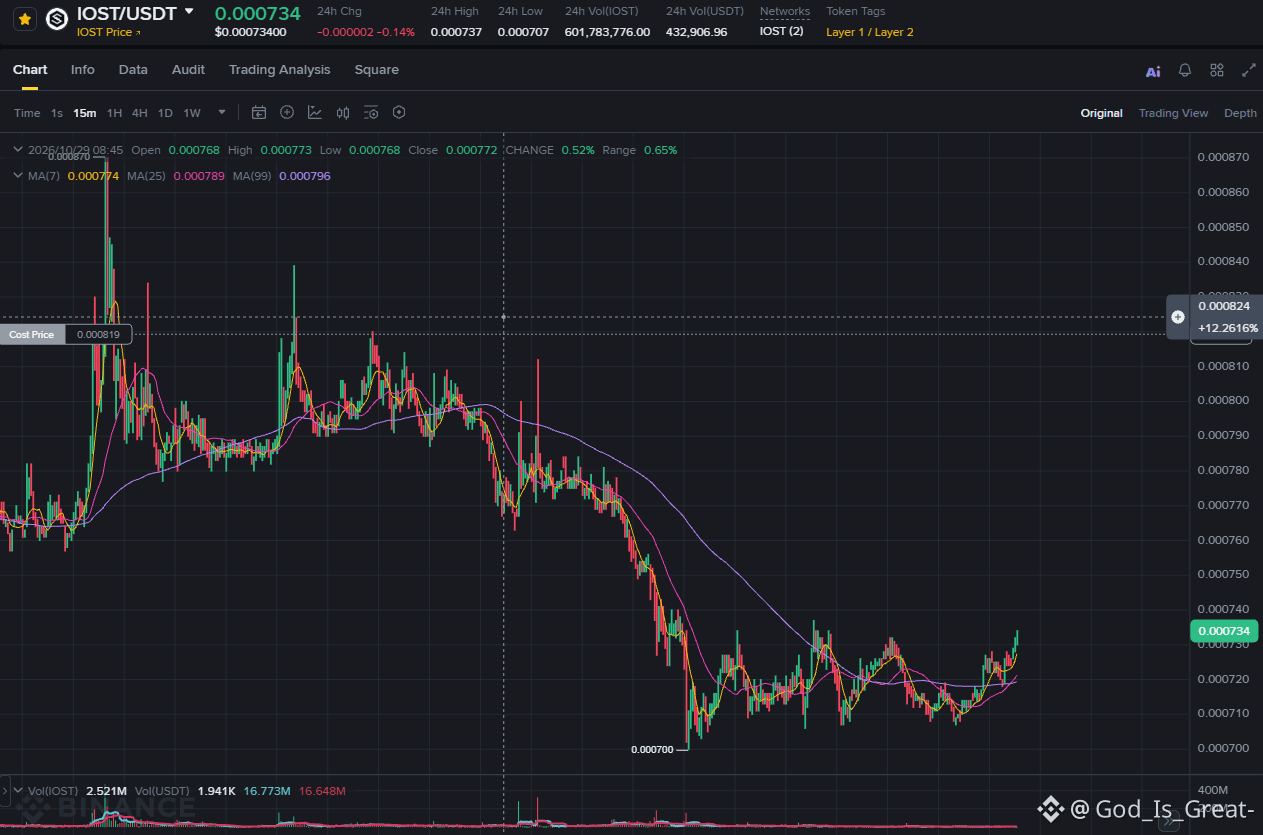
15-minute IOST/USDT chart. Price is about 0.000734 right now. I see a sharp drop from around 0.00082
down toward 0.0007, then some buyers came in near 0.00071 to 0.00072. There's a little recovery trying to form, but nothing confirmed yet. Key support's at 0.00072, resistance is around 0.000737, and if you see a clean breakout with strong volume, maybe it can push toward 0.00075 or 0.00077.
But if 0.00072 fails, retesting 0.00071 or 0.0007 is possible. Binance Square caption idea: IOST/USDT update: buyers trying to take control. Do you think IOST can break 0.00075 next, or will sellers take control again?
#IOST
{spot}(IOSTUSDT)
#IOSTUSDT #CryptoMarket
15-minute IOST/USDT chart. Price is about 0.000734 right now. I see a sharp drop from around 0.00082
down toward 0.0007, then some buyers came in near 0.00071 to 0.00072. There's a little recovery trying to form, but nothing confirmed yet. Key support's at 0.00072, resistance is around 0.000737, and if you see a clean breakout with strong volume, maybe it can push toward 0.00075 or 0.00077.
But if 0.00072 fails, retesting 0.00071 or 0.0007 is possible. Binance Square caption idea: IOST/USDT update: buyers trying to take control. Do you think IOST can break 0.00075 next, or will sellers take control again?
#IOST
#IOSTUSDT #CryptoMarket
down toward 0.0007, then some buyers came in near 0.00071 to 0.00072. There's a little recovery trying to form, but nothing confirmed yet. Key support's at 0.00072, resistance is around 0.000737, and if you see a clean breakout with strong volume, maybe it can push toward 0.00075 or 0.00077.
But if 0.00072 fails, retesting 0.00071 or 0.0007 is possible. Binance Square caption idea: IOST/USDT update: buyers trying to take control. Do you think IOST can break 0.00075 next, or will sellers take control again?
#IOST
#IOSTUSDT #CryptoMarket
872
·
--
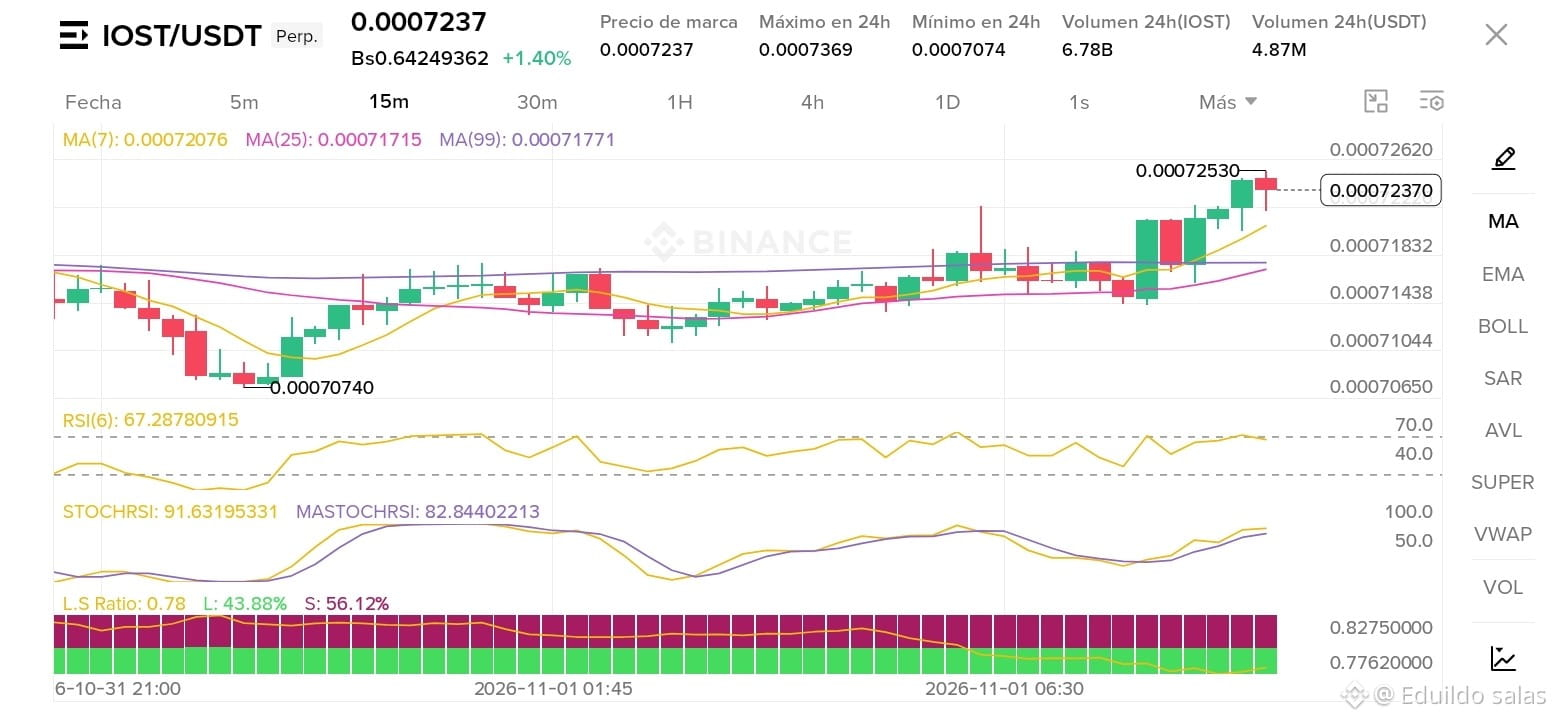
🚀 Quick Analysis: $IOST / USDT (Perpetual - 15m Timeframe)
📈 Current Technical Setup:
Current price: $0.0007237 (+1.40%)
Trading Range (24h): Low of $0.0007074 ➔ High of $0.0007369
Moving Averages (MA): The trend lines (MA 7, 25, and 99) show a short-term bullish alignment after bouncing from the key support zone at $0.0007074.
Momentum Indicators:
RSI (6): At ~67.28, approaching the overbought zone, but with room for one final bullish push if buying pressure holds.
StochRSI: In elevated territory (~91.63), suggesting caution about a possible short-term consolidation or pullback before the trend continues.
🎯 Suggested Trading Setup (Risk Management)
Direction: 🟢 Long (Buy / Bullish) on a pullback or breakout above immediate resistance.
Entry Zone: $0.0007180 – $0.0007230 (looking for support at the fast moving average).
Take Profit (TP):
TP1: $0.0007350
TP2: $0.0007500
Stop Loss (SL): $0.0007050 (below recent support and the structure invalidation level).
⚠️ Risk management note: Trade with controlled leverage and stick to your Stop Loss to protect your capital amid the high volatility of the perpetual market.
#IOST #BinanceSquare #CryptoTrading #AnalisisTecnico #BinanceSAFUFundTransferCompleted7499BTC
🚀 Quick Analysis: $IOST / USDT (Perpetual - 15m Timeframe)
📈 Current Technical Setup:
Current price: $0.0007237 (+1.40%)
Trading Range (24h): Low of $0.0007074 ➔ High of $0.0007369
Moving Averages (MA): The trend lines (MA 7, 25, and 99) show a short-term bullish alignment after bouncing from the key support zone at $0.0007074.
Momentum Indicators:
RSI (6): At ~67.28, approaching the overbought zone, but with room for one final bullish push if buying pressure holds.
StochRSI: In elevated territory (~91.63), suggesting caution about a possible short-term consolidation or pullback before the trend continues.
🎯 Suggested Trading Setup (Risk Management)
Direction: 🟢 Long (Buy / Bullish) on a pullback or breakout above immediate resistance.
Entry Zone: $0.0007180 – $0.0007230 (looking for support at the fast moving average).
Take Profit (TP):
TP1: $0.0007350
TP2: $0.0007500
Stop Loss (SL): $0.0007050 (below recent support and the structure invalidation level).
⚠️ Risk management note: Trade with controlled leverage and stick to your Stop Loss to protect your capital amid the high volatility of the perpetual market.
#IOST #BinanceSquare #CryptoTrading #AnalisisTecnico #BinanceSAFUFundTransferCompleted7499BTC
📈 Current Technical Setup:
Current price: $0.0007237 (+1.40%)
Trading Range (24h): Low of $0.0007074 ➔ High of $0.0007369
Moving Averages (MA): The trend lines (MA 7, 25, and 99) show a short-term bullish alignment after bouncing from the key support zone at $0.0007074.
Momentum Indicators:
RSI (6): At ~67.28, approaching the overbought zone, but with room for one final bullish push if buying pressure holds.
StochRSI: In elevated territory (~91.63), suggesting caution about a possible short-term consolidation or pullback before the trend continues.
🎯 Suggested Trading Setup (Risk Management)
Direction: 🟢 Long (Buy / Bullish) on a pullback or breakout above immediate resistance.
Entry Zone: $0.0007180 – $0.0007230 (looking for support at the fast moving average).
Take Profit (TP):
TP1: $0.0007350
TP2: $0.0007500
Stop Loss (SL): $0.0007050 (below recent support and the structure invalidation level).
⚠️ Risk management note: Trade with controlled leverage and stick to your Stop Loss to protect your capital amid the high volatility of the perpetual market.
#IOST #BinanceSquare #CryptoTrading #AnalisisTecnico #BinanceSAFUFundTransferCompleted7499BTC
245
·
--
📊 Quick Analysis of $IOST /USDT (15m Timeframe)
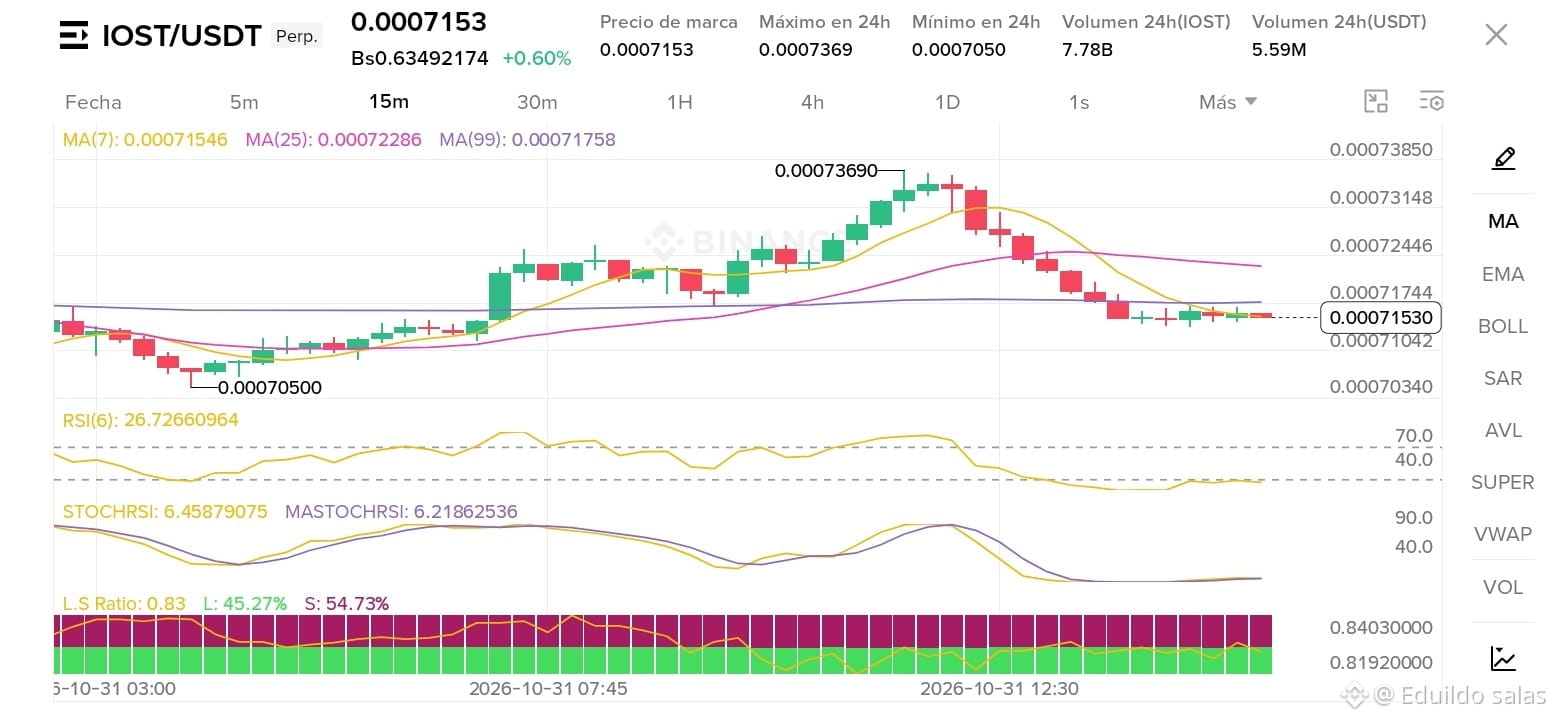
The IOST/USDT pair is at a very interesting decision point after a correction from its 24-hour high of 0.0007369. It is currently trading at 0.0007153, showing sideways price action that deserves our full attention.
🔍 Key chart details:
Current Price: 0.0007153 USDT (+0.60%).
24h Range: High of 0.0007369 and low of 0.0007050.
Volume: Very solid, with 7.78B IOST and 5.59M USDT traded.
Technical Indicators:
RSI(6): At 26.72, entering oversold territory, which could suggest a possible bearish exhaustion or an imminent technical rebound.
StochRSI: Extremely low (6.45), reinforcing the short-term oversold reading.
Moving Averages (MA): The MA(7) at 0.0007154 is very close to the current price, intersecting with the recent trend as it seeks to stabilize after pulling back from the higher moving averages.
L/S Ratio: At 0.83 (45.27% Longs vs. 54.73% Shorts), reflecting some recent bearish pressure, but leaving room for surprises if buyers defend current support levels.
💡 What to watch: If the oversold readings on the RSI and StochRSI manage to attract buying volume in this support zone, we could see an attempt to recover toward the moving average area. Keep this pair on your radar!
What do you think—will it rebound or will the range continue? Let me know in the comments! 👇
#IOST #CryptoTrading #BinanceSquare #AnalisisTecnico #TradingSignals
📊 Quick Analysis of $IOST /USDT (15m Timeframe)
The IOST/USDT pair is at a very interesting decision point after a correction from its 24-hour high of 0.0007369. It is currently trading at 0.0007153, showing sideways price action that deserves our full attention.
🔍 Key chart details:
Current Price: 0.0007153 USDT (+0.60%).
24h Range: High of 0.0007369 and low of 0.0007050.
Volume: Very solid, with 7.78B IOST and 5.59M USDT traded.
Technical Indicators:
RSI(6): At 26.72, entering oversold territory, which could suggest a possible bearish exhaustion or an imminent technical rebound.
StochRSI: Extremely low (6.45), reinforcing the short-term oversold reading.
Moving Averages (MA): The MA(7) at 0.0007154 is very close to the current price, intersecting with the recent trend as it seeks to stabilize after pulling back from the higher moving averages.
L/S Ratio: At 0.83 (45.27% Longs vs. 54.73% Shorts), reflecting some recent bearish pressure, but leaving room for surprises if buyers defend current support levels.
💡 What to watch: If the oversold readings on the RSI and StochRSI manage to attract buying volume in this support zone, we could see an attempt to recover toward the moving average area. Keep this pair on your radar!
What do you think—will it rebound or will the range continue? Let me know in the comments! 👇
#IOST #CryptoTrading #BinanceSquare #AnalisisTecnico #TradingSignals
The IOST/USDT pair is at a very interesting decision point after a correction from its 24-hour high of 0.0007369. It is currently trading at 0.0007153, showing sideways price action that deserves our full attention.
🔍 Key chart details:
Current Price: 0.0007153 USDT (+0.60%).
24h Range: High of 0.0007369 and low of 0.0007050.
Volume: Very solid, with 7.78B IOST and 5.59M USDT traded.
Technical Indicators:
RSI(6): At 26.72, entering oversold territory, which could suggest a possible bearish exhaustion or an imminent technical rebound.
StochRSI: Extremely low (6.45), reinforcing the short-term oversold reading.
Moving Averages (MA): The MA(7) at 0.0007154 is very close to the current price, intersecting with the recent trend as it seeks to stabilize after pulling back from the higher moving averages.
L/S Ratio: At 0.83 (45.27% Longs vs. 54.73% Shorts), reflecting some recent bearish pressure, but leaving room for surprises if buyers defend current support levels.
💡 What to watch: If the oversold readings on the RSI and StochRSI manage to attract buying volume in this support zone, we could see an attempt to recover toward the moving average area. Keep this pair on your radar!
What do you think—will it rebound or will the range continue? Let me know in the comments! 👇
#IOST #CryptoTrading #BinanceSquare #AnalisisTecnico #TradingSignals
322
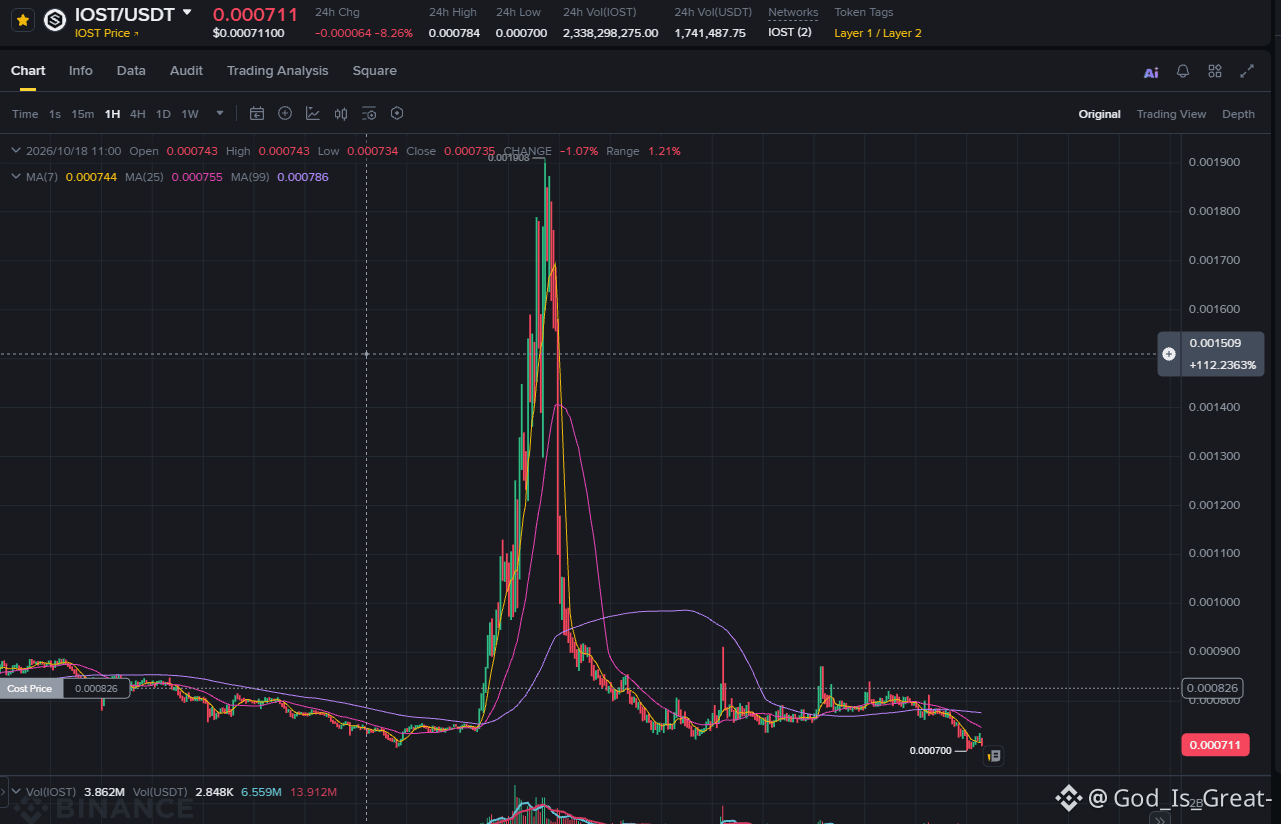
$IOST has experienced a sharp price drop recently, but traders are watching closely for a possible recovery and bullish breakout.
Are you ready for the next big $IOST move? 👀
Can IOST make a strong comeback?
#EarningsSeason #IOST
{spot}(IOSTUSDT)
$IOST has experienced a sharp price drop recently, but traders are watching closely for a possible recovery and bullish breakout.
Are you ready for the next big $IOST move? 👀
Can IOST make a strong comeback?
#EarningsSeason #IOST
Are you ready for the next big $IOST move? 👀
Can IOST make a strong comeback?
#EarningsSeason #IOST
750

·
--
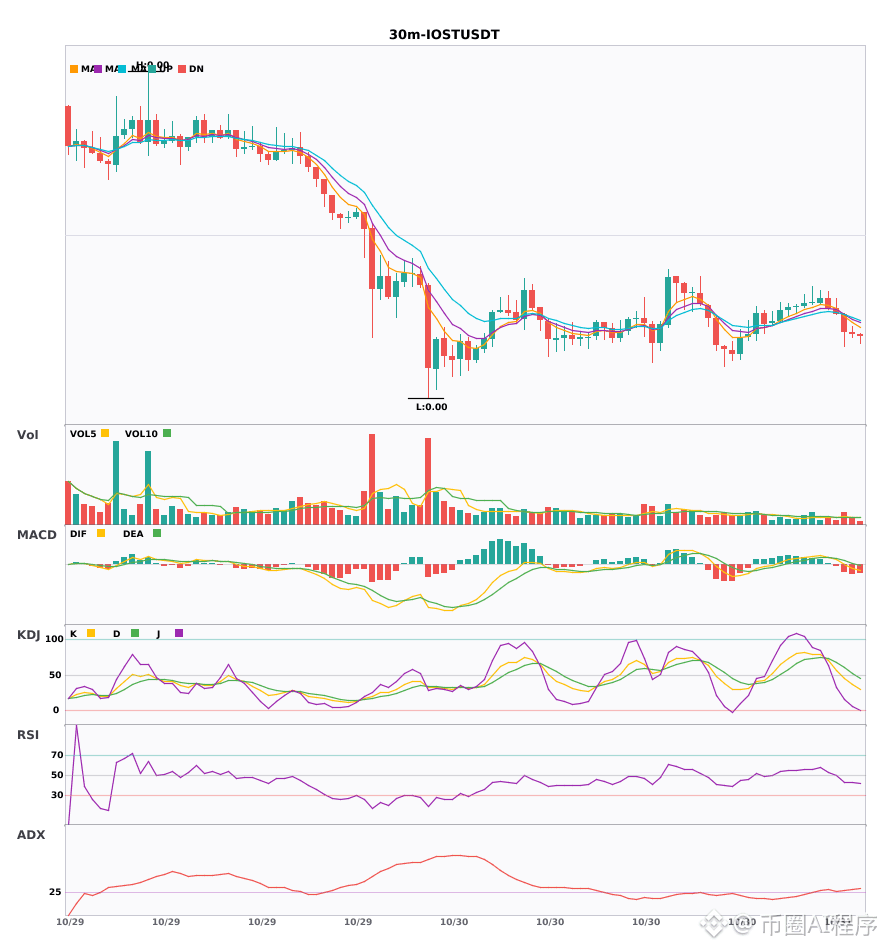
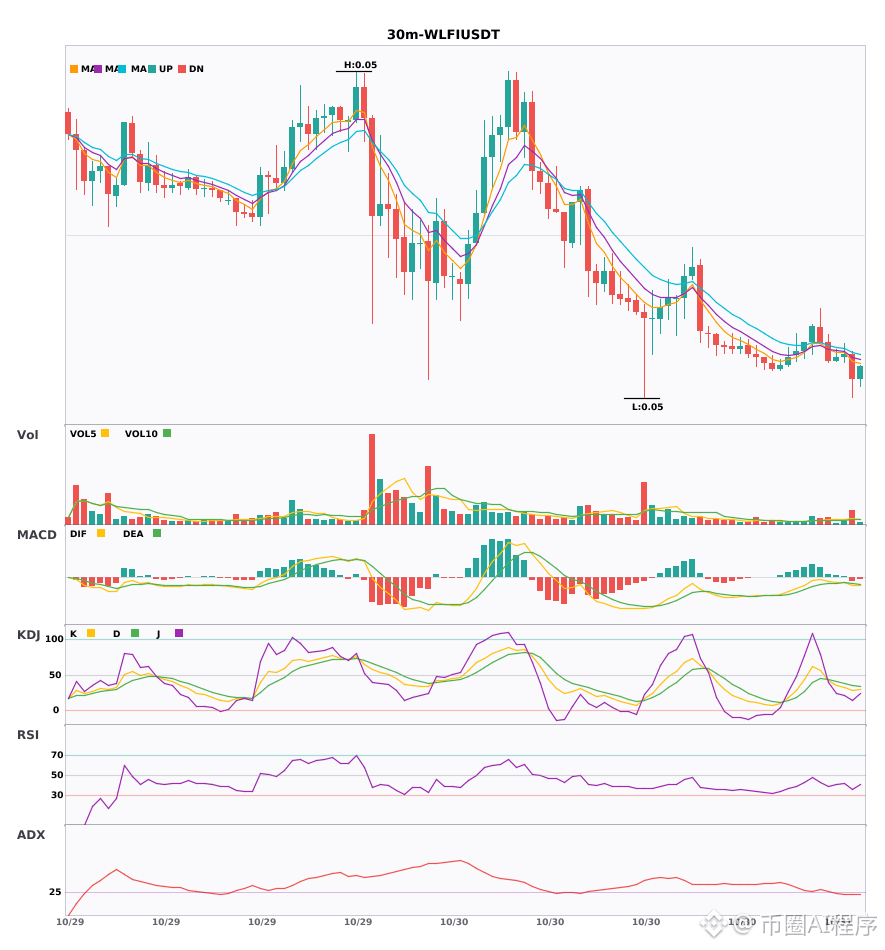
Multi-timeframe confluence: $IOST / $WLFI weakening on the 30-minute chart, 4-hour bearish trend confirmed🔥
════════════════════
🟢 $IOST 30-minute bearish signal
⚠️Technical analysis: 4-hour bearish confluence confirmed | 30-minute entry: MACD bearish, trend weak, momentum strengthening | EMA5 < EMA8 < EMA13, bearish alignment | Volume increased (1.8x)
════════════════════
🟢 $WLFI 30-minute bearish signal
⚠️Technical analysis: 4-hour bearish confluence confirmed | 30-minute entry: MACD bearish cross below zero, bearish momentum accelerating | EMA5 < EMA8 < EMA13, bearish alignment | KDJ weak, bears in control (K: 28.1, D: 34.7) | Volume surged (2.7x)
════════════════════
🔔 Follow for first-hand market alerts 🔔
#多周期共振 #IOST #WLFI
📌 When trading, pay attention to whether the candlestick patterns align
Multi-timeframe confluence: $IOST / $WLFI weakening on the 30-minute chart, 4-hour bearish trend confirmed🔥
════════════════════
🟢 $IOST 30-minute bearish signal
⚠️Technical analysis: 4-hour bearish confluence confirmed | 30-minute entry: MACD bearish, trend weak, momentum strengthening | EMA5 < EMA8 < EMA13, bearish alignment | Volume increased (1.8x)
════════════════════
🟢 $WLFI 30-minute bearish signal
⚠️Technical analysis: 4-hour bearish confluence confirmed | 30-minute entry: MACD bearish cross below zero, bearish momentum accelerating | EMA5 < EMA8 < EMA13, bearish alignment | KDJ weak, bears in control (K: 28.1, D: 34.7) | Volume surged (2.7x)
════════════════════
🔔 Follow for first-hand market alerts 🔔
#多周期共振 #IOST #WLFI
📌 When trading, pay attention to whether the candlestick patterns align
════════════════════
🟢 $IOST 30-minute bearish signal
⚠️Technical analysis: 4-hour bearish confluence confirmed | 30-minute entry: MACD bearish, trend weak, momentum strengthening | EMA5 < EMA8 < EMA13, bearish alignment | Volume increased (1.8x)
════════════════════
🟢 $WLFI 30-minute bearish signal
⚠️Technical analysis: 4-hour bearish confluence confirmed | 30-minute entry: MACD bearish cross below zero, bearish momentum accelerating | EMA5 < EMA8 < EMA13, bearish alignment | KDJ weak, bears in control (K: 28.1, D: 34.7) | Volume surged (2.7x)
════════════════════
🔔 Follow for first-hand market alerts 🔔
#多周期共振 #IOST #WLFI
📌 When trading, pay attention to whether the candlestick patterns align
22

·
--
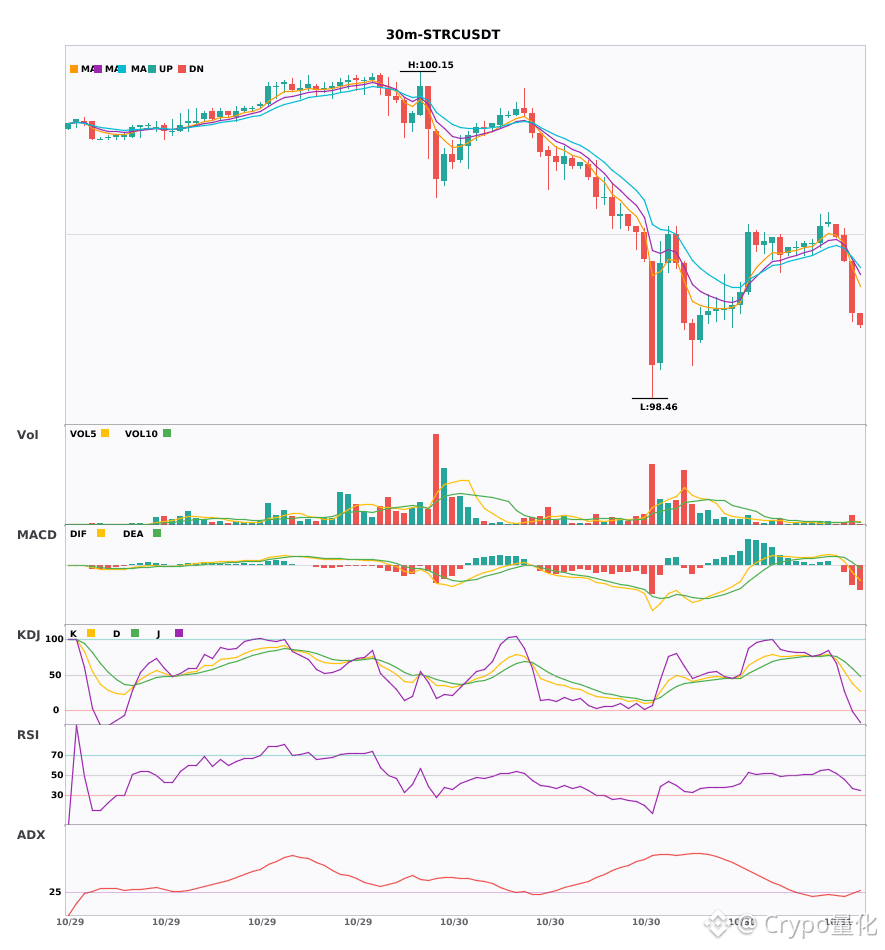
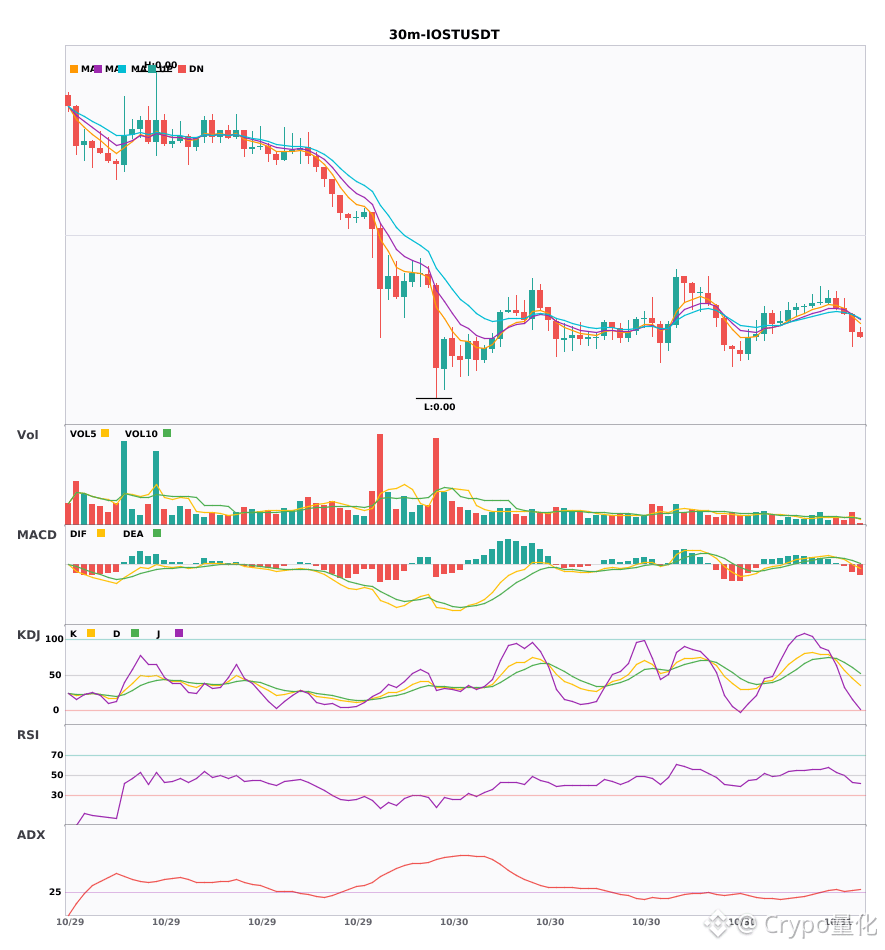
3 30-minute bearish alerts: $Bull Comes / $STRC / $IOST🔥
════════════════════
🟢 $Bull Comes 30-minute bearish signal
⚠️Technical analysis: ADX(25) Trend is forming; entry is possible | MACD is bearish, trend is weak, momentum is strengthening | EMA5 < EMA8 < EMA13, bearish alignment | Volume increase (1.6x)
════════════════════
🟢 $STRC 30-minute bearish signal
⚠️Technical analysis: ADX(26) Trend is forming; entry is possible | MACD DIF fell below zero, trend turned bearish | EMA5 crossed below EMA8, short-term trend turned bearish | Volume surge (3.1x)
════════════════════
🟢 $IOST 30-minute bearish signal
⚠️Technical analysis: ADX(31) Clear trending market | MACD DIF fell below zero, trend turned bearish | EMA5 crossed below EMA8, short-term trend turned bearish | Volume increase (1.8x)
════════════════════
🔔 Follow for first-hand market alerts 🔔
#技术分析 #牛来 #STRC #IOST
📌 When trading, pay attention to whether the candlestick pattern confirms the signal
3 30-minute bearish alerts: $Bull Comes / $STRC / $IOST 🔥
════════════════════
🟢 $Bull Comes 30-minute bearish signal
⚠️Technical analysis: ADX(25) Trend is forming; entry is possible | MACD is bearish, trend is weak, momentum is strengthening | EMA5 < EMA8 < EMA13, bearish alignment | Volume increase (1.6x)
════════════════════
🟢 $STRC 30-minute bearish signal
⚠️Technical analysis: ADX(26) Trend is forming; entry is possible | MACD DIF fell below zero, trend turned bearish | EMA5 crossed below EMA8, short-term trend turned bearish | Volume surge (3.1x)
════════════════════
🟢 $IOST 30-minute bearish signal
⚠️Technical analysis: ADX(31) Clear trending market | MACD DIF fell below zero, trend turned bearish | EMA5 crossed below EMA8, short-term trend turned bearish | Volume increase (1.8x)
════════════════════
🔔 Follow for first-hand market alerts 🔔
#技术分析 #牛来 #STRC #IOST
📌 When trading, pay attention to whether the candlestick pattern confirms the signal
════════════════════
🟢 $Bull Comes 30-minute bearish signal
⚠️Technical analysis: ADX(25) Trend is forming; entry is possible | MACD is bearish, trend is weak, momentum is strengthening | EMA5 < EMA8 < EMA13, bearish alignment | Volume increase (1.6x)
════════════════════
🟢 $STRC 30-minute bearish signal
⚠️Technical analysis: ADX(26) Trend is forming; entry is possible | MACD DIF fell below zero, trend turned bearish | EMA5 crossed below EMA8, short-term trend turned bearish | Volume surge (3.1x)
════════════════════
🟢 $IOST 30-minute bearish signal
⚠️Technical analysis: ADX(31) Clear trending market | MACD DIF fell below zero, trend turned bearish | EMA5 crossed below EMA8, short-term trend turned bearish | Volume increase (1.8x)
════════════════════
🔔 Follow for first-hand market alerts 🔔
#技术分析 #牛来 #STRC #IOST
📌 When trading, pay attention to whether the candlestick pattern confirms the signal
26

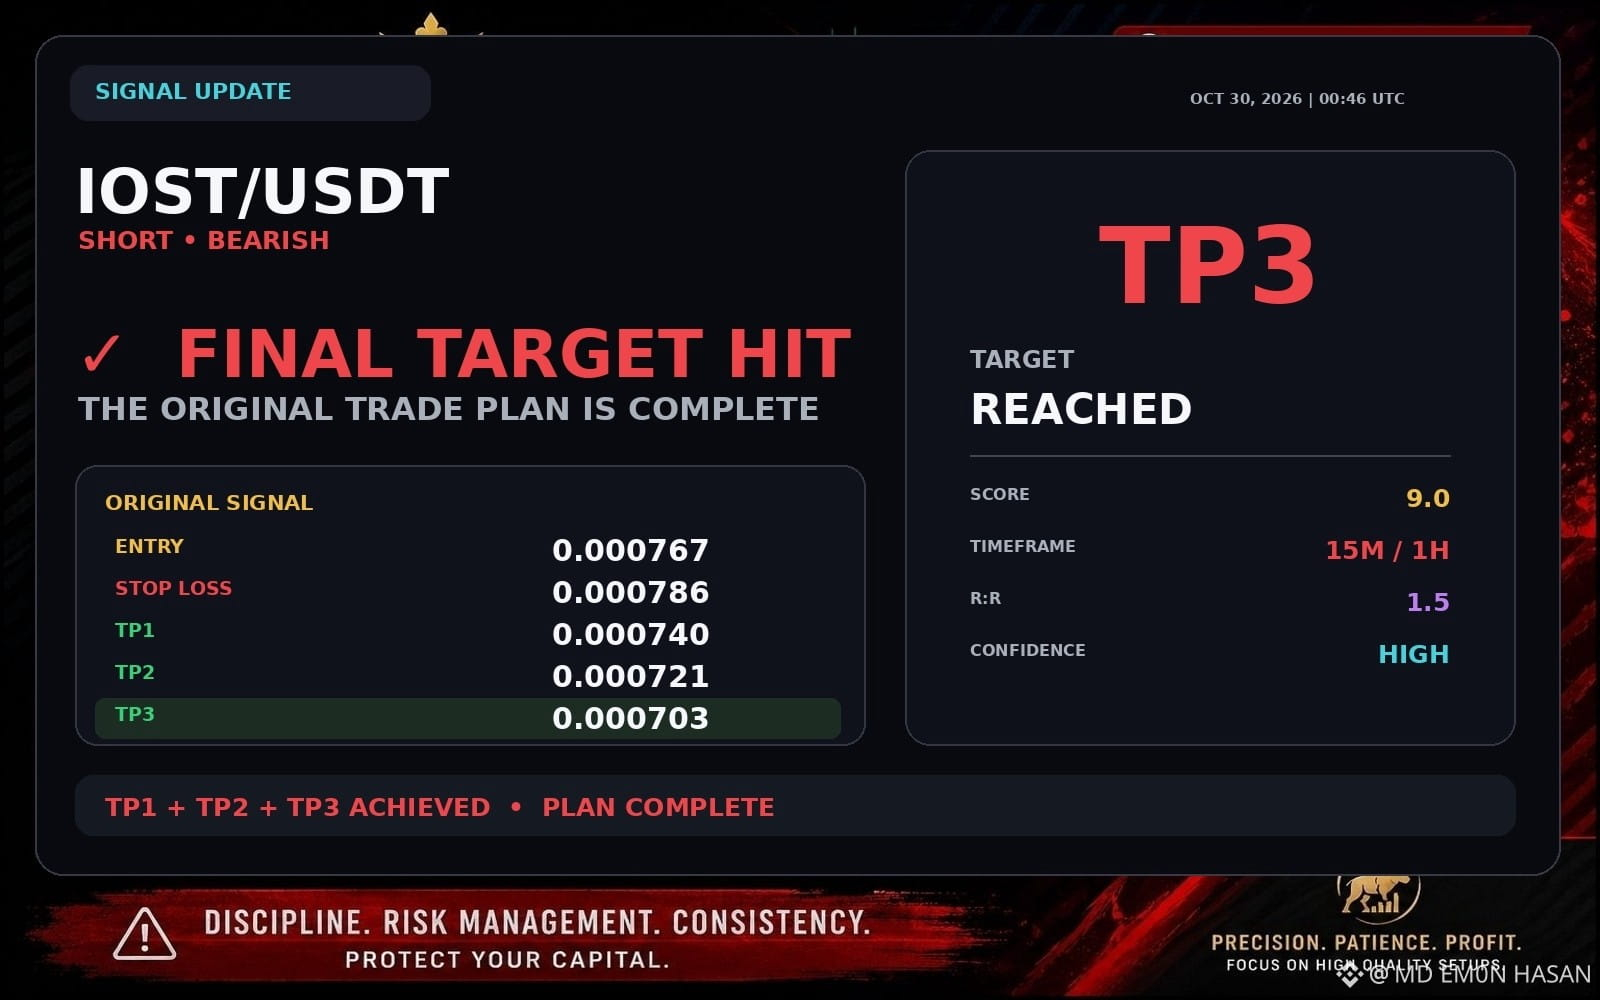
🚀 FINAL TARGET HIT
🔥 $IOST — SHORT UPDATE
⭐ Setup Score: 9.0/10
🧠 Confidence: HIGH
Congratulations to everyone who caught $IOST early and managed the setup according to plan! 🎉
TP3 — the final planned target — has been reached.
🎯 TP1: 0.0007 ✅
🎯 TP2: 0.0007 ✅
🎯 TP3: 0.0007 ✅
Trade plan completed.
#CryptoTrading #FuturesTrading #TechnicalAnalysis #IOST
⚠️ Research/validation update — not financial advice.
🚀 FINAL TARGET HIT
🔥 $IOST — SHORT UPDATE
⭐ Setup Score: 9.0/10
🧠 Confidence: HIGH
Congratulations to everyone who caught $IOST early and managed the setup according to plan! 🎉
TP3 — the final planned target — has been reached.
🎯 TP1: 0.0007 ✅
🎯 TP2: 0.0007 ✅
🎯 TP3: 0.0007 ✅
Trade plan completed.
#CryptoTrading #FuturesTrading #TechnicalAnalysis #IOST
⚠️ Research/validation update — not financial advice.
🔥 $IOST — SHORT UPDATE
⭐ Setup Score: 9.0/10
🧠 Confidence: HIGH
Congratulations to everyone who caught $IOST early and managed the setup according to plan! 🎉
TP3 — the final planned target — has been reached.
🎯 TP1: 0.0007 ✅
🎯 TP2: 0.0007 ✅
🎯 TP3: 0.0007 ✅
Trade plan completed.
#CryptoTrading #FuturesTrading #TechnicalAnalysis #IOST
⚠️ Research/validation update — not financial advice.
74
·
--
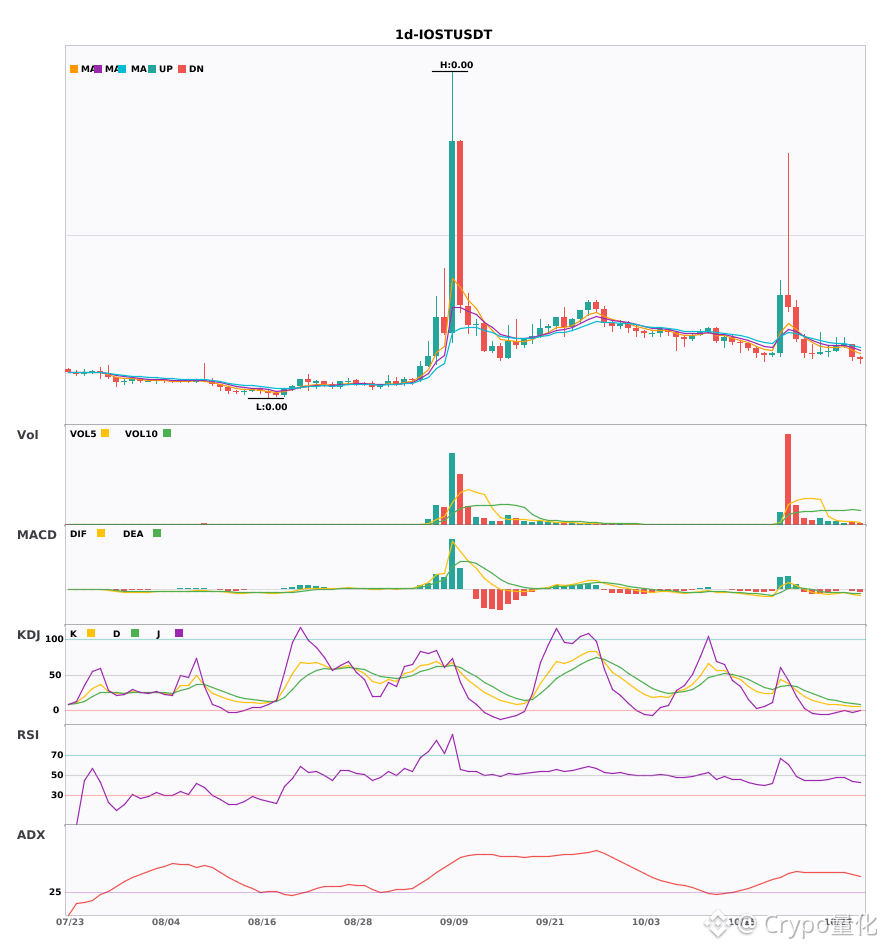
$IOST Daily chart bearish, short-term pressure 🔥
════════════════════
🟢 $IOST Daily chart bearish signal
⚠️ Technicals: ADX(47) indicates a very strong trend (beware of an overheated pullback) | MACD bearish crossover below zero, bearish momentum accelerating | EMA5 < EMA8 < EMA13, bearish alignment | KDJ in oversold territory; watch for a rebound (K is 5.6, D is 9.6) | Low volume (0.2x)
════════════════════
🔔 Follow to get the latest market moves 🔔
#技术分析 #IOST
📌 When trading, pay attention to whether the candlestick pattern confirms the signal
$IOST Daily chart bearish, short-term pressure 🔥
════════════════════
🟢 $IOST Daily chart bearish signal
⚠️ Technicals: ADX(47) indicates a very strong trend (beware of an overheated pullback) | MACD bearish crossover below zero, bearish momentum accelerating | EMA5 < EMA8 < EMA13, bearish alignment | KDJ in oversold territory; watch for a rebound (K is 5.6, D is 9.6) | Low volume (0.2x)
════════════════════
🔔 Follow to get the latest market moves 🔔
#技术分析 #IOST
📌 When trading, pay attention to whether the candlestick pattern confirms the signal
════════════════════
🟢 $IOST Daily chart bearish signal
⚠️ Technicals: ADX(47) indicates a very strong trend (beware of an overheated pullback) | MACD bearish crossover below zero, bearish momentum accelerating | EMA5 < EMA8 < EMA13, bearish alignment | KDJ in oversold territory; watch for a rebound (K is 5.6, D is 9.6) | Low volume (0.2x)
════════════════════
🔔 Follow to get the latest market moves 🔔
#技术分析 #IOST
📌 When trading, pay attention to whether the candlestick pattern confirms the signal
18
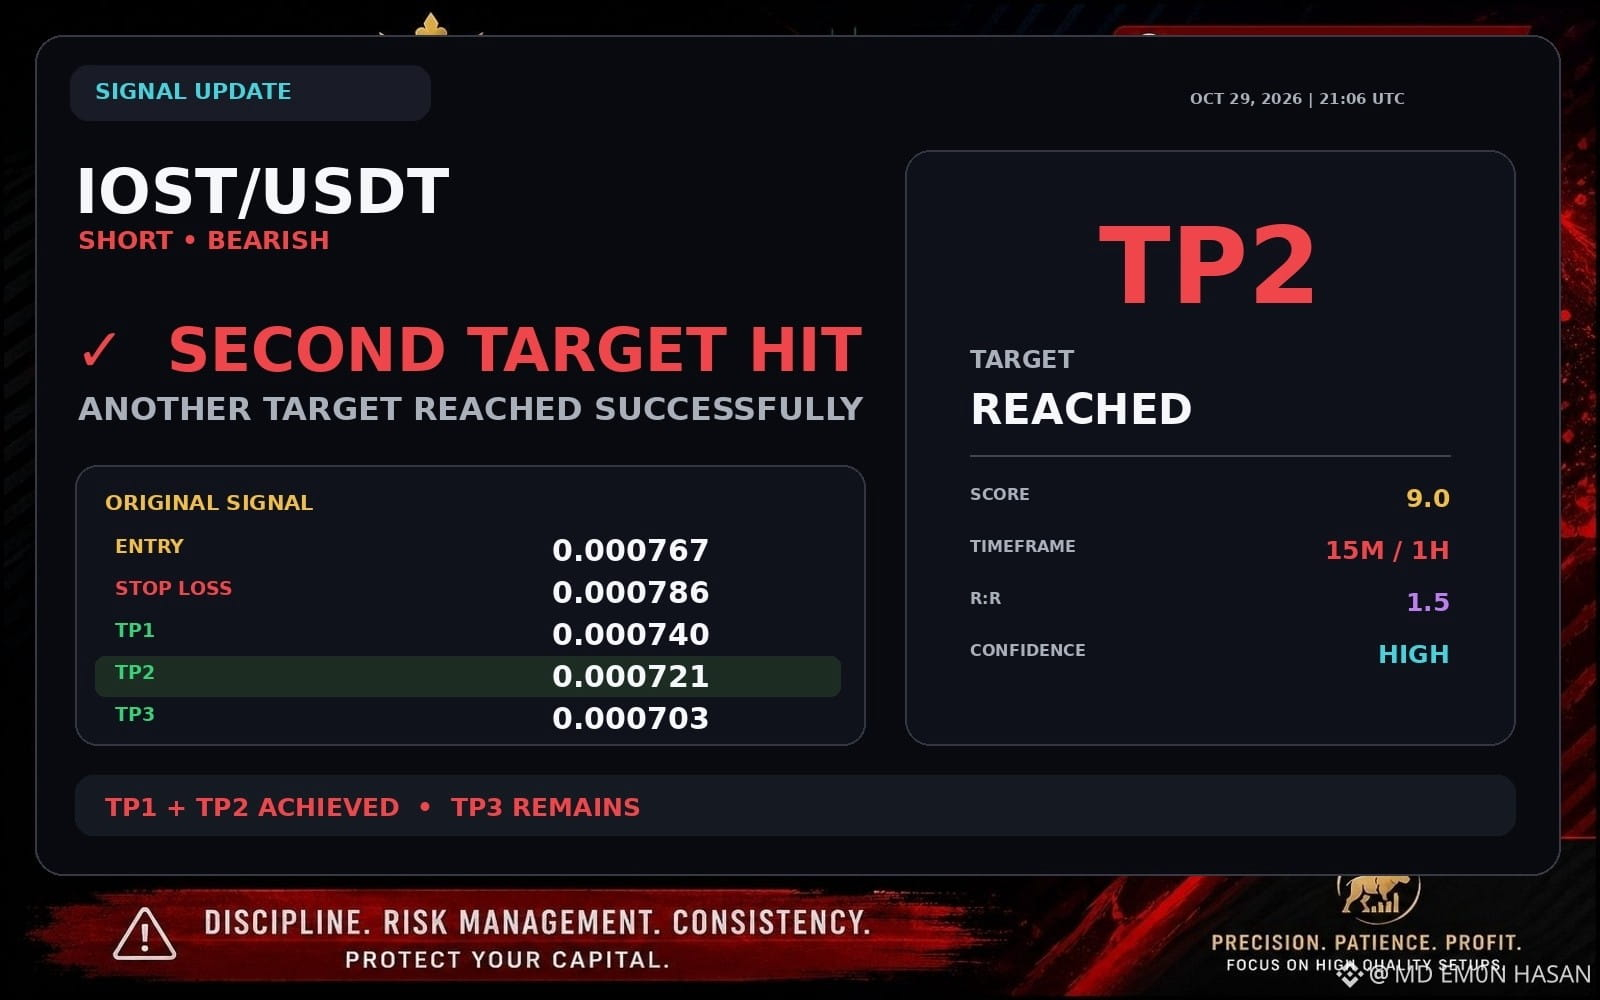
🏆 SECOND TARGET HIT
🔥 $IOST — SHORT UPDATE
⭐ Setup Score: 9.0/10
🧠 Confidence: HIGH
Another target reached on $IOST! 🔥
TP2 has been reached successfully while the setup remains active toward the final target.
🎯 TP1: 0.0007 ✅
🎯 TP2: 0.0007 ✅
🎯 TP3: 0.0007
#CryptoTrading #FuturesTrading #TechnicalAnalysis #IOST
⚠️ Research/validation update — not financial advice.
🏆 SECOND TARGET HIT
🔥 $IOST — SHORT UPDATE
⭐ Setup Score: 9.0/10
🧠 Confidence: HIGH
Another target reached on $IOST ! 🔥
TP2 has been reached successfully while the setup remains active toward the final target.
🎯 TP1: 0.0007 ✅
🎯 TP2: 0.0007 ✅
🎯 TP3: 0.0007
#CryptoTrading #FuturesTrading #TechnicalAnalysis #IOST
⚠️ Research/validation update — not financial advice.
🔥 $IOST — SHORT UPDATE
⭐ Setup Score: 9.0/10
🧠 Confidence: HIGH
Another target reached on $IOST ! 🔥
TP2 has been reached successfully while the setup remains active toward the final target.
🎯 TP1: 0.0007 ✅
🎯 TP2: 0.0007 ✅
🎯 TP3: 0.0007
#CryptoTrading #FuturesTrading #TechnicalAnalysis #IOST
⚠️ Research/validation update — not financial advice.
20
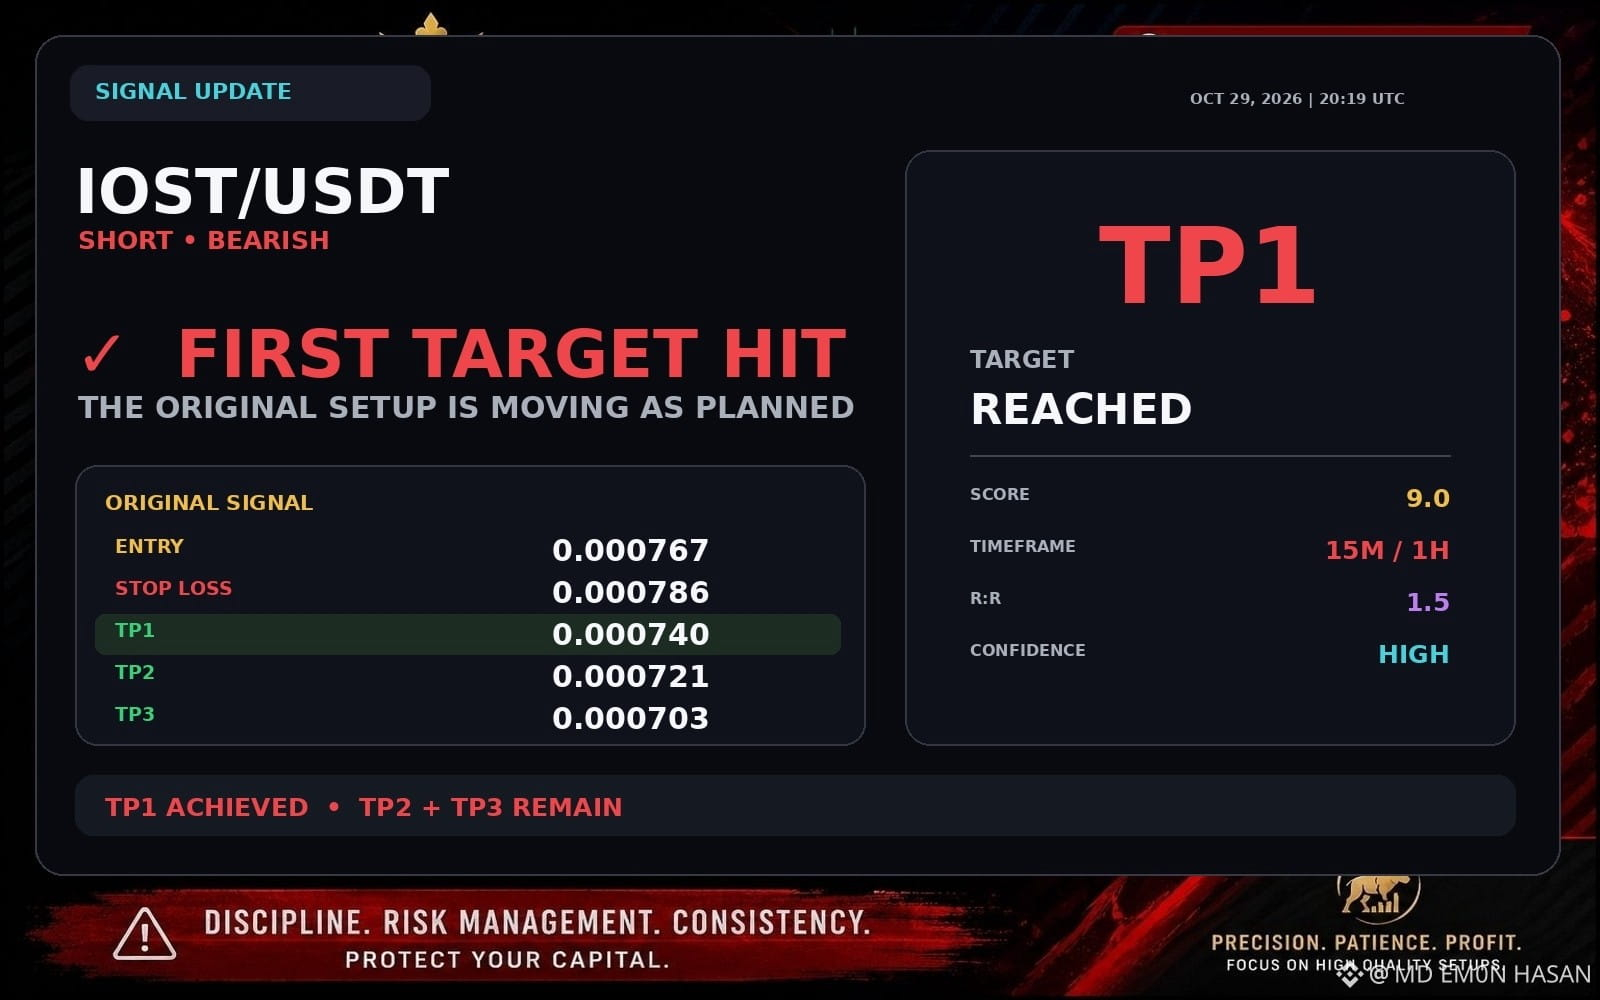
🎯 FIRST TARGET HIT
🔥 $IOST — SHORT UPDATE
⭐ Setup Score: 9.0/10
🧠 Confidence: HIGH
Congratulations to everyone who caught $IOST early and managed the setup according to plan! 🥳
TP1 has been reached successfully.
📍 Entry: 0.0008
🎯 TP1: 0.0007
🎯 TP2: 0.0007
🎯 TP3: 0.0007
The setup remains active toward the remaining targets.
#CryptoTrading #FuturesTrading #TechnicalAnalysis #IOST
⚠️ Research/validation update — not financial advice.
🎯 FIRST TARGET HIT
🔥 $IOST — SHORT UPDATE
⭐ Setup Score: 9.0/10
🧠 Confidence: HIGH
Congratulations to everyone who caught $IOST early and managed the setup according to plan! 🥳
TP1 has been reached successfully.
📍 Entry: 0.0008
🎯 TP1: 0.0007
🎯 TP2: 0.0007
🎯 TP3: 0.0007
The setup remains active toward the remaining targets.
#CryptoTrading #FuturesTrading #TechnicalAnalysis #IOST
⚠️ Research/validation update — not financial advice.
🔥 $IOST — SHORT UPDATE
⭐ Setup Score: 9.0/10
🧠 Confidence: HIGH
Congratulations to everyone who caught $IOST early and managed the setup according to plan! 🥳
TP1 has been reached successfully.
📍 Entry: 0.0008
🎯 TP1: 0.0007
🎯 TP2: 0.0007
🎯 TP3: 0.0007
The setup remains active toward the remaining targets.
#CryptoTrading #FuturesTrading #TechnicalAnalysis #IOST
⚠️ Research/validation update — not financial advice.
15

{future}(IOSTUSDT)
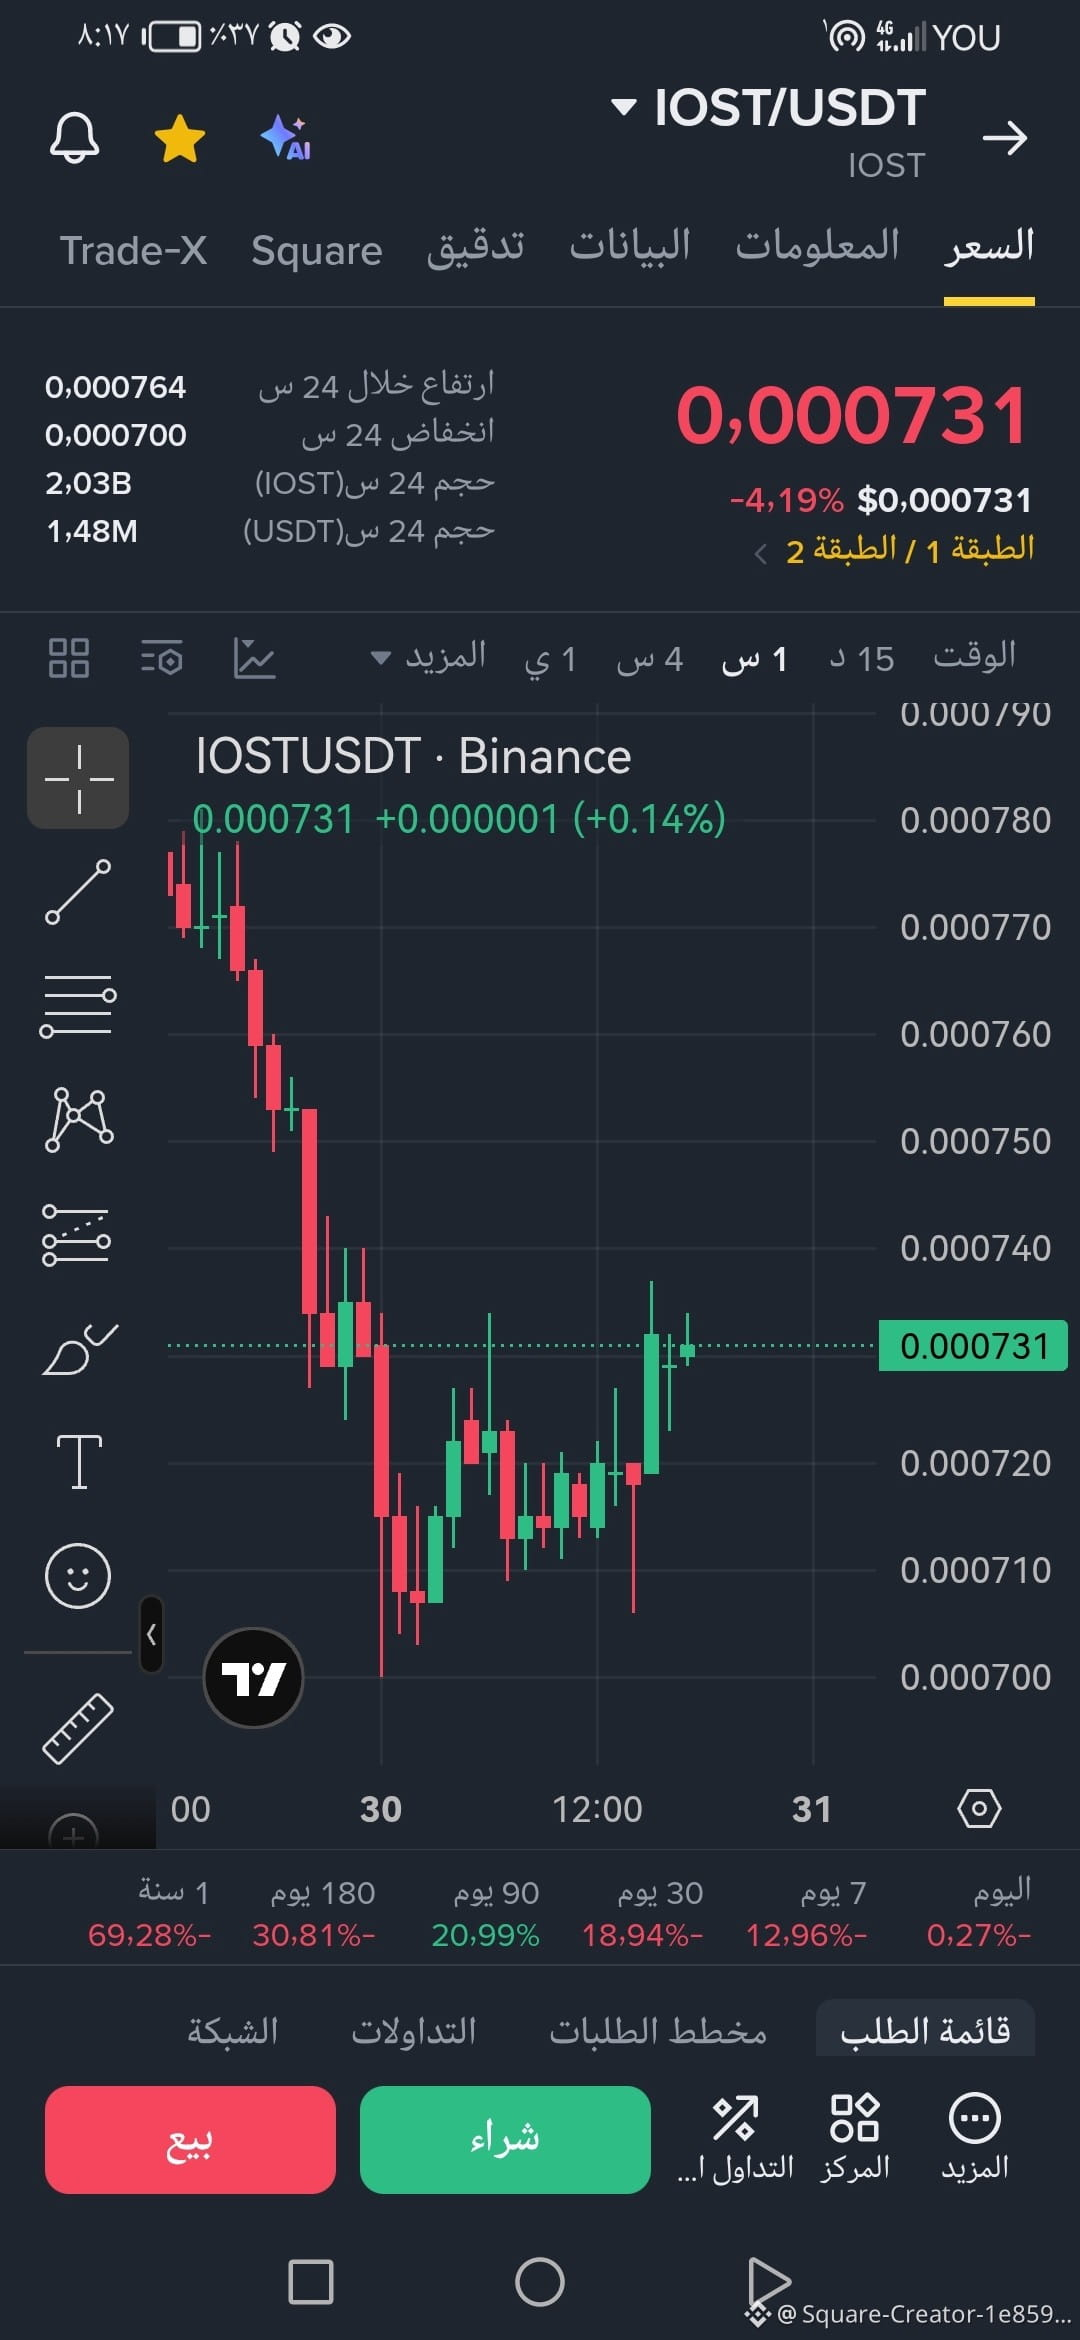
Guys, coin $IOST looks ready to take off! 🚀🔥
After some nice accumulation and holding above the bottom, the chart is giving a clear entry signal with the green candles. The ideal entry point right now is between 0.000720 and 0.000731—don't miss out!
#IOST
Guys, coin $IOST looks ready to take off! 🚀🔥
After some nice accumulation and holding above the bottom, the chart is giving a clear entry signal with the green candles. The ideal entry point right now is between 0.000720 and 0.000731—don't miss out!
#IOST
After some nice accumulation and holding above the bottom, the chart is giving a clear entry signal with the green candles. The ideal entry point right now is between 0.000720 and 0.000731—don't miss out!
#IOST
333

·
--
📊 IOST Recommendation
🟢 Direction: LONG with caution
💰 Entry price: 0.000752
📈 Analysis: The RSI is at 29.9 on the hourly timeframe, indicating oversold conditions and the possibility of an upward bounce, but confirmation of the reversal is needed.
🎯 First target: 0.000765 🎯 Second target: 0.000778 🎯 Third target: 0.000795
🛑 Stop loss: 0.000738
🔥 Look for opportunities
$IOST #IOST
📊 IOST Recommendation
🟢 Direction: LONG with caution
💰 Entry price: 0.000752
📈 Analysis: The RSI is at 29.9 on the hourly timeframe, indicating oversold conditions and the possibility of an upward bounce, but confirmation of the reversal is needed.
🎯 First target: 0.000765 🎯 Second target: 0.000778 🎯 Third target: 0.000795
🛑 Stop loss: 0.000738
🔥 Look for opportunities
$IOST #IOST
🟢 Direction: LONG with caution
💰 Entry price: 0.000752
📈 Analysis: The RSI is at 29.9 on the hourly timeframe, indicating oversold conditions and the possibility of an upward bounce, but confirmation of the reversal is needed.
🎯 First target: 0.000765 🎯 Second target: 0.000778 🎯 Third target: 0.000795
🛑 Stop loss: 0.000738
🔥 Look for opportunities
$IOST #IOST
1
99
·
--
🚨$IOST /USDT on the Verge of a Move: Bounce Opportunity or Further Downside? 📉🔍
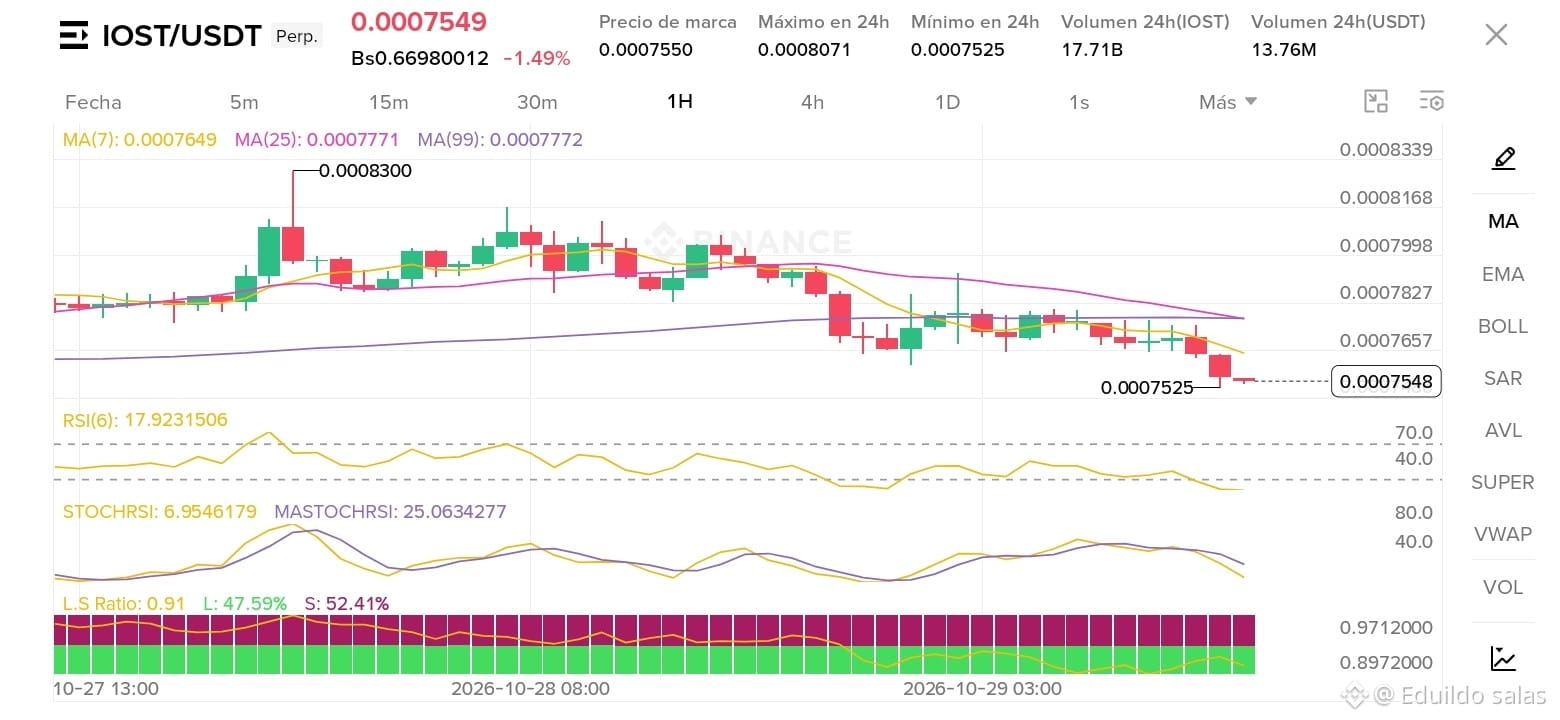
Price action in the $IOST /USDT pair (1H chart) presents a highly interesting technical scenario that every trader should keep a close eye on right now. After reaching a 24-hour high of 0.0008071, the price has undergone a steady correction and is now trading at 0.0007549 (-1.49% in the current move), nearing the day's low of 0.0007525.
🔎 Key Technical Analysis Points:
Moving Averages (MA): The trend lines (MA 7, MA 25, and MA 99) show short-term downward pressure, with the price trading below the main averages. This marks an immediate dynamic resistance that buyers need to reclaim.
RSI (6) in Extreme Oversold Territory: The Relative Strength Index has fallen to 17.92, a deeply oversold zone that has historically tended to precede relief moves or significant technical rebounds as sellers become exhausted.
StochRSI: At minimum levels (6.95), confirming the bearish compression and suggesting that selling pressure may be finding a temporary floor.
Volume and Sentiment (L/S Ratio): 24-hour volume remains robust at 17.71B IOST (equivalent to 13.76M USDT), while the Long/Short ratio stands at 0.91 (47.59% Longs vs. 52.41% Shorts), reflecting a slight advantage for the bears, though the market remains highly contested.
💡 Conclusion: We are at a critical support zone. If the price manages to consolidate at these levels and the RSI exits oversold territory, we could see an interesting recovery move. However, risk management is key if bearish pressure decides to break below the current lows.
Are you accumulating at this level, or would you rather wait for confirmation? I’d love to hear your thoughts in the comments! 👇💬
#IOST #BinanceSquare #Web3 #EarningsSeason #BinancePick
🚨$IOST /USDT on the Verge of a Move: Bounce Opportunity or Further Downside? 📉🔍
Price action in the $IOST /USDT pair (1H chart) presents a highly interesting technical scenario that every trader should keep a close eye on right now. After reaching a 24-hour high of 0.0008071, the price has undergone a steady correction and is now trading at 0.0007549 (-1.49% in the current move), nearing the day's low of 0.0007525.
🔎 Key Technical Analysis Points:
Moving Averages (MA): The trend lines (MA 7, MA 25, and MA 99) show short-term downward pressure, with the price trading below the main averages. This marks an immediate dynamic resistance that buyers need to reclaim.
RSI (6) in Extreme Oversold Territory: The Relative Strength Index has fallen to 17.92, a deeply oversold zone that has historically tended to precede relief moves or significant technical rebounds as sellers become exhausted.
StochRSI: At minimum levels (6.95), confirming the bearish compression and suggesting that selling pressure may be finding a temporary floor.
Volume and Sentiment (L/S Ratio): 24-hour volume remains robust at 17.71B IOST (equivalent to 13.76M USDT), while the Long/Short ratio stands at 0.91 (47.59% Longs vs. 52.41% Shorts), reflecting a slight advantage for the bears, though the market remains highly contested.
💡 Conclusion: We are at a critical support zone. If the price manages to consolidate at these levels and the RSI exits oversold territory, we could see an interesting recovery move. However, risk management is key if bearish pressure decides to break below the current lows.
Are you accumulating at this level, or would you rather wait for confirmation? I’d love to hear your thoughts in the comments! 👇💬
#IOST #BinanceSquare #Web3 #EarningsSeason #BinancePick
Price action in the $IOST /USDT pair (1H chart) presents a highly interesting technical scenario that every trader should keep a close eye on right now. After reaching a 24-hour high of 0.0008071, the price has undergone a steady correction and is now trading at 0.0007549 (-1.49% in the current move), nearing the day's low of 0.0007525.
🔎 Key Technical Analysis Points:
Moving Averages (MA): The trend lines (MA 7, MA 25, and MA 99) show short-term downward pressure, with the price trading below the main averages. This marks an immediate dynamic resistance that buyers need to reclaim.
RSI (6) in Extreme Oversold Territory: The Relative Strength Index has fallen to 17.92, a deeply oversold zone that has historically tended to precede relief moves or significant technical rebounds as sellers become exhausted.
StochRSI: At minimum levels (6.95), confirming the bearish compression and suggesting that selling pressure may be finding a temporary floor.
Volume and Sentiment (L/S Ratio): 24-hour volume remains robust at 17.71B IOST (equivalent to 13.76M USDT), while the Long/Short ratio stands at 0.91 (47.59% Longs vs. 52.41% Shorts), reflecting a slight advantage for the bears, though the market remains highly contested.
💡 Conclusion: We are at a critical support zone. If the price manages to consolidate at these levels and the RSI exits oversold territory, we could see an interesting recovery move. However, risk management is key if bearish pressure decides to break below the current lows.
Are you accumulating at this level, or would you rather wait for confirmation? I’d love to hear your thoughts in the comments! 👇💬
#IOST #BinanceSquare #Web3 #EarningsSeason #BinancePick
126



·
--
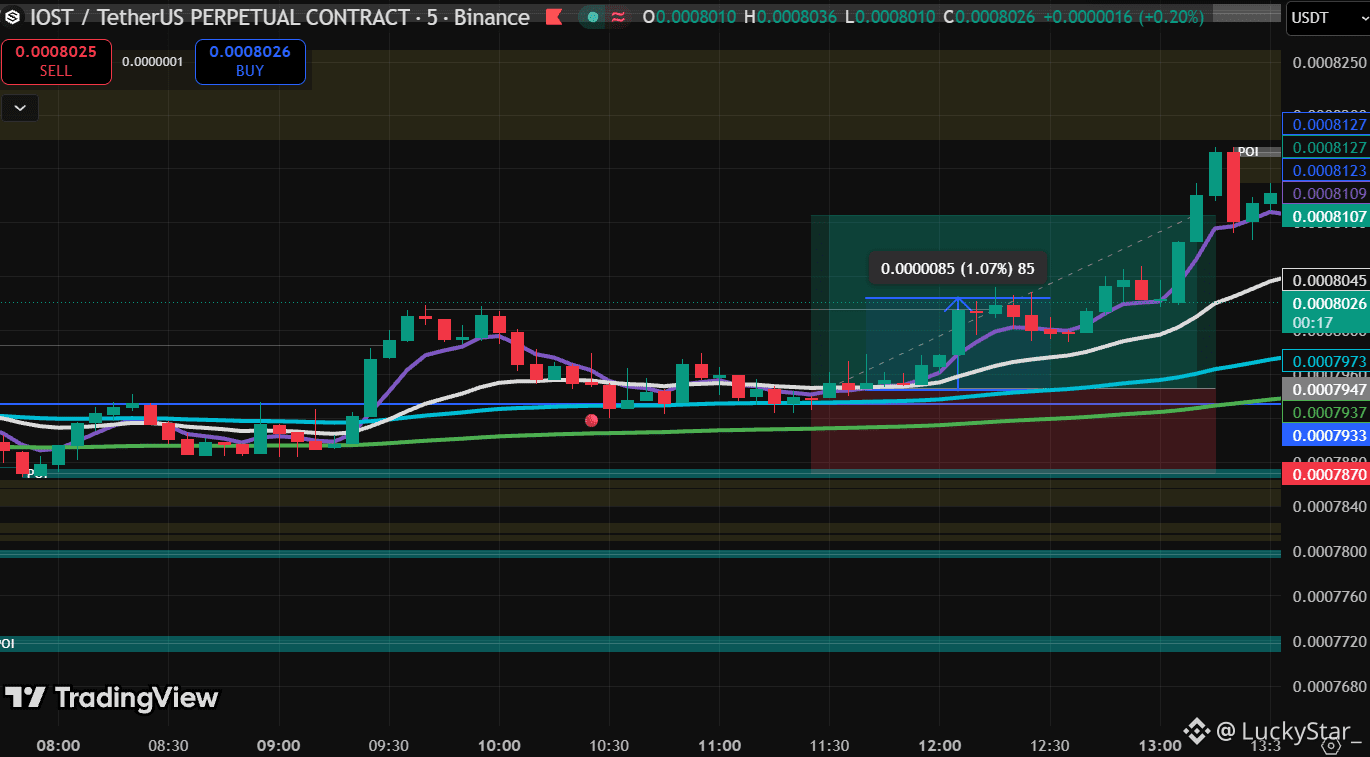
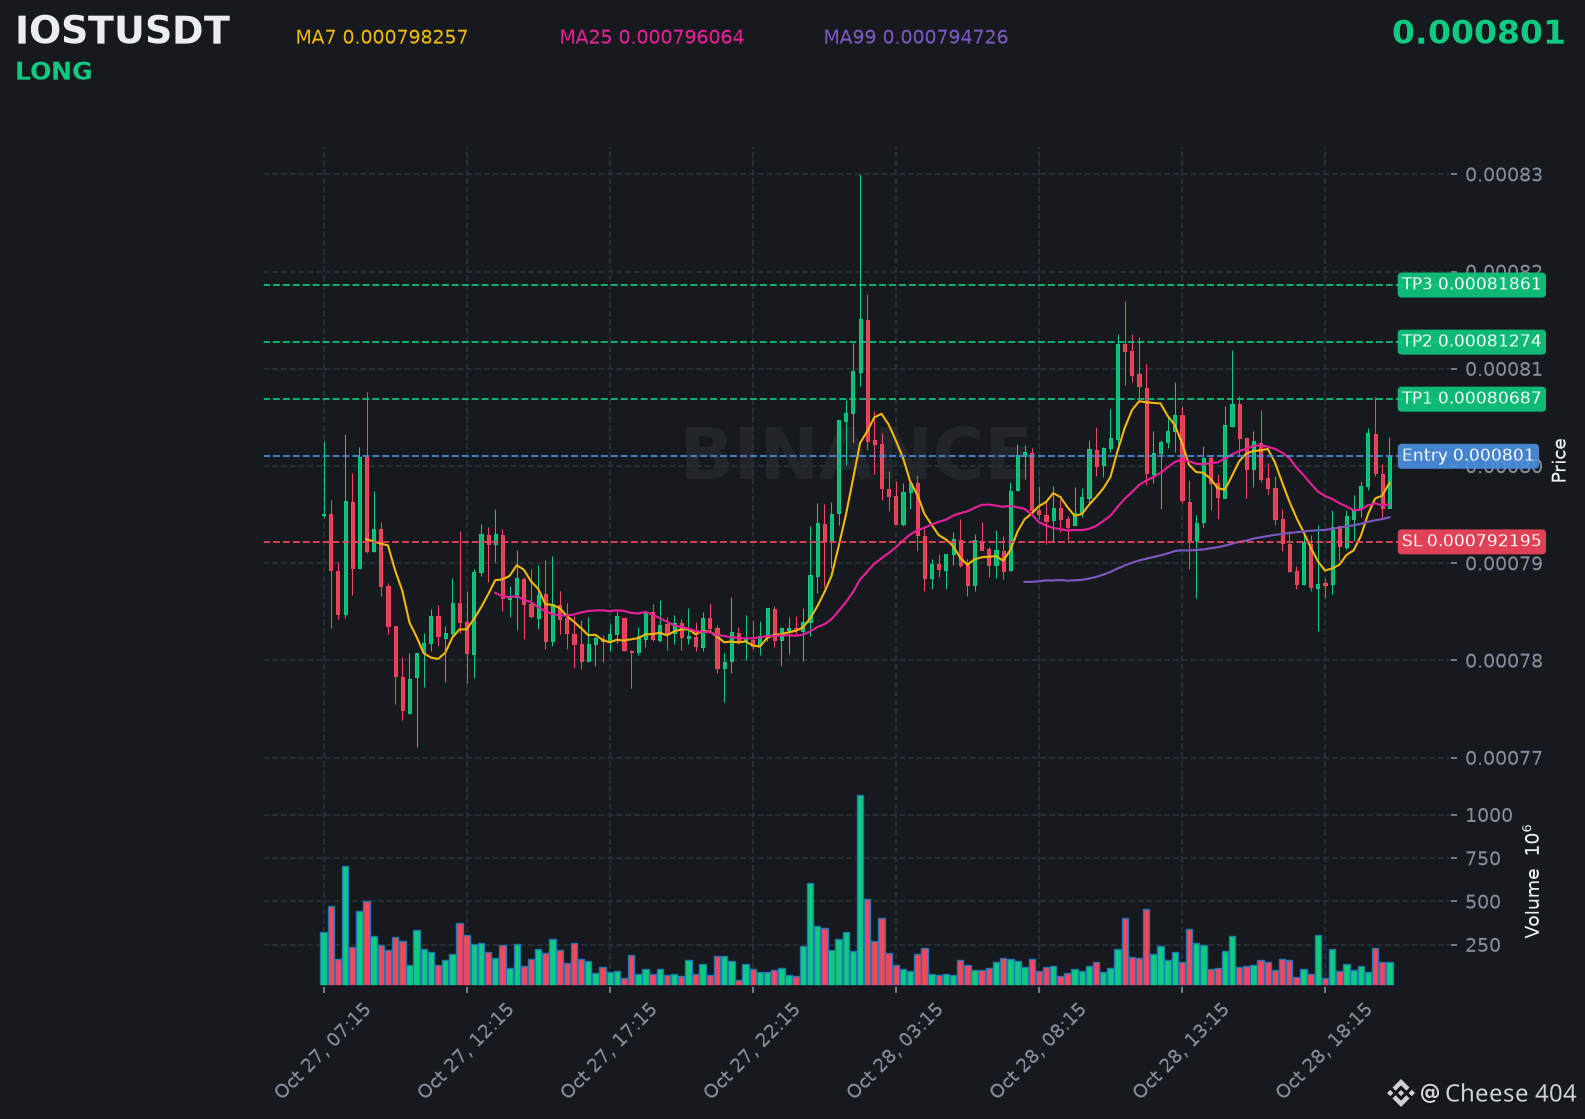
$IOST is showing a clear uptrend, with buyers stepping in and pushing the price higher.
📍 @ 0.000801 | Volume: 0.12M USD
RSI 55 | EMA20: 0.000796319 USD
📈 Trade Plan:
📈 Entry: 0.000799239 – 0.000802761
🛑 Stop Loss: 0.000792195
🎯 TP1: 0.00080687
🎯 TP2: 0.00081274
🎯 TP3: 0.00081861
Waiting for a retest, then riding the uptrend.
👉 $IOST 👈 Catch it
#IOST
$IOST is showing a clear uptrend, with buyers stepping in and pushing the price higher.
📍 @ 0.000801 | Volume: 0.12M USD
RSI 55 | EMA20: 0.000796319 USD
📈 Trade Plan:
📈 Entry: 0.000799239 – 0.000802761
🛑 Stop Loss: 0.000792195
🎯 TP1: 0.00080687
🎯 TP2: 0.00081274
🎯 TP3: 0.00081861
Waiting for a retest, then riding the uptrend.
👉 $IOST 👈 Catch it
#IOST
📍 @ 0.000801 | Volume: 0.12M USD
RSI 55 | EMA20: 0.000796319 USD
📈 Trade Plan:
📈 Entry: 0.000799239 – 0.000802761
🛑 Stop Loss: 0.000792195
🎯 TP1: 0.00080687
🎯 TP2: 0.00081274
🎯 TP3: 0.00081861
Waiting for a retest, then riding the uptrend.
👉 $IOST 👈 Catch it
#IOST
Übermensch44:
I bought at 0.000876 🥲
1
196
Log in to explore more content
Join global crypto users on Binance Square
⚡️ Get latest and useful information about crypto.
💬 Trusted by the world’s largest crypto exchange.
👍 Discover real insights from verified creators.
Email / Phone number
Trending Topics
1
#Binance98PercentReplenished
107 views
77 Discussing
2
#USMidterms-WhatAreMarketsExpecting?
190,690 views
1,493 Discussing
3
#USOctoberNFP-AreRateCutsStillPossible
308,026 views
2,425 Discussing
4
#AMDBeatsExpectations-AINarrativeContinues
50,265 views
559 Discussing
5
#CircleQ3Revenue865M
7,600 views
256 Discussing
6
#BinanceIncidentReport
363,488 views
1,805 Discussing
7
#USStocksOpenHigherAsDowGains1.9%
76 views
23 Discussing
8
#ADPUSPrivateEmployersAdd86000JobsInOctober
33 views
10 Discussing
9
#FrenchAssemblyPassesSelfCustodiedCryptoReportingAmendment
231 views
12 Discussing
10
#AnthropicIPOPricedDownasInvestorsEye$1.5T
26,869 views
122 Discussing