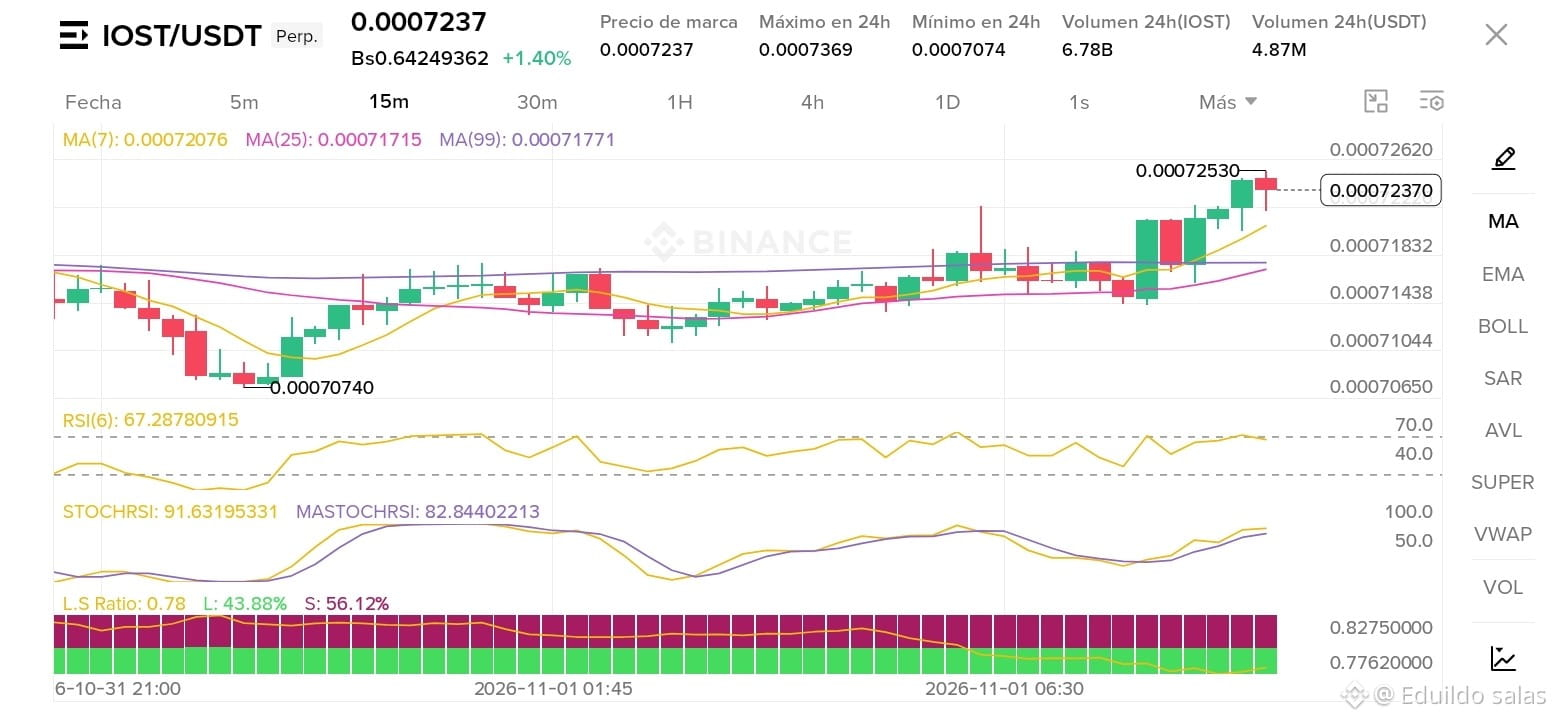
🚀 Quick Analysis: $IOST / USDT (Perpetual - 15m Timeframe)
📈 Current Technical Setup:
Current price: $0.0007237 (+1.40%)
Trading Range (24h): Low of $0.0007074 ➔ High of $0.0007369
Moving Averages (MA): The trend lines (MA 7, 25, and 99) show a short-term bullish alignment after bouncing from the key support zone at $0.0007074.
Momentum Indicators:
RSI (6): At ~67.28, approaching the overbought zone, but with room for one final bullish push if buying pressure holds.
StochRSI: In elevated territory (~91.63), suggesting caution about a possible short-term consolidation or pullback before the trend continues.
🎯 Suggested Trading Setup (Risk Management)
Direction: 🟢 Long (Buy / Bullish) on a pullback or breakout above immediate resistance.
Entry Zone: $0.0007180 – $0.0007230 (looking for support at the fast moving average).
Take Profit (TP):
TP1: $0.0007350
TP2: $0.0007500
Stop Loss (SL): $0.0007050 (below recent support and the structure invalidation level).
⚠️ Risk management note: Trade with controlled leverage and stick to your Stop Loss to protect your capital amid the high volatility of the perpetual market.
#IOST #BinanceSquare #CryptoTrading #AnalisisTecnico #BinanceSAFUFundTransferCompleted7499BTC