
#16
16
19,211 views
186 Discussing
Hot
Latest

·
--
$LIT This one is a little interesting.
In the 15m chart, it’s up 2.62%. Volume shot straight to 3.05x, and the closing price broke above the upper band of the past ~20 5m candles. The aggressive buy-side imbalance is +8.6%, and the buy/sell ratio is 1.19—on the short-term chart, it really looks like someone is抢 (snapping up).
But take a closer look at OI: 15m is -0.03%, and 1h is -0.82%. Price is rising while open interest is falling. This doesn’t look like fresh long positions entering; it looks more like shorts being forced to cover. The OI abnormal percentile is 99%, across the whole pool #16, with nominal change #8. It’s been continuing across several consecutive cycles—this suggests it’s not just a one-off spike, but sustained pushing by capital.
In the last 24h, trading volume is 77M, and the depth is there. If they really wanted to push, it wouldn’t be that they can’t.
The question is: after the shorts cover and push it up, what happens once the covering is done? If OI still can’t turn back upward later, this move might just be an emotion-driven pulse. If you want to chase it, keep an eye on when OI turns positive.
$LIT This one is a little interesting.
In the 15m chart, it’s up 2.62%. Volume shot straight to 3.05x, and the closing price broke above the upper band of the past ~20 5m candles. The aggressive buy-side imbalance is +8.6%, and the buy/sell ratio is 1.19—on the short-term chart, it really looks like someone is抢 (snapping up).
But take a closer look at OI: 15m is -0.03%, and 1h is -0.82%. Price is rising while open interest is falling. This doesn’t look like fresh long positions entering; it looks more like shorts being forced to cover. The OI abnormal percentile is 99%, across the whole pool #16, with nominal change #8. It’s been continuing across several consecutive cycles—this suggests it’s not just a one-off spike, but sustained pushing by capital.
In the last 24h, trading volume is 77M, and the depth is there. If they really wanted to push, it wouldn’t be that they can’t.
The question is: after the shorts cover and push it up, what happens once the covering is done? If OI still can’t turn back upward later, this move might just be an emotion-driven pulse. If you want to chase it, keep an eye on when OI turns positive.
In the 15m chart, it’s up 2.62%. Volume shot straight to 3.05x, and the closing price broke above the upper band of the past ~20 5m candles. The aggressive buy-side imbalance is +8.6%, and the buy/sell ratio is 1.19—on the short-term chart, it really looks like someone is抢 (snapping up).
But take a closer look at OI: 15m is -0.03%, and 1h is -0.82%. Price is rising while open interest is falling. This doesn’t look like fresh long positions entering; it looks more like shorts being forced to cover. The OI abnormal percentile is 99%, across the whole pool #16, with nominal change #8. It’s been continuing across several consecutive cycles—this suggests it’s not just a one-off spike, but sustained pushing by capital.
In the last 24h, trading volume is 77M, and the depth is there. If they really wanted to push, it wouldn’t be that they can’t.
The question is: after the shorts cover and push it up, what happens once the covering is done? If OI still can’t turn back upward later, this move might just be an emotion-driven pulse. If you want to chase it, keep an eye on when OI turns positive.
7

·
--
$XPL This move is kind of interesting.
The 15m price dropped 0.93%. It doesn’t look like much, but the close broke directly below the lower band of the past nearly 20 5m candles. Volume surged to 1.69x, aggressive trade imbalance is -16%, and the buy/sell ratio is 0.72—selling pressure is pushing, not a low-volume, grinding bearish drift.
But what really made me take a second look is OI. In the 1h contracts, OI decreased by 0.14%, with notional falling by 819K; on the 15m, notional also dropped by 330K. The price is falling, yet OI is only contracting slightly—not the kind of structure where “price falls + OI spikes” and new shorts keep piling in. In other words, it looks more like downside with position reduction, not shorts stacking orders to smash it lower.
The abnormal quantile is 89.1%, whole pool #16, notional change #25. The signal has been consistently continued for several consecutive periods, so it’s relatively clean. 24h turnover is 33.68M, and the depth is sufficient—not a board that can be blown up with just tens of thousands.
I’ll keep an eye on how this structure plays out: if OI continues to shrink while price keeps bleeding lower, it could mean longs are gradually giving up. But if OI suddenly turns to increase and price accelerates downward, then it becomes a new round of short succession—and the nature of the move changes.
For now, I’ll just observe—no rush.
$XPL This move is kind of interesting.
The 15m price dropped 0.93%. It doesn’t look like much, but the close broke directly below the lower band of the past nearly 20 5m candles. Volume surged to 1.69x, aggressive trade imbalance is -16%, and the buy/sell ratio is 0.72—selling pressure is pushing, not a low-volume, grinding bearish drift.
But what really made me take a second look is OI. In the 1h contracts, OI decreased by 0.14%, with notional falling by 819K; on the 15m, notional also dropped by 330K. The price is falling, yet OI is only contracting slightly—not the kind of structure where “price falls + OI spikes” and new shorts keep piling in. In other words, it looks more like downside with position reduction, not shorts stacking orders to smash it lower.
The abnormal quantile is 89.1%, whole pool #16, notional change #25. The signal has been consistently continued for several consecutive periods, so it’s relatively clean. 24h turnover is 33.68M, and the depth is sufficient—not a board that can be blown up with just tens of thousands.
I’ll keep an eye on how this structure plays out: if OI continues to shrink while price keeps bleeding lower, it could mean longs are gradually giving up. But if OI suddenly turns to increase and price accelerates downward, then it becomes a new round of short succession—and the nature of the move changes.
For now, I’ll just observe—no rush.
The 15m price dropped 0.93%. It doesn’t look like much, but the close broke directly below the lower band of the past nearly 20 5m candles. Volume surged to 1.69x, aggressive trade imbalance is -16%, and the buy/sell ratio is 0.72—selling pressure is pushing, not a low-volume, grinding bearish drift.
But what really made me take a second look is OI. In the 1h contracts, OI decreased by 0.14%, with notional falling by 819K; on the 15m, notional also dropped by 330K. The price is falling, yet OI is only contracting slightly—not the kind of structure where “price falls + OI spikes” and new shorts keep piling in. In other words, it looks more like downside with position reduction, not shorts stacking orders to smash it lower.
The abnormal quantile is 89.1%, whole pool #16, notional change #25. The signal has been consistently continued for several consecutive periods, so it’s relatively clean. 24h turnover is 33.68M, and the depth is sufficient—not a board that can be blown up with just tens of thousands.
I’ll keep an eye on how this structure plays out: if OI continues to shrink while price keeps bleeding lower, it could mean longs are gradually giving up. But if OI suddenly turns to increase and price accelerates downward, then it becomes a new round of short succession—and the nature of the move changes.
For now, I’ll just observe—no rush.
3
·
--
$LSK There’s a bit of movement here.
Over 15m, it rallied 5.8%, with volume up to 2.54x, and the price directly pushed through the upper edge of nearly 20 of the 5m candles. What’s interesting is the OI—on the 15m contract, it’s still down 0.07%, and only the 1h chart has barely turned positive at +0.26%. Price is rising but open interest isn’t following—this structure looks more like shorts being forced to cover than fresh longs stepping in.
The active trades are also off by 1.2%, and the buy/sell ratio is 1.02. In plain terms, the bids have a slight edge, but it’s not to the point of going out of control.
Overall-pool abnormal ranking #16, nominal change #6, and 24h trading value is $1.35 billion. The position I fear most is chasing in to catch the tail end of a forced short cover—let OI actually catch up before saying anything. I’ll watch first.
$LSK There’s a bit of movement here.
Over 15m, it rallied 5.8%, with volume up to 2.54x, and the price directly pushed through the upper edge of nearly 20 of the 5m candles. What’s interesting is the OI—on the 15m contract, it’s still down 0.07%, and only the 1h chart has barely turned positive at +0.26%. Price is rising but open interest isn’t following—this structure looks more like shorts being forced to cover than fresh longs stepping in.
The active trades are also off by 1.2%, and the buy/sell ratio is 1.02. In plain terms, the bids have a slight edge, but it’s not to the point of going out of control.
Overall-pool abnormal ranking #16, nominal change #6, and 24h trading value is $1.35 billion. The position I fear most is chasing in to catch the tail end of a forced short cover—let OI actually catch up before saying anything. I’ll watch first.
Over 15m, it rallied 5.8%, with volume up to 2.54x, and the price directly pushed through the upper edge of nearly 20 of the 5m candles. What’s interesting is the OI—on the 15m contract, it’s still down 0.07%, and only the 1h chart has barely turned positive at +0.26%. Price is rising but open interest isn’t following—this structure looks more like shorts being forced to cover than fresh longs stepping in.
The active trades are also off by 1.2%, and the buy/sell ratio is 1.02. In plain terms, the bids have a slight edge, but it’s not to the point of going out of control.
Overall-pool abnormal ranking #16, nominal change #6, and 24h trading value is $1.35 billion. The position I fear most is chasing in to catch the tail end of a forced short cover—let OI actually catch up before saying anything. I’ll watch first.
19

·
--
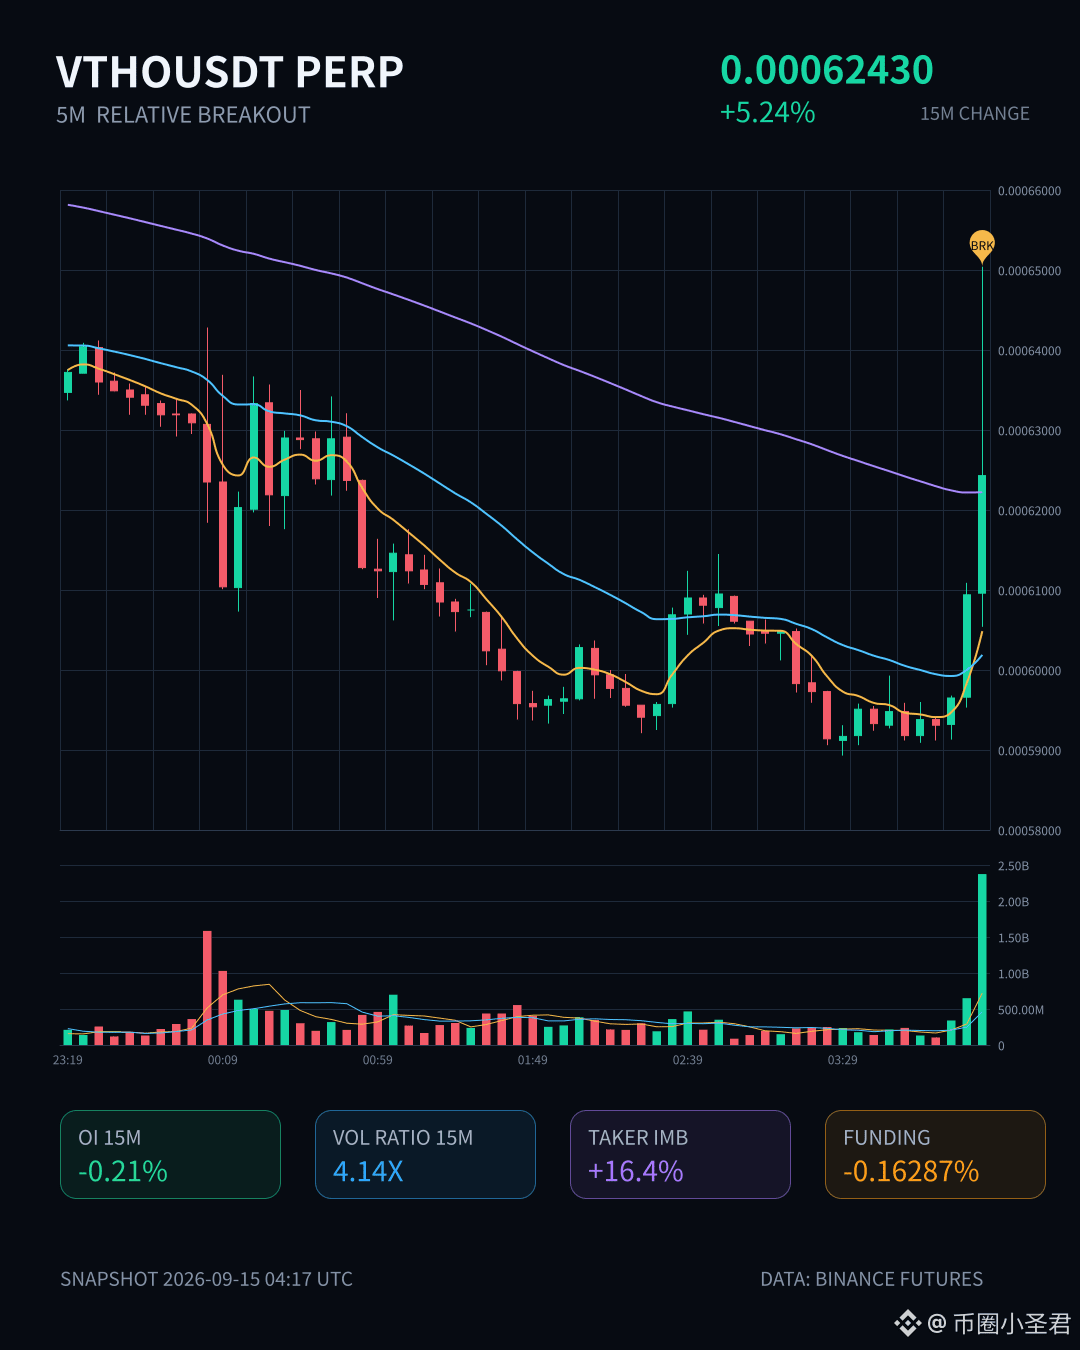
$VTHO There’s something going on here.
In 15m, it jumped straight up 5.24%. Volume reached 4.14x. The volatility “Z” hit 4.60. The closing price broke above the upper band of the last ~20 5m candles. The aggressive trade imbalance is 16.4%, the buy/sell ratio is 1.39, and the direction is somewhat biased.
But pay attention to OI—15m contracts are -0.21%, while only 1h is +0.47%, with notional changes around ±265K. Price is up, but OI isn’t following. This is a typical pattern of short covering or position unwinding; it’s not fresh longs rushing in at scale. The abnormal percentile is 93.3%, ranking #16 across the whole pool; notional change is #33. It’s already close to its own historical extreme range.
In the last 24h, turnover is 92.52M. Depth is sufficient, and multiple consecutive periods are continuing—this isn’t a one-off wick.
This kind of structure is either shorts getting forced liquidation but still not done yet, or a sign that the momentum from covering is starting to exhaust. Whether you chase it is up to you, but at this level I’d watch whether OI starts turning positive—if later OI rises and price holds, that’s when there are actually buyers taking over; if OI keeps dropping, then this move is just shorts scaring themselves.
$VTHO There’s something going on here.
In 15m, it jumped straight up 5.24%. Volume reached 4.14x. The volatility “Z” hit 4.60. The closing price broke above the upper band of the last ~20 5m candles. The aggressive trade imbalance is 16.4%, the buy/sell ratio is 1.39, and the direction is somewhat biased.
But pay attention to OI—15m contracts are -0.21%, while only 1h is +0.47%, with notional changes around ±265K. Price is up, but OI isn’t following. This is a typical pattern of short covering or position unwinding; it’s not fresh longs rushing in at scale. The abnormal percentile is 93.3%, ranking #16 across the whole pool; notional change is #33. It’s already close to its own historical extreme range.
In the last 24h, turnover is 92.52M. Depth is sufficient, and multiple consecutive periods are continuing—this isn’t a one-off wick.
This kind of structure is either shorts getting forced liquidation but still not done yet, or a sign that the momentum from covering is starting to exhaust. Whether you chase it is up to you, but at this level I’d watch whether OI starts turning positive—if later OI rises and price holds, that’s when there are actually buyers taking over; if OI keeps dropping, then this move is just shorts scaring themselves.
In 15m, it jumped straight up 5.24%. Volume reached 4.14x. The volatility “Z” hit 4.60. The closing price broke above the upper band of the last ~20 5m candles. The aggressive trade imbalance is 16.4%, the buy/sell ratio is 1.39, and the direction is somewhat biased.
But pay attention to OI—15m contracts are -0.21%, while only 1h is +0.47%, with notional changes around ±265K. Price is up, but OI isn’t following. This is a typical pattern of short covering or position unwinding; it’s not fresh longs rushing in at scale. The abnormal percentile is 93.3%, ranking #16 across the whole pool; notional change is #33. It’s already close to its own historical extreme range.
In the last 24h, turnover is 92.52M. Depth is sufficient, and multiple consecutive periods are continuing—this isn’t a one-off wick.
This kind of structure is either shorts getting forced liquidation but still not done yet, or a sign that the momentum from covering is starting to exhaust. Whether you chase it is up to you, but at this level I’d watch whether OI starts turning positive—if later OI rises and price holds, that’s when there are actually buyers taking over; if OI keeps dropping, then this move is just shorts scaring themselves.
74
·
--
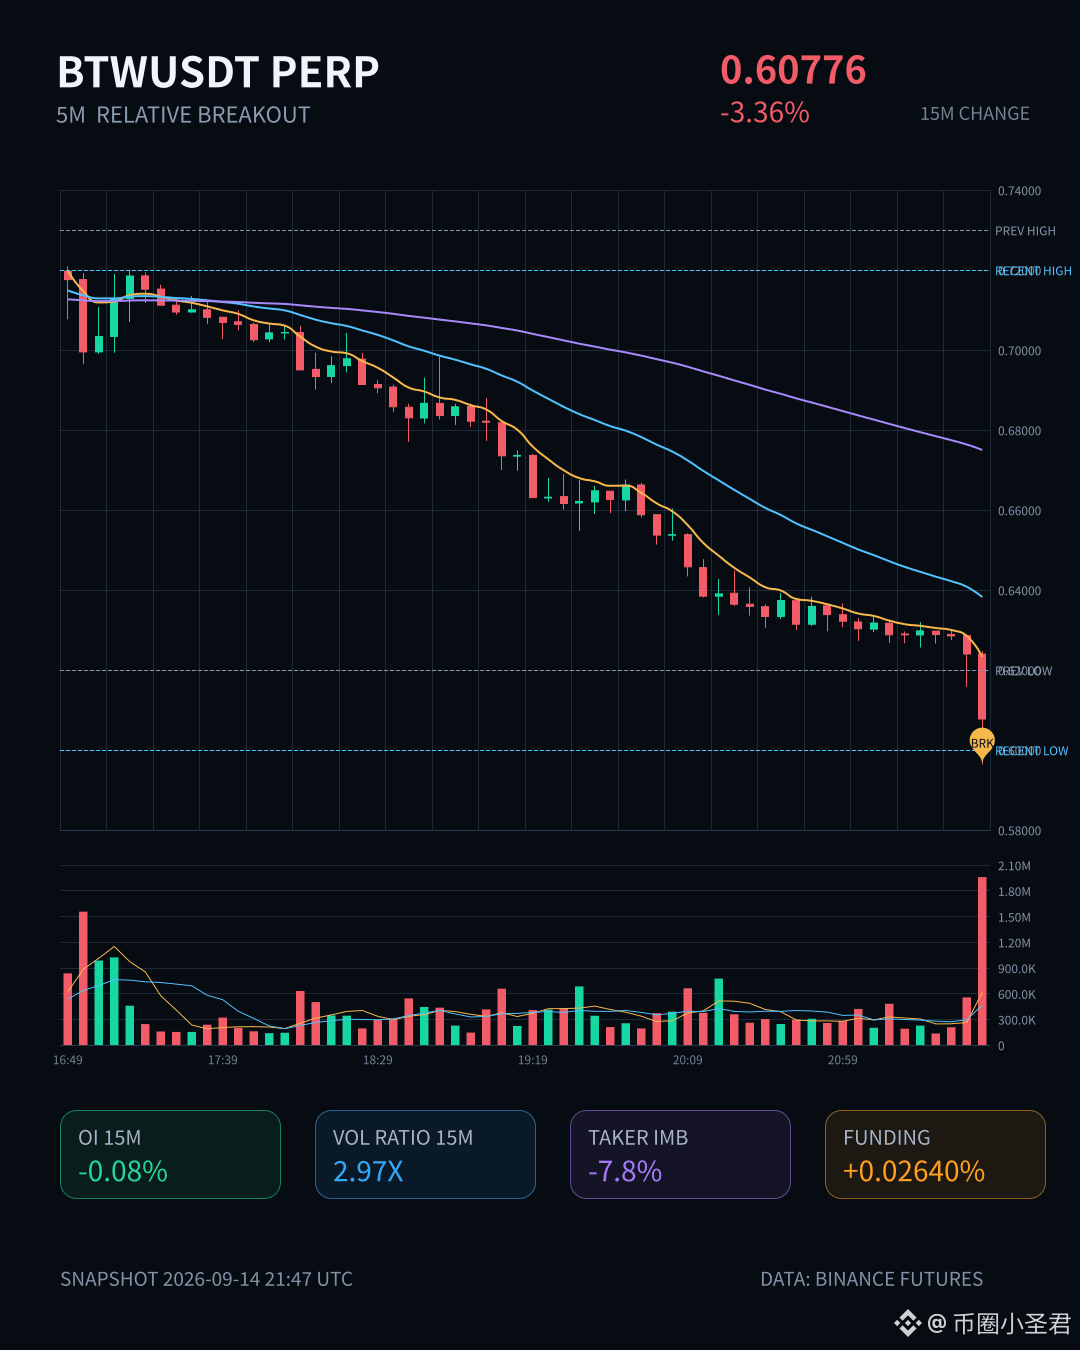
$BTW This drop came a bit fast—on the 15m timeframe it directly plunged 3.36%. Volume surged to 2.97x, and volatility (Z) hit 3.58. The closing price broke below the lower band of the last 20 5m K-lines. Passive/active difference was -7.8%, the buy-sell ratio was 0.85, and sell pressure was clearly evident.
But interestingly, on the OI side: the 15m contract was only -0.08%, with a nominal change of -3.27M; the 1h timeframe was also -0.06%/-3.81M. With price falling and OI also dropping, this looks more like long de-leveraging, stop-losses, or position reduction—not large-scale new short entries. The abnormal percentile is 86.5%, with the abnormal in the whole pool ranking #16 and nominal change ranking #3, meaning this signal is relatively early within the pool.
In the past 24h, trading value was 193.51M, and the order book isn’t lacking in depth. What remains to be seen now is whether, after this de-leveraging wave, price can hold above the lower edge of the range. If it continues to break down, then it could be a different story.
$BTW This drop came a bit fast—on the 15m timeframe it directly plunged 3.36%. Volume surged to 2.97x, and volatility (Z) hit 3.58. The closing price broke below the lower band of the last 20 5m K-lines. Passive/active difference was -7.8%, the buy-sell ratio was 0.85, and sell pressure was clearly evident.
But interestingly, on the OI side: the 15m contract was only -0.08%, with a nominal change of -3.27M; the 1h timeframe was also -0.06%/-3.81M. With price falling and OI also dropping, this looks more like long de-leveraging, stop-losses, or position reduction—not large-scale new short entries. The abnormal percentile is 86.5%, with the abnormal in the whole pool ranking #16 and nominal change ranking #3, meaning this signal is relatively early within the pool.
In the past 24h, trading value was 193.51M, and the order book isn’t lacking in depth. What remains to be seen now is whether, after this de-leveraging wave, price can hold above the lower edge of the range. If it continues to break down, then it could be a different story.
But interestingly, on the OI side: the 15m contract was only -0.08%, with a nominal change of -3.27M; the 1h timeframe was also -0.06%/-3.81M. With price falling and OI also dropping, this looks more like long de-leveraging, stop-losses, or position reduction—not large-scale new short entries. The abnormal percentile is 86.5%, with the abnormal in the whole pool ranking #16 and nominal change ranking #3, meaning this signal is relatively early within the pool.
In the past 24h, trading value was 193.51M, and the order book isn’t lacking in depth. What remains to be seen now is whether, after this de-leveraging wave, price can hold above the lower edge of the range. If it continues to break down, then it could be a different story.
12
·
--
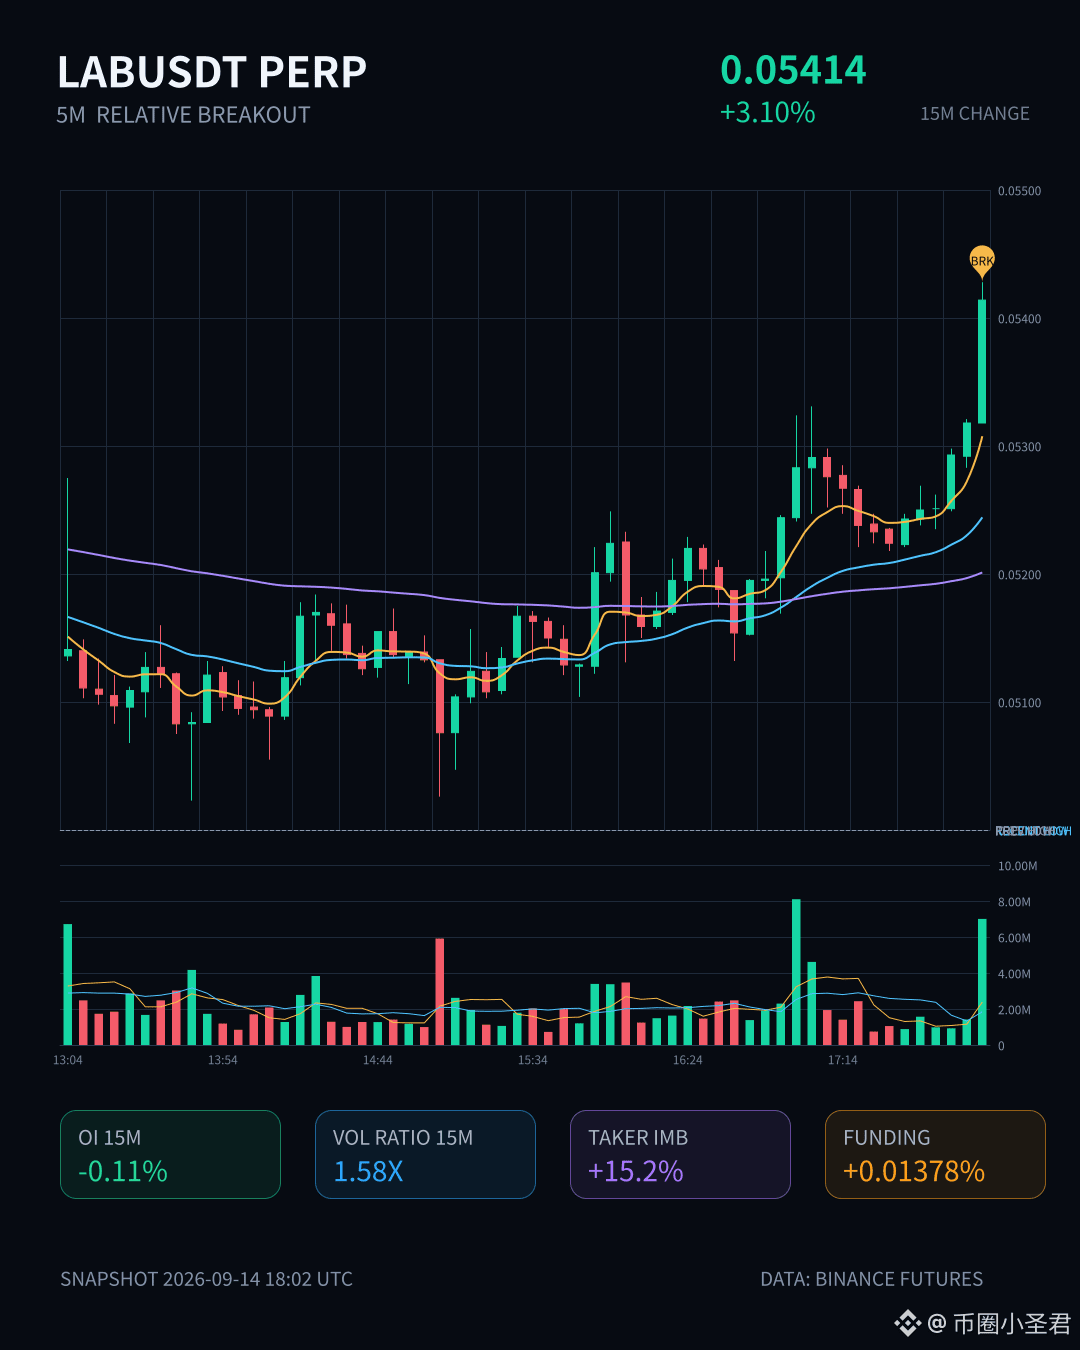
$LAB This move is pretty decisive—15m directly did 3.10%, and volume kept up. The 1.58x isn’t the kind of feinting shot.
What’s interesting is that OI is falling. For the 15m contract it’s -0.11%, and for the 1h it’s also -0.17%. As price moves up, the position size actually decreases. This kind of structure usually has two possibilities: either shorts are being forced to close, or the previous longs are using the rebound to slip out.
Judging from the aggressive trade delta of 15.2% and the buy/sell ratio of 1.36, the bids are indeed pushing. The close also broke above the highs of the last ~20 5m candles—the near-term boundary has been torn open.
But don’t rush to call it a trend. The OI abnormal percentile of 91.7% suggests this is quite conspicuous within the whole pool—abnormal #11, notional change #16. Yet overall positions didn’t increase, which means it looks more like a pulse driven by position cover than the kind of conviction that comes from new capital building a position.
24h trading value is 51.77M; the market cap/order book isn’t particularly thick. With this kind of volume level, a 3% move can easily get slammed back by the opposite side. My take is: the breakout is real, but the driving force is position logic rather than incremental logic. If you chase, be careful—wait for a pullback and confirmation.
$LAB This move is pretty decisive—15m directly did 3.10%, and volume kept up. The 1.58x isn’t the kind of feinting shot.
What’s interesting is that OI is falling. For the 15m contract it’s -0.11%, and for the 1h it’s also -0.17%. As price moves up, the position size actually decreases. This kind of structure usually has two possibilities: either shorts are being forced to close, or the previous longs are using the rebound to slip out.
Judging from the aggressive trade delta of 15.2% and the buy/sell ratio of 1.36, the bids are indeed pushing. The close also broke above the highs of the last ~20 5m candles—the near-term boundary has been torn open.
But don’t rush to call it a trend. The OI abnormal percentile of 91.7% suggests this is quite conspicuous within the whole pool—abnormal #11, notional change #16. Yet overall positions didn’t increase, which means it looks more like a pulse driven by position cover than the kind of conviction that comes from new capital building a position.
24h trading value is 51.77M; the market cap/order book isn’t particularly thick. With this kind of volume level, a 3% move can easily get slammed back by the opposite side. My take is: the breakout is real, but the driving force is position logic rather than incremental logic. If you chase, be careful—wait for a pullback and confirmation.
What’s interesting is that OI is falling. For the 15m contract it’s -0.11%, and for the 1h it’s also -0.17%. As price moves up, the position size actually decreases. This kind of structure usually has two possibilities: either shorts are being forced to close, or the previous longs are using the rebound to slip out.
Judging from the aggressive trade delta of 15.2% and the buy/sell ratio of 1.36, the bids are indeed pushing. The close also broke above the highs of the last ~20 5m candles—the near-term boundary has been torn open.
But don’t rush to call it a trend. The OI abnormal percentile of 91.7% suggests this is quite conspicuous within the whole pool—abnormal #11, notional change #16. Yet overall positions didn’t increase, which means it looks more like a pulse driven by position cover than the kind of conviction that comes from new capital building a position.
24h trading value is 51.77M; the market cap/order book isn’t particularly thick. With this kind of volume level, a 3% move can easily get slammed back by the opposite side. My take is: the breakout is real, but the driving force is position logic rather than incremental logic. If you chase, be careful—wait for a pullback and confirmation.
23

$MARSCOIN: Does the breakdown get confirmation?🚪 $MARSCOIN: the system is marking a BREAKDOWN REDUCTION. I don’t consider a level break-through as a real break until volume and the retest confirm it. Market: 0.09056 · 24h -12.91% · volume ~74.7M USDT · 994,708 transactions.
Candle volume / 20 candles: x2.47 · ATR14 5.16% · technical bias SHORT 67/100. Closest validation level: support 0.09071 · resistance 0.09963.
If the retest holds the level that was just broken + momentum without reversing, it increases the probability of continuation; if the retest fails, reduce the bias immediately. The technical layers being selected are based on the current regime:
$MARSCOIN: Does the breakdown get confirmation?
🚪 $MARSCOIN : the system is marking a BREAKDOWN REDUCTION. I don’t consider a level break-through as a real break until volume and the retest confirm it. Market: 0.09056 · 24h -12.91% · volume ~74.7M USDT · 994,708 transactions.
Candle volume / 20 candles: x2.47 · ATR14 5.16% · technical bias SHORT 67/100. Closest validation level: support 0.09071 · resistance 0.09963.
If the retest holds the level that was just broken + momentum without reversing, it increases the probability of continuation; if the retest fails, reduce the bias immediately. The technical layers being selected are based on the current regime:
Candle volume / 20 candles: x2.47 · ATR14 5.16% · technical bias SHORT 67/100. Closest validation level: support 0.09071 · resistance 0.09963.
If the retest holds the level that was just broken + momentum without reversing, it increases the probability of continuation; if the retest fails, reduce the bias immediately. The technical layers being selected are based on the current regime:
42
$MARSCOIN · TREND DOWN: real breakout or just a 24h fluctuation?🗣️ $MARSCOIN is showing an abnormal level of social discussion on Binance Web3. Current sentiment: Positive. Market: 0.08994 · 24h -14.97% · volume ~74.9M USDT · 1,001,116 trades.
Social context: MarsCoin Collateral Launch, Price Analysis Focus, Community Growth Predictions. Social attention may drive price, but it could also be the crowd arriving late.
Confirm: Breaking 0.08352 with an increased mass will make the scenario further decline more credible.
$MARSCOIN · TREND DOWN: real breakout or just a 24h fluctuation?
🗣️ $MARSCOIN is showing an abnormal level of social discussion on Binance Web3. Current sentiment: Positive. Market: 0.08994 · 24h -14.97% · volume ~74.9M USDT · 1,001,116 trades.
Social context: MarsCoin Collateral Launch, Price Analysis Focus, Community Growth Predictions. Social attention may drive price, but it could also be the crowd arriving late.
Confirm: Breaking 0.08352 with an increased mass will make the scenario further decline more credible.
Social context: MarsCoin Collateral Launch, Price Analysis Focus, Community Growth Predictions. Social attention may drive price, but it could also be the crowd arriving late.
Confirm: Breaking 0.08352 with an increased mass will make the scenario further decline more credible.
101
·
--
$FLOCK This 15m move pulled a bit too fast—up 7.53%, with volume directly surging to 11.66x.
The key isn’t the rise itself; it’s the OI moving up in sync—15m +3.82%, 1h +3.35%. The notional change is all above 500k U. There’s a strong flavor of new leveraged longs entering; it’s not just a spot-fueled pump.
OI is at the 97.8th percentile—ranked #6 across the whole pool, and #16 in notional change. This level is close to historical extreme ranges. Price just closed above the upper edge of the last 20 5m candles. Passive turnover is down 8.6%, buy/sell ratio is 1.19—bids are still pushing.
In the past 24h, turnover is a little over 70M; depth is keeping up as well.
This kind of structure is either fuel for acceleration, or the starting point of a cascade after leverage gets too crowded. Keep an eye on OI: if price stalls while OI is still climbing, that’s the signal.
$FLOCK This 15m move pulled a bit too fast—up 7.53%, with volume directly surging to 11.66x.
The key isn’t the rise itself; it’s the OI moving up in sync—15m +3.82%, 1h +3.35%. The notional change is all above 500k U. There’s a strong flavor of new leveraged longs entering; it’s not just a spot-fueled pump.
OI is at the 97.8th percentile—ranked #6 across the whole pool, and #16 in notional change. This level is close to historical extreme ranges. Price just closed above the upper edge of the last 20 5m candles. Passive turnover is down 8.6%, buy/sell ratio is 1.19—bids are still pushing.
In the past 24h, turnover is a little over 70M; depth is keeping up as well.
This kind of structure is either fuel for acceleration, or the starting point of a cascade after leverage gets too crowded. Keep an eye on OI: if price stalls while OI is still climbing, that’s the signal.
The key isn’t the rise itself; it’s the OI moving up in sync—15m +3.82%, 1h +3.35%. The notional change is all above 500k U. There’s a strong flavor of new leveraged longs entering; it’s not just a spot-fueled pump.
OI is at the 97.8th percentile—ranked #6 across the whole pool, and #16 in notional change. This level is close to historical extreme ranges. Price just closed above the upper edge of the last 20 5m candles. Passive turnover is down 8.6%, buy/sell ratio is 1.19—bids are still pushing.
In the past 24h, turnover is a little over 70M; depth is keeping up as well.
This kind of structure is either fuel for acceleration, or the starting point of a cascade after leverage gets too crowded. Keep an eye on OI: if price stalls while OI is still climbing, that’s the signal.
7
·
--
$PONS This 15-minute drop isn’t that big—down just -2.24%—but the order-book reading feels a bit awkward. Volume was pulled up to 2.33 times the normal level, yet the price simply broke down through the lower edge of the previous 20 5-minute bars. Aggressive volume is down -45.6%, and the buy/sell ratio is 0.37—clearly the one driving with aggressive selling is pushing it.
What’s even more interesting is the OI (open interest): the 15m contract is up +1.45%, and the 1h is up +5.64%. In nominal terms, there’s even an additional 571K coming in within the hour. Price is falling while positions are increasing—this doesn’t look like just longs getting wiped out in liquidation; it feels more like new shorts are building positions in batches. The overall nominal change ranks #16 across the whole pool, and an outlier percentile of 58.5% isn’t extremely abnormal, but the depth check confirms it’s significant enough.
Keep watching whether the short side continues adding or starts covering. After the lower boundary breaks, if it can’t get back above it, the liquidity below likely still needs to be swept again.
$PONS This 15-minute drop isn’t that big—down just -2.24%—but the order-book reading feels a bit awkward. Volume was pulled up to 2.33 times the normal level, yet the price simply broke down through the lower edge of the previous 20 5-minute bars. Aggressive volume is down -45.6%, and the buy/sell ratio is 0.37—clearly the one driving with aggressive selling is pushing it.
What’s even more interesting is the OI (open interest): the 15m contract is up +1.45%, and the 1h is up +5.64%. In nominal terms, there’s even an additional 571K coming in within the hour. Price is falling while positions are increasing—this doesn’t look like just longs getting wiped out in liquidation; it feels more like new shorts are building positions in batches. The overall nominal change ranks #16 across the whole pool, and an outlier percentile of 58.5% isn’t extremely abnormal, but the depth check confirms it’s significant enough.
Keep watching whether the short side continues adding or starts covering. After the lower boundary breaks, if it can’t get back above it, the liquidity below likely still needs to be swept again.
What’s even more interesting is the OI (open interest): the 15m contract is up +1.45%, and the 1h is up +5.64%. In nominal terms, there’s even an additional 571K coming in within the hour. Price is falling while positions are increasing—this doesn’t look like just longs getting wiped out in liquidation; it feels more like new shorts are building positions in batches. The overall nominal change ranks #16 across the whole pool, and an outlier percentile of 58.5% isn’t extremely abnormal, but the depth check confirms it’s significant enough.
Keep watching whether the short side continues adding or starts covering. After the lower boundary breaks, if it can’t get back above it, the liquidity below likely still needs to be swept again.
302
·
--
$ARK This dip has something behind it. In the 15m chart it’s down 2.61%, which isn’t huge, but both OI metrics are falling—combined with a成交量 (trading volume) of 1.68×. This doesn’t feel like fresh shorts entering; it looks more like the longs can’t hold on and are pulling back.
主动成交差 (aggressive order imbalance) is -22.1%, the buy/sell ratio is 0.64, and selling pressure clearly leans heavily to one side—the price is directly smashed through the lower band of the most recent ~20 5m candles.
The OI异常分位 (OI anomaly percentile) is 86.5%, ranking #16 across the whole pool, meaning this move ranks fairly high even in the broader market.
For a pool with 24h turnover of 126M, the nominal change isn’t that big, but the direction is very clean. A deleveraging-style selloff usually isn’t just a one-off trade—watch whether OI continues to contract, or if someone steps in to take it back.
$ARK This dip has something behind it. In the 15m chart it’s down 2.61%, which isn’t huge, but both OI metrics are falling—combined with a成交量 (trading volume) of 1.68×. This doesn’t feel like fresh shorts entering; it looks more like the longs can’t hold on and are pulling back.
主动成交差 (aggressive order imbalance) is -22.1%, the buy/sell ratio is 0.64, and selling pressure clearly leans heavily to one side—the price is directly smashed through the lower band of the most recent ~20 5m candles.
The OI异常分位 (OI anomaly percentile) is 86.5%, ranking #16 across the whole pool, meaning this move ranks fairly high even in the broader market.
For a pool with 24h turnover of 126M, the nominal change isn’t that big, but the direction is very clean. A deleveraging-style selloff usually isn’t just a one-off trade—watch whether OI continues to contract, or if someone steps in to take it back.
主动成交差 (aggressive order imbalance) is -22.1%, the buy/sell ratio is 0.64, and selling pressure clearly leans heavily to one side—the price is directly smashed through the lower band of the most recent ~20 5m candles.
The OI异常分位 (OI anomaly percentile) is 86.5%, ranking #16 across the whole pool, meaning this move ranks fairly high even in the broader market.
For a pool with 24h turnover of 126M, the nominal change isn’t that big, but the direction is very clean. A deleveraging-style selloff usually isn’t just a one-off trade—watch whether OI continues to contract, or if someone steps in to take it back.

·
--
** " Why Is It Still at 77,275$? What's Behind This Silence?"Chainlink (LINKUSDT) is trending right now!
Rank: #16
** I think that in recent days, it looks as if ' has almost frozen at the 77,275$ level, which has worried many investors. Indeed, in just the last 24 hours it showed only a 0.14% change. I believe this indicates two things: either the market is genuinely balanced and will hold this level, or something is going wrong and this is just a blink. Personally, consolidation at this level is more than normal. In 's similar stagnation, it is down by 0.59%, at the 2,506.83$ level. Both coins appear to have found strong support, but what lies behind this silence? When we look at daily trading volumes, we see that ' has over $12.5 billion in trading volume, and ' has over $9 billion. These figures show that investors are still active in the market, but maybe they are following a wait-and-see strategy. My contrarian view is that this consolidation period actually offers a buying opportunity. Market players are expecting a big move, and with the energy building up, this could lead to a sudden price jump. Do you think ' will break above 80,000$ or will this consolidation continue? **
** " Why Is It Still at 77,275$? What's Behind This Silence?"
Chainlink (LINKUSDT) is trending right now!
Rank: #16
** I think that in recent days, it looks as if ' has almost frozen at the 77,275$ level, which has worried many investors. Indeed, in just the last 24 hours it showed only a 0.14% change. I believe this indicates two things: either the market is genuinely balanced and will hold this level, or something is going wrong and this is just a blink. Personally, consolidation at this level is more than normal. In 's similar stagnation, it is down by 0.59%, at the 2,506.83$ level. Both coins appear to have found strong support, but what lies behind this silence? When we look at daily trading volumes, we see that ' has over $12.5 billion in trading volume, and ' has over $9 billion. These figures show that investors are still active in the market, but maybe they are following a wait-and-see strategy. My contrarian view is that this consolidation period actually offers a buying opportunity. Market players are expecting a big move, and with the energy building up, this could lead to a sudden price jump. Do you think ' will break above 80,000$ or will this consolidation continue? **
Rank: #16
** I think that in recent days, it looks as if ' has almost frozen at the 77,275$ level, which has worried many investors. Indeed, in just the last 24 hours it showed only a 0.14% change. I believe this indicates two things: either the market is genuinely balanced and will hold this level, or something is going wrong and this is just a blink. Personally, consolidation at this level is more than normal. In 's similar stagnation, it is down by 0.59%, at the 2,506.83$ level. Both coins appear to have found strong support, but what lies behind this silence? When we look at daily trading volumes, we see that ' has over $12.5 billion in trading volume, and ' has over $9 billion. These figures show that investors are still active in the market, but maybe they are following a wait-and-see strategy. My contrarian view is that this consolidation period actually offers a buying opportunity. Market players are expecting a big move, and with the energy building up, this could lead to a sudden price jump. Do you think ' will break above 80,000$ or will this consolidation continue? **
28
·
--
$REZ This dip isn’t that deep, but the structure is pretty honest.
On the 15m chart: price -1.48%, volume 1.6x; the aggressive buy/sell ratio dropped to 0.59, and aggressive trades are down -25.6%. The drawdown is mild, but the sellers are clearly stepping in on the aggressive side.
The key is OI: 15m -1.86%, 1h -1.32%. On both ends (nominally), it’s contracting, and it’s been sustained across several consecutive periods. Price falling while OI also drops is the classic multi-head deleveraging pattern—not new shorts entering to press, but old longs pulling back, stopping out, and getting liquidated. The abnormal percentile is 87.5%, and in the whole pool it’s #16, indicating this isn’t just one unit wobbling.
Over 24h, trading value is still 74M, so liquidity isn’t bad. But at this position, when longs contract like this, there’s often more follow-through. I won’t take a trade—I'll wait for OI to stabilize before reassessing.
$REZ This dip isn’t that deep, but the structure is pretty honest.
On the 15m chart: price -1.48%, volume 1.6x; the aggressive buy/sell ratio dropped to 0.59, and aggressive trades are down -25.6%. The drawdown is mild, but the sellers are clearly stepping in on the aggressive side.
The key is OI: 15m -1.86%, 1h -1.32%. On both ends (nominally), it’s contracting, and it’s been sustained across several consecutive periods. Price falling while OI also drops is the classic multi-head deleveraging pattern—not new shorts entering to press, but old longs pulling back, stopping out, and getting liquidated. The abnormal percentile is 87.5%, and in the whole pool it’s #16, indicating this isn’t just one unit wobbling.
Over 24h, trading value is still 74M, so liquidity isn’t bad. But at this position, when longs contract like this, there’s often more follow-through. I won’t take a trade—I'll wait for OI to stabilize before reassessing.
On the 15m chart: price -1.48%, volume 1.6x; the aggressive buy/sell ratio dropped to 0.59, and aggressive trades are down -25.6%. The drawdown is mild, but the sellers are clearly stepping in on the aggressive side.
The key is OI: 15m -1.86%, 1h -1.32%. On both ends (nominally), it’s contracting, and it’s been sustained across several consecutive periods. Price falling while OI also drops is the classic multi-head deleveraging pattern—not new shorts entering to press, but old longs pulling back, stopping out, and getting liquidated. The abnormal percentile is 87.5%, and in the whole pool it’s #16, indicating this isn’t just one unit wobbling.
Over 24h, trading value is still 74M, so liquidity isn’t bad. But at this position, when longs contract like this, there’s often more follow-through. I won’t take a trade—I'll wait for OI to stabilize before reassessing.
12

·
--
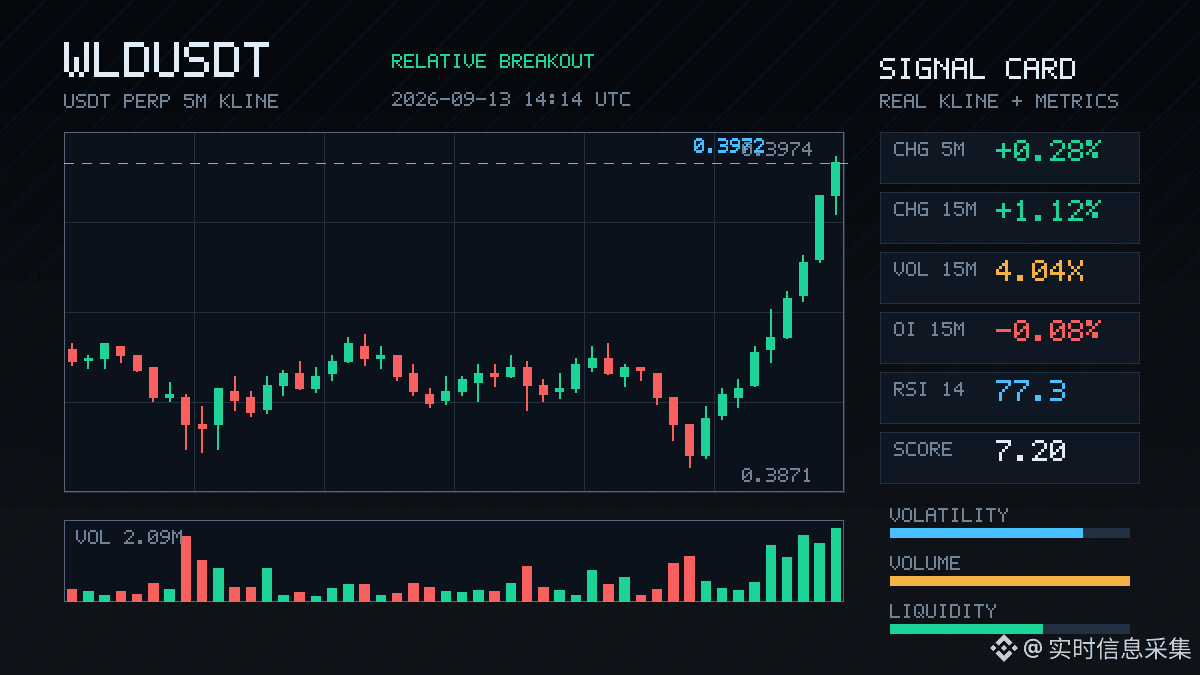
$WLD This 15m has a bit of something.
Volume was pushed directly to 4x; the price was lifted by 1.12%. The closing price broke above the upper boundary of nearly 20 consecutive 5m candles. Active buy-side order flow differential is +8.8%, and the buy/sell ratio is 1.19—the buying force is genuinely stronger and压过s the selling side.
But interestingly, the OI: the 15m contract is down slightly by 0.08%, and only up by 0.10% in 1h. The notional change is just around one million U. Price is up, but OI isn’t following—typical of short covering or position unwinding, not a move driven by fresh longs entering.
The OI anomaly percentile is 97.6%, rank #16 in the whole pool, and notional change rank #15. Across several consecutive intervals, it has been rolling within the abnormal range. In other words, this move isn’t a sudden burst of volume; it’s more like positions that were held/accumulated across multiple cycles concentrated and released at this level.
Those 20 highs on the 5m upper boundary were breached. Total成交额 over 24h is just over 80M—nothing heavy in the pool.
My personal take on this structure: shorts are paying back debts, not starting a new story. How far upward it can go depends on whether new long buyers are willing to take the baton at this level. Right now there are buys and there’s volume, but OI hasn’t risen—which suggests the batch of active buyers didn’t open new contracts themselves; they’re likely either spot-based or directly taking orders.
For now, just watch. The breakout is real, but there’s a lack of confirmation from new positioning.
$WLD This 15m has a bit of something.
Volume was pushed directly to 4x; the price was lifted by 1.12%. The closing price broke above the upper boundary of nearly 20 consecutive 5m candles. Active buy-side order flow differential is +8.8%, and the buy/sell ratio is 1.19—the buying force is genuinely stronger and压过s the selling side.
But interestingly, the OI: the 15m contract is down slightly by 0.08%, and only up by 0.10% in 1h. The notional change is just around one million U. Price is up, but OI isn’t following—typical of short covering or position unwinding, not a move driven by fresh longs entering.
The OI anomaly percentile is 97.6%, rank #16 in the whole pool, and notional change rank #15. Across several consecutive intervals, it has been rolling within the abnormal range. In other words, this move isn’t a sudden burst of volume; it’s more like positions that were held/accumulated across multiple cycles concentrated and released at this level.
Those 20 highs on the 5m upper boundary were breached. Total成交额 over 24h is just over 80M—nothing heavy in the pool.
My personal take on this structure: shorts are paying back debts, not starting a new story. How far upward it can go depends on whether new long buyers are willing to take the baton at this level. Right now there are buys and there’s volume, but OI hasn’t risen—which suggests the batch of active buyers didn’t open new contracts themselves; they’re likely either spot-based or directly taking orders.
For now, just watch. The breakout is real, but there’s a lack of confirmation from new positioning.
Volume was pushed directly to 4x; the price was lifted by 1.12%. The closing price broke above the upper boundary of nearly 20 consecutive 5m candles. Active buy-side order flow differential is +8.8%, and the buy/sell ratio is 1.19—the buying force is genuinely stronger and压过s the selling side.
But interestingly, the OI: the 15m contract is down slightly by 0.08%, and only up by 0.10% in 1h. The notional change is just around one million U. Price is up, but OI isn’t following—typical of short covering or position unwinding, not a move driven by fresh longs entering.
The OI anomaly percentile is 97.6%, rank #16 in the whole pool, and notional change rank #15. Across several consecutive intervals, it has been rolling within the abnormal range. In other words, this move isn’t a sudden burst of volume; it’s more like positions that were held/accumulated across multiple cycles concentrated and released at this level.
Those 20 highs on the 5m upper boundary were breached. Total成交额 over 24h is just over 80M—nothing heavy in the pool.
My personal take on this structure: shorts are paying back debts, not starting a new story. How far upward it can go depends on whether new long buyers are willing to take the baton at this level. Right now there are buys and there’s volume, but OI hasn’t risen—which suggests the batch of active buyers didn’t open new contracts themselves; they’re likely either spot-based or directly taking orders.
For now, just watch. The breakout is real, but there’s a lack of confirmation from new positioning.
62

·
--
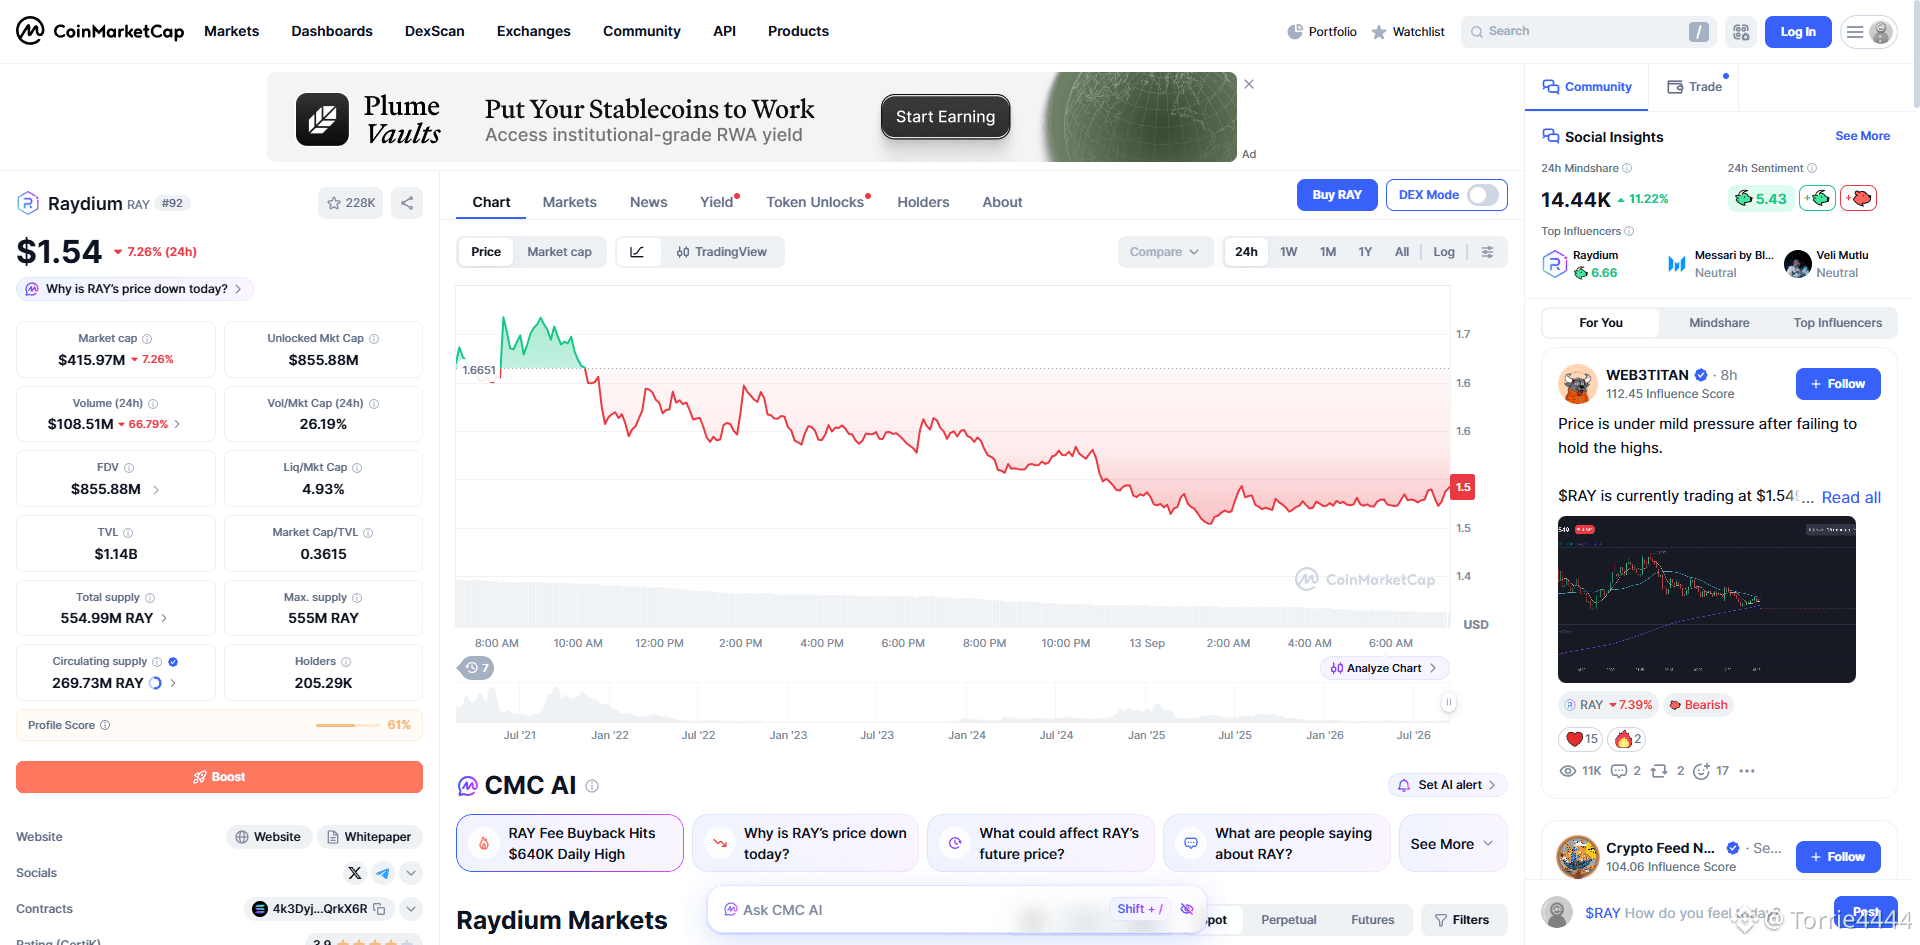
Today I saw on the leaderboard that Raydium ($RAY) quietly climbed onto CoinMarketCap’s Trending list, reaching position #16 . As an established Solana ecosystem project, the spot market’s trading buzz has definitely been picking up lately—how long do you think this wave of attention can last?👀 #Raydium #DeFi
Today I saw on the leaderboard that Raydium ($RAY ) quietly climbed onto CoinMarketCap’s Trending list, reaching position #16 . As an established Solana ecosystem project, the spot market’s trading buzz has definitely been picking up lately—how long do you think this wave of attention can last?👀 #Raydium #DeFi
93
·
--
$I’m here, damn it. This move is a bit interesting.
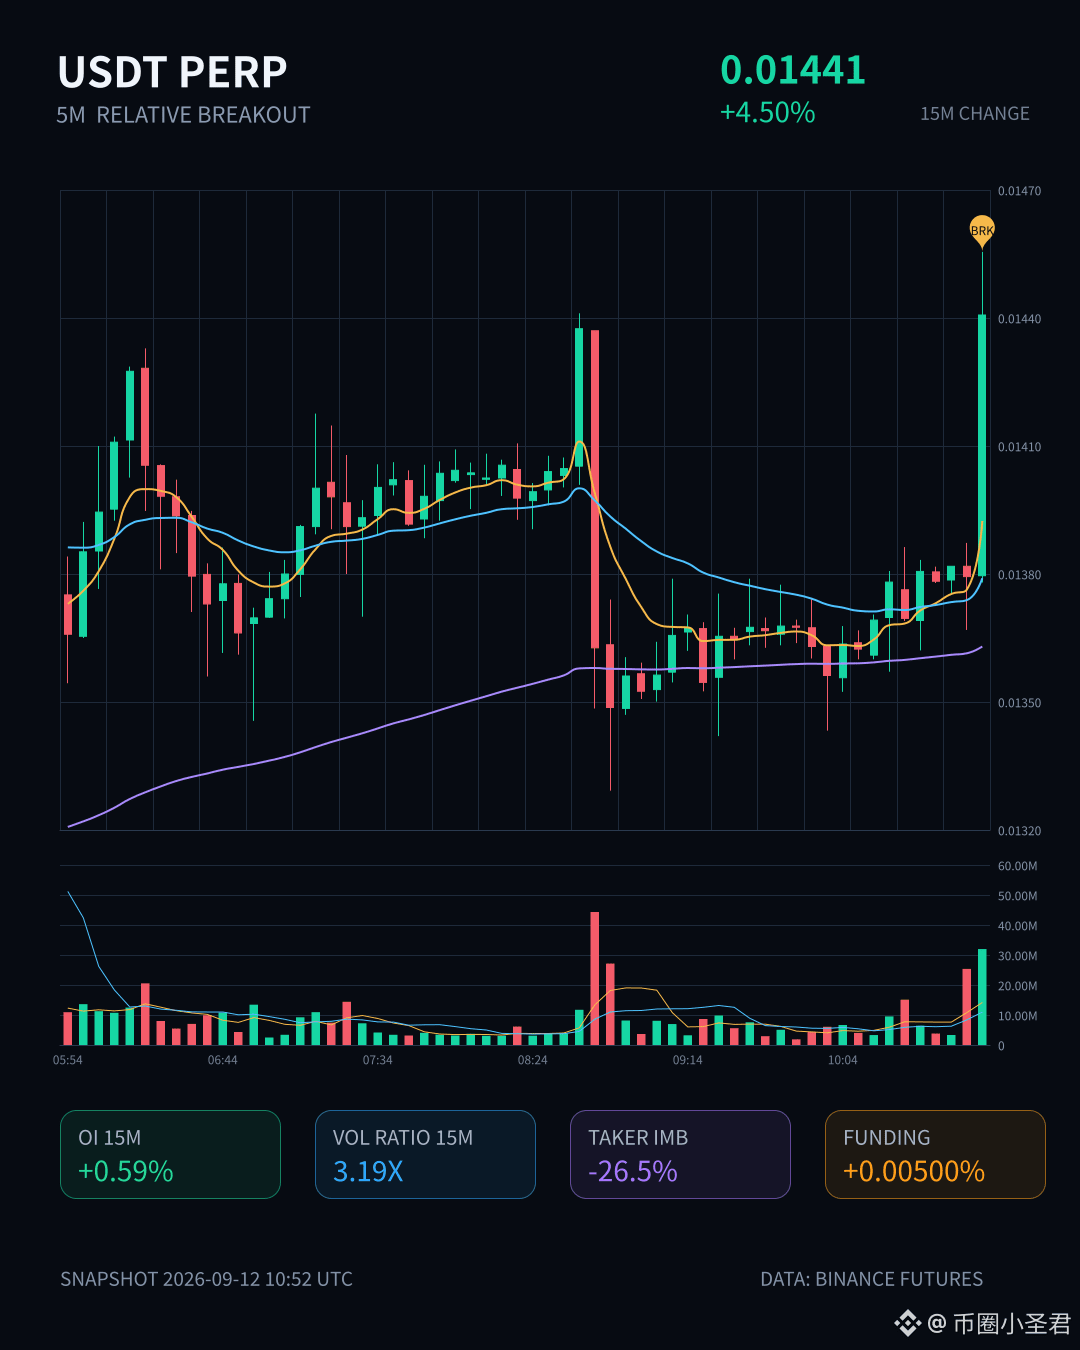
In 15m, it directly did +4.5%. Volume is 3.19x, the Z-score is 3.04, and the closing price is above the upper bound of nearly 20 consecutive 5m candles—this is a standard relative breakout, not that kind of slow, sideways rebound fake-out.
But there’s a detail to watch: the aggressive trade imbalance is down -26.5%, and the buy/sell ratio is 0.58. When the price is being pushed up, the aggressive buy side is actually leaning toward the sell direction—this suggests that part of this rally is being driven by passive orders getting filled, not purely by active longs sweeping.
OI is +0.59% on 15m and +1.49% on 1h. Nominal changes are not huge, but the percentile spikes to 94.8%, full pool #4. Positions are increasing: leveraged long exposure is adding too, but the size is still relatively restrained.
In 24h, turnover is 33.62M, and full pool nominal change is #16. It’s not a huge pool—at this depth, once a little money comes in, volatility is easy to trigger. The volume-price coordination is real; both OI and price moving in the same direction is real too. The structure is healthier than just a pure pump.
The problem is the buy/sell ratio. Price is hugging the upper edge of the range. Near the previous high, if the aggressive buys don’t keep up, it can easily turn into a one-and-done spike. Either the next 15m candle flips the aggressive imbalance positive, or you wait for a pullback to confirm.
Just watch for now. No rush to act.
$I’m here, damn it. This move is a bit interesting.
In 15m, it directly did +4.5%. Volume is 3.19x, the Z-score is 3.04, and the closing price is above the upper bound of nearly 20 consecutive 5m candles—this is a standard relative breakout, not that kind of slow, sideways rebound fake-out.
But there’s a detail to watch: the aggressive trade imbalance is down -26.5%, and the buy/sell ratio is 0.58. When the price is being pushed up, the aggressive buy side is actually leaning toward the sell direction—this suggests that part of this rally is being driven by passive orders getting filled, not purely by active longs sweeping.
OI is +0.59% on 15m and +1.49% on 1h. Nominal changes are not huge, but the percentile spikes to 94.8%, full pool #4. Positions are increasing: leveraged long exposure is adding too, but the size is still relatively restrained.
In 24h, turnover is 33.62M, and full pool nominal change is #16. It’s not a huge pool—at this depth, once a little money comes in, volatility is easy to trigger. The volume-price coordination is real; both OI and price moving in the same direction is real too. The structure is healthier than just a pure pump.
The problem is the buy/sell ratio. Price is hugging the upper edge of the range. Near the previous high, if the aggressive buys don’t keep up, it can easily turn into a one-and-done spike. Either the next 15m candle flips the aggressive imbalance positive, or you wait for a pullback to confirm.
Just watch for now. No rush to act.
In 15m, it directly did +4.5%. Volume is 3.19x, the Z-score is 3.04, and the closing price is above the upper bound of nearly 20 consecutive 5m candles—this is a standard relative breakout, not that kind of slow, sideways rebound fake-out.
But there’s a detail to watch: the aggressive trade imbalance is down -26.5%, and the buy/sell ratio is 0.58. When the price is being pushed up, the aggressive buy side is actually leaning toward the sell direction—this suggests that part of this rally is being driven by passive orders getting filled, not purely by active longs sweeping.
OI is +0.59% on 15m and +1.49% on 1h. Nominal changes are not huge, but the percentile spikes to 94.8%, full pool #4. Positions are increasing: leveraged long exposure is adding too, but the size is still relatively restrained.
In 24h, turnover is 33.62M, and full pool nominal change is #16. It’s not a huge pool—at this depth, once a little money comes in, volatility is easy to trigger. The volume-price coordination is real; both OI and price moving in the same direction is real too. The structure is healthier than just a pure pump.
The problem is the buy/sell ratio. Price is hugging the upper edge of the range. Near the previous high, if the aggressive buys don’t keep up, it can easily turn into a one-and-done spike. Either the next 15m candle flips the aggressive imbalance positive, or you wait for a pullback to confirm.
Just watch for now. No rush to act.
29

·
--
$PENDLE 15mThis pull isn’t that aggressive—only 0.62%—but the volume is 1.89 times the norm. Once the candles closed, it directly pushed through the upper edge of the last nearly 20 five‑minute bars. What’s interesting is the OI: it increased by 0.44% over 1h, with a nominal change of +432K. The 15m movement isn’t much, which suggests this wasn’t just one spike that quickly got withdrawn. It looks more like someone has been gradually building a position.
The aggressive trade imbalance is +15.9%, buy-to-sell ratio is 1.38, and the funding rate is also in the upper percentile recently. Price is up, OI is up, and the funding rate isn’t low—this is a typical leveraged long entry structure, not the kind of “hot air” you’d see from short covering.
This whole-pool anomaly ranks #16 by quantity movement and #31 by nominal change. The 24h trading value is only 24.63M, so the pool isn’t very deep. In this kind of liquidity, once the funding rate is pushed into a high percentile, either it marks the start of a trend—or it squeezes for a wave and then dissipates. I’ll first see whether it can hold above this range’s upper edge. If it can’t hold, then it’s likely a bull trap.
$PENDLE 15mThis pull isn’t that aggressive—only 0.62%—but the volume is 1.89 times the norm. Once the candles closed, it directly pushed through the upper edge of the last nearly 20 five‑minute bars. What’s interesting is the OI: it increased by 0.44% over 1h, with a nominal change of +432K. The 15m movement isn’t much, which suggests this wasn’t just one spike that quickly got withdrawn. It looks more like someone has been gradually building a position.
The aggressive trade imbalance is +15.9%, buy-to-sell ratio is 1.38, and the funding rate is also in the upper percentile recently. Price is up, OI is up, and the funding rate isn’t low—this is a typical leveraged long entry structure, not the kind of “hot air” you’d see from short covering.
This whole-pool anomaly ranks #16 by quantity movement and #31 by nominal change. The 24h trading value is only 24.63M, so the pool isn’t very deep. In this kind of liquidity, once the funding rate is pushed into a high percentile, either it marks the start of a trend—or it squeezes for a wave and then dissipates. I’ll first see whether it can hold above this range’s upper edge. If it can’t hold, then it’s likely a bull trap.
The aggressive trade imbalance is +15.9%, buy-to-sell ratio is 1.38, and the funding rate is also in the upper percentile recently. Price is up, OI is up, and the funding rate isn’t low—this is a typical leveraged long entry structure, not the kind of “hot air” you’d see from short covering.
This whole-pool anomaly ranks #16 by quantity movement and #31 by nominal change. The 24h trading value is only 24.63M, so the pool isn’t very deep. In this kind of liquidity, once the funding rate is pushed into a high percentile, either it marks the start of a trend—or it squeezes for a wave and then dissipates. I’ll first see whether it can hold above this range’s upper edge. If it can’t hold, then it’s likely a bull trap.
10
·
--
$USELESS This name sounds pretty self-deprecating; the chart is, however, not vague at all.
On the 15m timeframe it’s up 2.13%, and volume/turnover can directly hit 2.53x. The closing price has chewed through the upper edge of the past 20 5m candles. Most importantly, it’s the OI—on the 15m contract, OI is still increasing; nominal change is +2.39%, and the buy/sell ratio is 1.32 in favor of buyers, which is bullish. This isn’t the kind of “fake pump” that just looks like short-covering—it’s more like new leveraged long positions charging in.
But the 1h OI is only slightly down, -0.19%, suggesting this move is just a freshly lit short-term rhythm, not trend-level big money in the mix.
Over 24h, the trading value is 184M, which means among altcoins it does have some heat. The whole-pool anomaly is #16, and nominal change is #10—leading, but not extreme.
My take: a range break plus volume/price plus OI all resonate together—being slightly bullish in the short term is fine. But USELESS is the kind of target where, before chasing higher, you should first check whether you can actually take the inevitable wick/pin-ins.
$USELESS This name sounds pretty self-deprecating; the chart is, however, not vague at all.
On the 15m timeframe it’s up 2.13%, and volume/turnover can directly hit 2.53x. The closing price has chewed through the upper edge of the past 20 5m candles. Most importantly, it’s the OI—on the 15m contract, OI is still increasing; nominal change is +2.39%, and the buy/sell ratio is 1.32 in favor of buyers, which is bullish. This isn’t the kind of “fake pump” that just looks like short-covering—it’s more like new leveraged long positions charging in.
But the 1h OI is only slightly down, -0.19%, suggesting this move is just a freshly lit short-term rhythm, not trend-level big money in the mix.
Over 24h, the trading value is 184M, which means among altcoins it does have some heat. The whole-pool anomaly is #16, and nominal change is #10—leading, but not extreme.
My take: a range break plus volume/price plus OI all resonate together—being slightly bullish in the short term is fine. But USELESS is the kind of target where, before chasing higher, you should first check whether you can actually take the inevitable wick/pin-ins.
On the 15m timeframe it’s up 2.13%, and volume/turnover can directly hit 2.53x. The closing price has chewed through the upper edge of the past 20 5m candles. Most importantly, it’s the OI—on the 15m contract, OI is still increasing; nominal change is +2.39%, and the buy/sell ratio is 1.32 in favor of buyers, which is bullish. This isn’t the kind of “fake pump” that just looks like short-covering—it’s more like new leveraged long positions charging in.
But the 1h OI is only slightly down, -0.19%, suggesting this move is just a freshly lit short-term rhythm, not trend-level big money in the mix.
Over 24h, the trading value is 184M, which means among altcoins it does have some heat. The whole-pool anomaly is #16, and nominal change is #10—leading, but not extreme.
My take: a range break plus volume/price plus OI all resonate together—being slightly bullish in the short term is fine. But USELESS is the kind of target where, before chasing higher, you should first check whether you can actually take the inevitable wick/pin-ins.
97
·
--
$Lobster This 15m move pulled 4 points. The volume/turnover went straight up to 2.97x, and the price even broke through the upper edge of nearly 20 5m candles—looks pretty intimidating.
But if you look closely at OI: the 15m period is down 2.39%, and 1h is down 1.7%; the nominal change is actually positive. When price rises while open interest falls, that structure looks more like short covering or positions are shifting rather than brand-new longs hard-pushing the breakout.
The aggressive trades are down 7.2%, and the buy/sell ratio is 1.16—leaning toward buyers, but not to an extreme level. 24h trading volume is 65.9M, and the depth is certainly there.
It ranks #24 for pool-wide anomalies, #16 for nominal change, with an anomaly percentile of 82.7%—it’s definitely an event. However, since OI is declining here, keep an eye on whether this is merely pushing up via covering; whether it can hold afterward depends on whether there’s real “fresh money” to take the other side.
For now, just watch it—don’t rush to chase.
$Lobster This 15m move pulled 4 points. The volume/turnover went straight up to 2.97x, and the price even broke through the upper edge of nearly 20 5m candles—looks pretty intimidating.
But if you look closely at OI: the 15m period is down 2.39%, and 1h is down 1.7%; the nominal change is actually positive. When price rises while open interest falls, that structure looks more like short covering or positions are shifting rather than brand-new longs hard-pushing the breakout.
The aggressive trades are down 7.2%, and the buy/sell ratio is 1.16—leaning toward buyers, but not to an extreme level. 24h trading volume is 65.9M, and the depth is certainly there.
It ranks #24 for pool-wide anomalies, #16 for nominal change, with an anomaly percentile of 82.7%—it’s definitely an event. However, since OI is declining here, keep an eye on whether this is merely pushing up via covering; whether it can hold afterward depends on whether there’s real “fresh money” to take the other side.
For now, just watch it—don’t rush to chase.
But if you look closely at OI: the 15m period is down 2.39%, and 1h is down 1.7%; the nominal change is actually positive. When price rises while open interest falls, that structure looks more like short covering or positions are shifting rather than brand-new longs hard-pushing the breakout.
The aggressive trades are down 7.2%, and the buy/sell ratio is 1.16—leaning toward buyers, but not to an extreme level. 24h trading volume is 65.9M, and the depth is certainly there.
It ranks #24 for pool-wide anomalies, #16 for nominal change, with an anomaly percentile of 82.7%—it’s definitely an event. However, since OI is declining here, keep an eye on whether this is merely pushing up via covering; whether it can hold afterward depends on whether there’s real “fresh money” to take the other side.
For now, just watch it—don’t rush to chase.

36
·
--
TAO pushes this move pretty decisively—within the 15m timeframe it immediately closed a bullish candle and reclaimed the top of the previous 20 5m-range.
But there’s one detail I don’t like: as price is rising, OI is falling. The 15m contract is -0.05%, 1h is -0.28%. Although nominal change is still positive, the overall structure looks more like shorts getting forced to cover rather than new longs actively stepping in. Active trade imbalance is -12.6%, buy-sell ratio is 1.29. On the short-term, buyers do have the edge, and volume also expanded to 1.48x. Volatility Z hits 2.30, which means this isn’t a slow, lukewarm行情.
The issue is this: if the rally is driven by short covering, then how long it can last usually depends on whether someone steps in and continues after the covering is done. The pool’s abnormal percentile is 77.8%, nominal change ranks at #16, and it’s been extending across several consecutive periods. Signals like this are indeed on the earlier side when viewed across the whole market. And the 24h trading value at 187M isn’t exactly small.
My view is that the short-term bias is bullish, but don’t treat this as a trend-start signal and chase higher. In a short-covering move, it often runs fast and fades fast. If you really want confirmation that longs have taken over, you need to see whether OI can move up alongside price. This combination right now looks more like someone is using the rebound to de-risk and reduce positions.
TAO pushes this move pretty decisively—within the 15m timeframe it immediately closed a bullish candle and reclaimed the top of the previous 20 5m-range.
But there’s one detail I don’t like: as price is rising, OI is falling. The 15m contract is -0.05%, 1h is -0.28%. Although nominal change is still positive, the overall structure looks more like shorts getting forced to cover rather than new longs actively stepping in. Active trade imbalance is -12.6%, buy-sell ratio is 1.29. On the short-term, buyers do have the edge, and volume also expanded to 1.48x. Volatility Z hits 2.30, which means this isn’t a slow, lukewarm行情.
The issue is this: if the rally is driven by short covering, then how long it can last usually depends on whether someone steps in and continues after the covering is done. The pool’s abnormal percentile is 77.8%, nominal change ranks at #16, and it’s been extending across several consecutive periods. Signals like this are indeed on the earlier side when viewed across the whole market. And the 24h trading value at 187M isn’t exactly small.
My view is that the short-term bias is bullish, but don’t treat this as a trend-start signal and chase higher. In a short-covering move, it often runs fast and fades fast. If you really want confirmation that longs have taken over, you need to see whether OI can move up alongside price. This combination right now looks more like someone is using the rebound to de-risk and reduce positions.
But there’s one detail I don’t like: as price is rising, OI is falling. The 15m contract is -0.05%, 1h is -0.28%. Although nominal change is still positive, the overall structure looks more like shorts getting forced to cover rather than new longs actively stepping in. Active trade imbalance is -12.6%, buy-sell ratio is 1.29. On the short-term, buyers do have the edge, and volume also expanded to 1.48x. Volatility Z hits 2.30, which means this isn’t a slow, lukewarm行情.
The issue is this: if the rally is driven by short covering, then how long it can last usually depends on whether someone steps in and continues after the covering is done. The pool’s abnormal percentile is 77.8%, nominal change ranks at #16, and it’s been extending across several consecutive periods. Signals like this are indeed on the earlier side when viewed across the whole market. And the 24h trading value at 187M isn’t exactly small.
My view is that the short-term bias is bullish, but don’t treat this as a trend-start signal and chase higher. In a short-covering move, it often runs fast and fades fast. If you really want confirmation that longs have taken over, you need to see whether OI can move up alongside price. This combination right now looks more like someone is using the rebound to de-risk and reduce positions.
10
Log in to explore more content
Join global crypto users on Binance Square
⚡️ Get latest and useful information about crypto.
💬 Trusted by the world’s largest crypto exchange.
👍 Discover real insights from verified creators.
Email / Phone number
Trending Topics
1
#FedRateWatch
431,628 views
2,376 Discussing
2
#BitcoinSlidesTo$76000
11,559 views
98 Discussing
3
#BitcoinReboundsTo$79K
57,586 views
389 Discussing
4
#StrategyMarketCapPassesFord
23,252 views
547 Discussing
5
#ClarityActOddsHalveOnPolymarket
27,108 views
439 Discussing
6
#US30YTreasuryYieldTops5.40%
20,413 views
318 Discussing
7
#BessentEndorsesFinalClarityActDraft
43,318 views
671 Discussing
8
#ZamaOpens16ConfidentialMorphoVaults
15,022 views
321 Discussing
9
#USDCOnChainVolumeTops$100Trillion
2,288 views
48 Discussing
10
#BitcoinSpotETFsNetInflow$160M
2,943 views
100 Discussing