
#18
18
13,358 views
162 Discussing
Hot
Latest

·
--
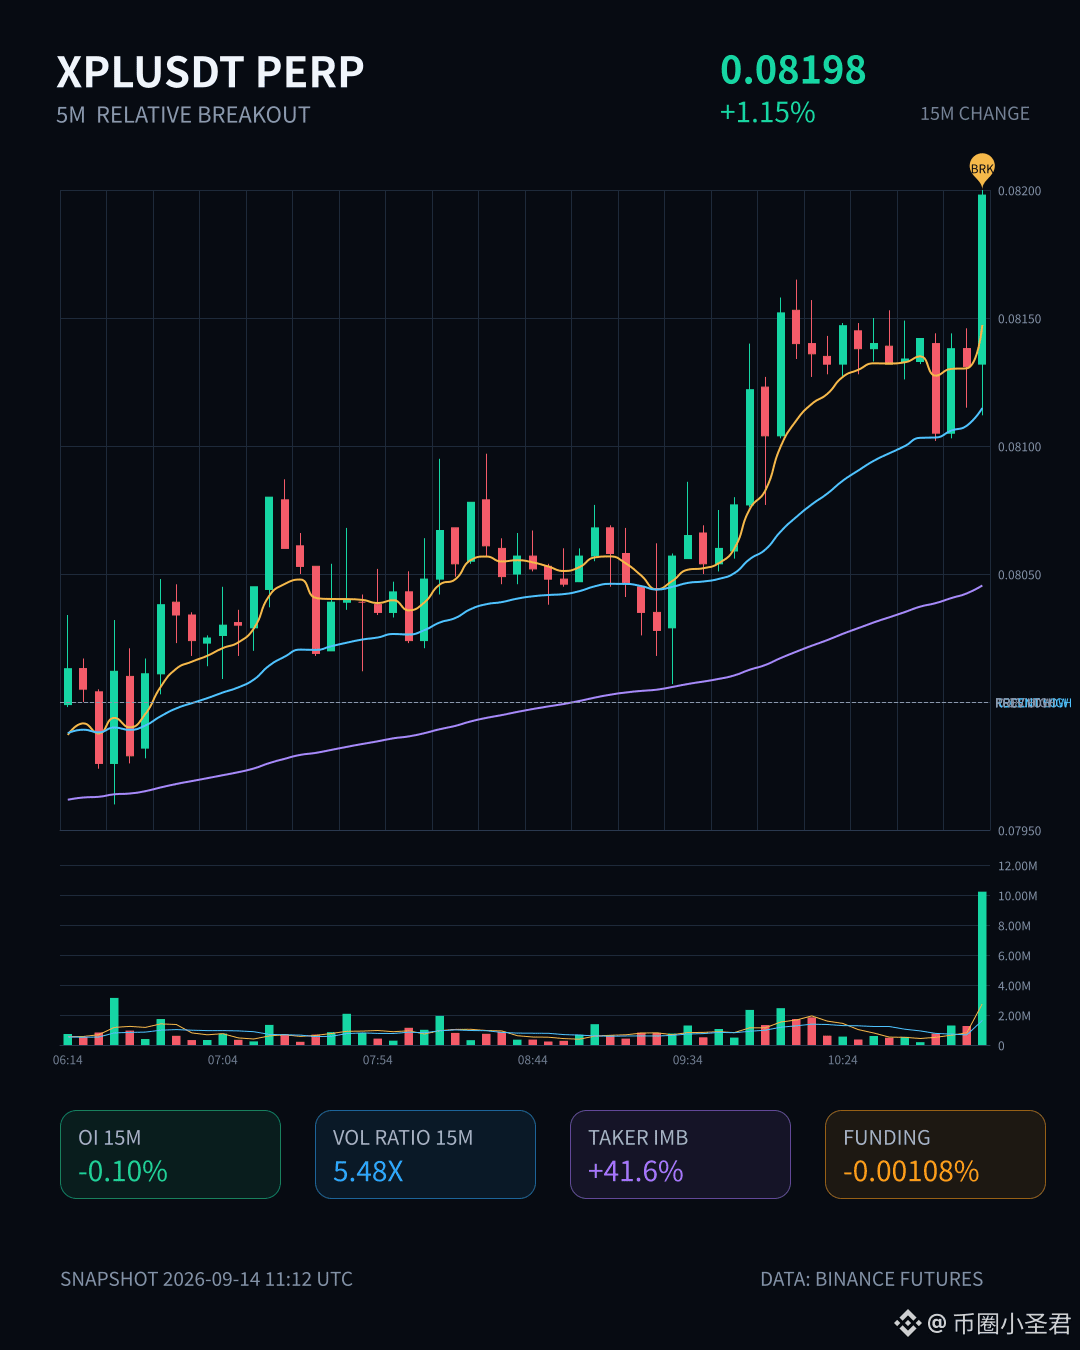
$XPL moved.
In 15m it directly pulled up 1.15%; volume surged to 5.48x, volatility spiked to 3.28. This kind of volume-price coordination isn’t ground out by a slow, bearish grind—it’s someone driving it higher. The closing price has already broken above the upper band of the last 20 5m candles; the buy order volume vs 2.43 is stronger, and the aggressive-to-total trade gap is -41.6%. The direction is pretty clear.
But what’s interesting is that OI is dropping. In 15m: -0.10%, in 1h: -0.09%. Price is up while positions are down—typical of short covering, or positioning flattening. The abnormal percentile for OI is still sitting at 94.6%, with the whole pool abnormal #10 and nominal change #18—meaning this level itself is an extreme zone, not just a random touch.
Over the past 24h, turnover is 27.53M; depth has confirmed it, and volume is higher than normal. Now it comes down to whether this short-covering wave can spark a new long relay, or whether it just fires off and then fizzles after the shorts are done. Whether to chase or not—follow your own timing.
$XPL moved.
In 15m it directly pulled up 1.15%; volume surged to 5.48x, volatility spiked to 3.28. This kind of volume-price coordination isn’t ground out by a slow, bearish grind—it’s someone driving it higher. The closing price has already broken above the upper band of the last 20 5m candles; the buy order volume vs 2.43 is stronger, and the aggressive-to-total trade gap is -41.6%. The direction is pretty clear.
But what’s interesting is that OI is dropping. In 15m: -0.10%, in 1h: -0.09%. Price is up while positions are down—typical of short covering, or positioning flattening. The abnormal percentile for OI is still sitting at 94.6%, with the whole pool abnormal #10 and nominal change #18—meaning this level itself is an extreme zone, not just a random touch.
Over the past 24h, turnover is 27.53M; depth has confirmed it, and volume is higher than normal. Now it comes down to whether this short-covering wave can spark a new long relay, or whether it just fires off and then fizzles after the shorts are done. Whether to chase or not—follow your own timing.
In 15m it directly pulled up 1.15%; volume surged to 5.48x, volatility spiked to 3.28. This kind of volume-price coordination isn’t ground out by a slow, bearish grind—it’s someone driving it higher. The closing price has already broken above the upper band of the last 20 5m candles; the buy order volume vs 2.43 is stronger, and the aggressive-to-total trade gap is -41.6%. The direction is pretty clear.
But what’s interesting is that OI is dropping. In 15m: -0.10%, in 1h: -0.09%. Price is up while positions are down—typical of short covering, or positioning flattening. The abnormal percentile for OI is still sitting at 94.6%, with the whole pool abnormal #10 and nominal change #18—meaning this level itself is an extreme zone, not just a random touch.
Over the past 24h, turnover is 27.53M; depth has confirmed it, and volume is higher than normal. Now it comes down to whether this short-covering wave can spark a new long relay, or whether it just fires off and then fizzles after the shorts are done. Whether to chase or not—follow your own timing.
29

·
--
$VVV This move is a bit interesting. In the 15m timeframe, it pulled up 1.1%, and the volume even spiked to 1.75x. The closing price also broke above the upper band of the past 20 consecutive 5m candles. But note the OI: the 15m contract is -0.03% and the 1h is -0.46%. Price is up while open interest is down—this is the classic short covering script, not new longs entering.
Taker/active volume is 5.1% lower; buy/sell ratio is 1.11. The order book looks slightly buyer-favored, with a 24h trading value of 49M. The anomaly percentile is 86.5%, the whole pool is #13, nominal change is #18, and the depth confirmation has passed too.
With this kind of structure, I usually don’t chase the first candle. In a trend pushed up by short covering, once that covering momentum fades, it’s easy for price to get stuck and churn in place. Let’s see if it can hold above the upper edge of this range. If it can’t, then it’s a false breakout.
$VVV This move is a bit interesting. In the 15m timeframe, it pulled up 1.1%, and the volume even spiked to 1.75x. The closing price also broke above the upper band of the past 20 consecutive 5m candles. But note the OI: the 15m contract is -0.03% and the 1h is -0.46%. Price is up while open interest is down—this is the classic short covering script, not new longs entering.
Taker/active volume is 5.1% lower; buy/sell ratio is 1.11. The order book looks slightly buyer-favored, with a 24h trading value of 49M. The anomaly percentile is 86.5%, the whole pool is #13, nominal change is #18, and the depth confirmation has passed too.
With this kind of structure, I usually don’t chase the first candle. In a trend pushed up by short covering, once that covering momentum fades, it’s easy for price to get stuck and churn in place. Let’s see if it can hold above the upper edge of this range. If it can’t, then it’s a false breakout.
Taker/active volume is 5.1% lower; buy/sell ratio is 1.11. The order book looks slightly buyer-favored, with a 24h trading value of 49M. The anomaly percentile is 86.5%, the whole pool is #13, nominal change is #18, and the depth confirmation has passed too.
With this kind of structure, I usually don’t chase the first candle. In a trend pushed up by short covering, once that covering momentum fades, it’s easy for price to get stuck and churn in place. Let’s see if it can hold above the upper edge of this range. If it can’t, then it’s a false breakout.
21

·
--
$RIVER This move is a bit interesting.
In the 15m timeframe, it directly surged 2.91%, with volume reaching 1.83x. The Z value is 3.13, and the closing price just managed to break above the upper edge of the most recent 20 5m candles. This isn’t the kind of fakeout where it spikes and quickly drops back. The aggressive trades were stronger than passive ones by 16.2%, with a buy/sell ratio of 1.39—overall the direction is tilted bullish.
More importantly, it’s the OI—while price is rising, OI is rising too. In the 1h nominal change: +4.58%. The anomaly percentile is 92.9%, ranking #18 across the whole pool. This structure doesn’t look like short covering pushing the move; it looks more like fresh long positions adding leverage to enter.
In the last 24h, trading value is 33.73M. The anomaly level in the pool is relatively high, and it has continued across several consecutive periods—not just a one-candle impulse.
Of course, the OI on the 1h timeframe is actually -0.19%, which suggests that somewhere along the way, some people closed their positions to reduce exposure. The chips aren’t locked in as one solid block. At the 92.9th percentile, you should weigh for yourself whether the chase has a good risk-reward ratio.
First, log it—let’s see if it can hold above the upper edge.
$RIVER This move is a bit interesting.
In the 15m timeframe, it directly surged 2.91%, with volume reaching 1.83x. The Z value is 3.13, and the closing price just managed to break above the upper edge of the most recent 20 5m candles. This isn’t the kind of fakeout where it spikes and quickly drops back. The aggressive trades were stronger than passive ones by 16.2%, with a buy/sell ratio of 1.39—overall the direction is tilted bullish.
More importantly, it’s the OI—while price is rising, OI is rising too. In the 1h nominal change: +4.58%. The anomaly percentile is 92.9%, ranking #18 across the whole pool. This structure doesn’t look like short covering pushing the move; it looks more like fresh long positions adding leverage to enter.
In the last 24h, trading value is 33.73M. The anomaly level in the pool is relatively high, and it has continued across several consecutive periods—not just a one-candle impulse.
Of course, the OI on the 1h timeframe is actually -0.19%, which suggests that somewhere along the way, some people closed their positions to reduce exposure. The chips aren’t locked in as one solid block. At the 92.9th percentile, you should weigh for yourself whether the chase has a good risk-reward ratio.
First, log it—let’s see if it can hold above the upper edge.
In the 15m timeframe, it directly surged 2.91%, with volume reaching 1.83x. The Z value is 3.13, and the closing price just managed to break above the upper edge of the most recent 20 5m candles. This isn’t the kind of fakeout where it spikes and quickly drops back. The aggressive trades were stronger than passive ones by 16.2%, with a buy/sell ratio of 1.39—overall the direction is tilted bullish.
More importantly, it’s the OI—while price is rising, OI is rising too. In the 1h nominal change: +4.58%. The anomaly percentile is 92.9%, ranking #18 across the whole pool. This structure doesn’t look like short covering pushing the move; it looks more like fresh long positions adding leverage to enter.
In the last 24h, trading value is 33.73M. The anomaly level in the pool is relatively high, and it has continued across several consecutive periods—not just a one-candle impulse.
Of course, the OI on the 1h timeframe is actually -0.19%, which suggests that somewhere along the way, some people closed their positions to reduce exposure. The chips aren’t locked in as one solid block. At the 92.9th percentile, you should weigh for yourself whether the chase has a good risk-reward ratio.
First, log it—let’s see if it can hold above the upper edge.
9
·
--
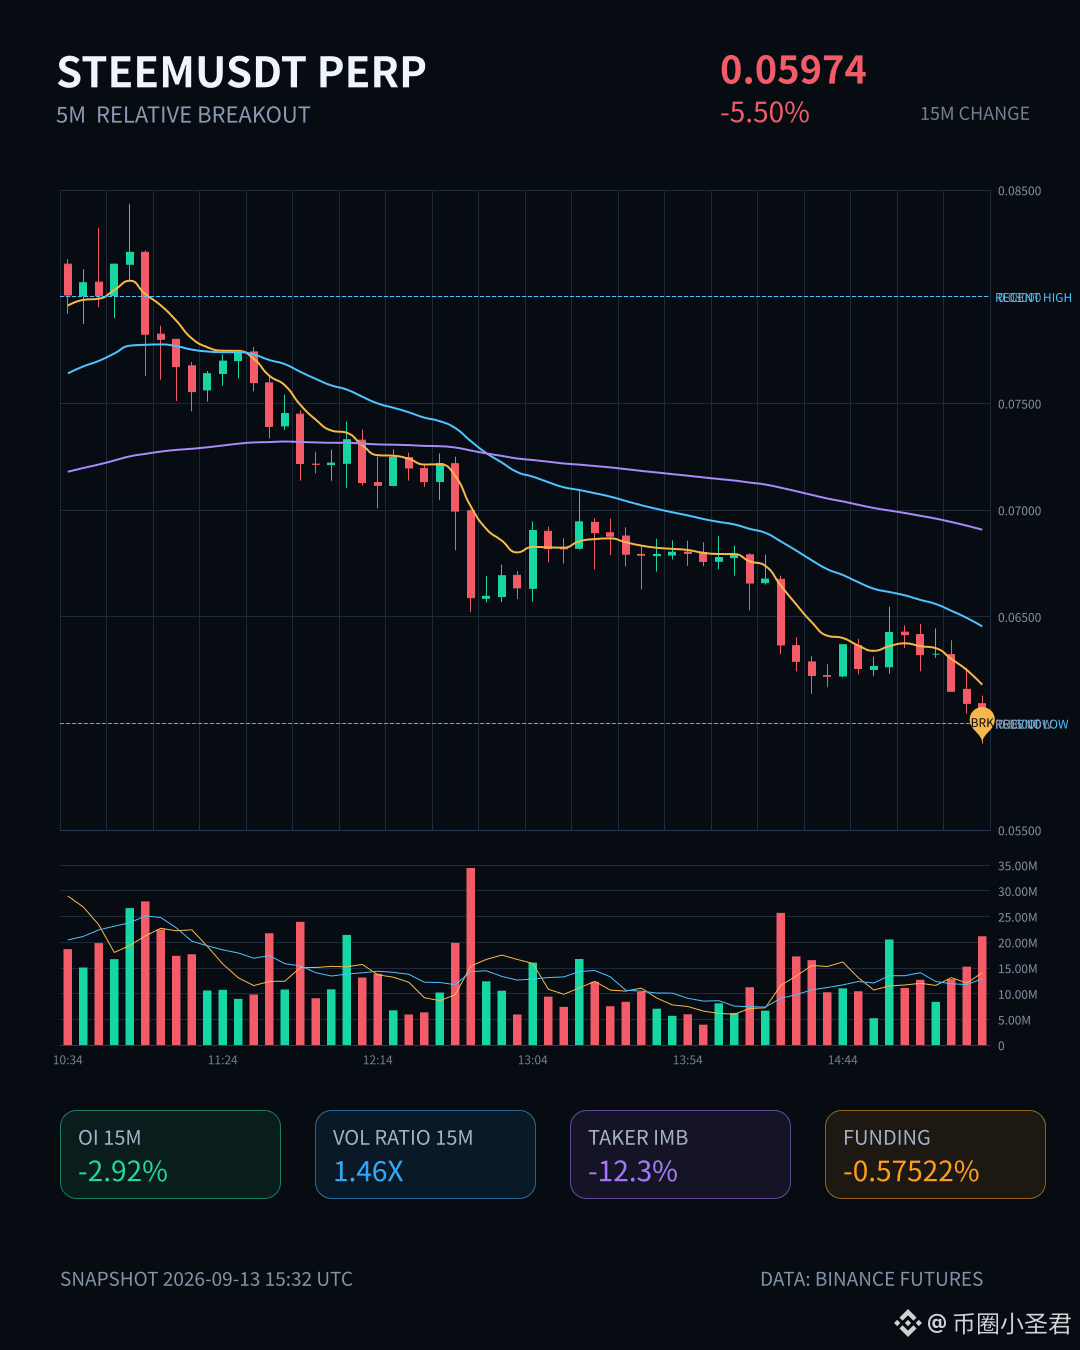
$STEEM This drop is pretty interesting.
In the 15m timeframe, it fell 5.5% directly, with volume up to 1.46x, and the close also broke below the lower edge of the past ~20 5m candles. But OI is dropping at the same time—on the 15m contract, OI is down 2.92% and nominal down by -349K. That looks more like long positions getting liquidated/cleared rather than shorts newly opening and pushing price down.
The aggressive trade gap is -12.3%, the buy/sell ratio is 0.78, and sell pressure is there—but it’s not that kind of panic-style, total collapse. On the contrary, the funding rate is still sitting in the high percentile range recently, suggesting that earlier longs were indeed squeezed a bit too full, and now they’re just “paying the debt.”
One reminder: the OI percentile is abnormal at 94%, the whole pool is #13, and the nominal change is #18. At this kind of spot, it’s often not the endpoint—it’s usually the phase where leverage gets killed first, and then there’s more to say. Don’t rush to catch it, and don’t rush to chase shorts either.
$STEEM This drop is pretty interesting.
In the 15m timeframe, it fell 5.5% directly, with volume up to 1.46x, and the close also broke below the lower edge of the past ~20 5m candles. But OI is dropping at the same time—on the 15m contract, OI is down 2.92% and nominal down by -349K. That looks more like long positions getting liquidated/cleared rather than shorts newly opening and pushing price down.
The aggressive trade gap is -12.3%, the buy/sell ratio is 0.78, and sell pressure is there—but it’s not that kind of panic-style, total collapse. On the contrary, the funding rate is still sitting in the high percentile range recently, suggesting that earlier longs were indeed squeezed a bit too full, and now they’re just “paying the debt.”
One reminder: the OI percentile is abnormal at 94%, the whole pool is #13, and the nominal change is #18. At this kind of spot, it’s often not the endpoint—it’s usually the phase where leverage gets killed first, and then there’s more to say. Don’t rush to catch it, and don’t rush to chase shorts either.
In the 15m timeframe, it fell 5.5% directly, with volume up to 1.46x, and the close also broke below the lower edge of the past ~20 5m candles. But OI is dropping at the same time—on the 15m contract, OI is down 2.92% and nominal down by -349K. That looks more like long positions getting liquidated/cleared rather than shorts newly opening and pushing price down.
The aggressive trade gap is -12.3%, the buy/sell ratio is 0.78, and sell pressure is there—but it’s not that kind of panic-style, total collapse. On the contrary, the funding rate is still sitting in the high percentile range recently, suggesting that earlier longs were indeed squeezed a bit too full, and now they’re just “paying the debt.”
One reminder: the OI percentile is abnormal at 94%, the whole pool is #13, and the nominal change is #18. At this kind of spot, it’s often not the endpoint—it’s usually the phase where leverage gets killed first, and then there’s more to say. Don’t rush to catch it, and don’t rush to chase shorts either.
27
·
--
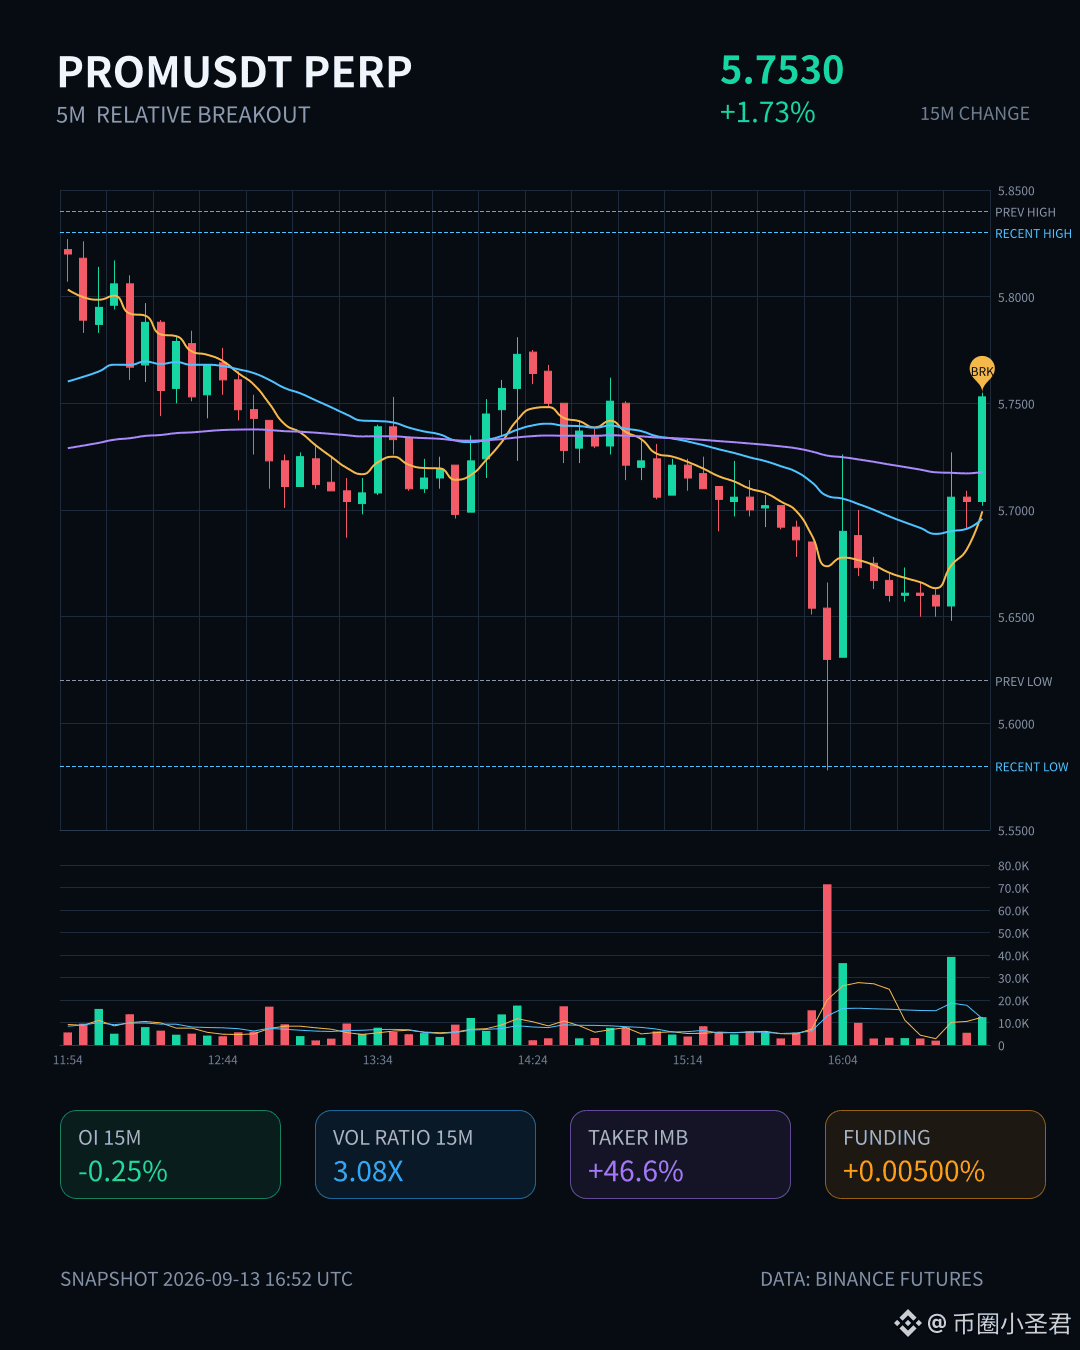
$PROM This 15m move came a bit suddenly—the volume directly hit 3 times the normal, with the buy-sell ratio at 2.74. The aggressive buy orders are clearly pushing.
What’s interesting, though, is that OI is dropping—15m -0.25%, 1h -0.34%. Price is rising while positions are decreasing; that’s a typical short-covering flow, not new longs entering. With this kind of structure, you have to see whether it can hold—otherwise, once the cover is done, there won’t be anyone to take over.
It broke through the top of the recent 5m range on the close for nearly 20 bars, and the funding rate is also in a high percentile lately. In the abnormal ranking for the whole pool, it’s #12; nominal change #18— not the most intense among that batch.
Over 24h, turnover is 25.79M; it’s not a huge volume, and if you push it up, it can just as quickly get dumped. Whether to chase it is up to you—I’ll observe first and see how strong the pullback is.
$PROM This 15m move came a bit suddenly—the volume directly hit 3 times the normal, with the buy-sell ratio at 2.74. The aggressive buy orders are clearly pushing.
What’s interesting, though, is that OI is dropping—15m -0.25%, 1h -0.34%. Price is rising while positions are decreasing; that’s a typical short-covering flow, not new longs entering. With this kind of structure, you have to see whether it can hold—otherwise, once the cover is done, there won’t be anyone to take over.
It broke through the top of the recent 5m range on the close for nearly 20 bars, and the funding rate is also in a high percentile lately. In the abnormal ranking for the whole pool, it’s #12; nominal change #18— not the most intense among that batch.
Over 24h, turnover is 25.79M; it’s not a huge volume, and if you push it up, it can just as quickly get dumped. Whether to chase it is up to you—I’ll observe first and see how strong the pullback is.
What’s interesting, though, is that OI is dropping—15m -0.25%, 1h -0.34%. Price is rising while positions are decreasing; that’s a typical short-covering flow, not new longs entering. With this kind of structure, you have to see whether it can hold—otherwise, once the cover is done, there won’t be anyone to take over.
It broke through the top of the recent 5m range on the close for nearly 20 bars, and the funding rate is also in a high percentile lately. In the abnormal ranking for the whole pool, it’s #12; nominal change #18— not the most intense among that batch.
Over 24h, turnover is 25.79M; it’s not a huge volume, and if you push it up, it can just as quickly get dumped. Whether to chase it is up to you—I’ll observe first and see how strong the pullback is.
39
·
--
$ZRO This position is kind of interesting.
At 15m, the volume expansion pulled it to 2.53x; volume/price “Z” hit 2.98. The difference in aggressive trades was 36.9%, and the buy-sell ratio was 2.17. — The buy orders are genuinely aggressively sweeping, not a fake impression propped up by resting orders. The close directly broke through the top of nearly 20 consecutive 5m candles, reaching the boundary of the range.
More importantly, OI: in 1h, the notional is still positive at +0.40%; for the 15m contract +0.08%; notional +1.11%; abnormal percentile at 94.4%; and across the whole pool it ranks #7. Price is rising together with OI—this is the structure of newly added leveraged long exposure, not that “short-covering with a burst of heat.” And it has been continuing across several consecutive cycles; it’s not just one wick.
In the last 24h, trading value was 16.88M. Notional changes within the pool surged to #18, and the depth has been confirmed.
We’re close to this asset’s own historical extreme range. At this level, it either accelerates or gets smashed; I’m inclined to first see whether it can hold above the upper band before discussing the next steps. Don’t chase—wait for a pullback and confirmation.
$ZRO
$ZRO This position is kind of interesting.
At 15m, the volume expansion pulled it to 2.53x; volume/price “Z” hit 2.98. The difference in aggressive trades was 36.9%, and the buy-sell ratio was 2.17. — The buy orders are genuinely aggressively sweeping, not a fake impression propped up by resting orders. The close directly broke through the top of nearly 20 consecutive 5m candles, reaching the boundary of the range.
More importantly, OI: in 1h, the notional is still positive at +0.40%; for the 15m contract +0.08%; notional +1.11%; abnormal percentile at 94.4%; and across the whole pool it ranks #7. Price is rising together with OI—this is the structure of newly added leveraged long exposure, not that “short-covering with a burst of heat.” And it has been continuing across several consecutive cycles; it’s not just one wick.
In the last 24h, trading value was 16.88M. Notional changes within the pool surged to #18, and the depth has been confirmed.
We’re close to this asset’s own historical extreme range. At this level, it either accelerates or gets smashed; I’m inclined to first see whether it can hold above the upper band before discussing the next steps. Don’t chase—wait for a pullback and confirmation.
$ZRO
At 15m, the volume expansion pulled it to 2.53x; volume/price “Z” hit 2.98. The difference in aggressive trades was 36.9%, and the buy-sell ratio was 2.17. — The buy orders are genuinely aggressively sweeping, not a fake impression propped up by resting orders. The close directly broke through the top of nearly 20 consecutive 5m candles, reaching the boundary of the range.
More importantly, OI: in 1h, the notional is still positive at +0.40%; for the 15m contract +0.08%; notional +1.11%; abnormal percentile at 94.4%; and across the whole pool it ranks #7. Price is rising together with OI—this is the structure of newly added leveraged long exposure, not that “short-covering with a burst of heat.” And it has been continuing across several consecutive cycles; it’s not just one wick.
In the last 24h, trading value was 16.88M. Notional changes within the pool surged to #18, and the depth has been confirmed.
We’re close to this asset’s own historical extreme range. At this level, it either accelerates or gets smashed; I’m inclined to first see whether it can hold above the upper band before discussing the next steps. Don’t chase—wait for a pullback and confirmation.
$ZRO
7
·
--
$Lobster This 15m move is up 3.17%; volume directly surged to 4.57x, but OI is dropping—1h contract -0.43%, 15m -1.68%, while nominal change still has another 599K coming in.
This is a typical short covering setup, not fresh longs entering. The aggressive volume difference is 8.7%, buy/sell ratio is 1.19—slightly buy-side—but the more important signal is OI decreasing.
In the past 24h, trading value is 117M, the whole pool is abnormal #18, and nominal change is #8. Depth has been checked: the traded volume is higher than usual. The structure that drives the rally raises doubts about its sustainability unless OI turns back positive. Be careful when chasing the price.
$Lobster This 15m move is up 3.17%; volume directly surged to 4.57x, but OI is dropping—1h contract -0.43%, 15m -1.68%, while nominal change still has another 599K coming in.
This is a typical short covering setup, not fresh longs entering. The aggressive volume difference is 8.7%, buy/sell ratio is 1.19—slightly buy-side—but the more important signal is OI decreasing.
In the past 24h, trading value is 117M, the whole pool is abnormal #18, and nominal change is #8. Depth has been checked: the traded volume is higher than usual. The structure that drives the rally raises doubts about its sustainability unless OI turns back positive. Be careful when chasing the price.
This is a typical short covering setup, not fresh longs entering. The aggressive volume difference is 8.7%, buy/sell ratio is 1.19—slightly buy-side—but the more important signal is OI decreasing.
In the past 24h, trading value is 117M, the whole pool is abnormal #18, and nominal change is #8. Depth has been checked: the traded volume is higher than usual. The structure that drives the rally raises doubts about its sustainability unless OI turns back positive. Be careful when chasing the price.
7
·
--
$CHIP has something there.
In the 15m timeframe it rose 1.05%, and the volume surged straight to 1.96x. The Z value is 2.30, and the closing price has broken above the upper edge of the recent 20 consecutive 5m intervals. The OI data is even more interesting—on 15m, OI only increased by 0.08%, but in the 1h timeframe the notional change was 329K, up 2.92%. Together with the price moving upward, it looks more like fresh leveraged long positions are entering, not some kind of short-covering fake pump.
The active trade gap is 6.4%, buy-sell ratio is 1.14, and the order book is more buy-side. The funding rate is already at a recent high percentile, which suggests the long side sentiment is a bit crowded—chasing higher, be careful.
Abnormal activity within the whole pool ranks #18, notional change ranks #35, and the depth confirmation also passed—volume above normal, touching the boundary, and funding at a high level; all three conditions are met.
24h trading volume is 27.51M; the pool isn’t very thick. At this position, if someone starts taking profit, volatility could amplify. Watch it first—no rush to act.
$CHIP has something there.
In the 15m timeframe it rose 1.05%, and the volume surged straight to 1.96x. The Z value is 2.30, and the closing price has broken above the upper edge of the recent 20 consecutive 5m intervals. The OI data is even more interesting—on 15m, OI only increased by 0.08%, but in the 1h timeframe the notional change was 329K, up 2.92%. Together with the price moving upward, it looks more like fresh leveraged long positions are entering, not some kind of short-covering fake pump.
The active trade gap is 6.4%, buy-sell ratio is 1.14, and the order book is more buy-side. The funding rate is already at a recent high percentile, which suggests the long side sentiment is a bit crowded—chasing higher, be careful.
Abnormal activity within the whole pool ranks #18, notional change ranks #35, and the depth confirmation also passed—volume above normal, touching the boundary, and funding at a high level; all three conditions are met.
24h trading volume is 27.51M; the pool isn’t very thick. At this position, if someone starts taking profit, volatility could amplify. Watch it first—no rush to act.
In the 15m timeframe it rose 1.05%, and the volume surged straight to 1.96x. The Z value is 2.30, and the closing price has broken above the upper edge of the recent 20 consecutive 5m intervals. The OI data is even more interesting—on 15m, OI only increased by 0.08%, but in the 1h timeframe the notional change was 329K, up 2.92%. Together with the price moving upward, it looks more like fresh leveraged long positions are entering, not some kind of short-covering fake pump.
The active trade gap is 6.4%, buy-sell ratio is 1.14, and the order book is more buy-side. The funding rate is already at a recent high percentile, which suggests the long side sentiment is a bit crowded—chasing higher, be careful.
Abnormal activity within the whole pool ranks #18, notional change ranks #35, and the depth confirmation also passed—volume above normal, touching the boundary, and funding at a high level; all three conditions are met.
24h trading volume is 27.51M; the pool isn’t very thick. At this position, if someone starts taking profit, volatility could amplify. Watch it first—no rush to act.
13
·
--
UAI broke down pretty decisively—on the 15m chart it fell 1.19% directly, and it wiped out the lower edge of the last 20 consecutive 5m candles.
What’s interesting is that the OI is still trending upward: 15m +0.35%, 1h +0.54%. But the nominal direction is down—price is falling, positions are increasing, and the nominal value is contracting. This is a classic case of shorts adding leverage to push price lower, not just straightforward panic selling by longs.
The anomaly percentile is 76.2%. Across the whole pool of anomalies it ranks #44, with nominal change ranking #18. Compared with the day’s trading volume of 94.69M, this isn’t a small move. Volume is 1.49x and Z is 1.51—definitely not a blow-off move, but once the boundary breaks, it breaks.
Now it comes down to whether this lower edge is truly breached or just a fake move. If the shorts keep adding and price doesn’t reclaim the range, this move may have more downside ahead. $UAI
UAI broke down pretty decisively—on the 15m chart it fell 1.19% directly, and it wiped out the lower edge of the last 20 consecutive 5m candles.
What’s interesting is that the OI is still trending upward: 15m +0.35%, 1h +0.54%. But the nominal direction is down—price is falling, positions are increasing, and the nominal value is contracting. This is a classic case of shorts adding leverage to push price lower, not just straightforward panic selling by longs.
The anomaly percentile is 76.2%. Across the whole pool of anomalies it ranks #44, with nominal change ranking #18. Compared with the day’s trading volume of 94.69M, this isn’t a small move. Volume is 1.49x and Z is 1.51—definitely not a blow-off move, but once the boundary breaks, it breaks.
Now it comes down to whether this lower edge is truly breached or just a fake move. If the shorts keep adding and price doesn’t reclaim the range, this move may have more downside ahead. $UAI
What’s interesting is that the OI is still trending upward: 15m +0.35%, 1h +0.54%. But the nominal direction is down—price is falling, positions are increasing, and the nominal value is contracting. This is a classic case of shorts adding leverage to push price lower, not just straightforward panic selling by longs.
The anomaly percentile is 76.2%. Across the whole pool of anomalies it ranks #44, with nominal change ranking #18. Compared with the day’s trading volume of 94.69M, this isn’t a small move. Volume is 1.49x and Z is 1.51—definitely not a blow-off move, but once the boundary breaks, it breaks.
Now it comes down to whether this lower edge is truly breached or just a fake move. If the shorts keep adding and price doesn’t reclaim the range, this move may have more downside ahead. $UAI
18
·
--
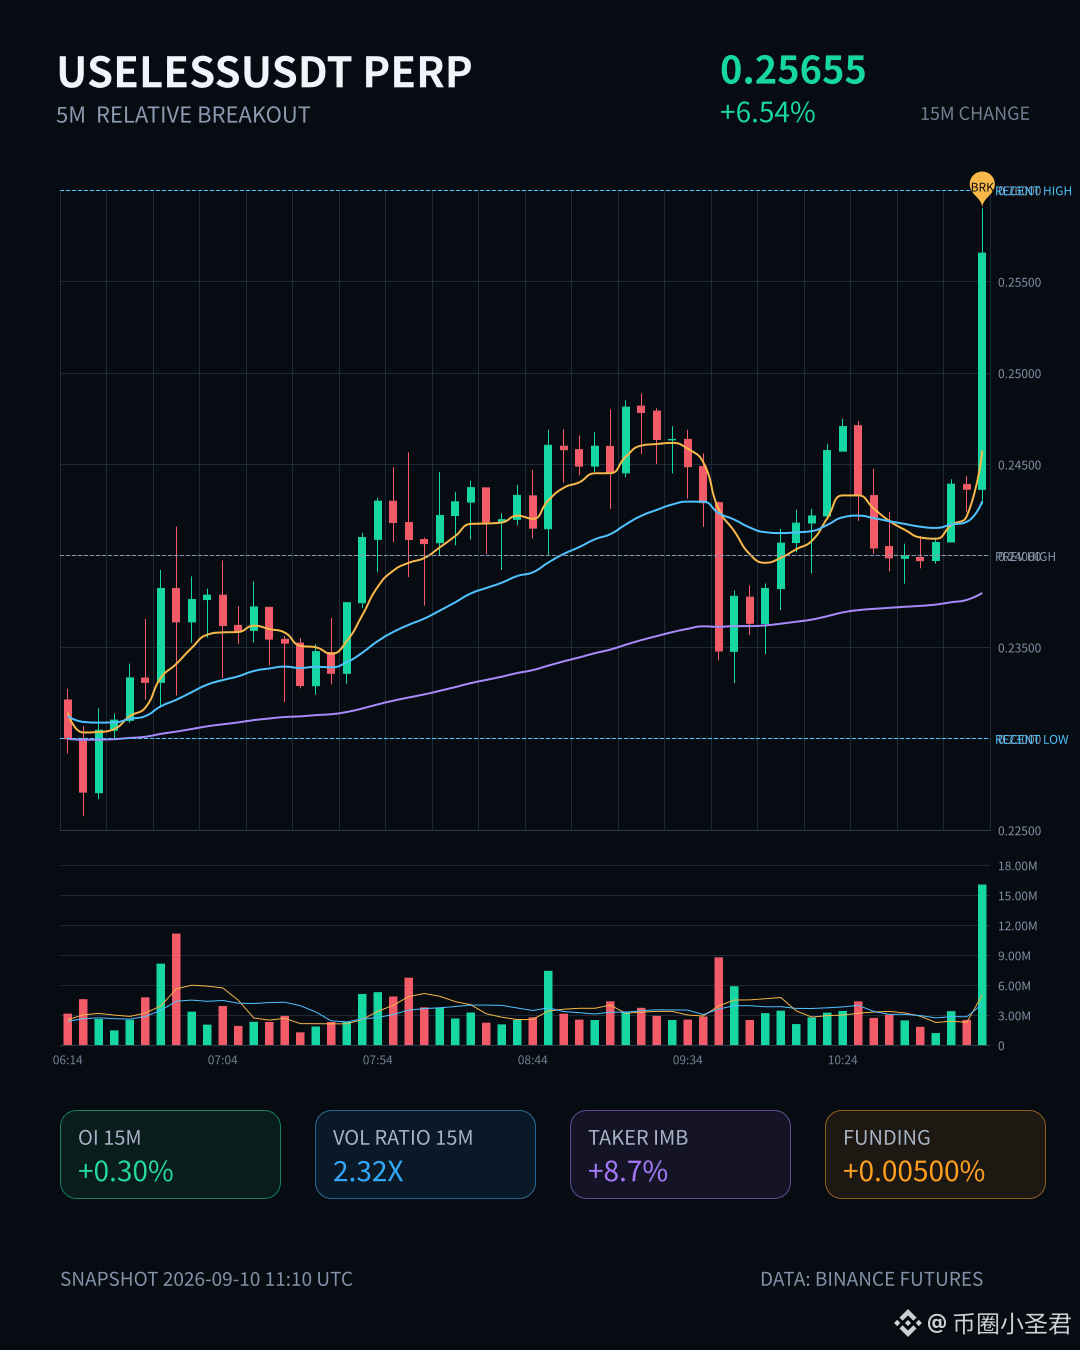
$USELESS This move is a bit interesting.
On the 15m timeframe, it surged 6.54%. The volume directly reached 2.32x, the Z-score is 4.0, and the close even pushed through the upper band of the last ~20 5m candles. The key point is that OI is rising—15m contracts +0.30%, 1h +0.12%, and the nominal change places the whole pool at #18. This doesn’t look like just short-covering; it’s more like new leveraged longs are moving in.
The difference in aggressive trades is +8.7%, buy/sell ratio is 1.19, 24h trading volume is $314 million (U), and depth confirmation is there—it’s solid. It’s called USELESS, but at least at this moment, the money isn’t treating it as useless.
Yes, the breakout is a breakout—but whether it can hold and stand firm remains to be seen.
$USELESS This move is a bit interesting.
On the 15m timeframe, it surged 6.54%. The volume directly reached 2.32x, the Z-score is 4.0, and the close even pushed through the upper band of the last ~20 5m candles. The key point is that OI is rising—15m contracts +0.30%, 1h +0.12%, and the nominal change places the whole pool at #18. This doesn’t look like just short-covering; it’s more like new leveraged longs are moving in.
The difference in aggressive trades is +8.7%, buy/sell ratio is 1.19, 24h trading volume is $314 million (U), and depth confirmation is there—it’s solid. It’s called USELESS, but at least at this moment, the money isn’t treating it as useless.
Yes, the breakout is a breakout—but whether it can hold and stand firm remains to be seen.
On the 15m timeframe, it surged 6.54%. The volume directly reached 2.32x, the Z-score is 4.0, and the close even pushed through the upper band of the last ~20 5m candles. The key point is that OI is rising—15m contracts +0.30%, 1h +0.12%, and the nominal change places the whole pool at #18. This doesn’t look like just short-covering; it’s more like new leveraged longs are moving in.
The difference in aggressive trades is +8.7%, buy/sell ratio is 1.19, 24h trading volume is $314 million (U), and depth confirmation is there—it’s solid. It’s called USELESS, but at least at this moment, the money isn’t treating it as useless.
Yes, the breakout is a breakout—but whether it can hold and stand firm remains to be seen.
35

⚖️ $MARSCOIN: instead of choosing a side, here are two competing arguments.
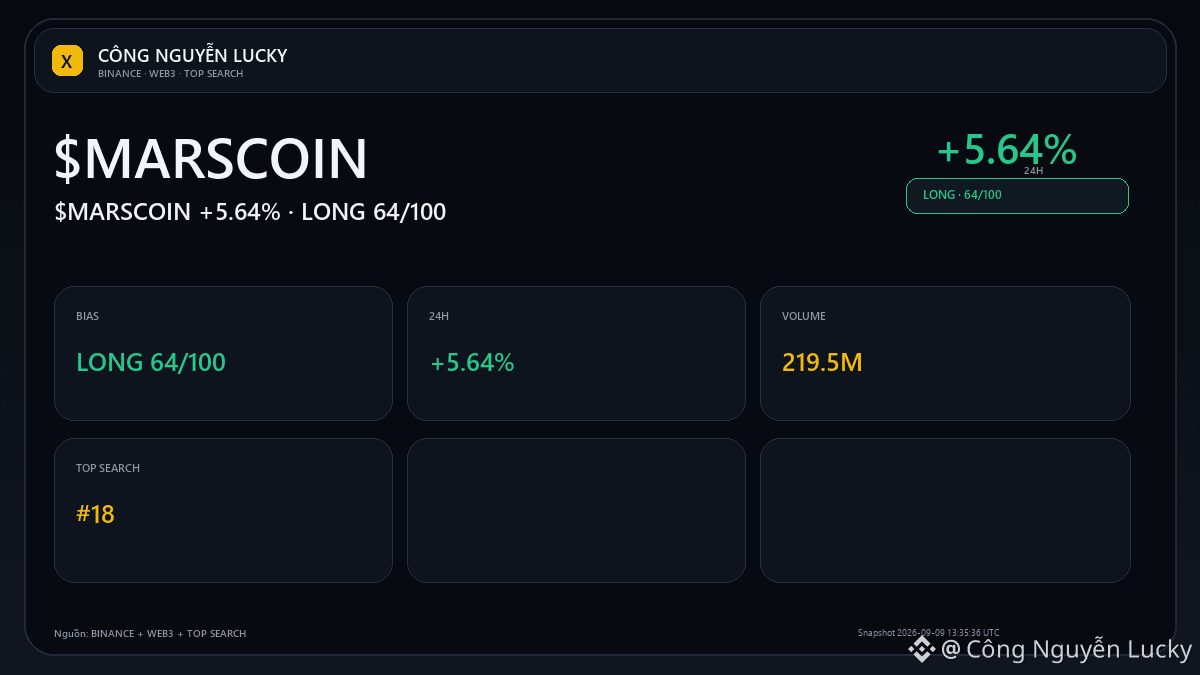
Snapshot: 0.13539 · 24h +5.64% · volume ~219.5M USDT · 3,660,417 transactions.
🟢 Bull/continuation case: Breaking above 0.14948 with expanding volume will make the continuation scenario more convincing.
🔴 Bear/cooling case: Failing to hold the high area and falling back below the midpoint 0.13346 will make the cooling scenario more evident.
🎯 Preferred trend: **LONG · LIGHT · 64/100**.
Main basis: 24h price +5.64%.
Additional confirmation when: it holds above 0.13346 and breaks 0.14948 with volume/capital flows continuing to confirm.
Invalidate/shift the direction if: 0.13346 is lost along with the taker/capital flows weakening the Leader.
💬 What do you think: is $MARSCOIN a continuation—or a move that needs to cool off?
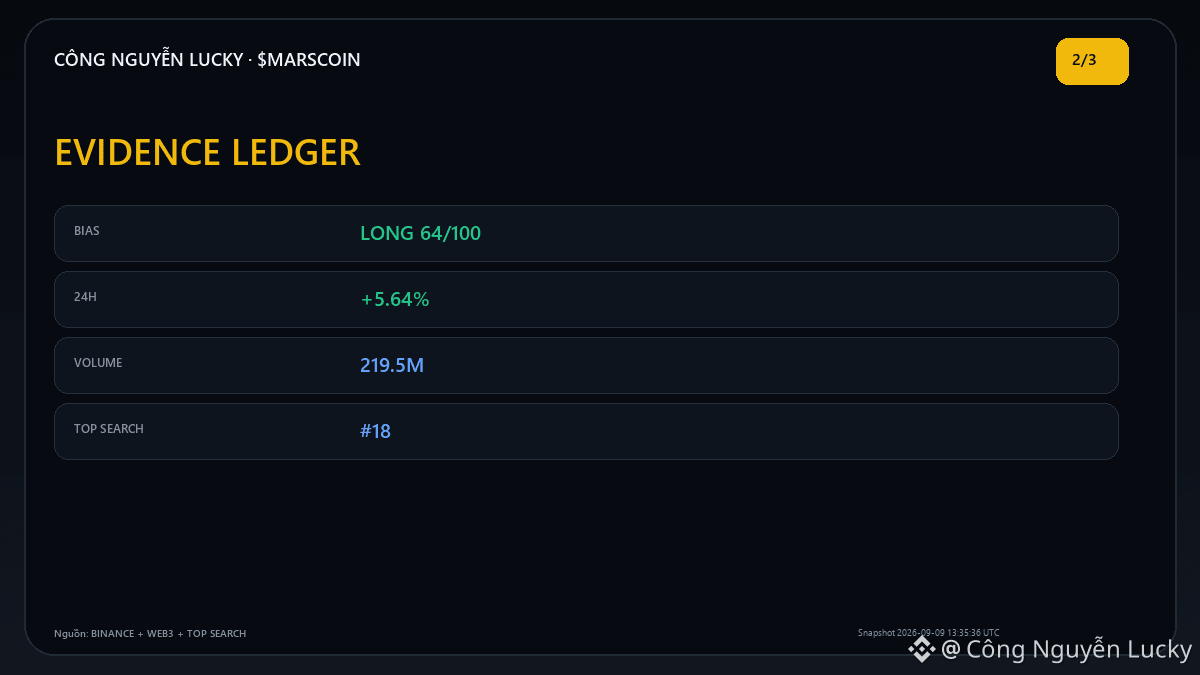
🔎 **Evidence check — LONG 64/100**
• Price 0.13539; 24h +5.64%; volume 219.5M.
• Binance Top Search #18.
🧭 **Key levels to watch:** confirmation: hold above 0.13346 and break 0.14948 with volume/capital flows continuing to confirm · invalidation: lose 0.13346 with taker/capital flows from the Leader weakening
Reference sources: Binance Futures Market + Binance Web3 Trending + Binance Top Search + Binance Social Hype · snapshot 2026-09-09 13:35:36 UTC
⚠️ Market analysis is for reference only, not a commitment to profit. Everyone should do their own research (DYOR), manage risk independently, and take responsibility for trading decisions.
$MARSCOIN
⚖️ $MARSCOIN : instead of choosing a side, here are two competing arguments.
Snapshot: 0.13539 · 24h +5.64% · volume ~219.5M USDT · 3,660,417 transactions.
🟢 Bull/continuation case: Breaking above 0.14948 with expanding volume will make the continuation scenario more convincing.
🔴 Bear/cooling case: Failing to hold the high area and falling back below the midpoint 0.13346 will make the cooling scenario more evident.
🎯 Preferred trend: **LONG · LIGHT · 64/100**.
Main basis: 24h price +5.64%.
Additional confirmation when: it holds above 0.13346 and breaks 0.14948 with volume/capital flows continuing to confirm.
Invalidate/shift the direction if: 0.13346 is lost along with the taker/capital flows weakening the Leader.
💬 What do you think: is $MARSCOIN a continuation—or a move that needs to cool off?
🔎 **Evidence check — LONG 64/100**
• Price 0.13539; 24h +5.64%; volume 219.5M.
• Binance Top Search #18.
🧭 **Key levels to watch:** confirmation: hold above 0.13346 and break 0.14948 with volume/capital flows continuing to confirm · invalidation: lose 0.13346 with taker/capital flows from the Leader weakening
Reference sources: Binance Futures Market + Binance Web3 Trending + Binance Top Search + Binance Social Hype · snapshot 2026-09-09 13:35:36 UTC
⚠️ Market analysis is for reference only, not a commitment to profit. Everyone should do their own research (DYOR), manage risk independently, and take responsibility for trading decisions.
$MARSCOIN
Snapshot: 0.13539 · 24h +5.64% · volume ~219.5M USDT · 3,660,417 transactions.
🟢 Bull/continuation case: Breaking above 0.14948 with expanding volume will make the continuation scenario more convincing.
🔴 Bear/cooling case: Failing to hold the high area and falling back below the midpoint 0.13346 will make the cooling scenario more evident.
🎯 Preferred trend: **LONG · LIGHT · 64/100**.
Main basis: 24h price +5.64%.
Additional confirmation when: it holds above 0.13346 and breaks 0.14948 with volume/capital flows continuing to confirm.
Invalidate/shift the direction if: 0.13346 is lost along with the taker/capital flows weakening the Leader.
💬 What do you think: is $MARSCOIN a continuation—or a move that needs to cool off?
🔎 **Evidence check — LONG 64/100**
• Price 0.13539; 24h +5.64%; volume 219.5M.
• Binance Top Search #18.
🧭 **Key levels to watch:** confirmation: hold above 0.13346 and break 0.14948 with volume/capital flows continuing to confirm · invalidation: lose 0.13346 with taker/capital flows from the Leader weakening
Reference sources: Binance Futures Market + Binance Web3 Trending + Binance Top Search + Binance Social Hype · snapshot 2026-09-09 13:35:36 UTC
⚠️ Market analysis is for reference only, not a commitment to profit. Everyone should do their own research (DYOR), manage risk independently, and take responsibility for trading decisions.
$MARSCOIN

15
📝 Watchlist note — $MARSCOIN: no need for a big conclusion yet, but there is enough data to track closely.
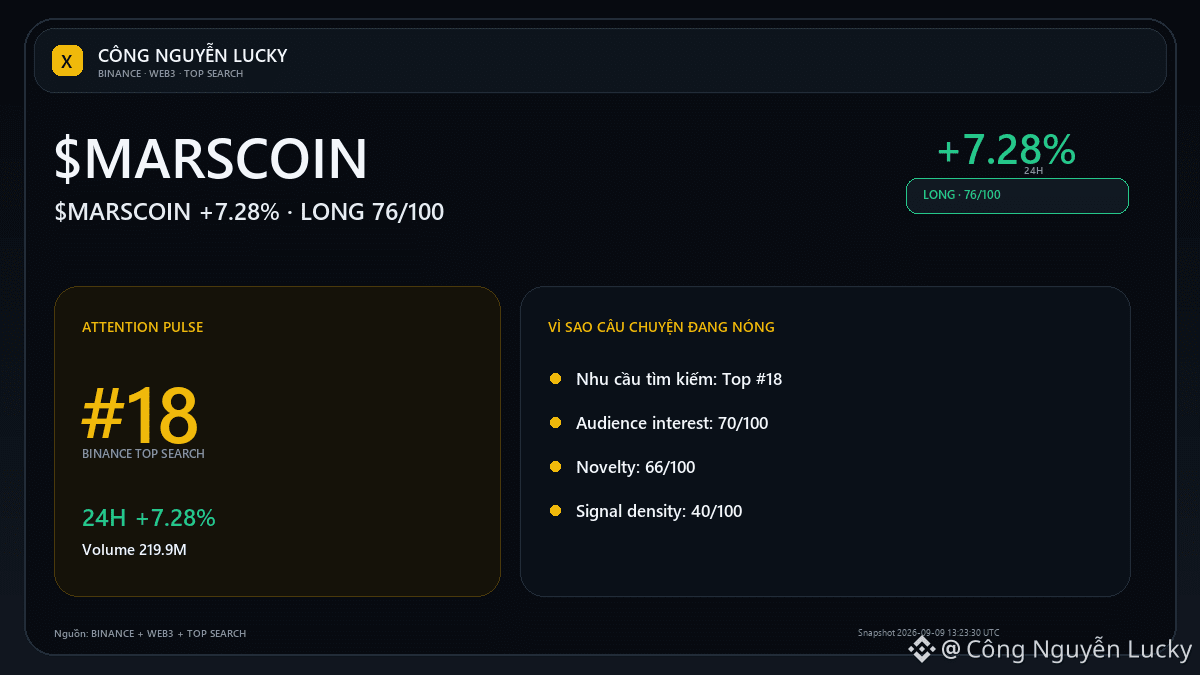
• 0.1377 · 24h +7.28% · volume ~219.9M USDT · 3,663,718 transactions.
Conditions to increase conviction: Break above 0.14948 with expanding volume will make the continuation scenario more credible.
What makes me skip/avoid: Failing to hold the higher zone and dropping back below the midpoint 0.13346 will make the bearish/heat-down scenario clearer.
🎯 Preferred trend: **LONG · MODERATE · 76/100**.
Main basis: price 24h +7.28%; price is 63/100 within the 24h range; stronger than BTC by +5.75 percentage points.
Additional confirmation when: holding above 0.13346 and breaking 0.14948 with volume/flow continuing to confirm.
Invalidate/shift the bias if: losing 0.13346 along with weakening taker/Leader flow.
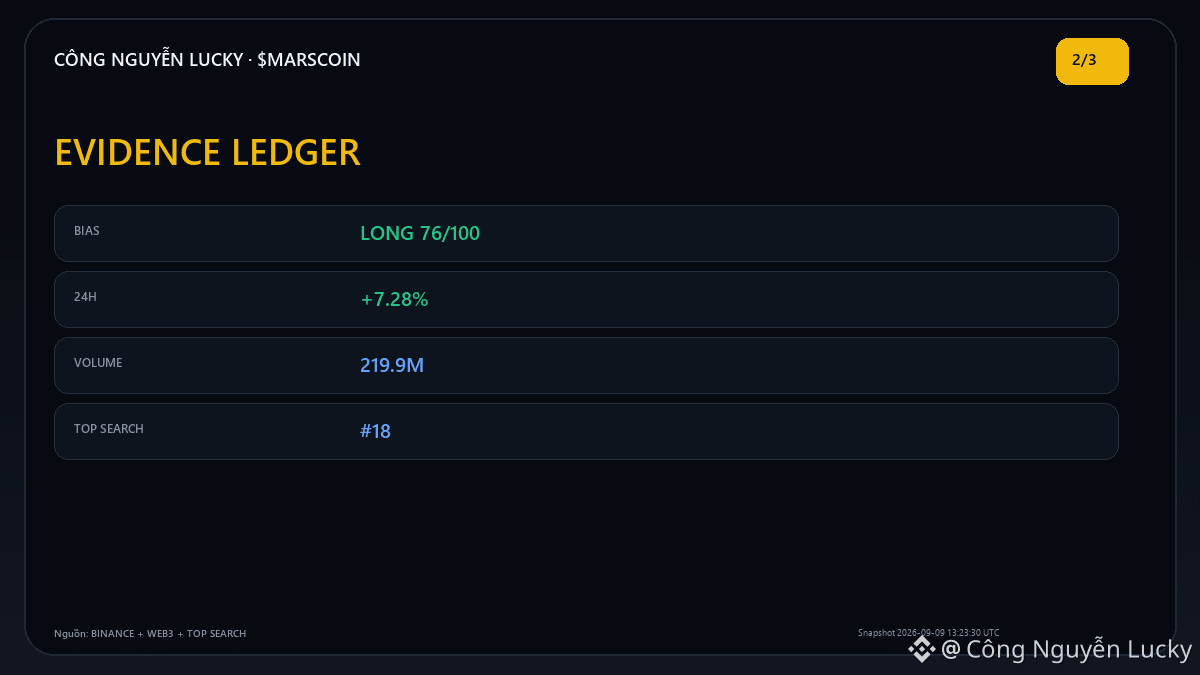
🔎 **Evidence check — LONG 76/100**
• Price 0.1377; 24h +7.28%; volume 219.9M.
• Binance Top Search #18.
🧭 **Key levels to watch:** confirmation: hold above 0.13346 and break 0.14948 with volume/flow continuing to confirm · invalidation: lose 0.13346 with taker/Leader flow weakening
Reference sources: Binance Futures Market + Binance Web3 Trending + Binance Top Search + Binance Social Hype · snapshot 2026-09-09 13:23:30 UTC
⚠️ Market analysis is for reference only, not a promise of profit. Everyone should do their own research (DYOR), manage risk independently, and take full responsibility for their trading decisions.
$MARSCOIN $BTC
📝 Watchlist note — $MARSCOIN : no need for a big conclusion yet, but there is enough data to track closely.
• 0.1377 · 24h +7.28% · volume ~219.9M USDT · 3,663,718 transactions.
Conditions to increase conviction: Break above 0.14948 with expanding volume will make the continuation scenario more credible.
What makes me skip/avoid: Failing to hold the higher zone and dropping back below the midpoint 0.13346 will make the bearish/heat-down scenario clearer.
🎯 Preferred trend: **LONG · MODERATE · 76/100**.
Main basis: price 24h +7.28%; price is 63/100 within the 24h range; stronger than BTC by +5.75 percentage points.
Additional confirmation when: holding above 0.13346 and breaking 0.14948 with volume/flow continuing to confirm.
Invalidate/shift the bias if: losing 0.13346 along with weakening taker/Leader flow.
🔎 **Evidence check — LONG 76/100**
• Price 0.1377; 24h +7.28%; volume 219.9M.
• Binance Top Search #18.
🧭 **Key levels to watch:** confirmation: hold above 0.13346 and break 0.14948 with volume/flow continuing to confirm · invalidation: lose 0.13346 with taker/Leader flow weakening
Reference sources: Binance Futures Market + Binance Web3 Trending + Binance Top Search + Binance Social Hype · snapshot 2026-09-09 13:23:30 UTC
⚠️ Market analysis is for reference only, not a promise of profit. Everyone should do their own research (DYOR), manage risk independently, and take full responsibility for their trading decisions.
$MARSCOIN $BTC
• 0.1377 · 24h +7.28% · volume ~219.9M USDT · 3,663,718 transactions.
Conditions to increase conviction: Break above 0.14948 with expanding volume will make the continuation scenario more credible.
What makes me skip/avoid: Failing to hold the higher zone and dropping back below the midpoint 0.13346 will make the bearish/heat-down scenario clearer.
🎯 Preferred trend: **LONG · MODERATE · 76/100**.
Main basis: price 24h +7.28%; price is 63/100 within the 24h range; stronger than BTC by +5.75 percentage points.
Additional confirmation when: holding above 0.13346 and breaking 0.14948 with volume/flow continuing to confirm.
Invalidate/shift the bias if: losing 0.13346 along with weakening taker/Leader flow.
🔎 **Evidence check — LONG 76/100**
• Price 0.1377; 24h +7.28%; volume 219.9M.
• Binance Top Search #18.
🧭 **Key levels to watch:** confirmation: hold above 0.13346 and break 0.14948 with volume/flow continuing to confirm · invalidation: lose 0.13346 with taker/Leader flow weakening
Reference sources: Binance Futures Market + Binance Web3 Trending + Binance Top Search + Binance Social Hype · snapshot 2026-09-09 13:23:30 UTC
⚠️ Market analysis is for reference only, not a promise of profit. Everyone should do their own research (DYOR), manage risk independently, and take full responsibility for their trading decisions.
$MARSCOIN $BTC

101
·
--
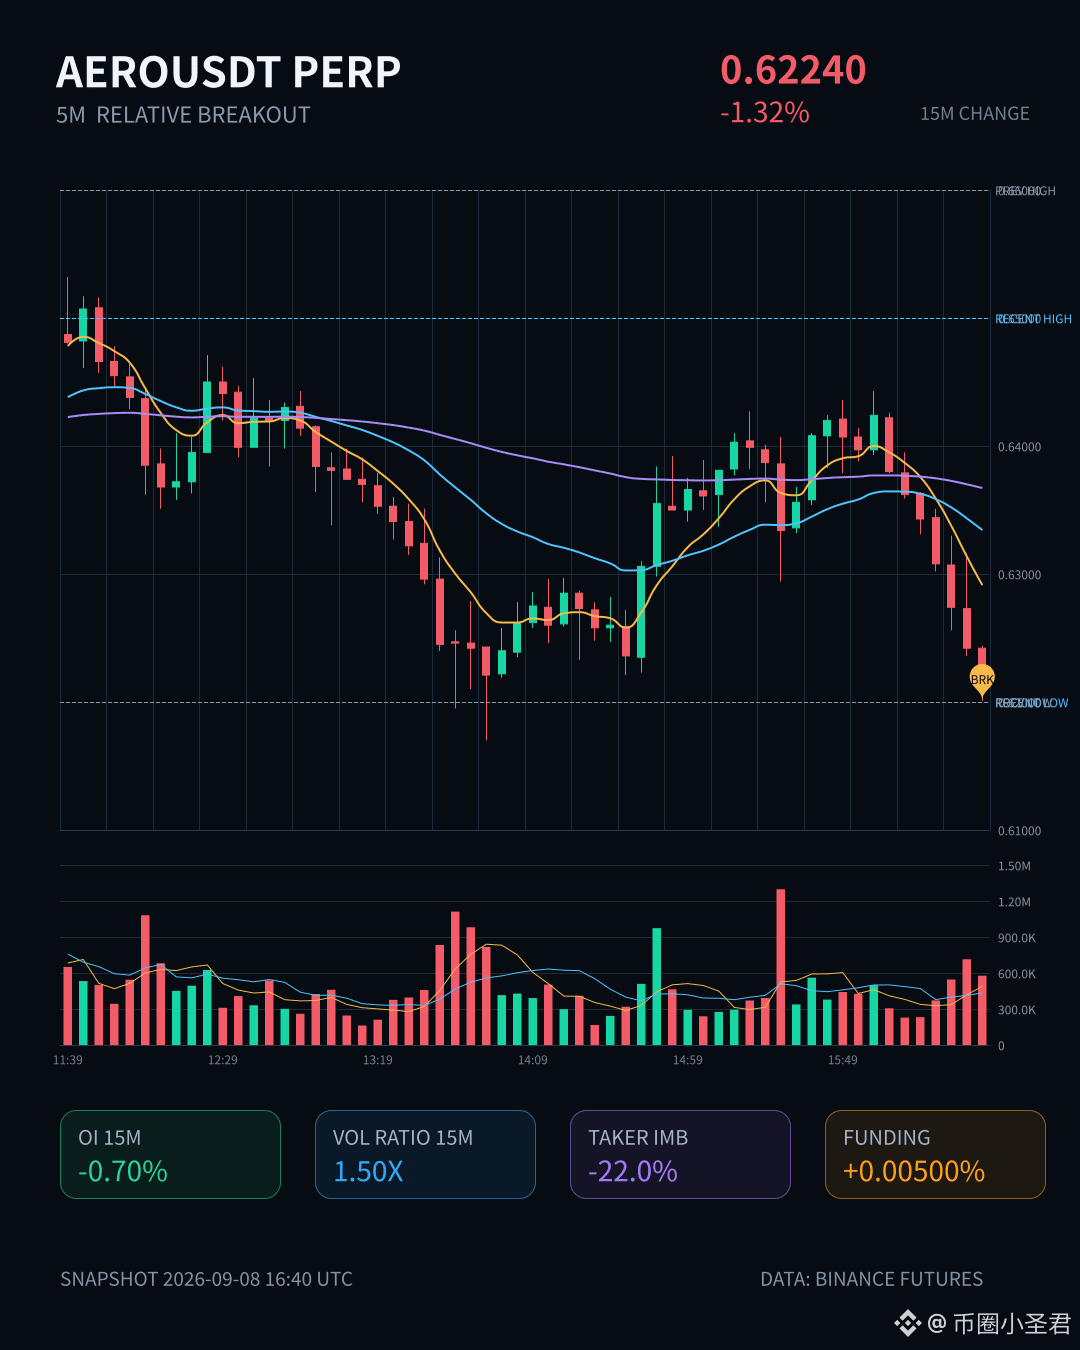
$AERO At dawn, this 15-minute candle looks a bit ugly—it fell 1.32% and directly broke below the lower edge of the recent 20 five-minute K-line range. Trading volume did increase to 1.5x; the volatility Z-value is 1.68, and the passive-to-aggressive selling pressure is quite clear. The buy/sell ratio is 0.64, and the net aggressive trade imbalance is -22%, which suggests the bears are taking action—not just a fake move.
What’s even more worth noting is the positioning structure: open interest on both the 15-minute and 1-hour contract levels is decreasing, with nominal changes of -469K and -560K respectively. This kind of selloff comes with OI contraction, which looks more like longs being stopped out or actively reducing positions, rather than new shorts aggressively entering to smash the price. The abnormal ranking across the whole pool is at #18, and the linkage signals between volume, price, and open interest still feel fairly solid.
24-hour trading volume is close to 100 million USD, and liquidity in this pool is still there. Technically, price has already probed the lower edge of the range; next it’s either a breakdown with acceleration, or a quick “fill back” battle. If position management isn’t handled well, risk control at dawn matters even more than direction.
(The above is my personal market observation log and does not constitute any trading advice. The data comes from publicly available market information. The market involves risk—please make your own judgment.)
$AERO At dawn, this 15-minute candle looks a bit ugly—it fell 1.32% and directly broke below the lower edge of the recent 20 five-minute K-line range. Trading volume did increase to 1.5x; the volatility Z-value is 1.68, and the passive-to-aggressive selling pressure is quite clear. The buy/sell ratio is 0.64, and the net aggressive trade imbalance is -22%, which suggests the bears are taking action—not just a fake move.
What’s even more worth noting is the positioning structure: open interest on both the 15-minute and 1-hour contract levels is decreasing, with nominal changes of -469K and -560K respectively. This kind of selloff comes with OI contraction, which looks more like longs being stopped out or actively reducing positions, rather than new shorts aggressively entering to smash the price. The abnormal ranking across the whole pool is at #18, and the linkage signals between volume, price, and open interest still feel fairly solid.
24-hour trading volume is close to 100 million USD, and liquidity in this pool is still there. Technically, price has already probed the lower edge of the range; next it’s either a breakdown with acceleration, or a quick “fill back” battle. If position management isn’t handled well, risk control at dawn matters even more than direction.
(The above is my personal market observation log and does not constitute any trading advice. The data comes from publicly available market information. The market involves risk—please make your own judgment.)
What’s even more worth noting is the positioning structure: open interest on both the 15-minute and 1-hour contract levels is decreasing, with nominal changes of -469K and -560K respectively. This kind of selloff comes with OI contraction, which looks more like longs being stopped out or actively reducing positions, rather than new shorts aggressively entering to smash the price. The abnormal ranking across the whole pool is at #18, and the linkage signals between volume, price, and open interest still feel fairly solid.
24-hour trading volume is close to 100 million USD, and liquidity in this pool is still there. Technically, price has already probed the lower edge of the range; next it’s either a breakdown with acceleration, or a quick “fill back” battle. If position management isn’t handled well, risk control at dawn matters even more than direction.
(The above is my personal market observation log and does not constitute any trading advice. The data comes from publicly available market information. The market involves risk—please make your own judgment.)
25

·
--
DASH's move this time is kind of interesting.
It dropped 2.23% in just 15 minutes, and the key thing is that OI was still rising during the drop, with 1-hour futures open interest up 1.32%. Price down, positions up — this kind of script is not panic liquidation, but more like newly opened leveraged shorts entering the scene. You can tell from the order book that aggressive sell orders clearly had the upper hand, with the buy-sell ratio only at 0.65. The bears were very active, not just bidding down the price, but directly smashing it lower.
The price has already broken below the range low of the past 20 five-minute candlesticks, and volume has also picked up, reaching 2.27 times the usual level, ranking #18 in the market by notional change. But wait — OI is rising while notional value is shrinking. This combination usually means... the position structure is being adjusted. The new positions may not be entirely clean shorts; someone could be switching positions at a high level, cutting longs and flipping to shorts.
I don't want to chase it before the breakdown is confirmed, but the close pushed through the lower boundary, and this signal feels like the bears are declaring control. Next, the question is whether this decline can keep attracting follow-through volume. If trading volume fails to keep up, we need to watch out for a short squeeze rebound. $DASH
DASH's move this time is kind of interesting.
It dropped 2.23% in just 15 minutes, and the key thing is that OI was still rising during the drop, with 1-hour futures open interest up 1.32%. Price down, positions up — this kind of script is not panic liquidation, but more like newly opened leveraged shorts entering the scene. You can tell from the order book that aggressive sell orders clearly had the upper hand, with the buy-sell ratio only at 0.65. The bears were very active, not just bidding down the price, but directly smashing it lower.
The price has already broken below the range low of the past 20 five-minute candlesticks, and volume has also picked up, reaching 2.27 times the usual level, ranking #18 in the market by notional change. But wait — OI is rising while notional value is shrinking. This combination usually means... the position structure is being adjusted. The new positions may not be entirely clean shorts; someone could be switching positions at a high level, cutting longs and flipping to shorts.
I don't want to chase it before the breakdown is confirmed, but the close pushed through the lower boundary, and this signal feels like the bears are declaring control. Next, the question is whether this decline can keep attracting follow-through volume. If trading volume fails to keep up, we need to watch out for a short squeeze rebound. $DASH
It dropped 2.23% in just 15 minutes, and the key thing is that OI was still rising during the drop, with 1-hour futures open interest up 1.32%. Price down, positions up — this kind of script is not panic liquidation, but more like newly opened leveraged shorts entering the scene. You can tell from the order book that aggressive sell orders clearly had the upper hand, with the buy-sell ratio only at 0.65. The bears were very active, not just bidding down the price, but directly smashing it lower.
The price has already broken below the range low of the past 20 five-minute candlesticks, and volume has also picked up, reaching 2.27 times the usual level, ranking #18 in the market by notional change. But wait — OI is rising while notional value is shrinking. This combination usually means... the position structure is being adjusted. The new positions may not be entirely clean shorts; someone could be switching positions at a high level, cutting longs and flipping to shorts.
I don't want to chase it before the breakdown is confirmed, but the close pushed through the lower boundary, and this signal feels like the bears are declaring control. Next, the question is whether this decline can keep attracting follow-through volume. If trading volume fails to keep up, we need to watch out for a short squeeze rebound. $DASH
2
48
·
--
This move on $GIGGLE is pretty interesting. In just 15 minutes, it dumped 1.68%, trading volume surged to nearly 4x, and price also broke below the lower edge of nearly 20 K-lines. Then look at open interest: the 15-minute contract also shrank by 0.48%, and nominal capital outflow was 280,000 U. This kind of “price drop + position reduction” combo looks more like longs being stopped out and forced to exit, rather than a trend-driven selloff initiated by shorts.
Honestly, the funding rate is still sitting at a relatively high recent percentile, and active trade direction is clearly skewed toward selling; the buy/sell ratio is 0.50, which means there is indeed directional pressure in the order book. But the fact that it can rank #18 in abnormality across the entire pool and #29 in nominal change shows that market attention has really concentrated here.
24-hour volume is over 47 million U, which is not small for this pool. The short-term volatility characteristics are already starting to go extreme — I’m not saying it will reverse immediately, but this low-volume decline + long liquidation structure often looks more like buildup ahead of a turning point than a simple wick dump.
The key is to watch the next hour. If price holds steady and stops making new lows, then this round of long liquidation pressure may have mostly been released.
This move on $GIGGLE is pretty interesting. In just 15 minutes, it dumped 1.68%, trading volume surged to nearly 4x, and price also broke below the lower edge of nearly 20 K-lines. Then look at open interest: the 15-minute contract also shrank by 0.48%, and nominal capital outflow was 280,000 U. This kind of “price drop + position reduction” combo looks more like longs being stopped out and forced to exit, rather than a trend-driven selloff initiated by shorts.
Honestly, the funding rate is still sitting at a relatively high recent percentile, and active trade direction is clearly skewed toward selling; the buy/sell ratio is 0.50, which means there is indeed directional pressure in the order book. But the fact that it can rank #18 in abnormality across the entire pool and #29 in nominal change shows that market attention has really concentrated here.
24-hour volume is over 47 million U, which is not small for this pool. The short-term volatility characteristics are already starting to go extreme — I’m not saying it will reverse immediately, but this low-volume decline + long liquidation structure often looks more like buildup ahead of a turning point than a simple wick dump.
The key is to watch the next hour. If price holds steady and stops making new lows, then this round of long liquidation pressure may have mostly been released.
Honestly, the funding rate is still sitting at a relatively high recent percentile, and active trade direction is clearly skewed toward selling; the buy/sell ratio is 0.50, which means there is indeed directional pressure in the order book. But the fact that it can rank #18 in abnormality across the entire pool and #29 in nominal change shows that market attention has really concentrated here.
24-hour volume is over 47 million U, which is not small for this pool. The short-term volatility characteristics are already starting to go extreme — I’m not saying it will reverse immediately, but this low-volume decline + long liquidation structure often looks more like buildup ahead of a turning point than a simple wick dump.
The key is to watch the next hour. If price holds steady and stops making new lows, then this round of long liquidation pressure may have mostly been released.
266

·
--
Bullish
60-SECOND ALPHA #18 | $EDGE
$EDGE is up around 60% in 24 hours, with massive volume behind the move. When a coin moves this aggressively, the biggest mistake is assuming strength automatically means it has to keep going.
The lesson is simple: After a parabolic move, volatility becomes part of the trade. A 60% rally can attract fresh buyers, but it can also trigger sharp pullbacks and liquidations when traders enter late.
Alpha: The bigger the move, the more important it becomes to manage your entry not chase the candle.
{future}(EDGEUSDT)
60-SECOND ALPHA #18 | $EDGE
$EDGE is up around 60% in 24 hours, with massive volume behind the move. When a coin moves this aggressively, the biggest mistake is assuming strength automatically means it has to keep going.
The lesson is simple: After a parabolic move, volatility becomes part of the trade. A 60% rally can attract fresh buyers, but it can also trigger sharp pullbacks and liquidations when traders enter late.
Alpha: The bigger the move, the more important it becomes to manage your entry not chase the candle.
$EDGE is up around 60% in 24 hours, with massive volume behind the move. When a coin moves this aggressively, the biggest mistake is assuming strength automatically means it has to keep going.
The lesson is simple: After a parabolic move, volatility becomes part of the trade. A 60% rally can attract fresh buyers, but it can also trigger sharp pullbacks and liquidations when traders enter late.
Alpha: The bigger the move, the more important it becomes to manage your entry not chase the candle.
58


·
--
I’m keeping an eye on the mid‑cap crowd. Pons (PONS) jumped +12%, Akedo (AKE) rose +9%, and Arbitrum (ARB) surged +15% today. 🚀
My watchlist also includes some lower‑rank gems. Cash Cat (CASHCAT) climbed +8%, Pump.fun (PUMP) rallied +14%, and Uniswap (UNI) edged up +5%.
Finally, the heavyweight still shines. Chainlink (LINK) posted a solid +7% gain, reinforcing its #18 rank. I’m optimistic about the mix of growth and stability.
$T, $MUBARAK, $AKE
I’m keeping an eye on the mid‑cap crowd. Pons (PONS) jumped +12%, Akedo (AKE) rose +9%, and Arbitrum (ARB) surged +15% today. 🚀
My watchlist also includes some lower‑rank gems. Cash Cat (CASHCAT) climbed +8%, Pump.fun (PUMP) rallied +14%, and Uniswap (UNI) edged up +5%.
Finally, the heavyweight still shines. Chainlink (LINK) posted a solid +7% gain, reinforcing its #18 rank. I’m optimistic about the mix of growth and stability.
$T , $MUBARAK , $AKE
My watchlist also includes some lower‑rank gems. Cash Cat (CASHCAT) climbed +8%, Pump.fun (PUMP) rallied +14%, and Uniswap (UNI) edged up +5%.
Finally, the heavyweight still shines. Chainlink (LINK) posted a solid +7% gain, reinforcing its #18 rank. I’m optimistic about the mix of growth and stability.
$T , $MUBARAK , $AKE
134
·
--
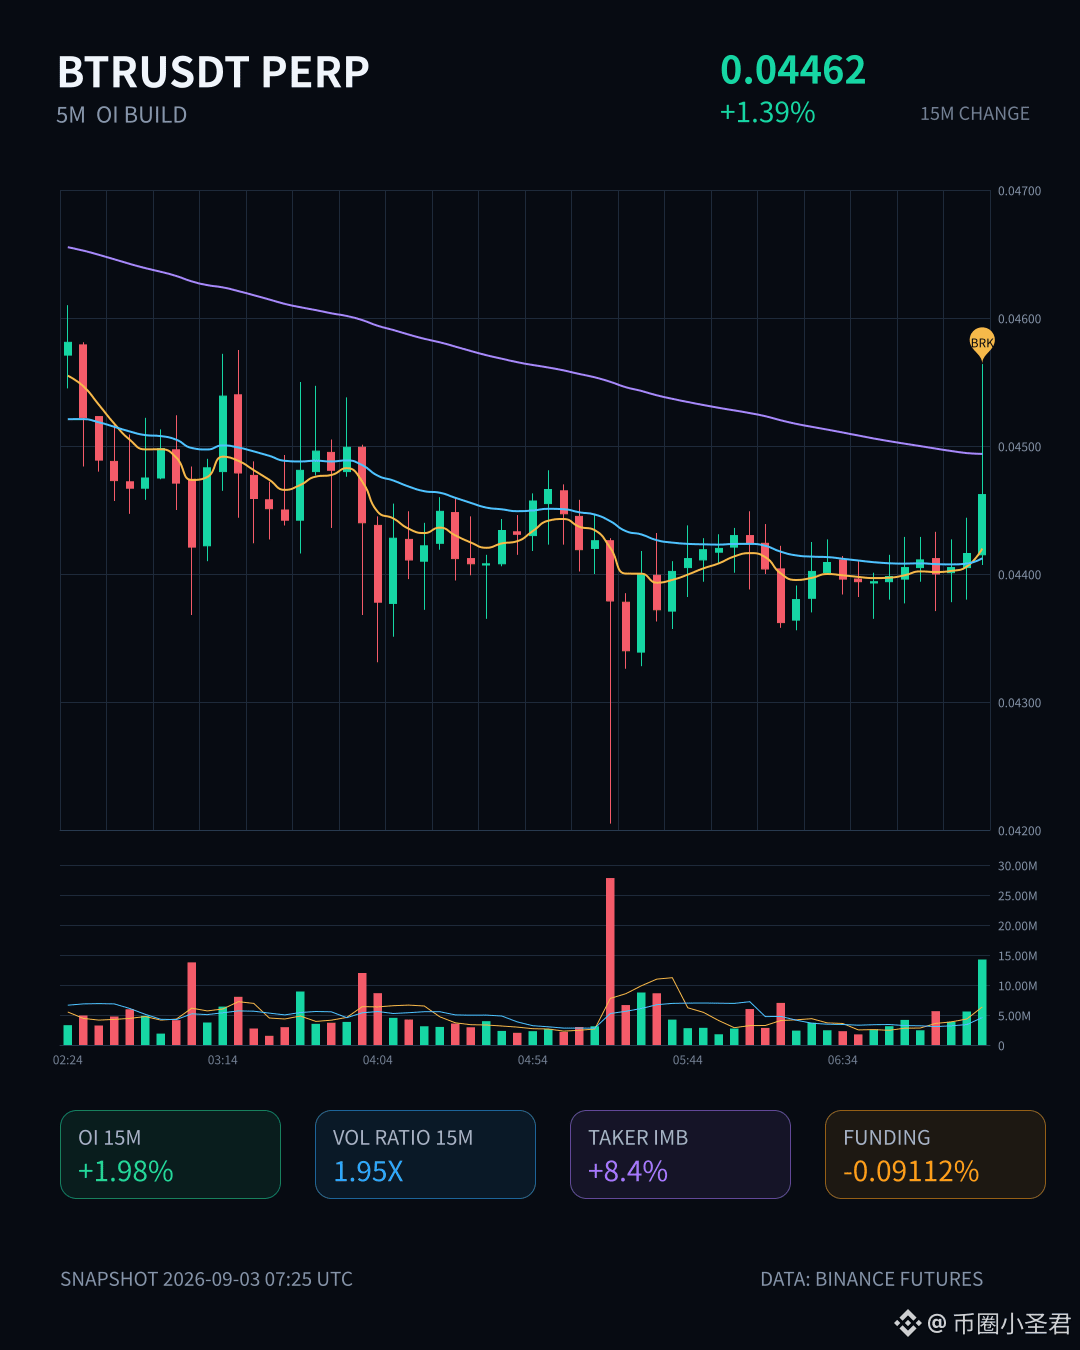
$BTR This move is pretty interesting 👀
On a 15-minute timeframe it jumped up directly by 1.39%, with volume exploding to 1.95 times the norm. Together with OI rising in sync, this is a very typical signal of leveraged longs actively building positions. Within one hour, the contract open interest increased another 4.65%; the notional change surged to 565K. This definitely isn’t just retail making small trades.
What’s most worth paying attention to is the active trade imbalance of 8.4%, with the buy/sell ratio reaching 1.18—buyers are unusually firm. This structure doesn’t look like something that can come out of a passive bag being taken. Also, 24-hour trading value is 328 million USD equivalents—at this depth, there really are people laying out positions, not just some prop-trader cameo.
The notional change across the whole pool ranks at #18, but the market doesn’t seem to have fully reacted yet? 🚀 Let’s see whether there’s a second wave.
$BTR This move is pretty interesting 👀
On a 15-minute timeframe it jumped up directly by 1.39%, with volume exploding to 1.95 times the norm. Together with OI rising in sync, this is a very typical signal of leveraged longs actively building positions. Within one hour, the contract open interest increased another 4.65%; the notional change surged to 565K. This definitely isn’t just retail making small trades.
What’s most worth paying attention to is the active trade imbalance of 8.4%, with the buy/sell ratio reaching 1.18—buyers are unusually firm. This structure doesn’t look like something that can come out of a passive bag being taken. Also, 24-hour trading value is 328 million USD equivalents—at this depth, there really are people laying out positions, not just some prop-trader cameo.
The notional change across the whole pool ranks at #18, but the market doesn’t seem to have fully reacted yet? 🚀 Let’s see whether there’s a second wave.
On a 15-minute timeframe it jumped up directly by 1.39%, with volume exploding to 1.95 times the norm. Together with OI rising in sync, this is a very typical signal of leveraged longs actively building positions. Within one hour, the contract open interest increased another 4.65%; the notional change surged to 565K. This definitely isn’t just retail making small trades.
What’s most worth paying attention to is the active trade imbalance of 8.4%, with the buy/sell ratio reaching 1.18—buyers are unusually firm. This structure doesn’t look like something that can come out of a passive bag being taken. Also, 24-hour trading value is 328 million USD equivalents—at this depth, there really are people laying out positions, not just some prop-trader cameo.
The notional change across the whole pool ranks at #18, but the market doesn’t seem to have fully reacted yet? 🚀 Let’s see whether there’s a second wave.
25
·
--
$ONG 15-minute chart: this leg of the drop feels a bit satisfying—down 2.2%, and the trading volume has surged to 2.3 times the normal level. On the order book, there’s clearly heavier aggressive selling: the sell ratio is far higher than the buy ratio, and it feels like someone has made up their mind to exit.
What’s unexpected is that contract open interest shrank along with it—OI fell 0.12% over the past hour, with the notional value down by roughly 200k U. Together with signs of de-leveraging at the 15-minute level, this pattern looks more like longs are admitting defeat and leaving, not like shorts steadily pressing their entry.
After all, the price has already broken below the boundary of the range formed by the most recent 20 five-minute candles; the volatility Z-score has spiked to 4, and the abnormality rank is #18 in the whole pool. With this kind of volume-accompanied selloff, don’t rush to catch a falling knife for now—wait and see how the stabilization structure develops.
$ONG 15-minute chart: this leg of the drop feels a bit satisfying—down 2.2%, and the trading volume has surged to 2.3 times the normal level. On the order book, there’s clearly heavier aggressive selling: the sell ratio is far higher than the buy ratio, and it feels like someone has made up their mind to exit.
What’s unexpected is that contract open interest shrank along with it—OI fell 0.12% over the past hour, with the notional value down by roughly 200k U. Together with signs of de-leveraging at the 15-minute level, this pattern looks more like longs are admitting defeat and leaving, not like shorts steadily pressing their entry.
After all, the price has already broken below the boundary of the range formed by the most recent 20 five-minute candles; the volatility Z-score has spiked to 4, and the abnormality rank is #18 in the whole pool. With this kind of volume-accompanied selloff, don’t rush to catch a falling knife for now—wait and see how the stabilization structure develops.
What’s unexpected is that contract open interest shrank along with it—OI fell 0.12% over the past hour, with the notional value down by roughly 200k U. Together with signs of de-leveraging at the 15-minute level, this pattern looks more like longs are admitting defeat and leaving, not like shorts steadily pressing their entry.
After all, the price has already broken below the boundary of the range formed by the most recent 20 five-minute candles; the volatility Z-score has spiked to 4, and the abnormality rank is #18 in the whole pool. With this kind of volume-accompanied selloff, don’t rush to catch a falling knife for now—wait and see how the stabilization structure develops.
27
·
--
$USELESS In this wave, the move over 15 minutes rose directly by 1.77%; the trading volume expanded to 2.5 times the usual level, and the price just broke above the upper bound of the recent 20 five-minute candlestick range. The key is that OI also went up along with it: on the 1-hour timeframe, the contracts are up 1.29%. This suggests new leveraged long positions are driving the move—not just a simple short-covering bounce.
The aggressive trade imbalance is down 20.2%, and the buy side is clearly in control. The change in total pool notional ranks at #18, and the depth check confirms there’s no issue. This kind of structure—volume and price rising together, with capital entering in sync—means short-term momentum should still be there. But keep an eye on OI: it has already reached the 83.7% percentile. Chasing higher calls for caution; don’t catch the last baton at the very end of the spike.
$USELESS In this wave, the move over 15 minutes rose directly by 1.77%; the trading volume expanded to 2.5 times the usual level, and the price just broke above the upper bound of the recent 20 five-minute candlestick range. The key is that OI also went up along with it: on the 1-hour timeframe, the contracts are up 1.29%. This suggests new leveraged long positions are driving the move—not just a simple short-covering bounce.
The aggressive trade imbalance is down 20.2%, and the buy side is clearly in control. The change in total pool notional ranks at #18, and the depth check confirms there’s no issue. This kind of structure—volume and price rising together, with capital entering in sync—means short-term momentum should still be there. But keep an eye on OI: it has already reached the 83.7% percentile. Chasing higher calls for caution; don’t catch the last baton at the very end of the spike.
The aggressive trade imbalance is down 20.2%, and the buy side is clearly in control. The change in total pool notional ranks at #18, and the depth check confirms there’s no issue. This kind of structure—volume and price rising together, with capital entering in sync—means short-term momentum should still be there. But keep an eye on OI: it has already reached the 83.7% percentile. Chasing higher calls for caution; don’t catch the last baton at the very end of the spike.
20
Log in to explore more content
Join global crypto users on Binance Square
⚡️ Get latest and useful information about crypto.
💬 Trusted by the world’s largest crypto exchange.
👍 Discover real insights from verified creators.
Email / Phone number
Trending Topics
1
#FedRateWatch
186,897 views
1,306 Discussing
2
#BitcoinSlidesTo$76000
155 views
36 Discussing
3
#BitcoinReboundsTo$79K
44,563 views
341 Discussing
4
#StrategyMarketCapPassesFord
2,003 views
205 Discussing
5
#ClarityActOddsHalveOnPolymarket
1,669 views
156 Discussing
6
#US30YTreasuryYieldTops5.40%
4,300 views
149 Discussing
7
#BessentEndorsesFinalClarityActDraft
18,909 views
436 Discussing
8
#ZamaOpens16ConfidentialMorphoVaults
7,687 views
213 Discussing
9
#USDCOnChainVolumeTops$100Trillion
1,188 views
34 Discussing
10
#BitcoinSpotETFsNetInflow$160M
2,072 views
86 Discussing